Embed Size (px)
Citation preview
Implementing KPIs in smaller Implementing KPIs in smaller organisations (under 200 staff)organisations (under 200 staff)
Presented by David Parmenter
waymark solutions limited
December 2007
Website: www.waymark.co.nz
Email: [email protected]
Blog: www.davidparmenter.com

How many KPIs are there in your How many KPIs are there in your organisation?organisation?
less than 20 between 20-50 between 51-100 over 100

What is the most common timeframe What is the most common timeframe KPIs are reported within?KPIs are reported within?
24/7 daily weekly monthly quarterly
Learning outcomesLearning outcomes
understand that this workshop needs to be reviewed with “Implementing Winning KPIs”
gain an understanding of how to implement winning key performance indicators (KPIs) in a smaller organisation
understand the eight phase implementation process for smaller organisations

The eight phase approachThe eight phase approach
Project week pre 1 2 3 4 5 6 post
1 Selling the change
2 Focus group workshop
3 KPI project team trained and empowered
4 Involving all the employees
5 selecting organisational "winning KPIs"
6 Developing the reporting frameworks at all levels
7 Facilitating the use of winning KPIs
8 Refining KPIs in 12 months to maintain their relevance

Phase :1 Selling the changePhase :1 Selling the change
engage in-house or external PR expert to sell by the emotional drivers!!
send my winning KPIs article to the SMT log into www.bettermanagement.com and set up an
account introduce them to the concept by playing the web cast
on www.bettermanagement.com market the focus group workshop concept emphasis on a bottom-up process

Sell KPI project on emotional driversSell KPI project on emotional drivers there are too many measures that have not changed
anything and cost a lot the CEO and SMT would be more effective in less
time the right KPIs will link daily staff activities to the
strategic objectives reporting on a 24/7, daily, and weekly timeframe
instead of the “too late” monthly update

Phase 2: The focus group workshopPhase 2: The focus group workshop
cross section of 15 to 30 experienced staff the morning session should be attended by
the entire executive team all candidates for the KPI project team to
attend outline the four foundation stones

The workshop agendaThe workshop agenda
understanding of the issues ascertain the CSFs of the organisation (pre-
work already done) refining the CSFs use a relationship mapping process to find
the top 5 to 8 CSFs focus group feedback on viability and
implementation program

Exhibit 4: The four types of performance Exhibit 4: The four types of performance measuresmeasures
80 PIs & RIs
10 KRIs
10 KPIs

The characteristics of KPIs The characteristics of KPIs non financial measures (not Pds, $s etc) measured frequently e.g. daily or 24 by 7 acted upon by CEO and the SMT all staff understand the measure and what corrective
action is required responsibility can be tied down to the individual or team significant impact e.g. it impacts most of the: top eight
CSFs and BSC perspectives has a positive impact e.g. affects all other performance
measures in a positive way

Linking the workface to the Linking the workface to the strategic objectivesstrategic objectives
KPIs
AP AP APSilos Silos Silos
Daily activities
Strategic Objectives out to 5-10 years
Development planout to 3-5 years
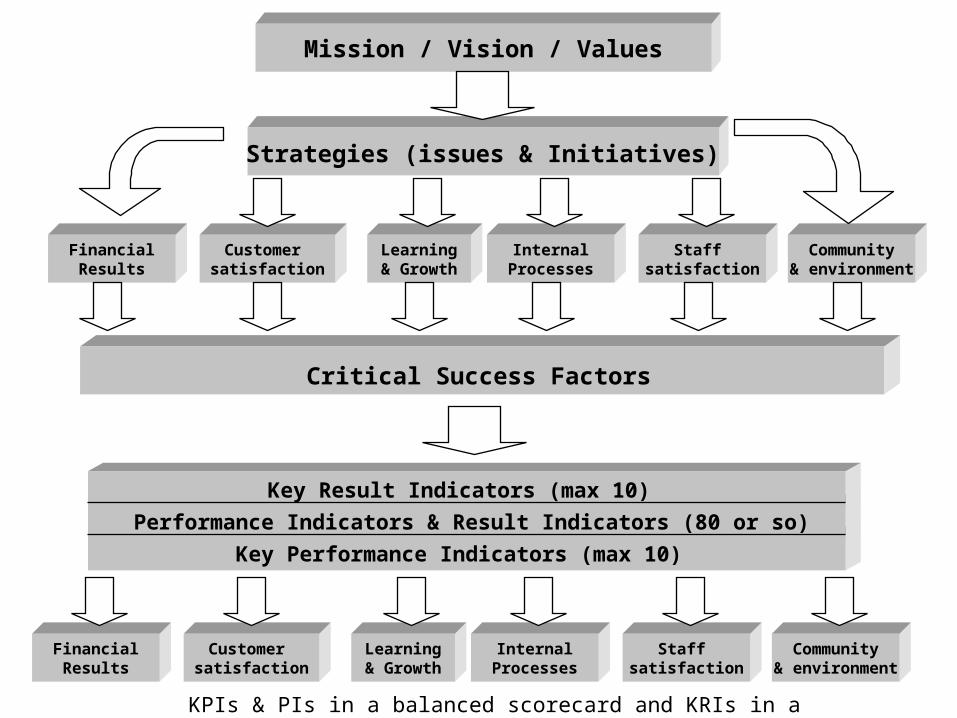
Linkage of strategy to KPIs and BSCLinkage of strategy to KPIs and BSCLinkage of Linkage of strategy to strategy to
measurementmeasurementLearning& Growth
Customer satisfaction
FinancialResults
InternalProcesses
Strategies (issues & Initiatives)
Mission / Vision / Values
Critical Success Factors
Key Result Indicators (max 10)
Performance Indicators & Result Indicators (80 or so)
Key Performance Indicators (max 10)
Staff satisfaction
Community& environment
Learning& Growth
Customer satisfaction
FinancialResults
InternalProcesses
Staff satisfaction
Community& environment
KPIs & PIs in a balanced scorecard and KRIs in a dashboard

Importance of getting the CSFs Importance of getting the CSFs wording rightwording right
wording of the CSFs is critical• retention of staff becomes retention of key staff• increase repeat business becomes increase repeat
business from core customers measures become more specific
• daily sales becomes daily sales made to key customers• planned calls becomes planned calls to key customers• deliveries made on time becomes deliveries to key
customers made on time
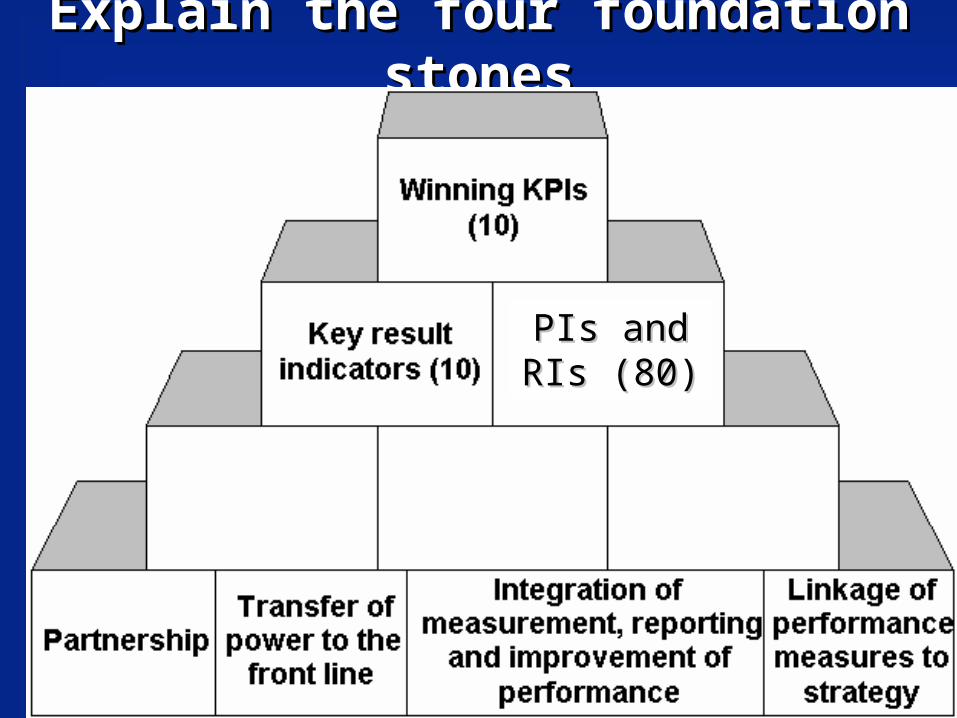
Explain the four foundation stonesExplain the four foundation stones
PIs and RIs PIs and RIs (80)(80)

Short listing the CSFs – by relationship Short listing the CSFs – by relationship mappingmapping
Increased recognition
Increase repeat businessRetention
of key staff
4 OUT 4 OUT

Ask the focus group in the afternoonAsk the focus group in the afternoon
can we complete this project with other competing activities?
will it fit with the existing measurement culture?
what should we learn from other implementations?
what implementation steps should we change?
is the project red, amber, green?

Phase 3: KPI project team trained Phase 3: KPI project team trained and empoweredand empowered
2 to 4 in-house well-trained staff with:• excellent presentation and communication skills
• a flair for innovation
• ability to complete
• knowledge of both the organisation and sector
report directly to the CEO empowered to make decisions

Training the KPI teamTraining the KPI team
a comprehensive understanding of the KPI book how to facilitate workshops which they will be
running how to deliver informative presentations how to design report formats better practice communication techniques using systems to maintain a vibrant project team
home page

KPI team structureKPI team structure
CEO
KPI project team(up to 4 members)SMT
Business unitcoordinators
KPI teamcoordinators
Interestedstakeholders
External facilitators
teams building theirown performance
measures

Empower a "just do it" culture Empower a "just do it" culture and processand process
• it is a sculpture “right first time” is a rare achievement
• use Kaplan and Norton’s book “Translating strategy into action the balanced scorecard” and my KPI book
• belief that we can do it, and do not need to rely on experts to run the project
• there is no need to heavily invest in BSC applications

Phase 4: Involving all the Phase 4: Involving all the employeesemployees
run a survey on a cross section of staff e.g. about 50 staff out of the 200
organise a series of full day workshops SMT sell the change to staff in first session• teams to brainstorm performance measures
(PMs) in all 6 perspectives• 25 PMs for a team (mix of past, current and
forward looking measures) record the measures during the workshop

Selling the change to staffSelling the change to staff
the right mix of performance measures will make work more rewarding and enjoyable
the focus on the right measures would mean their work would be more effective
staff will be making more decisions winning KPIs will enhance profitability and
thus offer greater job security and remuneration

Staff to record the measures in a Staff to record the measures in a database at the workshopdatabase at the workshop
this needs to be set up early on all performance measures identified need to
be collated in a database (edit later) use a common company wide database make database available to teams to help
with selection train staff to use the database

Workshops held to brainstorm the PMs for Workshops held to brainstorm the PMs for the top 5 to 8 CSFsthe top 5 to 8 CSFs
CSF:
_______________
______________
_______________
_______________ _______________
_______________
______________
_______________
_______________
_______________
_______________
______________
_______________
_______________
_______________
______________
______________________________
_______________
_______________
______________
______________________________
_______________ _______________
_______________

Performance indicator database Performance indicator database
Name of Performance measure Calculation of measureType of PM ( KRI,PI, KPI)
Person responsible
System where data is going to be gathered
Refinements for real time information
BSC perspective
Number of initiatives implemented from the quarterly rolling client survey
Number of initiatives implemented out of total arising from survey
Number of referrals from clientsHow many clients came from a referral basis. Fields in the one view the current system should provide
Teams interested in seeing measure
Recommended display
Frequency of measurement
cause and effect relationship
Linkage to critical success factor xx xx xx xx xx xx
Number monthlyMaintain high customer satisfaction
Line graph over 12 months for 4 offices
monthly
monthly

Promote Pareto's 80:20Promote Pareto's 80:20
only worth measuring metrically where it is a KPI which is fundamental to the organisations well-being (e.g. late planes)
when not to dive into metrics• measuring project progress (story)
• measuring time (only lawyers need 6 minute units)
• measuring processing volumes- use a sample week in the month
estimates are fine for many measures

Phase 5: Selecting organisational Phase 5: Selecting organisational "winning KPIs""winning KPIs"
KPI team will have learnt from facilitating the teams avoid consolidation of measures upwards all potential KPIs to pass through the KPI 7 point test
(see slide) once levels 1 and 4 are semi-finalised back-fill levels 2
&3 limit the organisation-wide KPIs to no more than 10

Bottom-up starting point is bestBottom-up starting point is best
Organisationalperformance
measures
Divisional
Department
Team
5 - 10 Orgwide KPIs
Org PIs
Div PIs
Dept PIs
Team PIs
80 PIs spread over
All
Some
Some
Only relevant KPIsLevel 4
Level 2
Level 3
Level 1
1st*
2nd*
3rd*
3rd*
1st* = start process here

Phase 6: developing the reporting Phase 6: developing the reporting framework at all levelsframework at all levels
most KPIs should be reported each day, some 24 by 7 segregate KRIs from PIs, RIs and KPIs the Board should only receive the KRIs e.g. in a
governance “dashboard” reporting through the intranet / Executive Information
System avoid specialised BSC reporting system for 12
months empower KPI team to design report formats

Phase 6: developing the reporting Phase 6: developing the reporting framework at all levelsframework at all levels
review Stephen Few’s work see www.perceptualedge.com/articles/Whitepapers/Common_Pitfalls.pdf
establish meaningful graphs that are easy to understand
regularly review of the graphs by teams, departments and divisions

Phase 7: Facilitating the use of Phase 7: Facilitating the use of winning KPIswinning KPIs
use of KPIs must be wide spread in the organisation
SMT and particularly the CEO needs to act daily on the embryo KPIs
the SMT needs to empower staff to take immediate action
empowerment will take time to be taken on by staff
remember the 10,80,10 rule
Phase 8: Refining KPIs in 12 months to Phase 8: Refining KPIs in 12 months to maintain their relevancemaintain their relevance
review organisation-wide CSFs team workshops to modify their KPIs and
PIs (experience, conditions, new processes etc.)
some KPIs will always be maintained sustain the stakeholder consultation

These books came out in 07These books came out in 07
www.waymark.co.nz to order, see link to www.amazon.com

Thank you for attending Thank you for attending look forward to hearing look forward to hearing about your progressabout your progress

Amazon link on www.davidparmenter.com
John Wiley & Sons have published


