Embed Size (px)
Citation preview


DOCTORAATSPROEFSCHRIFT2012 | Faculteit Bedrijfseconomische Wetenschappen
Implementation, validation and application of anactivity-based transportation model for Flanders
Proefschrift voorgelegd tot het behalen van de graad vanDoctor in de Verkeerskunde, te verdedigen door:
Bruno KOCHAN
Promotor: prof. dr. Geert Wets Copromotoren: prof. dr. ir. Tom Bellemans prof. dr. Davy Janssens
D/2012/2451/9


i
Acknowledgements
I would first like to thank Hasselt University and all my colleagues of the
Transportation Research Institute (IMOB). I greatly benefited from discussing
the issues of this dissertation with the persons I was involved with on a daily
basis.
I’m particularly indebted to my promotor, Prof. dr. Geert Wets, for giving me the
opportunity to start a doctoral study. His belief in my abilities made my feeling
of responsibility towards IMOB and myself only larger. I’m also particularly
indebted to my direct supervisor, Prof. dr. ir. Tom Bellemans, for his unending
stream of feedback, conversations and encouragement. Without him, this
dissertation would have been much shorter. Prof. dr. Davy Janssens also
deserves my gratitude. His positive criticism, kind advice and patience have
truly helped me a lot in times I needed it the most.
I also really like to express my genuine thanks to my parents and my
grandfather for their motivation and encouragement. Without them, my career
path would have been different. Therefore I would like to dedicate this doctoral
thesis to my parents and my paternal grandfather.
As one of the last persons, I would like to thank one person in particular, a
philosopher and an authentic academic, namely dr. Antoon Vloemans. His books
inspired me a lot, in my private life but also for a substantial part in my
professional life, and therefore he deserves a place in this dissertation.
Last but not least, I like to thank my inner voice. He was the true motivator in
all circumstances. There were times during my doctoral study where my
activities felt like those of the Ancient Greek mythological figure Sysyphos who,
as the myth goes, rolled an immense boulder up a hill, only to watch it roll back
down. However, as time went by, with a lot of hard work and dedication, I most
of the time managed to successfully end the tasks I was working on. All those
difficult tasks I had to deal with only made me mentally stronger, and this is
actually what a doctoral study is all about...
Bruno Kochan, 16 March 2012, Belgium

ii

iii
Contents
Chapter 1 Introduction……………………………………………………………………1
1.1 Research motivation .................................................................... 1
1.2 Contributions of the dissertation ................................................... 2
1.3 Organization of this manuscript .................................................... 3
References…………………………………………………………………………………….4
Chapter 2 Quality assessment of location data obtained by the GPS-
enabled PARROTS survey tool…………………………………………………………5
2.1 Introduction ............................................................................... 6
2.1.1 PARROTS: An activity-travel diary survey tool on a GPS-enabled
PDA ....................................................................................... 8
2.2 Data collection ............................................................................ 9
2.3 Household selection .................................................................. 10
2.4 Analyses and results ................................................................. 11
2.4.1 Impact of GPS-enabled PDA technology on user response rates .. 11
2.4.2 GPS-based location and travel data quality ............................... 14
2.4.3 PARROTS usage patterns ....................................................... 17
2.5 Conclusions and discussion ........................................................ 18
References…………………………………………………………………………………..20
Chapter 3 Implementation framework and development trajectory of
the FEATHERS activity-based simulation platform…………………………...23
3.1 Introduction and problem statement ........................................... 24
3.2 Data collection challenges .......................................................... 26
3.2.1 Introduction: Data for modeling dynamic activity-travel
behavior ............................................................................... 26
3.2.2 PDA-enhanced data collection ................................................. 27
3.2.3 Paper-and-Pencil data collection .............................................. 30
3.2.3 Social network data ............................................................... 31
3.2.3 Stated adaptation experiments ............................................... 31
3.2.3 Event-based data collection .................................................... 32
3.3 Static and dynamic activity-based modeling ................................. 33
3.3.1 Static activity-based modeling ................................................ 33
3.3.2 Semi-static activity-based modeling ........................................ 34
3.3.3 Dynamic activity-based modeling ............................................ 35
3.3.4 Full microscopic activity-based model with microscopic route
choice .................................................................................. 36
3.4 FEATHERS’ modular system design ............................................. 37
3.5 Travel demand management strategies within FEATHERS .............. 46
3.6 Conclusions .............................................................................. 48
References…………………………………………………………………………………..49
Chapter 4 Validation of an activity-based traffic demand model for
Flanders………………………………………………………………………………………55
4.1 Introduction ............................................................................. 55

iv
4.2 FEATHERS ................................................................................ 56
4.3 The ALBATROSS system ............................................................ 57
4.4 Incorporating the ALBATROSS model inside FEATHERS .................. 58
4.4.1 Tailoring the ALBATROSS model to the Flemish situation ............ 58
4.4.2 Preparing input data for the ALBATROSS model ........................ 59
4.5 Travel demand and traffic assignment model chain ....................... 62
4.5.1 FEATHERS-based transportation demand ................................. 62
4.5.2 Traffic assignment ................................................................. 62
4.6 Validation of Flemish simulation results ....................................... 64
4.6.1 Validation on the level of model components ............................ 64
4.6.2 Validation of the FEATHERS activity-travel time dimension ......... 66
4.6.3 Validation of the FEATHERS activity-travel space dimension ....... 67
4.6.4 FEATHERS validation in terms of traffic counts and vehicle
kilometers travelled ............................................................... 69
4.7 Conclusion and discussion .......................................................... 72
References…………………………………………………………………………………..73
Chapter 5 An estimation of total vehicle travel reduction in the case of
telecommuting. Detailed analyses using an activity-based modeling
approach……………………………………………………………………………………..75
5.1 Introduction ............................................................................. 76
5.2 The FEATHERS activity-based simulation platform ......................... 77
5.3 Travel demand management strategies that can be addressed
within FEATHERS ....................................................................... 78
5.4 Estimating the impacts of telecommuting on travel: Method of
Mokhtarian ............................................................................... 79
5.4.1 Introduction ......................................................................... 80
5.4.2 Calculation steps ................................................................... 80
5.5 Estimating the impacts of telecommuting on travel: FEATHERS ...... 82
5.5.1 Introduction ......................................................................... 82
5.5.2 Implementation of the telecommuting scenario ......................... 82
5.5.3 Derivation of OD matrices ...................................................... 83
5.5.4 Traffic assignment ................................................................. 83
5.5.5 Calculation steps ................................................................... 84
5.5.6 Additional micro simulation analyses in FEATHERS .................... 85
5.6 Conclusions .............................................................................. 89
References…………………………………………………………………………………..91
Chapter 6 Using activity-based modeling to predict spatial and temporal
electrical vehicle power demand in Flanders……………………………………93
6.1 Introduction ............................................................................. 94
6.2 Activity-based models to predict energy demand by electric
vehicles ................................................................................... 94
6.3 Related work ............................................................................ 95
6.4 Smart grids and transport engineering ........................................ 96
6.5 Electric energy demand evolution – Power demand ....................... 97
6.5.1 Energy demand ..................................................................... 97
6.5.2 Power demand ...................................................................... 97
6.6 The use of activity-based models ................................................ 98

v
6.7 Electric vehicle fleet attributes .................................................... 98
6.7.1 Vehicle categories ................................................................. 98
6.7.2 Available chargers ................................................................. 99
6.7.3 Company cars in Belgium ....................................................... 99
6.7.4 Relation between EV ownership and EV type ........................... 100
6.8 Simulations ............................................................................ 100
6.8.1 Method overview ................................................................. 100
6.8.2 Vehicle characteristics determination ..................................... 102
6.8.3 BEV-feasibility .................................................................... 103
6.8.4 Vehicle sampling ................................................................. 104
6.8.5 Charging parameters ........................................................... 105
6.8.5.1 Assumptions valid for all scenarios concerned ......................... 105
6.8.5.2 Scenario specific assumptions ............................................... 105
6.8.5.3 Aggregation of micro simulation results.................................. 106
6.9 Summary of results for the Flemish region ................................. 106
6.10 Conclusions ............................................................................ 109
6.11 Future research ...................................................................... 109
References…………………………………………………………………………………110
Chapter 7 Final discussion and conclusion……………………………………113
7.1 Conclusions ............................................................................ 113
7.1.1 The PARROTS survey tool ..................................................... 113
7.1.2 The FEATHERS framework .................................................... 113
7.1.3 Validation of an activity-based model for Flanders ................... 114
7.1.4 Traffic demand scenario's ..................................................... 116
7.2 Future research ...................................................................... 117
7.2.1 Redressing equilibrium between traffic demand and traffic
supply ................................................................................ 117
7.2.2 Activity travel planning and rescheduling behavior .................. 118
7.2.3 A synthetic population creator .............................................. 119
7.2.4 A more detailed transport mode choice model ......................... 120
7.2.5 Retailoring the ALBATROSS-based transport model ................. 121
7.2.6 Extending FEATHERS with an urban simulation model .............. 122
Summary…………………………………………………………………………………125
Samenvatting…………………………………………………………………………….129

vi

1
Chapter 1 Introduction
1.1 Research motivation
The rapid economic development in most Western countries has led to a quasi
linear growth in the yearly number of vehicle miles travelled since the 1970’s
(Mobiliteitsplan Vlaanderen, 2003; European Commission, 2001). Personal
mobility, which increased from 17 km a day in 1970 to 35 km in 1998, is now
more or less seen as an acquired right. For passenger transport, the determining
factor is the spectacular growth in car use. The number of cars has tripled in the
last 30 years. Although the level of car ownership is likely to stabilize in most
countries of the European Union, this will not be the case in the candidate
countries, where car ownership is seen as a symbol of freedom. This claim is
also supported by research, based on predictions about world trade, national
income and urbanization, which demonstrate that the demand for mobility in
Europe is expected to rise considerably in the years to come (United Nations,
2001; European Commission, 2001). At the same time, however, traffic is also
an important cause of accidents, environmental pollution and damage to health.
As such, one of the key challenges of the modern policy making consists of
promoting a sustainable transportation system aiming at the prevention or
reduction of the negative effects of the transportation system on health,
livability and environment. Therefore, these goals have also been set in several
recent policy documents (Van Brempt, 2004; Vlaamse Regering, 2006; VMM,
2005; Ministerie van de Vlaamse Gemeenschap, 2003).
All traffic related effects described above such as traffic safety, environmental
and health effects can be assessed by means of specific models. However, all
models depend on traffic data as input. These traffic data can be obtained by
different kind of transport models such as traditional so called 4-step models,
trip-based and tour-based models. However, the last decade showed the
emergence of what is known as activity-based transport models. These types of
models not only predict trips, but also activities in between those trips yielding
an enriched travel data set that allows for the assessment of more detailed
traffic safety, environmental problems and health effects since activity data can
be used as well next to trip data. For example, health effects can be determined
more accurately since person hours exposure, as a result of activities, can now
be calculated by means of activity-based models. Since the beginning of my

2
Ph.D. work, an activity-based model for the Netherlands already existed,
however, a fully-operational activity-based model for Flanders was not available.
Therefore, the purpose of this research was to implement, validate and employ
an activity-based model for Flanders so that this model could be used as a
starting point for other researchers to estimate traffic safety, environmental and
health effects in Flanders.
1.2 Contributions of the dissertation
This research is part of a larger and integrated model for evaluating the safety
and environmental effects of traffic policy measures. Integrated in this context
means that different elements (activity and travel behavior, route choice
behavior, traffic behavior) and effects of the transport system (road safety,
emissions and human health) are modeled in an integrated way, i.e. their
relationships are modeled explicitly. This makes it an interdisciplinary model. As
a result, the model provides a means for better evaluating the trade-offs
between different policy domains, i.e. the net effect of a particular policy
measure can be calculated by demonstrating the impact of the measure on each
of the outcomes (road safety, emissions and human health).
The integrated model is innovative because, this far, no model exists that
encompasses the complex and interrelated set of decisions into one body, i.e.
the impact of traffic policy measures on activity behavior (which activities will be
performed where, when and with whom), transportation behavior (modal
choice), traffic behavior (route choice) and thus ultimately also on road safety
and the environment and on human health. The rich information provided by
activity-based transportation models enables a more accurate and scientifically
sound approach to predict more accurately the expected number of crashes and
the amount of emissions and thus finally also the effects on human health
(cancers, hospital treatments, lost quality of life, etc.).
In order to achieve the goals described above, this dissertation proposes the
development of an innovative integrated GPS-enabled survey tool and an
activity-based simulation framework. Both instruments form the starting point
for the integrated model, described earlier, that aims at evaluating the safety
and environmental effects of traffic policy measures.
With regard to the GPS-enabled survey tool, this kind of electronic tool
technologically allows for a new way of measuring travel behavior that also
provides travel data of higher quality than regular paper-and-pencil type of
diaries since if-then rules can be enforced on the scene (in contrary with desktop

3
computers) during the survey period in order to intercept and rectify logical
respondent errors.
Regarding the activity-based simulation framework, it will be demonstrated that
with this framework it becomes possible to implement, extend and modify
activity-based models such that the time-consuming act of building a complete
model (with accompanying database) from scratch can be circumvented.
Moreover, this framework also allows for rapid employment of activity-based
models for new study areas so that the threshold for these kind of models
shrinks tremendously. In line with the latter advantage, with this general
simulation framework, any activity-based travel survey can be used with a
minimum of processing time in order to (re-)train the transport model inside the
framework. In this dissertation, the activity-based simulation framework,
brought up here, will be employed on our study area, namely Flanders and the
outcomes (effects of policy measures) are used as input to the integrated model
for evaluating the safety and environmental effects of traffic policy measures. As
specified before, these safety and environmental effects are assessed by other
researchers collaborating on the integrated model.
1.3 Organization of this manuscript
The remaining part of this thesis is organized as follows. Chapter 2 first
describes the application of a GPS-enabled PDA tool for surveying travel
respondents in order to collect activity-based data. In chapter 3, the
implementation of a general activity-based simulation platform is described
together with its future trajectory as the development of this platform is
conceived as a non-stop process. In chapter 4, the implementation of an
activity-based model into the activity-based simulation platform is described
followed by a validation of this model for Flanders. Chapter 5 then gives an
example of the implementation and employment of a travel scenario where the
impact of telecommuting on total vehicle travel is estimated and compared with
the outcomes of a more ordinary method. Next, chapter 6 discusses the
outcomes of an electric vehicle scenario where FEATHERS is being used in order
to predict the electrical vehicle power demand for Flanders. Finally, the last
chapter (chapter 7) discusses avenues of future research and subsequently,
further improvements to the activity-based model inside the simulation platform
are suggested.

4
References
European Commission, 2001. White paper: European transport policy for 2010:
time to decide. Luxembourg: Office for Official Publications of the European
Communities, available at: http://europa.eu.int.
Ministerie van de Vlaamse Gemeenschap, 2003. Milieubeleidsplan 2003-2007.
Available at: http://www.mina.be/milieubeleid.html
Mobiliteitsplan Vlaanderen, 2003. Ministerie van de Vlaamse Gemeenschap,
Departement Leefmilieu en Infrastructuur, Mobiliteitscel. Available at:
http://viwc.lin.vlaanderen.be/mobiliteit
United Nations Economic and Social Council, Commission on Sustainable
Development, 2001. Transport – Report of the Secretary-General, Document
E/CN.17/2001/3. Available at: http://www.un.org/esa/sustdev/documents/docs
_csd9.htm
Van Brempt, K., 2004. Beleidsnota Mobiliteit 2004-2009. Available at:
http://www2.vlaanderen.be/ned/sites/regering/beleidsnotas2004/index.htm
Vlaamse Regering, 2006. Vlaanderen in Actie: een sociaal-economische impuls
voor Vlaanderen. Available at: http://www.vlaanderen.be/vlaanderen-in-actie
VMM, 2005. MIRA-T 2005: Milieurapport Vlaanderen – thema’s. Available at:
http://www.milieurapport.be/desktopdefault.aspx?tabid=1004

5
Chapter 2 Quality assessment of location
data obtained by the GPS-enabled PARROTS
survey tool
This chapter describes the development and application of a dedicated tool that
can be used for collecting activity-based data, together with GPS location data.
Small, light PDAs are ideal for conducting in-person surveys at malls,
amusement parks, movie theaters, airports, and other public locations. To this
end, the survey software on PARROTS offers advanced features for conducting
both simple and complex interviews. Conducting surveys by means of PARROTS
however is not a goal in itself. In contrary, activity-based diary data sets,
obtained by this survey tool, are meant for training activity-based models for
Flanders or other study areas.
This chapter is adapted from: Kochan B., Bellemans T., Janssens D., Wets G.,
and Timmermans H.J.P., 2010. Quality assessment of location data obtained by
the GPS-enabled PARROTS survey tool. Journal on Location Based Services, Vol.
4(2), pp. 93-104.
A custom tool, PARROTS (PDA system for Activity Registration and Recording of
Travel Scheduling) was developed to collect activity-travel diary data and Global
Positioning (GPS) based location data during trips. This tool is currently deployed
in a survey that is carried out on 2,500 households in Flanders (Belgium). To be
able to judge the effect of the PARROTS tool on the quality of activity-travel
diaries, a paper-and-pencil diary was designed and deployed as well.
This chapter discusses the impact on travel and location data quality of a GPS-
enabled PDA data collection tool featuring consistency checks. This impact
includes both activity-travel diary data quality and GPS data quality. The quality
of the GPS-based location data collection is assessed in terms of both quantity
and quality of the obtained GPS logs. The location data quality is obtained using
the fraction of GPS logs containing actual location information. Based on the GPS
logger activity, a usage profile was obtained and compared to the location data
resulting from the survey.

6
Based on the analyses presented above, it is concluded that PARROTS provides
both high quality activity-travel diary data and GPS-based location information,
while keeping the burden for the respondents at an acceptable level.
2.1 Introduction
In the context of location based services, an understanding of the whereabouts
and the (planned) activities of potential customers can constitute a commercial
asset. Activity-based models predict on the level of the individual which activity
is conducted where, when, for how long, the transport mode involved, and with
and perhaps for whom the activity is conducted. This detailed data allows for
location based service providers to tailor their services to the needs of consumer
segments or even to the individual customers. However, activity-based analysis
requires detailed information in the form of activity-travel or time use diary data
in order to calibrate the models. Traditionally, travel survey data have been
collected by paper-and-pencil or over the phone.
The need for these detailed data, combined with the respondent burden and the
error proneness of the traditional survey methods, led to the development of
computer assisted diary instruments: MAGIC (Ettema et al., 1994), CHASE
(Doherty and Miller, 2000), iCHASE (Lee et al., 2000), CHASE_GIS (Kreiz and
Doherty, 2002), REACT (Lee and McNally, 2001) and VIRGIL (Janssens at al.,
2004) to name a few.
More recently, considerable attention among academics and professionals alike
has been paid to the use of the Global Positioning System (GPS), first as stand-
alone technology, later embedded in cellular phones and Personal Digital
Assistants (PDA). The potential advantage of such technology has been well
reported in the literature e.g., (Wolf et al., 2001), (Wolf and Oliveira, 2003),
(Asakura and Hato, 2006), (Bullock at al., 2003). However, even in the best
case, GPS technology only allows one to trace the movement (routes) of
travelers. It should be realized that route choice information is not the only and
not necessarily the most important piece of data for activity-based analyses and
models. Activity-based models predict which activity is conducted where, when,
for how long, the transport mode involved, and with and perhaps for whom the
activity is conducted. Many of these choice facets are not captured by GPS
technology. At best, one can try data fusion approaches to extract such
additional data (Nakamya, 2010). Data fusion approaches, also referred to as
statistical matching, entails carrying out a statistical integration of information

7
that has already been collected. For instance, addition of variables can be the
purpose of this match.
To avoid relying solely on such data fusion approaches, an activity-travel diary
survey tool, called PARROTS (PDA system for Activity Registration and Recording
of Travel Scheduling) was developed (Kochan et al., 2006). PARROTS runs on a
PDA and uses GPS to automatically record location data. The PDA was
programmed such that besides automatically registering its location,
respondents can provide information about their activity-travel behavior as well.
An important advantage of PDA-based collection of diaries is the possibility to
guide the input process in order to assist the respondent and to avoid
inconsistencies and other types of anomalies. Given the portability of a PDA
compared to laptops and other electronic data collection tools, PARROTS is well-
suited for in the field activity and travel registration. As PARROTS is designed to
be run on a PDA that has (embedded) GPS, it enables automatic registration of
the spatial dimension, or the location component of the activities, which proves
to be difficult to collect using the traditional paper-and-pencil survey
methodology. In regard with this last remark, it should also be stated that the
PARROTS survey tool can also be used by researchers in order to create a model
capable of deriving activity-based schedules based on GPS tracks, which is an
intriguing research topic. GPS tools are able to gather location and timing
information in a passive way on a continuous basis. Put in another way,
respondents or travelers do not have to fill in this information. Therefore, if it
becomes possible to derive high-level activity-based schedules based on
individual GPS trajectories, then gathering the respondent data, ideally only GPS,
will not be a demanding and burdensome task. In the meanwhile, PARROTS may
constitute an intermediary tool between a traditional activity-based survey and
future GPS-based gathering of respondent information. As PARROTS collects
activity-based survey data together with GPS location data, the results of a
model that determines activity-based data based on GPS tracks can be
compared and validated with the recorded activity-based data from this tool’s
respondents. However, for now, this comparison is left for future research.
In this chapter, some results of the use of PARROTS in a survey of 2,500
households in Flanders (Belgium) are presented. This means that this study is
probably one of the largest using GPS and one of the few that the authors are
aware of that uses GPS-enabled PDA’s. In particular, the data quality of both the
data inputted by the respondents and the location data logged by GPS is
investigated. In addition to investigating data quality, the impact of using PDA-

8
technology on user response rates is examined and compared to response rates
obtained for the paper-and-pencil survey tool. Based on these differences, the
performance of PARROTS as an activity-based survey data collection tool is
assessed.
2.1.1 PARROTS: An activity-travel diary survey tool on a GPS-
enabled PDA
The goal of PARROTS is to implement an activity-travel diary on a PDA with an
integrated GPS logger to automatically capture location information. The
collected data consists of data that will be used to build a dynamic activity-based
model called FEATHERS. Part of the collected data consists of the data regarding
replanning and execution of activities and trips that is manually input by the
respondents. The other part of the data consists of location data that is
automatically collected using GPS. Both planned and executed activities and
trips are registered with the possibility to alter the attributes of the planned
activities. This way, information is collected regarding the decision and
scheduling processes, which results in an evolution from an intention to execute
some activities and trips to an executed activity-travel diary. A similar
philosophy was adopted in (Rindsfüser et al., 2003).
Figure 1 PARROTS main GUI (Left), planning GUI (Middle) and diary GUI (Right). In order to facilitate the distinction between planned and executed activities, planned activities are depicted in red and are wider than executed activities, which are depicted in blue.
If the PDA is switched on, PARROTS starts automatically and the main GUI is
shown (Figure 1, Left). Whenever PARROTS is active, the GPS logger is
operational logging the GPS location strings at a configurable rate. This way, the
respondent can automatically record route and location information using GPS

9
by keeping the PDA switched on. The ‘Vergrendelen’ button provides a screen
lock functionality such that the PDA can safely be stowed during the trip. The
PDA is switched off using the ‘Afsluiten’ button.
The buttons ‘Planning’ (Planning) and ‘Dagboekje’ (Diary) are used to launch the
graphical user interfaces (GUI) to input planned and executed activities and trips
respectively. In the planning GUI, the registered activities and trips are grouped
by day and are listed in the same order they were entered (Figure 1, Middle). In
the diary GUI, the executed activities and trips are displayed in a layout that
resembles an agenda (Figure 1, Right).
Whenever an activity or trip is registered in PARROTS, a number of attributes for
this activity or trip are collected using a customized GUI. The most important
activity and trip attributes PARROTS collects are: activity type, date, start and
end time, location, mode of transportation, travel time and travel party.
Concerning the latter attribute, travel party, remark that during the survey
period 2 household adults are asked to fill in separate surveys and because of
the fact that both adults have to start at the same time, household interactions
are captured to some extent. In the survey, if activities are being described in
the diaries, respondents have to report if the considered activity is executed in
the company of other people. The PARROTS application allows for a detailed
description of those companions.
Also note that although PARROTS collects location data using GPS, the location
of activities is still queried. The match between location information provided by
the respondent and the location logged by GPS can be verified during post
processing in order to validate the data. Replanning information is collected by
allowing the respondent to update all attributes and by querying for the reasons
of the registered changes.
2.2 Data collection
Activity-based models predict which activity is conducted where, when, for how
long, the transport mode involved, and with whom the activity is conducted. In
order to collect the required data for building an activity-based model for
Flanders, a large scale survey is being conducted on 2,500 households.
Because of limited budgetary funds, besides PARROTS, a traditional paper-and-
pencil survey was designed as well. This complementary survey allows of
comparing the PARROTS data quality with a more established and conventional
survey. Therefore, similar to PARROTS, in the paper-and-pencil survey both the

10
planned and executed activities and trips are registered in a separate booklet.
To obtain a link between planned and executed activities, respondents were
asked whether the executed activity was planned and if it was, the sequence
number of the corresponding activity in the planning booklet was asked. In order
to limit the respondent burden, only replanning information on the reason for
differences in duration of planned and executed activities was queried.
The PARROTS and the paper-and-pencil survey tools are both being used on half
of the 2,500 surveyed households. As the survey is currently ongoing, the
results presented in this chapter are based on 816 surveys, 440 using paper-
and-pencil and 376 using PARROTS, collected so far. By comparison of the data
collected with PARROTS with the data collected using the traditional paper-and-
pencil approach, the impact of PARROTS on response rates and data quality can
be investigated.
2.3 Household selection
The target population in this survey was defined as “all people residing in
Flanders, regardless of their place of birth, nationality or any other
characteristic”. However, the population that was reached by the study, i.e. the
study population, does not cover the target population completely. The following
categories of persons are included in the target population, as defined above,
but are not included in the study population: homeless, illegal refugees, people
residing in an institution (elderly people living in old people’s homes, student
homes, orphanages, nursing homes and psychiatric nursing homes), people
residing in a religious community or cloister with more than 8 persons, and
people residing in a prison. Thus, only private households were considered, no
collective households.
To get a representative sample of the population, the survey was set up in such
a way that the shares of three socio-demographic variables (age, gender and
occupational status) were the same, both in the survey and population. This
guaranteed equality of the population composition. However, previous studies
have demonstrated that some socio-economic classes of society, like older-age
and lower-education groups, may be more reluctant towards using computer-
assisted instruments for the data collection and therefore may result in a slightly
biased composition of the population sample.
In order to solve the problem of refusing or non-contactable households, the
decision was made to replace these households by replicate households, a
process which in survey literature is called field substitution. These replicate
11
households are not randomly chosen, they have 4 characteristics in common
with the refusing household: they live in the same municipality as the refusing
household, the age of the reference person falls within the same age category as
that of the initially chosen household (reference household), the gender of the
reference person is the same and the household composition is the same as that
of the reference household. The latter is to ensure that people show the same
mobility characteristics, since a household without children will probably show
different mobility behavior when compared to a household with 3 children.
When a chosen reference household refuses to take part in the survey, or when
it is unable to be contacted in any way (either by phone or via regular mail),
then the household will be replaced by the next one in the list. If the same
applies to this household (i.e. when it also refuses to take part in the survey, or
when it could not be contacted) it will be replaced by the next in the list. This
procedure will go on until the list of 5 households has run out. If none of the
households is prepared to cooperate, no other replacements will be sought. As
soon as a household is willing to participate in the survey, there is no need to
replace the household anymore. The possible remaining households from the list
of 5 will receive the status ‘not activated’ and they are not incorporated in the
remainder of the project.
2.4 Analyses and results
This section reports on the following analyses: the analysis of the impact of
GPS-enabled PDA technology on the user response rates inclusive a comparison
with paper-and-pencil response rates, the impact of PDA technology on the
quality of the collected location data and PARROTS usage patterns.
2.4.1 Impact of GPS-enabled PDA technology on user response
rates
Households selected to participate in the survey were sent a letter stating the
survey purpose and the survey method (paper-and-pencil vs. PDA). Two days
later, they were contacted by telephone in order to ask for their participation. It
is obvious that in order to survey 2500 households, a lot more households had
to be contacted because many potential respondents were not prepared to
participate in the survey. Indeed, 21% of 5537 contacted households so far was
willing to take part in the survey using the paper-and-pencil procedure. In terms
of percentage, this is slightly higher than for the PDA procedure (18% of 3319

12
households), which indicates that a number of people are reluctant to join a
survey using less ubiquitous technology.
Following on these facts about participation shares, it should also be noted that
quite a lot of respondents stopped participating during the survey period.
However, when both survey methods are compared, it is clear that the number
of drop-outs is much lower in the case of the PDA where only 38 % or 232
respondents stopped during the survey period as opposed to the paper-and-
pencil survey where 62 % or 724 respondents dropped out. This substantial
difference could be due to the fact that the burden for filling in the paper-and-
pencil survey is much higher than in the case of the PDA where respondents are
assisted when entering and editing information.
The respondents that indicated during the telephone conversation that their
refusal to participate in the survey was related to being required to use a PDA
were proposed to participate in the paper-and-pencil based survey.
Approximately 4% of the respondents that were contacted to take part in the
survey using a PDA preferred to switch to the non-PDA procedure during the
telephone conversation. It can be assumed that this switch to non-PDA is
induced by an aversion towards PDA technology.
During the PDA delivery, and after having the PARROTS tool explained and
demonstrated to them, 3% of the respondents decided to switch to the non-PDA
procedure. From the experiences during the PDA deliveries, it was learnt that
the majority of these people deem the PDA tool either too complex or too
intrusive.
Since the survey spans seven days, requires keeping track of and logging of
detailed activity-travel information and requires carrying a GPS-enabled PDA
during each trip, the respondent burden is rather high. Some respondents stop
reporting activities and trips before the survey period is over. Hence, the data
returned needs to be investigated for respondent activity in order to determine
respondent attrition.
Figure 2 depicts for the datasets collected with paper-and-pencil and with
PARROTS the average number of reported executed trips per person and per
survey day as a fraction of the number of trips per person for the first survey
day. The average number of reported executed trips for survey day 1 is 2.82
and 3.44 for the paper-and-pencil and the PARROTS survey tools respectively.
From these averages and from Figure 2, it can be concluded that on average
more trips are reported using PARROTS and that the number of reported trips

13
using PARROTS remains more stable throughout the survey. This effect cannot
be due to day of the week effects as the starting days of the surveys were
randomized.
Figure 2 Overview of the average number of executed trips for the datasets collected with paper-and-pencil and with PARROTS, expressed as a fraction of the number of executed trips on the first survey day.
Based on the above observation, in combination with the observation that the
fraction of active respondents decreases by 20% over the survey period
(Bellemans et al., 2008), it can be concluded that despite respondent attrition,
respondents who continue to report trips keep reporting more or less the same
number of trips each day. Hence, it makes sense to run the survey for this
extended period of time as there is a significant number of respondents that
provides usable data throughout the whole period.
Not only registering the activities and trips in the PARROTS tool poses a burden
on the respondents, but also carrying the PDA during all travel is experienced as
a large burden by many respondents. In the remainder of this subsection, the
response rate in terms of using the PDA as a location logger is investigated.
During the trips, PARROTS captures the location data that is provided by the
GPS receiver and stores it in a file. An analysis of the quantity of GPS logs as a
function of the survey day indicates the way respondents deal with the burden of
carrying the PDA around. Figure 3 shows the total number of GPS strings
recorded by all respondents as a function of the survey day. The absolute values
are converted to a fraction of the number of strings of the first survey day
(7,205,550 strings). It is clear that the total number of registered strings
decreases monotonically as the survey progresses. From Figure 3 it can also be
observed that the number of logs per person stays approximately constant for
0
0,2
0,4
0,6
0,8
1
1,2
1 2 3 4 5 6 7
Survey day (Day)
Fra
c. re
po
rted
exec. tr
ips
Paper-and-pencil PARROTS

14
the first four survey days but starts rapidly decreasing starting from the fifth
survey day. Hence, the decrease in logged GPS strings as the survey period
progresses results from a combination of respondents dropping out of the survey
and active respondents logging less.
Figure 3 Evolution of the total number of GPS strings logged by all respondents and the average number of strings logged per person for each survey day, plotted per survey day, and expressed as a fraction of the corresponding value on survey day 1.
An explanation for the reduction of the average number of GPS strings logged
per person, despite the continued registration of activities and trips, can be
sought in the additional burden of being required to carry the PDA tool and to
switch it on during trips. An additional burden is introduced by the battery of the
PDA, which has an autonomy of approximately 6 hours in logging mode.
2.4.2 GPS-based location and travel data quality
This subsection deals with the quality of the travel and location data that is
collected using the PARROTS tool. First, the quality of the GPS-based location
data throughout the survey period is investigated. Next, an analysis of
underreporting of trips as a function of time of day is conducted. This subsection
is concluded with an investigation of the relation between time of day and the
availability of valid location information in the GPS logs captured during reported
trips.
The quality of the location data collected by GPS is influenced by how the
respondents use the PDA tool. The data quality of the registered GPS strings can
be expressed in terms of the availability of location information in the strings.
PARROTS is designed to read and store all information provided by the GPS
receiver. This data is provided over the (internal) serial interface according to
0
0,2
0,4
0,6
0,8
1
1,2
1 2 3 4 5 6 7
Survey day (Day)
Fra
cti
on
Frac. total # logs Frac. # logs /person
15
the industrial NMEA standard (NMEA, 2007). However, whenever the GPS
receiver is unable to determine the location (e.g. due to being indoors), NMEA
strings are provided without any location information. These ‘empty’ strings are
logged by PARROTS as well.
Although the respondents are made aware of the fact that not stowing the PDA
too far away positively impacts the quality of the GPS data, no guidelines are
provided on how the device should be carried during trips in order not to
needlessly burden the respondents even more. Based on the fraction of the
number of NMEA strings containing location information, relative to the total
number of logged NMEA strings, an indication of the quality of the automatically
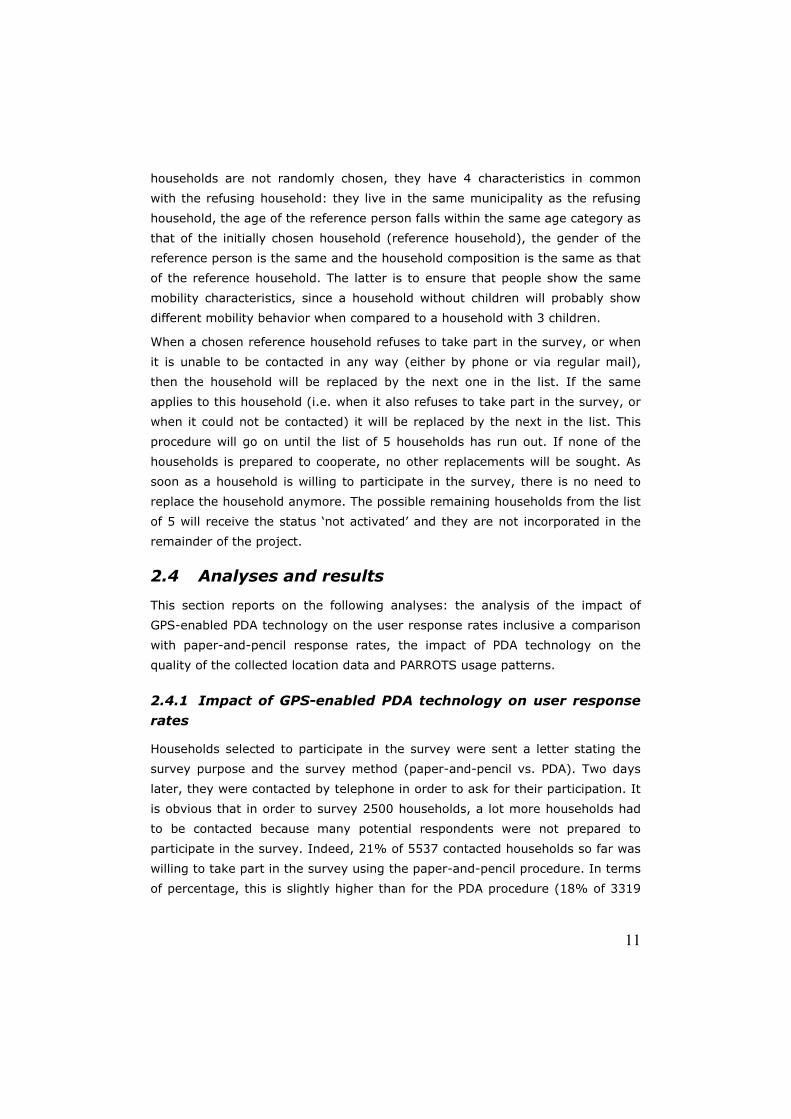
collected GPS data can be obtained. In total 36,940,569 strings were logged in
the current dataset and in 38% of the strings location information was present.
Figure 4 Fraction of the number of NMEA strings per day containing location information relative to the total number of NMEA strings logged per day.
Figure 4 depicts for every survey day the fraction of the number of NMEA strings
containing location information over the total number of NMEA strings logged for
that survey day. The increasing trend of the fraction towards the end of the
survey could be intuitively explained as follows: near the end of the survey a
higher fraction of motivated respondents remains and near the end of the survey
respondents need less time inputting their data in the PDA, resulting in less
NMEA strings being logged indoors during the imputation process.
In order to gain insight in the potential of the PARROTS tool as a means to
collect travel information exclusively based on the GPS logs instead of relying on
the respondents to explicitly input trip information, the fraction of the reported
trip time that no GPS logs were available was investigated. This measure
0
0,1
0,2
0,3
0,4
0,5
1 2 3 4 5 6 7
Survey day (Day)
Fra
cti
on

16
provides a crude estimate of the extent to which location and trip information
would be missing if it were not surveyed but merely captured using GPS. It was
found that in 52% of the reported trip time no GPS logs were present. A major
contribution to this fraction was found to be respondents forgetting to take the
PARROTS tool with them during a trip.
Figure 5 Plot of the number of trips reported as a function of time of day. The trips are aggregated in 15 minute bins based on the start times. Fraction of the reported trip time that no GPS logs were available as a function of time of day.
Figure 5 shows the evolution of the fraction of the reported trip time that no GPS
logs were available as a function of time of day. It can be observed that in the
late evening and during the early morning this fraction increases dramatically,
indicating poor performance of the GPS logs as a means to detect trips at night.
It needs to be noted however that as can be seen from the solid line in Figure 5,
the number of trips reported during these times is very low and sometimes even
equal to zero. Closer examination of the data unveiled that in the majority of the
trips reported between 12 am and 5 am no GPS logs were available during the
whole trip. During the day time, an offset between the reported trip start and
end times constitutes another contribution to the fraction of above. Further
investigation of the relative contributions of both phenomena to the fraction of
reported trip time without GPS logs requires a reliable trip detection algorithm
and is subject to further research.
As a final means to assess the location logging performance of the PARROTS tool
during trips the average fraction of the number of GPS strings that contain valid
location information and that were logged during reported trips over the total
number of GPS logged during the trips was computed. It was found that 70% of
the logs during reported trips contained valid location information. Compared
0
20
40
60
80
100
120
0 1 2 3 4 5 6 7 8 9 10 11 12 13 14 15 16 17 18 19 20 21 22 23
Time of day (h)
% T
rip
tim
e
0
20
40
60
80
100
120
140
160
180
200
# t
rip
s r
ep
ort
ed
Trip time without GPS logs Trips reported

17
with the overall average fraction of 38% this indicates that people indeed tend
to log their trips using PARROTS, yielding valid location information.
2.4.3 PARROTS usage patterns
This subsection analyses the PARROTS usage patterns based on the detailed
logs generated by PARROTS.
As PARROTS is a portable tool and as it provides replanning abilities, PARROTS
can be used for in the field imputation. By investigating the time stamps
recorded for all data saved in PARROTS by all respondents, the usage pattern of
PARROTS can be determined. In Figure 6 the total number of records stored in
PARROTS by all respondents is plotted as a function of time of day (as opposed
to the number of trips that was reported in Figure 5). The average number of
records inputted during a 15 minute interval in Figure 6 is 420. It can be
observed that during the night (1h – 6h), activity is very low and the activity
increases in the morning to a level near the average activity level. There is a
small dip in the activity in the afternoon (14h – 15h) and a clear activity peak
during the evening (18h – 23h). The activity peak during the evening can be
explained by two phenomena; first, the respondents were explicitly asked to
review their planning for the next day in the evening and second, part of the
respondents will not register their activities immediately but register them in the
evening as they are revising their planning for the next day. However, given the
sustained level of activity on the PDA throughout the day, it can be concluded
that a significant number of respondents uses PARROTS to register activities and
trips in the field.
Figure 6 also shows the total number of NMEA strings that was recorded as a
function of time of day. It can be observed that conform Figure 4, the majority
of registered NMEA strings does not contain location info. The fraction of the
number of NMEA strings with location information, compared to the total number
of NMEA strings varies with time of day. This can be interpreted as follows.
Although very little activities are registered, many NMEA strings are logged
during the night. This can be attributed to respondents keeping the PDA indoors
(no reliable GPS signal) and switched on during charging at night. During the
day, the fraction of NMEA strings containing location information increases, since
more people are recording their trips during the day. During the peak of the
imputation activity in the evening the fraction decreases again, which is partially
caused by respondents imputing their activity-travel data while being indoors.

18
Figure 6 Plot of the number of records inputted in PARROTS by all respondents and as a function of time. The records are aggregated in 15 minute bins. Evolution of the number of NMEA strings (with and without location information) logged by all respondents and as a function of time of day.
2.5 Conclusions and discussion
In this chapter, some results of one of the largest activity-travel surveys using
GPS-enabled personal digital assistants (PDA) were presented. The data were
collected in the context of the development of the FEATHERS model, a dynamic
activity-based model of transport demand for Flanders. A custom GPS-enabled
PDA-based activity-travel survey tool, PARROTS, was developed and the quality
of the obtained trip and location data was investigated.
The PARROTS response rates for a large survey in Flanders were investigated
and compared with the response rates using the paper-and-pencil tool in order
to check whether a negative attitude towards the use of PDA technology exists
or a higher burden is experienced in using the tool. It was found that the
response rate for PARROTS was only slightly lower than for the traditional
approach during the recruitment process. However, during the survey period
fewer drop-outs were registered in case of the PDA survey, indicating that the
burden for filling in this kind of survey is lower in comparison with the paper-
and-pencil approach.
During the survey, the reported number of executed trips was more stable
throughout the survey and on average more trips per person were reported for
surveys using PARROTS.
The analysis of the data quality of the GPS logs in terms of the number of logged
NMEA strings showed an attrition of the total number of NMEA strings logged as
survey days pass. This is caused by respondents dropping out of the survey on
0
100000
200000
300000
400000
500000
600000
0 1 2 3 4 5 6 7 8 9 10 11 12 13 14 15 16 17 18 19 20 21 22 23
Time of day (h)
# N
ME
A s
trin
gs
0
200
400
600
800
1000
1200
# r
ec
ord
s in
pu
tte
d
No location info Location info Respondent activity

19
the one hand and by a decrease of the number of logged NMEA strings per
person starting from the fifth survey day on the other hand.
The analysis of the data quality of the GPS logs in terms of the fraction of NMEA
strings containing location information versus the total number of logged NMEA
strings showed that the data quality increases as more survey days pass. The
evolution of this fraction as a function of time of day was correlated to the usage
pattern of the PARROTS tool.
It was found that during slightly over half the total reported trip time no GPS
logs were available. This phenomenon can be attributed to failure of the
respondents to use the PARROTS tool, but also partially by errors in reporting
trip start and end times.
Analysis of the PARROTS activity patterns revealed the use of PARROTS as an in
the field activity and trip registration tool, although this modus operandi was on
a voluntary basis.
Considering survey technology, important advantages of PARROTS over paper-
and-pencil are the availability of detailed replanning and location (GPS)
information, the checks on the data leading to higher data quality and the
immediate electronic availability of the data.
If the results of this study are replicated in future similar research, these
findings illustrate the potential advantage of using instruments such as
PARROTS in order to obtain location and trip information during surveys.

20
References
Asakura, Y., and Hato, E., 2006. Tracking individual travel behaviour using
mobile phones: recent technological development. Paper presented at the 11th
International Conference on Travel Behavior Research, Kyoto.
Bellemans, T., Kochan, B., Janssens, D., Wets, G., and Timmermans, H.J.P.,
2008. In the field evaluation of the impact of a GPS-enabled Personal Digital
Assistant on Activity-Travel diary data quality. CD-ROM. Proceedings of the 87th
Annual Meeting of the Transportation Research Board, Washington D.C., U.S.A.
Bullock, P.J., Stopher, P.R., and Horst, F.N.F., 2003. Conducting a GPS survey
with time-use diary. CD-ROM. Proceedings of the 82nd Annual Meeting of the
Transportation Research Board, Washington D.C., U.S.A.
Doherty, S.T., and Miller, E.J., 2000. A computerized household activity
scheduling survey. Transportation, Vol. 27, pp. 75-97.
Ettema, D.F., Borgers, A.W.J., and Timmermans, H.J.P., 1994. Using interactive
computer experiments for identifying activity scheduling heuristics. Proceedings
of the 7th International Conference on Travel Behaviour, Santiago, Chile.
Janssens, D., Wets, G., De Beuckeleer, E., and Vanhoof, K., 2004. Collecting
activity-travel diary data by means of a new computer-assisted data collection
tool. Proceedings of the European Concurrent Engineering Conference (ECEC),
Hasselt, Belgium, pp. 19-21.
Kochan, B., Bellemans, T., Janssens, D., and Wets, G., 2006. Dynamic activity-
travel diary data collection using a GPS-enabled personal digital assistant.
Proceedings of the Innovations in Travel Modeling Conference, Austin, Texas,
U.S.A.
Kreiz, M., and Doherty, S., 2002. Spatial behavioral data: collection and use in
activity scheduling models. Transportation Research Record, Vol. 1804, pp. 126-
133.
Lee, M.S., Doherty, S.T., Sabetiashraf, R., and McNally, M.G., 2000. iCHASE :
An internet computerized household activity scheduling elicitor survey. CD-ROM.
Proceedings of the 79th Annual Meeting of the Transportation Research Board,
Washington D.C., U.S.A.
Lee, M., and McNally, M.G., 2001. Experiments with a computerized self-
administrative activity survey. Transportation Research Record, Vol. 1748, pp.
125-131.
Nakamya, J., 2010. Creating synthetic data sets for micro simulation models.
Ph.D. Dissertation, Hasselt University.

21
The National Marine Electronics Association (NMEA) homepage. National Marine
Electronics Association, Maryland, USA. www.nmea.org . Accessed July 27, 2007.
Rindsfüser, G., Mühlhans, H., Doherty, S.T., and Beckmann, K.J., 2003. Tracing
the planning and execution of activities and their attributes: design and
application of a hand-held scheduling process survey. Proceedings of the 10th
International Conference on Travel Behavior Research, Lucerne, Switzerland.
Wolf, J.L., Guensler, R., and Bachman, W.H., 2001. Elimination of the travel
diary: an experiment to derive trip purpose from GPS travel data. Transportation
Research Record, Vol. 1768, pp. 125-134.
Wolf, J., and Oliveira, M.G.S., 2003. Impact of trip underreporting on vmt and
travel time estimates: Preliminary findings from California statewide household
travel survey GPS study. CD-ROM. Proceedings of the 82nd Annual Meeting of
the Transportation Research Board, Washington D.C., U.S.A.

22

23
Chapter 3 Implementation framework and
development trajectory of the FEATHERS
activity-based simulation platform
The aim of this chapter is to introduce the FEATHERS activity-based simulation
platform. In general, with its modular structure, FEATHERS is meant to
accommodate different activity-based models so that this framework can be
used as a research instrument for transportation researchers. Basically
FEATHERS provides a toolbox to implement large-scale activity-based
transportation simulations. Currently FEATHERS offers a means for demand
modeling as wel as methods to analyze the output generated by the modules.
This chapter is adapted from: Bellemans T., Kochan B., Janssens D., Wets G.,
Arentze T.A., and Timmermans H.J.P., 2010. Implementation framework and
development trajectory of the FEATHERS activity-based simulation platform.
Transportation Research Record, Vol. 2175, pp. 111-119.
In order to facilitate the development of dynamic activity-based models for
transport demand, the FEATHERS framework was developed. This framework
suggests a four stage development trajectory for a smooth transition from the
four-step models towards static activity based models in the short term and
dynamic activity based models in the longer term. The development stages
discussed in this dissertation range from an initial static activity-based model
without traffic assignment to ultimately a dynamic activity-based model
incorporating rescheduling, learning effects and traffic routing.
To illustrate the FEATHERS framework, work that has been done on the
development of both static and dynamic activity-based models for Flanders
(Belgium) and the Netherlands is discussed. First, the data collection is
presented. Next, the four stage activity-based model development trajectory is
discussed in detail.
The presentation of the modular FEATHERS framework discusses the
functionalities of the modules and how they accommodate the requirements
imposed on the framework by each of the four stages. This chapter then
concludes with a brief overview of the travel demand management strategies
that can be addressed within the FEATHERS framework.

24
3.1 Introduction and problem statement
Over the last decade, several micro-simulation models of activity-travel demand
(e.g. Cemdap (Bhat et al., 2004), Famos (Pendyala et al., 2005) and
ALBATROSS (Arentze and Timmermans, 2000, 2005a)) have become operational.
It led to an increased concern to move the currently operational, and newly
developed activity-based models, into practice. These activity-based models
have the advantage that several interdependencies between choices making up
an activity travel patterns, allowing the estimation of policy effects, are
incorporated in the model. Especially in Europe, advanced tour-based models
also introduced already some of these interdependencies and hence operational
applications of models that involve micro simulation of activity-travel patterns
have remained limited. While several practical reasons for this slow
dissemination can be thought of (see Davidson et al., 2007), one of the main
challenges faced by the travel demand forecasting industry is the ability to
rapidly deploy several new theoretical advances in a time and cost efficient
manner. While small laboratory experiments are needed for exploring these
theoretical advances from a scientific point of view, it is of utmost importance to
rely upon a sound basic platform where several of these advancements can
serve as add-ons, if one is concerned about the final operationalization of the
developed tools. A nice example of such a platform is the open source MATSIM-T
project (Multi-Agent Transport Simulation Toolkit) where some basic
functionality of a multi-agent micro-simulation for transport planning has been
implemented (Balmer et al., 2006), featuring implementations of dynamic traffic
network assignments.
Taking the above into account, the idea was conceived in Flanders (Belgium) to
develop a modular activity-based model of transport demand, where the
emphasis is on the one hand on methodologically innovative (dynamic) activity-
travel demand generation and on the other hand on the practical use of the
system by practitioners and end users. The modularity of the software is assured
by design in using the object-oriented paradigm, allowing for a more flexible
application programming structure. Similar initiatives, like for instance the
Common Modeling Framework (CMF) (Davidson et al., 2007) have recently been
developed for trip-based and complex tour-based models, highlighting the
potential relevance of such a modular system.
A four-stage development trajectory has been postulated in the context of
FEATHERS: stage 1 is the development of a static activity-based model; stage 2
is the development of a semi-static model accounting for evolutionary and non-

25
stationary behavior (for instance different time periods during the day, different
days, etc.); stage 3 is the development of a fully dynamic activity-based model
accounting for short-term adaptation behavior and learning and stage 4 is the
development of a full dynamic agent-based micro-simulation framework
involving traffic and route assignment on a microscopic level. This development
trajectory is highly innovative due to the fact that most micro-simulation models
of activity-travel demand are only situated in stage 1. Indeed, in terms of short
term dynamics in activity-travel patterns and travel execution (stage 3 and 4),
activity-based models at their current state of development have little to offer.
Apart from the MATSIM-T framework, the aggregate impact of individual-level
route choice decisions on activity generation and rescheduling behavior is not
included in activity-based models. Issues such as uncertainty, learning and non-
stationary environments are also not considered. Of course, there is a wide
variety of literature available about traffic assignment, route and departure
choice models, but at their current state of development it is fair to say that the
behavioral contents of these models from an activity-based perspective are still
relatively weak and that comprehensive dynamic models are still lacking.
The multi-stage process outlined above is crucial in understanding and
accounting for end-user (Flemish government, environmental agencies, public
transport providers) concerns, where currently a traditional four-step modeling
approach is used in Flanders. Moving directly towards a full agent-based micro
simulation framework is not appealing from an end-user point of view. Therefore
the multi-stage development trajectory bears resemblance with the waterfall
model (Royce, 1970), which is a sequential model specifically designed for
software development in which development is seen as flowing steadily
downwards through the phases of requirements analysis, design,
implementation, testing, integration, and maintenance. The research described
in this chapter has been given the acronym FEATHERS1 and the application area
is in line with other existing activity-based models but is extended towards
environmental, health and in the medium term also traffic safety applications.
In order to succeed, one obviously needs considerable amounts of data. The
remainder of this chapter therefore first discusses an extensive hybrid, multi-
method data collection approach which is necessary for the operationalization of
the model. The discussion is mainly about data requirements in terms of travel
1 The development of the Feathers (Forecasting Evolutionary Activity-Travel of Households and their Environmental RepercussionS) framework was funded by the Flemish government.

26
demand; supply data is available within the existing four-step models and can
be derived from a number of alternative data sources. Section 3 discusses the
methodological challenges and techniques related to the multi-stage
development trajectory. The modular framework that has been implemented to
translate the methodological challenges to an operational platform are discussed
in section 4. Section 5 then describes different application areas and in the final
section conclusions are drawn and topics for future development and research
are discussed.
3.2 Data collection challenges
3.2.1 Introduction: Data for modeling dynamic activity-travel
behavior
The data requirements of both the static and the dynamic model applications
that have been as outlined above, constitute a real challenge. Especially the
dynamic activity-travel model application needs considerable additional effort in
terms of data collection. Indeed, a dynamic model system needs to address the
problem of activity rescheduling behavior, assuming for instance that daily and
multi-day activity re-scheduling processes depend on history, available time,
and time pressure. Secondly, a dynamic model ideally also needs to address the
problem of long-term dynamics. Following Waerden, Borgers and Timmermans
(2003a, 2003b) and Klökner (2004) it is assumed that critical incidents and key
lifecycle events may prompt or force travelers to change their habitual behavior.
Moreover, lifecycle events, such as reaching the age to have a driver’s license,
leaving home, getting married, first child, retirement, new job, new house, etc.
may lead to changes in available resources and choice options. In turn, these
may lead to changes in activity-travel patterns. Thirdly, and critical for linking
different time horizons, is the notion that travelers cope with a non-stationary
life trajectory. The non-stationarity can be caused by regularly occurring events
such as summer holidays, religious holidays, yearly returning long week-ends or
typical days like labor day, etc., but also on changing needs based on their
activity patterns and their social network.
Therefore, in addition to traditional activity-travel diaries, the model needs data
on activity (re)scheduling decisions of individuals, data on household multi-day
activity scheduling, data on life trajectory events and how they impact activity-
travel decisions, data on how individuals learn and data on how short-term
dynamics are linked to long-term decisions. Such data are available in typical

27
cross-sectional travel surveys, time use surveys and some need to be collected
by means of a panel survey. In fact, in Flanders, neither data on activity-travel
schedules, nor on panel surveys are available.
The data collection therefore involved an extensive hybrid, multi-method
approach. Data on activity-travel patterns were collected using a combination of
paper-and-pencil and GPS/PDA devices. The reason for this combination of two
data collection systems is the fact that not all respondents are fond of new
technologies or are even capable of filling in diaries on electronic devices,
especially the elderly. However, this hybrid approach does not raise any issues
on the level of model calibration, as the attributes describing diaries and the
components of those diaries, being activities and journeys, are similar between
both data collection methods. Therefore, the data sets obtained in both
approaches can be integrated into a master data set.
This data collection differed from the usual activity-travel diaries in that data
were collected for a week as opposed to one or two days, for two members of
the household, as opposed to a single representative. It also included questions
about activity plans and execution, and reasons for change/adjustment.
Moreover, face-to-face contact was established with the participants to collect
data about their social network. Second, data on traveler strategies to cope with
unexpected events during execution of an activity agenda were collected using
stated adaptation experiments, based on fractional factorial designs to allow an
unbiased estimate of effects on the rescheduling of activity-travel patterns.
Respondents were asked to imagine hypothetical scenarios in which they
experience a delay of a specified magnitude when conducting a specified activity,
involving a certain travel time at a specified location using a specified transport
mode. Third, data on lifecycle events were collected using an internet-based
retrospective survey, asking respondents which lifecycle events they
experienced and when. As an alternative for this survey, additional data on
regular events were captured using a vehicle embedded data acquisition device,
allowing for long-term panel data collection. The latter study allows for deriving
the sequence of both lifecycle and regular events and the associated attributes
and for capturing long-term travel information.
3.2.2 PDA-enhanced data collection
The use of GPS-enhanced data collections (as reported in several application
areas; see for instance Goulias and Janelle, 2006) is particularly important in
our dynamic application case because rescheduling decisions are probably not

28
only undertaken at the level of activity, but are consequently probably also
reflected in travel execution (e.g. other routes taken). Furthermore, automated
data collection techniques are particularly well suited to obtain data which
require a significant effort from the respondent like for instance the rescheduling
of activities for the development of dynamic models.
To this end, an automated activity-travel diary survey tool named PARROTS,
which is the acronym for PDA (Personal Digital Assistant) system for Activity
Registration and Recording of Travel Scheduling, uses the Global Positioning
System (GPS) to automatically record location data (Bellemans et al., 2008).
The PDA was programmed such that besides automatically registering its
location, respondents can provide information about their activity-travel
behavior as well. Both planned and executed activities and trips are registered
with the possibility to alter all the attributes of the planned activities. This way,
information is collected regarding the decision and scheduling processes, which
results in an evolution from an intention to execute some activities and trips to
an executed activity-travel diary. A similar philosophy was adopted in Rindsfüser
et al. (2003). Replanning information in our case however is collected by
allowing the respondent to update all attributes and by querying the reasons of
the registered changes.
Figure 1 PARROTS main GUI (Left), planning GUI (Middle) and diary GUI (Right). In order to facilitate the distinction between planned and executed activities, planned activities are depicted in red and are wider than executed activities, which are depicted in blue.
If the PDA is switched on, PARROTS starts automatically and the main GUI is
shown (Figure 1, Left). Whenever PARROTS is active, the GPS logger is
operational logging the GPS location strings at a configurable rate. Hence the
respondent can automatically record route and location information using GPS

29
by keeping the PDA switched on. The ‘Vergrendelen’ button provides screen lock
functionality such that the PDA can safely be stowed during the trip. The PDA is
switched off using the ‘Afsluiten’ button.
The buttons ‘Planning’ (Planning) and ‘Dagboekje’ (Diary) are used to launch the
graphical user interfaces (GUI) to input planned and executed activities and trips
respectively. In the planning GUI, the registered activities and trips are grouped
by day and are listed in the same order they were entered (Figure 1, Middle). In
the diary GUI, the executed activities and trips are displayed in a layout that
resembles an agenda (Figure 1, Right). The difference in both GUI’s stems from
the fact that providing an agenda layout for planned activities is reported in
literature to bias the collected data due to visual feedback of the interface (Zhou
and Golledge, 2007).
Whenever an activity or trip is registered in PARROTS, a number of attributes for
this activity or trip are collected using a customized GUI. The most important
activity and trip attributes PARROTS collects are: activity type, date, start and
end time, location, mode of transportation, travel time and travel party. Note
that although PARROTS collects location data using GPS, the location of activities
is still queried. The match between location information provided by the
respondent and the location logged by GPS needs to be verified during post-
processing in order to validate the data.
PARROTS features several data consistency checks, the most important of which
are: checks that all required data are available and feasible, checks on overlaps
and/or gaps on the time axis and checks for discontinuities in location. If any of
the checks fails, the user is taken to the relevant GUI and an informative error
message is shown. These checks are only enforced for activities and trips that
are labeled as executed.
Respondents used the PARROTS tool during a one-week period. There are
several reasons for this choice. First, when one is interested in capturing
dynamic travel information, which is reflected in planning of activities, next to
the execution of the planning, one should reckon that some activities have a
rather fixed time point and hence can be planned a long time ahead. Second,
some activities take place only once a week (i.e. non-daily shopping, sport
activities) and our goal is to capture them as well. Finally, the choice for
increasing the number of days per respondent reduces important dimensions of
measurement error and marginal costs (Gershuny, 1992), and increases the
usefulness of the data for analysis and model development.
30
Currently, about 900 persons have been questioned by means of the PARROTS
tool, which means that this study is probably one of the largest using GPS in the
field of activity-travel data collection and one of the few that we are aware of
that uses GPS-enabled PDA’s. Also the weekly survey period makes it fairly
unique in the field. In order to limit the costs incurred by delivery and pick-up of
the PDA’s, a decentralized modus operandi was implemented. Co-workers living
scattered over Flanders were recruited such that the travel costs could be
minimized by optimizing the allocation of tasks to co-workers. The full procedure
is administered and guided by means of a web-based application which has been
specifically designed for this purpose.
More detailed analyses with respect to the collected data by means of PARROTS,
like the analysis of the impact of GPS-enabled PDA technology on the user
response rates, the impact of PDA technology on the quality of the collected
diary data and PARROTS usage patterns, can be found in Bellemans et al.
(2008). The functional design of the tool has been discussed in Kochan et al.
(2006a, 2006b).
3.2.3 Paper-and-Pencil data collection
Another part of the sample (about 1500 persons; part of them belonging to the
same households as the people who are questioned by means of the PARROTS
tool, therefore enabling future modeling of intra-household decision making) are
being questioned by means of a traditional paper-and-pencil method to account
for the sample bias which is introduced when only computer-assisted forms of
data collection are used. Furthermore, this choice enables us to carry out
comparative studies with respect to the behavior of both target groups in terms
of response rates, experience, etc.
The paper-and-pencil survey is a traditional activity-based travel survey, except
for the fact that additional information was collected with respect to travel
dynamics and rescheduling information. In the diary, the respondent fills out his
personal activity-travel diary which includes all performed activities and journeys
during one week. Similar to PARROTS, both the planned and executed activities
and trips are registered in a separate booklet. To obtain a link between planned
and executed activities, respondents were asked whether the executed activity
was planned and if so, the sequence number of the corresponding activity in the
planning booklet was asked.
Obviously, one cannot register detailed information about replanning behavior of
a respondent for every choice facet (transport mode, duration, travel party,

31
location) as this would involve many manual checks on both booklets leading to
unacceptable respondent burden. Hence, no detailed replanning information was
gathered in the paper-and-pencil survey and only the reason for differences in
duration of planned and executed activities was queried.
3.2.3 Social network data
At the time of the pick-up of the PDA, participants are also questioned about
their social network (see section 3.1). This takes place during a short interview,
using Wellmann’s instrument (Wellmann, 1979). In the application of this
method, one gets information about egocentric social networks, using only one
name generator per group. Questions were asked about people the respondent
feels closest to; these could be friends, neighbors or relatives. The named alteri
were recorded and described in detail for parents, brothers/sisters, other family
members, friends, neighbors, colleagues and (sports-)club members.
3.2.3 Stated adaptation experiments
As mentioned previously, the goal of collecting data that measures the
adaptation behavior of people, aims at developing a dynamic component that
more efficiently captures the complex process of activity generation and
therefore enhances the behavioral realism of activity-scheduling models.
However, decisions that constitute the short-term adaptation process of people
are not trivial to be solely captured by means of activity-travel diaries (e.g.
activities that have been undertaken more than a week ago). For this reason,
and for benchmarking purposes (with the weekly activity-diary information
which has been collected), a specific internet-based stated preference
experiment was undertaken to gather additional data. The stated-preference
experiment provided each respondent with a number of hypothetical scenarios.
16 such hypothetical scenarios have been designed to collect the data necessary
to assess the influence of the different choice facets on the activity utility.
Respondents were asked - for each hypothetical scenario - to fill out the
probability of performing an activity in the given situation. These probabilities
were subsequently used to estimate utilities by means of a binary logit model. In
order to isolate the effects of the different aspects that were investigated (i.e.
duration, history, location, time of day, presence of accompanying persons and
gender), fraction-utilities were estimated using the theory of the S-shaped utility
functions.

32
While this technique can be used for different activities, it proved to be
particularly relevant for flexible non-routine activities that are frequently
scheduled. More detailed information about the analysis results of the collected
data, can be found in van Bladel et al. (2006) and in van Bladel et al. (2008).
3.2.3 Event-based data collection
Finally, a dynamic model should ideally also account for a continuous change
over time as a function of life trajectory events. In order to take the increased
complexity of this changing life trajectory into account in future model
development, data about these events also needs to be collected. Second, in
such a dynamic modeling environment, researchers are also interested in
changing behavior in the case of regularly occurring events (e.g. public holidays,
anniversaries). Detailed studies were conducted in Cools et al. (2007) and in
Verhoeven et al. (2006, 2007). Not only calendar events have an impact on
travel demand, but also the environment has. It seems only logical that e.g. the
choice of a transport mode can rely heavily on the weather or other seasonal
components. An application of such an exercise was conducted in Cools et al.
(2008).
An “ideal” scenario, of course, would be to keep the sample for a whole year and
refresh it thereafter, hereby measuring people’s activity and travel behavior at
each of the different events (ideally then before, during and after the occurrence
of the key event). The solution which was implemented to capture this type of
travel information in relation to regular and key events was to implement a long
term panel survey that has been carried out by means of a VEDETT-device,
which has been specifically developed for this purpose. VEDETT stands for a
Vehicle Embedded Data acquisition Enabling Tracking & Tracing device. The
logged in-vehicle data of the VEDETT tool can be transmitted to a central data
collection point as a real time data stream or in batches. The integrated GSM
technology also offers the opportunity to remotely update the VEDETT software.
Software updates can involve an extension of the types of the data logged,
augmenting the log frequency, etc. There is no need to take the vehicle out of
circulation to carry out these updates. The system was installed and is currently
running in 14 vehicles. A website application has been developed for the survey
participants in order to communicate with the VEDETT device. On the website,
the motivations or reasons behind all the trips made by car, and all the
additional travel facets can be indicated. To minimize the burden for the
participators in the long term field trial, addresses which are frequently visited,

33
can be designated as point of interests (POI’s). Second, the system is embedded
with a self-learning capacity, to allow for some trips from two POI’s that are
frequently made, to automatically suggest the motivation and amount of
passengers. More detailed information about the VEDETT application can be
found in Broekx et al. (2006).
3.3 Static and dynamic activity-based modeling
It was already stated in the introduction that the first step in the four-stage
development trajectory of the model includes the development of a static
activity-based model for Flanders. It has also been highlighted that advancing
directly towards a full agent-based micro simulation framework is not appealing
from an end-user point of view. The remainder of this section describes the
current status and future research steps in the development of the four-stage
trajectory.
3.3.1 Static activity-based modeling
The scheduling model that is currently implemented in the FEATHERS framework
is based on the scheduling model that is present in ALBATROSS (Arentze and
Timmermans, 2005a). Currently, the framework is fully operational at the level
of Flanders. The real-life representation of Flanders, is embedded in an agent-
based simulation model which consists of over six million agents, each agent
representing one member of the Flemish population. The scheduling is static and
based on decision trees, where a sequence of 26 decision trees is used in the
scheduling process. Decisions are made based on a number of attributes of the
individual (e.g., age, gender), of the household (e.g., number of cars) and of the
geographical zone (e.g., population density, number of shops). For each agent
with its specific attributes, it is for example decided if an activity is performed.
Subsequently, amongst others, the location, transport mode and duration of the
activity are determined, taking into account the attributes of the individual.
While the development of this model did not constitute important scientific and
methodological challenges at this stage, the model was re-implemented from
scratch using the modular FEATHERS platform (see section 4 for a more detailed
description). Due to its current modular application, the model can be rapidly
adapted for the area of Flanders, using other core scheduling models relying
upon other artificial intelligence techniques like Bayesian networks (Janssens et
al., 2004, 2005), simple classifiers (Moons et al., 2005), association rules
(Keuleers et al., 2001), and many others. Thus, in addition to the specific tree

34
induction algorithm used in ALBATROSS, users can opt for a wide variety of
knowledge extraction techniques and meanwhile benefit from the functionalities
that are provided by the other FEATHERS modules (e.g. preprocessing). Easy
transferability of the static activity-based model to another study area, which
has been investigated Arentze and Timmermans (2002), was accounted for in
the FEATHERS design. This resulted in the easy incorporation of the input data
of new study areas into the system and in an easy extension of existing datasets
with new, context-specific attributes.
Within the FEATHERS framework, the developed activity-based models are
micro-simulation models, simulating each member of the population individually.
Hence, for each of the car trips generated, one can obtain information regarding
the type of activity that is associated with this trip as well as other context
information such as e.g. socio-economic data on the traveler and its activity
schedule for the day. It is reasonable to assume that on an individual level, the
context of a trip plays a role in how an individual assesses the cost/utility of a
certain route, giving for instance preference to other routes taken in the context
of flexible activities, like for instance leisure. Preliminary research results (Beckx
et al., 2006) indeed report on a significant impact of travel purpose on driving
behavior, which illustrates the relevance of the trip context when investigating
behavior during trips.
The link between activity-based models and traffic assignment is a key factor in
increasing the deployment of activity-based models in practice since the
resulting visualization and network functionalities meet the needs and concerns
of practitioners. Indeed, the traditional network assignment functionality has
always existed before in four-step models. Hence, in this first stage, the link
between activity-based models and traffic assignment results in a coupling of
new activity-based modeling techniques with models and applications that have
been operational in practice long time.
3.3.2 Semi-static activity-based modeling
Because of the micro simulation of activity-travel patterns, most activity-based
models do not suffer from aggregation biases. Micro simulation provides a
practical method with which to implement probabilistic models at the level of the
individual. The basic argument is that people travel, not zones, and by averaging
to the level of zones, much information is lost and the aggregation bias is
significant. Because of micro simulation it is possible to produce for instance
origin-destination matrices at an hourly (or even more detailed) level, for

35
different days in the week (see section 2 for data requirements), or under
specific circumstances like extreme weather conditions. However, the behavioral
modeling process in itself is not changed.
Indeed, it is known that most currently operational activity-based models are
only applicable in a stationary environment. This characteristic is inconsistent
with other studies where it has been proven that travel behavior is highly
evolutionary (see e.g. Schönfelder, 2006 for a detailed overview) and non-
stationary.
To this end, we have undertaken some first studies to extract non-stationary
information from longitudinal data. In a first application (see Cools et al., 2007,
2008), traffic counts have been used to observe the impact of day of the week,
but also regular events such as holidays etc on the observed traffic states. Also
weather information has been accounted for. The different techniques pointed
out the significance of the day-of-week effects: weekly cycles seem to determine
the variation of daily traffic flows. With respect to weather information, the most
appealing result for policy makers, is the heterogeneity of the weather effects
between different traffic count locations. Furthermore, the results indicated that
precipitation, cloudiness, and wind speed have a clear diminishing effect on
traffic intensity, while maximum temperature, sunshine duration and hail,
significantly increase traffic intensity.
Obviously, these analyses are only preliminary. Tools like the VEDETT
application (see section 3.2.3) further allow for a more detailed behavioral
impact study, enabling one to keep the sample for a whole year, hereby
measuring and comparing people’s (non-stationary) activity and travel behavior
before, during and after the occurrence of an event.
3.3.3 Dynamic activity-based modeling
The next step in the trajectory, deals with the development of a dynamic agent-
based micro-simulator that allows one to simulate activity-travel scheduling
decisions, within day re-scheduling and learning processes in high resolution of
space and time. A priori, the dynamic activity-based simulation system is based
on the Aurora framework, a full dynamic activity-based model focusing on the
rescheduling of activity-travel patterns.
The basis of the Aurora implemented model appear in Timmermans et al. (2001)
and Joh et al. (2003, 2004) focusing on the formulation of a comprehensive
theory and model of activity rescheduling and re-programming decisions as a

36
function of time pressure. Apart from duration adjustment processes, Aurora
incorporates also other potential dynamics such as change of destination,
transport mode, and other facets of activity-travel patterns. Later, this model
was extended to deal with uncertainty (Arentze and Timmermans, 2004),
various types of learning (Arentze et al., 2005), and responses to information
provision (Arentze and Timmermans, 2005b; Sun et al., 2005). Finally, the
model has been implemented as a multi-agent simulation system (Arentze and
Timmermans, 2005c). The system is dynamic in that (i) perceived utilities of
scheduling options depend on the state of the agent, and implementing a
schedule changes this state; (ii) each time after having implemented a schedule,
an agent updates his knowledge about the transportation and land use system
and develops habits for implementing activities (i.e. the agent learns), and (iii)
at each time an agent arrives at a node of the network or has completed an
activity during execution of a schedule, he may reconsider scheduling decisions
for the remaining time of the day (rescheduling). This may happen because an
agent’s expectations may differ from reality. This may be the result from
imperfect knowledge, but it may also be due to the non-stationarity of the
environment. Indeed, as a result of the decisions of all other agents, congestion
may cause an increase in travel times or transaction times at activity locations
that were initially not accounted for by the agent. Furthermore, random events
may cause a discrepancy between schedule and reality.
3.3.4 Full microscopic activity-based model with microscopic
route choice
Given the level of detail of the activity-based models discussed in the previous
sections, the implementation of the bi-directional interaction between the
activity-based model and the transportation system on a non-microscopic level
exhibits some drawbacks.
The origin-destination matrices that are constructed based on the predicted
activity-travel diaries can be aggregated at different levels of detail. While it is
desirable to retain as much information as possible, and hence work at a low
level of aggregation, the level of disaggregation of the origin-destination
matrices is quite limited in practice, e.g. a matrix segmentation by trip purpose
only. While some other general socio-demographic variables can additionally be
accounted for in the segmentation, the assignment procedures that are used in
the conventional four-step models and in stage 1, remain limited in the
maximum level of disaggregation of the matrix that can be dealt with.

37
The presence of uncertainty and of incomplete information can yield a
discrepancy between the attributes of intended and executed activities or trips.
This issue is dealt with by dynamic activity-based models by introducing the
concept of schedule execution as presented in the previous section. This
schedule execution introduces a feedback between the state of the
transportation network and the scheduling process. By using non-microscopic
traffic assignment algorithms, the agent-based concept is broken and the
concept of individual route choice is replaced by a model of a higher level of
aggregation. This aggregation restricts the level of detail at which effects of
policies on the behavior of (very specific groups of) individuals can be assessed.
The issues discussed above are resolved by incorporating microscopic route
choice behavior in the dynamic activity-based model. Individual travelers in this
case are endowed with the capability to consider alternatives with respect to
their intended route, enabling them to cope with changes in the traffic state in
an autonomous manner. Indeed, traffic assignment is inherently dynamic in the
sense that the traffic state of the road network changes frequently.
Consequently, the optimal route of a traveler can be affected by changes in the
traffic state. Such changes typically lead to travelers reassessing their current
situation, and considering alternative routes. However, changes in the traffic
state not only introduce rerouting behavior, but, due to the schedule execution
mechanism, information on the traffic state of the transportation network
effectively propagates towards the agent-based scheduling process. In this way,
schedules that are consistent with the traffic state on the transportation network
can be achieved.
3.4 FEATHERS’ modular system design
Facing the challenge to implement several new theoretical advances like the
ones that are reflected in the four-stage development process in a time and cost
efficient manner, a modular framework to conduct research on agent- and
activity-based models has been developed. The modularity of the FEATHERS
framework is guaranteed by means of the module-based design and by the
usage of the object-oriented paradigm. This design results in an agile
environment that allows for easy removal, exchange and insertion of
functionalities and even complete modules.
An overview of the current modular structure of the FEATHERS framework is
presented in figure 2. In the remainder of this section, the functionality of the

38
modules and the implications of the 4 stage timeline on the evolving
functionality of the modules will be discussed.
Figure 2 A schematic overview of the FEATHERS modules, their functionalities and their interactions.
Configuration module (ConfMod)
In order to be able to exploit FEATHERS’ modular structure to the maximum
extent, a flexible configuration functionality is required. Every module that is
active in FEATHERS communicates with the configuration module in order to
obtain its specific required settings (see Figure 2). This approach allows for a
central configuration management, from where the relevant settings are
dispatched to each of the modules. Modules can be switched (in-)active using
the configuration module to facilitate the multi-stage development strategy
described above. If for a module no settings are available in the configuration
ConfMod
DatMod
Supply
Demand
PopMod
Agents
Capabilities
– Scheduling
– Execution
– Learning
StatMod
– OD Matrices
– Freq. Tables
Supervisor
SchedMod
– ALBATROSS
o Decision trees – Artificial Intelligence
o Bayesian networks
o Simple classifiers o Association rules
LearnMod
– Knowledge on
o Transportation sys. o Land use
– Default settings for act. – Location choice sets
ExecMod
– Activity exec.
– Travel exec.
TrainMod
39
file, it is considered to be inactive by default. This way, users are not burdened
by functionality that is provided by the framework but that is not needed for the
current experiments (cfr. simultaneous development of functionalities for several
stages).
In order to guarantee extensible and structured configuration settings, which are
required to accommodate future and currently unknown configuration settings,
the configuration module stores all the configuration settings for the FEATHERS
modules in XML format (W3C, 2006). This makes the addition of new parameter
settings for a (new) module a simple matter of updating the XML configuration
file.
Data module (DatMod)
One of the core modules in the system is the data module. The data module
provides access to the data that needs to be accessible throughout all other
modules. Two major types of data are provided by the data module: supply and
demand data (see Figure 2).
The (geographic) supply data not only includes the transportation network but
also includes information on geographical zones in the study area such as e.g.
the attractiveness of a zone for conducting certain activities. Also information on
the availability and performance of the transportation system between the zones
in the study area (e.g. travel times, travel costs, bus fares) is included in the
geographic supply data. In summary, the supply data consists of the data
describing the ‘context’ in which the agents live and schedule their activity and
travel episodes.
The demand data (see the upper part of the data module block in Figure 2)
consists of the activity-travel diaries or schedules that describe the demand for
the execution of activities at certain locations as well as the resulting demand for
transportation. The collected diaries are typically accompanied by person and
household data for the persons executing the diaries. The data model for the
demand data in the FEATHERS data module is aware of the following entities:
persons, households, (optionally) cars, activities, journeys and lags and assumes
they relate as presented in Figure 3. In this definition, a lag is typically transport
which is needed to access and egress the main transport mode for that trip. As
FEATHERS is not only tailored towards the Flemish situation and the data survey
discussed in Section 2, the attributes that are available in the data files for each
of the entity types are fully customizable through the configuration module.

40
Both the supply and the demand data managed by the data module are made
available to other modules through the data module’s standardized interface.
Figure 3 Schematic representation of the relations between the transportation demand
data entities in the FEATHERS data module.
As it is imperative that the demand data can be easily accessed by (future)
modules it is important to efficiently implement the relationships between the
entities in the data model. These relationships are defined in the data model that
is presented in Figure 3. As the number of persons and households in a survey is
typically rather small (e.g. 2500 households for the survey discussed in this
chapter), the demand data can be loaded into memory for fast access. The
relations between the entities/objects in Figure 3 are implemented as pointers
between objects. They allow for efficient browsing between related entities (e.g.
finding a household attribute for the household to which a person belongs).
As not all geographic supply data is available at the same level of detail, the
data module provides support for different levels of detail (currently 3,
expandable if required). This support includes keeping track of the relation
between the zones at the different levels of detail. In the current implementation
it is assumed that each zone at the lower level (more detail) belongs to one
higher level zone (less detail) only. These relations between the levels of
geographic detail allow for (dis-)aggregation of simulation results to the desired
geographical level of detail.
The attributes that are stored for the zones in a supply data layer are configured
through the configuration module for flexibility. For the Flanders study area
(total area of approximately 13 500 km²) the levels of detail used are: statistical
Schedule
Household
Activity
Person Cars
Journey Lag

41
sector (small administrative unit, comparable to districts or quarters, 10255
zones), sub-municipalities (1145 zones), and municipalities (327 zones). As the
number of zones in each of the geographical data layers is rather limited for our
study area, it is perfectly feasible to load all data in memory for fast access.
Although it was not required for the current research, a configuration setting
allows the data module to switch over from loading all data into memory to
using direct access binary data files if not sufficiently memory is available. This
switch is transparent to the modules consulting the data.
As information on the transportation system (e.g. bus fares between zones)
cannot be attributed to one zone only, the data module also provides attributes
for pairs of zones for each of the levels of geographical detail. The attributes
that are stored for each pair of zones are configured through the configuration
module. However, as the required storage capacity increases with the square of
the number of zones, the data module provides the choice between loading all
data in memory and using direct access files. For the Flemish case study, the
data on pairs of municipalities and on sub-municipalities was loaded into
memory while for the statistical sectors a direct access file was used.
The supply data on the attractiveness of zones for the execution of activities that
is used for the model in Flanders is exceptionally rich due to the availability of
the socio-economic survey, where the full Flemish population (6 million) was
obligatory surveyed on several socio-demographic variables (age, gender, etc.).
In addition to socio-demographic variables, the dataset also contains commuting
behavior of all persons in the study area (population level). Given this
characteristic, one can derive from this data e.g. the level of employment by
employment sector for each statistical sector, which can be used to calculate the
availability and attractiveness of locations for different activities. Information
about the transport system (road network data, congested travel times, etc.) is
available from the existing four-step model that is currently used in Flanders.
Also the traffic network that is used (see figure 2) results from the existing four-
step model managed by the Flemish government. Although the data module
manages geographical data, it needs to be noted that it currently does not
provide geographic information system (GIS) functionalities. Hence,
geographical manipulations such as e.g. overlays and map matching of GPS data
need to be performed in a preprocessing step and the resulting data need to be
imported into the FEATHERS data module afterwards.

42
Population module (PopMod)
The units of investigation in an activity-based model are the persons making
scheduling decisions that result in activity-travel diaries. Hence, the agents in an
agent-based activity-based model are the individual persons. During scheduling,
the agent’s person characteristics or attributes are used as inputs for the
scheduler to drive the simulated decisions of the agent. The definition of which
attributes are used in the agents is realized through the configuration module.
Examples of person attributes that are commonly used are marital status, age,
possession of driver license, etc.
Similar to the person entities in the data module, the persons (agents) in the
population module relate to households, car (optional), activity, journey and lag
entities (Figure 3). In the population module, these entities are virtual entities
as opposed to the real entities in the data module. Through the relations
between the entities, the attributes of all entities are accessible to be used in the
agent’s scheduling process in addition to its person attributes.
An important difference between the person entities in the data module and the
agents in the population module is the fact that the agent entities possess
important additional functionalities: scheduling, schedule execution and learning
(Figure 2), which are implemented in the scheduling module, the schedule
(activity and travel) execution module and the learning module respectively.
These functionalities are implemented in separate modules in order to make
replacement and extension of agent functionalities as convenient as possible.
In order to perform a simulation of activity and travel behavior of individuals in a
population, a synthetic population consisting of persons and households (and
optionally cars belonging to the household) needs to be built. The population
module is responsible for the management of the different agents (persons) that
are used in the synthetic population. The synthetic population therefore consists
of a collection of agents where each agent is characterized by a number of
attributes. As mentioned previously, the data required are available at
population level in Flanders by means of the socio-economic survey. These
population data can then be updated to the current prediction year by the use of
Iterative Proportion Fitting (IPF) technique. The IPF is a well established
technique with the theoretical and practical considerations behind the method
thoroughly explored and reported in literature (origins appear in Beckman et al.
1996). It uses the population or the larger sample margins to update the
information at cell frequency level. Several applications of the technique in
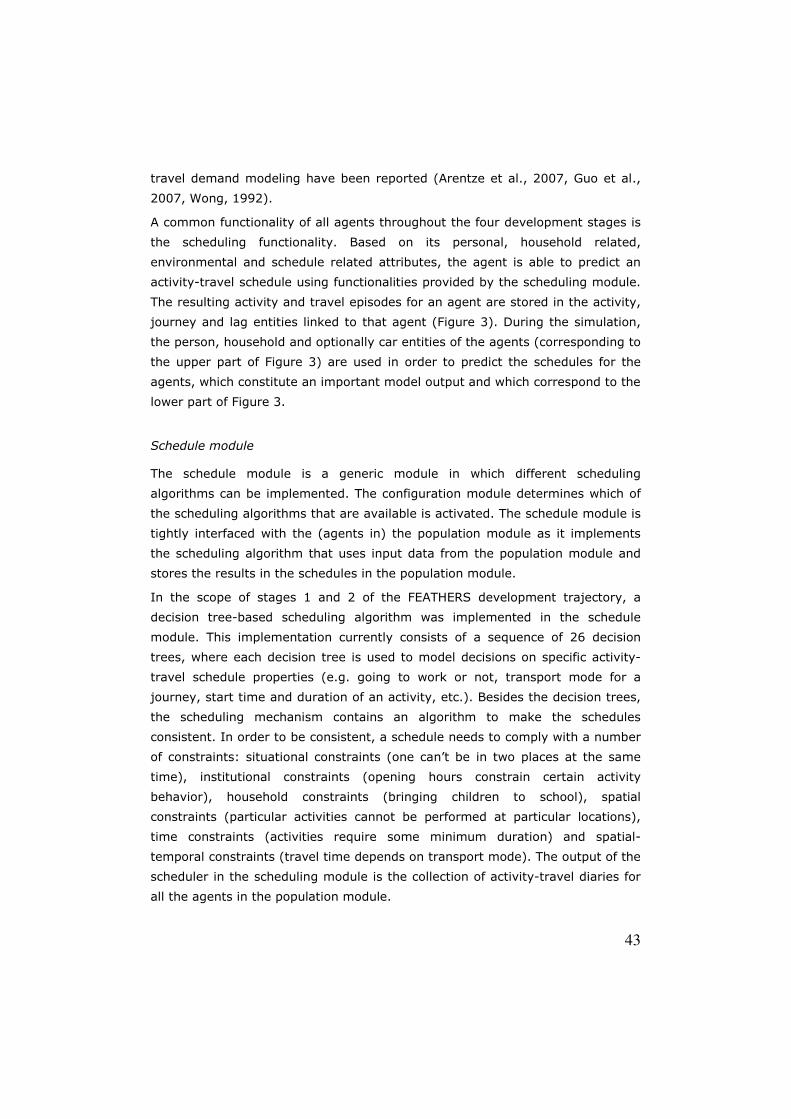
43
travel demand modeling have been reported (Arentze et al., 2007, Guo et al.,
2007, Wong, 1992).
A common functionality of all agents throughout the four development stages is
the scheduling functionality. Based on its personal, household related,
environmental and schedule related attributes, the agent is able to predict an
activity-travel schedule using functionalities provided by the scheduling module.
The resulting activity and travel episodes for an agent are stored in the activity,
journey and lag entities linked to that agent (Figure 3). During the simulation,
the person, household and optionally car entities of the agents (corresponding to
the upper part of Figure 3) are used in order to predict the schedules for the
agents, which constitute an important model output and which correspond to the
lower part of Figure 3.
Schedule module
The schedule module is a generic module in which different scheduling
algorithms can be implemented. The configuration module determines which of
the scheduling algorithms that are available is activated. The schedule module is
tightly interfaced with the (agents in) the population module as it implements
the scheduling algorithm that uses input data from the population module and
stores the results in the schedules in the population module.
In the scope of stages 1 and 2 of the FEATHERS development trajectory, a
decision tree-based scheduling algorithm was implemented in the schedule
module. This implementation currently consists of a sequence of 26 decision
trees, where each decision tree is used to model decisions on specific activity-
travel schedule properties (e.g. going to work or not, transport mode for a
journey, start time and duration of an activity, etc.). Besides the decision trees,
the scheduling mechanism contains an algorithm to make the schedules
consistent. In order to be consistent, a schedule needs to comply with a number
of constraints: situational constraints (one can’t be in two places at the same
time), institutional constraints (opening hours constrain certain activity
behavior), household constraints (bringing children to school), spatial
constraints (particular activities cannot be performed at particular locations),
time constraints (activities require some minimum duration) and spatial-
temporal constraints (travel time depends on transport mode). The output of the
scheduler in the scheduling module is the collection of activity-travel diaries for
all the agents in the population module.

44
A second, more advanced scheduler that is being investigated is the diary utility
maximizing approach that was discussed in Section 3.3. Although this scheduling
approach is fundamentally different from the scheduler in stages 1 and 2, both
schedulers are implemented in the scheduling module side by side. This
illustrates the flexibility of the design of the schedule module in combination
with the population module. This flexibility enables further research on
alternative innovative scheduling mechanisms (see for instance Vanhulsel et al.,
2007).
Schedule execution module (ExecMod)
A dynamic activity-based model as described in stages 3 and 4 requires a
schedule execution mechanism. This schedule execution mechanism simulates
the simultaneous and synchronous execution of all activities and journeys for all
agents. As can be observed from Figure 2, separate modules are provided for
simulation of the execution of activities and for travel execution.
In the activity execution module, uncertainty on the scheduled activities can be
modeled. Indeed, during the execution of activities unforeseen events can take
place resulting in changes of activity attributes, e.g. the duration of the activity,
compared to the attributes of the activity as it was originally scheduled.
In the travel execution module the relation between traffic demand and the
performance of the transportation system (e.g. car travel speeds on a link as a
function of traffic intensity) is accounted for. As the agent’s schedule executions
are simulated for all agents simultaneously, the total traffic demand can be
computed for each transportation mode and at each moment in time. In order to
obtain the traffic intensities on links in the transportation network, the traffic
demand needs to be loaded onto the network. In stage 4, this is achieved by
simulating the microscopic route choice behavior.
The potential mismatch between the attributes of scheduled and simulated
executed activities or travel results in a potential inconsistency in the schedules
if no corrective rescheduling action is taken. E.g. if an journey takes longer than
scheduled due to congestion, the next activity cannot start at the scheduled time
and needs to be rescheduled.
The rescheduling functionality, combined with the traffic assignment from the
stage 4 model, results in a bidirectional coupling between the scheduling and the
transportation network: the traffic demands predicted by the activity-based
model impact the traffic states in the transportation network and vice versa.

45
Rescheduling of activities and travel is managed in the FEATHERS framework by
the supervisor (see figure 2), which coordinates between the scheduling and the
schedule execution for each agent. This coordination mainly consists of deciding
when to check the partially executed schedule for inconsistencies and when to
start the rescheduling (SchedMod) and the schedule execution (ExecMod).
Learning module (LearnMod)
The learning behavior of persons stems from the fact that they observe that
their assumed knowledge about the environment in which they operate (e.g. the
transportation network) does not match reality. An indication of this mismatch is
given by a mismatch between scheduled and executed activities or travel. The
learning process of the agents is managed by the supervisor in combination with
the (re-)scheduling and the schedule execution for that agent. The supervisor
takes into account that the rescheduling processes typically run on a faster time
scale than the learning processes. By adaptation of the supervisor and the
scheduling, schedule execution and learning modules, a wide range of
experiments can be conducted.
Statistics (StatMod) and visualization (VisMod) modules
The statistics module provides reports regarding the (synthetic) population and
the activity-travel schedules to the FEATHERS user. This includes information
that can be extracted at the level of households (e.g. distribution of households
according to availability of means of transportation); persons (e.g. usage of
transportation modes), journeys (e.g. average number of journeys per day);
lags (e.g. average number of lags per journey) and activities. Given the
similarity in the person, household, car, activity, journey and lag entities and
their relations in both the data module and the population module, the statistical
module and the visualization module make abstraction from the fact whether
they consult the data module or the population module to extract the data to
report to the user. Hence, statistics that are implemented for the survey data in
the data module can readily be used to draw the corresponding statistics on
simulated data from the population module. Which statistics are to be drawn by
the statistical module is configured through the configuration module.
As the activity-travel diaries contain detailed travel information, the statistical
module provides the functionality of skimming through all schedules and
compiling an OD matrix. Given the level of detail of the data, the travel

46
information can be aggregated in segmented OD matrices such as e.g. time
sliced OD matrices, OD matrices per transportation mode, and OD matrices per
activity type. This functionality enables a transition step in the evolution from
four step models towards activity-based models by exporting OD matrices that
are assigned to the transportation network using the traffic assignment tools
from the traditional four step model as was discussed in stage 1.
The visualization module relates strongly to the statistical module in the sense
that the visualization module will create graphical reports contrary to the
numerical reports provided by the statistical module. Currently the visualization
module is not operational yet and all FEATHERS reports are obtained through
the statistical module. However, in order to improve user friendliness, a
graphical user interface and a visualization module will be added to the
FEATHERS framework in the future.
Training module (TrainMod)
All models used throughout the FEATHERS framework need to be calibrated
using real-life data. This functionality is provided by the training module. The
training module is configured through the configuration module and obtains the
required data from the data module. The output of the training module is
calibrated model parameters for the models that are used in the other modules
(see Figure 2).
3.5 Travel demand management strategies within
FEATHERS
It is well-known from literature that one of the major promises and reasons for
existence of the activity-based modeling approach is an increased sensitivity for
scenarios that are generally important in transport planning and policy making.
In contrast to trip-based and tour-based models, activity-based models are
sensitive to institutional changes in society in addition to land-use and
transportation-system related factors. Such changes may be related, for
example, to work times and work durations of individuals and opening hours of
stores or other facilities for out-of-home activities. Furthermore, the models
should not ideally only be sensitive to primary but also to secondary responses
to land-use and transportation-related changes that in the past have been
responsible for unforeseen and unintended effects of transport demand
measures by policy makers. Examples of a primary response are changing

47
transport modes, reducing frequency of trips or changing departure time. The
primary response can thus be defined as the choice of a strategy which is aimed
at reducing a negative impact or increasing a positive impact of the policy. A
secondary response then involves adaptations which are required to make the
broader activity pattern consistent with the change. Typical examples of such
possible effects are an increase of out-of-home social activities in response to
measures stimulating teleworking or an increased use of cars for shorter trips as
a secondary effect of stimulating car-pooling for trips to work (car stays at home
and can then be used by other members of the household). Also, by means of
example, switching from car to public transport for trips to work may limit the
possibilities for trip chaining and hence induce extra separate trips as a
secondary response.
Potentially, activity-based models should be sensitive to several groups of TDM,
including: population, schedule, opening-hours, land-use measures as well as
travel costs and travel times scenarios. As Arentze and Timmermans (2005d)
described, in terms of population scenarios, several large trends can be
potentially evaluated, for instance the increasing participation of women in the
labor force, the increasing number of single-adult households resulting in a
decreasing average number of persons per household, the increasing household
income as a consequence of general economic growth, the aging of the
population in terms of graying and de-greening, the increasing number of cars
per household etc. Also institutional changes in society, for instance by means of
the implementation of a workweek or work start time changes can be modeled
in an activity-based framework. A similar application is the widening and
shortening of opening hours of for instance service related facilities. Not only
time-specific measures can be evaluated, but also spatial scenarios can be
computed. For instance, there might be a need to evaluate the result of an
increasing spatial separation of locations for residence, work and facilities as a
consequence of sub-urbanization or alternatively, a concentration of facilities in
commercially attractive neighborhoods. Finally, typical travel-time or pricing
scenarios can be computed by means of the new operational activity-based
models.
However, in addition to the more traditional policy measures mentioned above,
the applicability of TDM can be increased to environmental and health effects,
using the activity-based paradigm as a starting point. Indeed, general traffic
policy measures influence road safety, emissions and human health in an
indirect way, i.e. indirectly through exposure. First results, using an activity-

48
based model for analyzing emission and health impacts, have been reported in
Beckx et al. (2007).
3.6 Conclusions
The main goal of the FEATHERS framework which has been presented in this
chapter is to allow for easy updating and/or replacement of functionalities used
in activity-based models as the state-of-the-art in the activity-based research
field progresses rapidly. We therefore believe that the modular framework holds
considerable promise to facilitate the research on and the development of
dynamic activity-based models for transport demand.
It was illustrated that the modular design of the FEATHERS framework is
compatible with a long term four stage development trajectory of activity-based
models that was postulated for Flanders (Belgium): stage 1 is the development
of a static activity-based model; stage 2 is the development of a semi-static
model accounting for evolutionary and non-stationary behavior; stage 3 is the
development of a fully dynamic activity-based model including short-term
adaptation (rescheduling) and learning; and stage 4 is a full agent-based
dynamic activity-based micro simulation framework including traffic assignment.
Besides the discussion of the different modules within the FEATHERS framework
and their interactions, it was shown how the FEATHERS modules’ functionalities
accommodate the requirements of each of the four development stages.
Along with this, it has been shown that the data requirements of both static and
the dynamic model applications, are a prerequisite for implementation and
operationalisation. To this end, an extensive hybrid, multi-method data
collection approach has been described in detail. It was shown that especially
the dynamic activity-travel model application needs considerable additional
effort in terms of data collection. It has been shown that in addition to
traditional activity-travel diaries, such a model needs data on activity
rescheduling decisions of individuals, data on household multi-day activity
scheduling, data on life trajectory events and how they impact activity-travel
decisions, data on how individuals learn and data on how short-term dynamics
are linked to long-term decisions.

49
References
Arentze, T.A., and Timmermans, H.J.P. ALBATROSS: A Learning-Based
Transportation Oriented Simulation System. European Institute of Retailing and
Services Studies. Eindhoven, The Netherlands, 2000.
Arentze, T.A., Hofman, F., van Mourik, H., and Timmermans, H.J.P., 2002. The
spatial transferability of the ALBATROSS model system: empirical evidence from
two case studies. CD-ROM. Proceedings of the 81th Annual Meeting of the
Transportation Research Board, Washington D.C., U.S.A.
Arentze, T.A., and Timmermans, H.J.P., 2004. A theoretical framework for
modeling activity-travel scheduling decisions in non-stationary environments
under conditions of uncertainty and learning. CD-ROM. Proceedings of the
International Conference on Activity-Based Analysis, Maastricht, 13 pp.
Arentze, T.A., and Timmermans, H.J.P. ALBATROSS 2: A Learning-Based
Transportation Oriented Simulation System. European Institute of Retailing and
Services Studies. Eindhoven, The Netherlands, 2005a.
Arentze, T.A., and Timmermans, H.J.P., 2005b. Information gain, novelty
seeking and travel: a model of dynamic activity-travel behavior under conditions
of uncertainty. Transportation Research A, Vol. 39, pp. 125-145.
Arentze, T.A., and Timmermans, H.J.P., 2005c. A cognitive agent-based
simulation framework for dynamic activity-travel scheduling decisions.
Proceedings of Knowledge, Planning and Integrated Spatial Analysis, LISTA.
Arentze, T.A., and Timmermans, H.J.P., 2005d. The sensitivity of activity-based
models of travel demand: results in the case of ALBATROSS. In A. Jaszkiewicz,
M. Kacmarek, J. Zak, M. Kubiak(ed.): Advanced OR and AI methods in
Transportation, pp. 573-578.
Arentze, T.A., Pelizaro, C., and Timmermans, H.J.P., 2005. Implementation of a
model of dynamic activity-travel rescheduling decisions: an agent-based micro-
simulation framework. CD-ROM. Proceedings of the Computers in Urban
Planning and Urban Management Conference, London, 16 pp.
Arentze, T.A., Timmermans, H.J.P., and Hofman, F., 2007. Creating synthetic
household populations: problems and approach. Transportation Research Record,
Vol. 2014, pp. 85-91.
Balmer, M., Nagel, K., and Raney, B. 2006. Agent-based demand modeling
framework for large scale micro-simulations. Transportation Research Record,
Vol. 1985, pp. 125-134.
Beckman, R.J., Baggerly, K.A., and McKay, M.D., 1996. Creating synthetic
baseline populations. Transportation Research Part A, Vol. 30(6), pp. 415-429.

50
Beckx, C., Int Panis, L., Wets, G., Torfs, R., Mensink, C., Broekx, S., and
Janssens, D., 2006. Impact of trip purpose on driving behavior: case study on
commuter behavior in Belgium. Proceedings of the 15th International
Symposium Transport and Air Pollution, Reims, France. Vol. 107(2), pp. 332-
337. ISBN: 2-85782-639-7.
Beckx, C., Int Panis, L., Arentze, T.A., Timmermans, H.J.P., Janssens, D., and
Wets, G., 2007. Applying an activity-based modeling framework to the
evaluation of vehicle exhaust emissions. Proceedings of the 10th International
Conference on Computers in Urban Planning and Urban Management, Iguassu,
Brazil.
Bellemans, T., Kochan, B., Janssens, D., Wets, G., and Timmermans, H.J.P.,
2008. In the field evaluation of the impact of a GPS-enabled personal digital
assistant on activity-travel diary data quality. Transportation Research Record,
Vol. 2049, pp. 136-143.
Bhat, C.R., Guo, J.Y. Srinivasan, S., and Sivakumar, A., 2004. A comprehensive
micro-simulator for daily activity-travel patterns. CD-ROM. Proceedings of the
Conference on Progress in Activity-Based Models, Maastricht, May 28-32.
Broekx, S., Denys, T., and Int Panis, L., 2006. Long-term travel surveys: how
can the burden remain bearable. Proceedings of the 33rd Colloquium
Vervoersplanologisch Speurwerk, Amsterdam, The Netherlands, November 23-
24.
Cools, M., Moons, E., and Wets, G., 2007. Investigating the effect of holidays on
daily traffic counts: a time series approach. Transportation Research Record, Vol.
2019, pp. 22-31.
Cools, M., Moons, E., and Wets, G., 2008. Assessing the Impact of Weather on
Traffic Intensity. CD-ROM. Proceedings of the 87th Annual Meeting of the
Transportation Research Board, Washington D.C., U.S.A.
Davidson, W., Donnelly, R., Vovsha, P., Freedman, J., Ruegg, S., Hicks, J.,
Castiglione, J., and Picado, R., 2007. Synthesis of first practices and operational
research approaches in activity-based travel demand modeling. Transportation
Research Part A, Vol. 41, pp. 464-488.
De Palma, A., Ben-Akiva, M., Lefevre, C., and Litinas, N., 1983. Stochastic
equilibrium model of peak period traffic congestion. Transportation science, Vol.
17(4), pp. 430-453.
Gershuny, J., 1992. Time budget research in Europe. EUROSTAT. Doc
E3/IS/5/92.
Guo, J.Y., and Bhat, C.R., 2007. Population synthesis for micro simulating travel
behavior. Transportation Research Record, Vol. 2014, pp. 92-101.

51
Goulias, K., and Janelle, D., 2006. GPS tracking and time-geography:
applications for activity modeling and micro simulation. Final Report FHWA-
sponsored Peer Exchange and CSISS Specialist Meeting.
Janssens, D., Wets, G., Brijs, T., Vanhoof, K., Timmermans, H.J.P., and Arentze,
T.A., 2004. Improving the performance of a multi-agent rule-based model for
activity pattern decisions using Bayesian networks. Transportation Research
Record, Vol. 1894, pp. 75-83.
Janssens, D., Wets, G., Brijs, T., Vanhoof, K., Arentze, T.A., and Timmermans,
H.J.P., 2005. Integrating Bayesian networks and decision trees in a sequential
rule-based transportation model. European Journal of Operational Research, Vol.
175, pp. 16-34.
Joh, C.-H., Arentze, T.A., and Timmermans, H.J.P., 2003. Understanding activity
scheduling and rescheduling behavior: theory and numerical simulation. In B.
Boots, et al. (eds.), Modeling Geographical Systems. Kluwer Academic
Publishers, Dordrecht, pp. 73-95.
Joh, C.-H., Arentze, T.A., and Timmermans, H.J.P., 2004. Activity-travel
rescheduling decisions: empirical estimation of the Aurora model. Transportation
Research Record, Vol. 1898, pp. 10-18.
Keuleers, B., Wets, G., Arentze, T.A., and Timmermans, H.J.P., 2001.
Association rules in identification of spatial-temporal patterns in multiday activity
diary data. Transportation Research Record, Vol. 1752, pp. 32-37.
Klökner, C., 2004. How single events change travel mode choice a life span
perspective. Proceedings of the 3rd International Conference of Traffic and
Transport Psychology, Nottingham, UK, September 5-9.
Kochan, B., Bellemans, T., Janssens, D., and Wets, G., 2006a. Dynamic activity-
travel diary data collection using a GPS-enabled personal digital assistant.
Proceedings of the Innovations in Travel Demand Modeling Conference, Austin,
Texas, U.S.A., May 21-23.
Kochan, B., Bellemans, T., Janssens, D., and Wets, G., 2006b. Dynamic activity-
travel diary data collection using a GPS-enabled personal digital assistant.
Proceedings of the 9th International Conference on Applications of Advanced
Technology in Transportation (AATT 2006), Chicago, Illinois, U.S.A., August 13-
16.
Moons, E., 2005. Modelling activity-diary data: complexity or parsimony? Ph.D.
Dissertation, Faculty of Sciences, Limburg University, Diepenbeek.
Pendyala, R.M., Kitamura, R. Kikuchi, A., Yamamoto, T., and Fujji, S., 2005.
FAMOS: Florida activity Mobility simulator. CD-ROM. Proceedings of the 84th
Annual Meeting of the Transportation Research Board, Washington D.C., U.S.A.
Rindsfüser, G., Mühlmans, H., Doherty, S.T., and Beckmann, K.J., 2003. Tracing
the planning and execution of and their attributes - Design and application of a

52
hand-held scheduling process survey. Proceedings of the 10th International
Conference on Travel Behavior Research, Lucerne, Switzerland, August 10-15.
Royce, W., 1970. Managing the Development of Large Software Systems,
Proceedings of IEEE WESCON, pp. 1-9, August 26.
Schönfelder, S., 2006. Urban rhythms : modeling the rhythms of individual
travel behavior. Ph.D. Dissertation. Eidgenössische Technische Hochschule (ETH),
Zürich.
Sun, Z., Arentze, T.A., and Timmermans, H.J.P., 2005. Modeling the impact of
travel information on activity-travel rescheduling decisions under conditions of
travel time uncertainty. CD-ROM. Proceedings of the 84th Annual Meeting of the
Transportation Research Board, Washington D.C., U.S.A.
Timmermans, H.J.P., Arentze, T.A. and Joh, C.-H., 2001. Modeling the effects of
anticipated time pressure on the execution of activity programs. Transportation
Research Record, Vol. 1752, pp. 8-15.
van Bladel, K., Bellemans, T., Wets, G., Arentze, T.A., and Timmermans, H.J.P.,
2006. Fitting S-shaped activity utility functions based on stated-preference data.
Proceedings of the 11th International Conference on Travel Behavior Research,
Kyoto, Japan, August 16-20.
van Bladel, K., Bellemans, T., Janssens, D., Wets, G., Nijland, L., Arentze, T.A.,
and Timmermans, H.J.P., 2008. Design of stated adaptation experiments:
discussion of some issues and experiences. Proceedings of the International
Conference On Survey Methods In Transport: Harmonization And Data
Comparability. Annecy, France, May 25-31.
Vanhulsel, M., Janssens, D., and Wets, G., 2007. Calibrating a new
reinforcement learning mechanism for modeling dynamic activity-travel behavior
and key events. CD-ROM. Proceedings of the 86th Annual Meeting of the
Transportation Research Board, Washington D.C., U.S.A.
Verhoeven, M., Arentze, T.A., Timmermans, H.J.P., and van der Waerden,
P.J.H.J., 2006. Modeling the influence of structural lifecycle events on activity-
travel decisions using a structure learning algorithm. In Kitamura, R.(ed.):
Proceedings of the 11th International Conference on Travel Behavior Research
(IATBR) Conference, Kyoto, Japan, August 16-20.
Verhoeven, M., Arentze, T.A., Timmermans, H.J.P., and van der Waerden,
P.J.H.J., 2007. Examining temporal effects of lifecycle events on transport mode
choice decisions. International Journal of Urban Sciences, Vol. 11, pp. 1-14.
W3C, 2006. eXtensible Markup Language (XML), World Wide Web Consortium
(W3C), http://www.w3.org/XML.22
Waerden, P.J.H.J. van der, Borgers, A.W.J., and Timmermans, H.J.P., 2003a.
Key events and critical incidents influencing transport mode choice switching

53
behavior: an exploratory study. CD-ROM. Proceedings of the 82nd Annual
Meeting of the Transportation Research Board, Washington D.C., U.S.A.
Waerden, P.J.H.J. van der, Borgers, A.W.J., and Timmermans, H.J.P., 2003b.
The influence of key events and critical incidents on transport mode choice
switching behavior: a descriptive analysis. CD-ROM. Proceedings of the IATBR
Conference, Lucerne, Switzerland, August 10-16.
Wellmann, B., 1979. The community question: the intimate networks of East
Yorkers. The American Journal of Sociology, Vol. 84(5), pp. 1201-1231.
Wong, D.W.S., 1992. The reliability of using the iterative proportional fitting
procedure. Professional Geographer, Vol. 44(3), pp. 340-348.
Zhou, J., and Golledge, R., 2007. Real-time tracking of activity
scheduling/schedule execution within a unified data collection framework.
Transportation Research Part A, Vol. 41(5), pp. 444-463.

54

55
Chapter 4 Validation of an activity-based
traffic demand model for Flanders
The previous chapter introduced the FEATHERS framework which can be used
for implementing activity-based transportation models. In order to justify itself
and in line with the goals of this research, in this chapter, one such activity-
based model is worked out. Subsequently, in a second step, this model is also
validated as model validation forms an essential part of any model development
process if the model is to be accepted and used to support decision making.
This chapter is adapted from: Computational Intelligence for Traffic and Mobility.
Edited by Wuhong Wang, Geert Wets, Atlantis Press, Springer, 2012
In this chapter the different steps in the operationalization of an activity-based
model for Flanders (Belgium) inside the ‘Forecasting Evolutionary Activity-Travel
of Households and their Environmental RepercussionS’ (FEATHERS) framework
are worked out. In order to run the activity-based model for the Flemish
situation, several data layers inside the FEATHERS database system have to be
prepared. To this end, activity-based schedule information, a synthetic
population data set and environment information about the study area in terms
of zoning system, land use and transportation system have to be processed. In a
second part, the chapter discusses the validation of the modeling results. Based
on the validation results, it is demonstrated that the presented activity-based
model is able to realistically mimic the spatial and temporal dimension of
transportation demand in Flanders, as well as the evolution of the state of the
road network in both space and time.
4.1 Introduction
Travel demand models are an important tool used in the transportation planning
process to analyze alternative transportation policies and decisions.
Transportation forecasts have traditionally followed the sequential 4-step model
where 4 sequential steps from trip generation to traffic assignment yield traffic
volumes on network links. Activity-based models on the other hand form
another class of transportation demand models that predict on an individual
level where and when specific activities (e.g. work, leisure, shopping, etc.) are

56
conducted. Along with these activities also trips are generated so that the end
result of an activity-based model consists of activity-travel diaries or schedules.
Activity-based models can be developed as stand alone applications, however
they can also be embedded in a framework that allows the models to be created,
updated and maintained more easily. One such framework is the FEATHERS
framework (Bellemans et al., 2010). The idea was conceived to develop a
modular activity-based model of transport demand framework, where the
emphasis is on the one hand on the practical use of the system by practitioners
and end users and on the other hand on facilitating the creation of alternative
activity-travel demand models. Similar initiatives, like for instance the Multi-
Agent Transport SIMulation toolkit (MATSIM, 2011) and the Common Modeling
Framework (CMF) (Davidson et al., 2007) have been developed for trip-based
and complex tour-based models, highlighting the potential relevance of such a
modular system.
The activity-based scheduling model that is implemented in the FEATHERS
framework and that is presented in this chapter is based on the scheduling
model that is present in A Learning BAsed TRansportation Oriented Simulation
System (ALBATROSS) (Arentze and Timmermans, 2005a). The first part of this
chapter therefore focuses on the different steps concerning the
operationalization of the ALBATROSS scheduling core inside FEATHERS. As will
be discussed, the scheduling is based on decision trees, where a sequence of 26
decision trees is used in the scheduling process. Furthermore, the gathering of
Flemish data, necessary for training the ALBATROSS model, will be explained
into detail.
As FEATHERS now is equipped with an activity-based model, the question of
validity of the model still remains. Therefore, in a second part, this chapter
focuses on validation aspects. Obviously, it cannot be neglected that model
validation is an important issue before model employment. By definition, model
validation is a means to systematically establish a level of confidence of models.
In this part, the comparison of the applied model with field observed data will
serve as an indicator of how well the model replicates existing travel patterns.
4.2 FEATHERS
In order to facilitate the development and maintenance of dynamic activity-
based models for transport demand, the FEATHERS framework was developed.
For this purpose FEATHERS provides the tools needed in order to develop and
maintain activity-based models in a particular study area. The framework

57
supplies tailored memory structures such as, ‘households’, ‘persons’, ‘activities’,
‘trips’, ‘cars’, etc. and at the same time FEATHERS is also equipped with a
database structure that is able to nourish activity-based models being
developed, assimilated or modified inside FEATHERS. In such a way, in the
framework, users can opt for a wide variety of functionalities that are provided
by the FEATHERS modules facilitating the creation and maintenance of activity-
travel demand models.
4.3 The ALBATROSS system
Currently the FEATHERS framework incorporates the core of the ALBATROSS
Activity-Based scheduler (Arentze and Timmermans, 2005b). This scheduler
assumes a sequential decision process consisting of 26 decision trees that
intends to simulate the way individuals build schedules. The output of the model
consisting of predicted activity schedules, describes for a given day which
activities are conducted, at what time (start time), for how long (duration),
where (location), and, if travelling is involved, the transport mode used and
chaining of trips.
The underlying methodology and assumptions used in each major step within
the ALBATROSS model are as follows. The scheduler first starts with an empty
schedule or diary where after it will evaluate whether or not work activities will
be included. If this is the case, then the number of work activities will be
estimated together with their beginning times and durations. In a second step
the locations of the work activities are determined. The system sequentially
assigns locations to the work activities in order of schedule position. This is done
by systematically consulting a fixed list of specific decision trees. During the
third step the model proceeds with the next decision steps, that is: selection of
work related transport modes, inclusion and time profiling of non-work fixed and
flexible activities, determination of fixed and flexible activity locations and finally
determination of fixed and flexible activity transport modes.
As these activity-based schedules constitute the output of an activity-based
model, they can be used to infer Origin-Destination (OD) matrices for traffic
assignment. Indeed, as the output of the model contains detailed information
about trip location, transport mode, trip start time, etc., hourly OD matrices
containing trips between the different TAZs can be derived very easily.

58
4.4 Incorporating the ALBATROSS model inside
FEATHERS
The encapsulation of the ALBATROSS model inside FEATHERS asks for a number
of steps. First of all, the model itself has to be modified in order to use it for the
Flemish region and second, input data needed for running the model have to be
gathered for the same region. The following sections discuss these steps into
more details.
4.4.1 Tailoring the ALBATROSS model to the Flemish situation
As the original ALBATROSS model was designed for the Netherlands specifically,
several changes had to be made in order to employ the model to Flanders.
Firstly, as each decision step in the process model is controlled by a decision
tree, the complete list of 26 decision trees inside the model had to be replaced
by Flemish decision trees that were derived from corresponding observations in
the activity diary data set using a CHAID based induction method (Arentze and
Timmermans, 2005b, Kass, 1980). The activity diary data that were used will be
further discussed later in this chapter.
Secondly, as the model inside FEATHERS makes use of decision trees where a
lot of continuous condition variables are discretized into nominal attributes
before training the trees, a long list of discretizing bins had to be defined. The
discretization was performed by equal-frequency binning, i.e. the thresholds of
all bins were selected in a way that all bins contained the same number of
numerical values. By making use of a discretization operator it also becomes
very convenient to train all decision trees for any kind of study area as long as
an activity diary data set is available.
Thirdly, transport system related variables deserved special attention. One of
the most important changes in this regard is the re-implementation in the model
of the calculation of travel costs by particular modes. A number of assumptions
underlying the Dutch equations were not valid for Flanders’ study area.
Therefore, besides car travel costs, costs of public transport trips that were
originally calculated specifically for the Dutch transport system had to be
replaced by implementations representing the Flemish situation. For example,
train and metro ticketing systems in the Flanders vary from those in the
Netherlands, so new implementations had to be foreseen for the Flemish region.
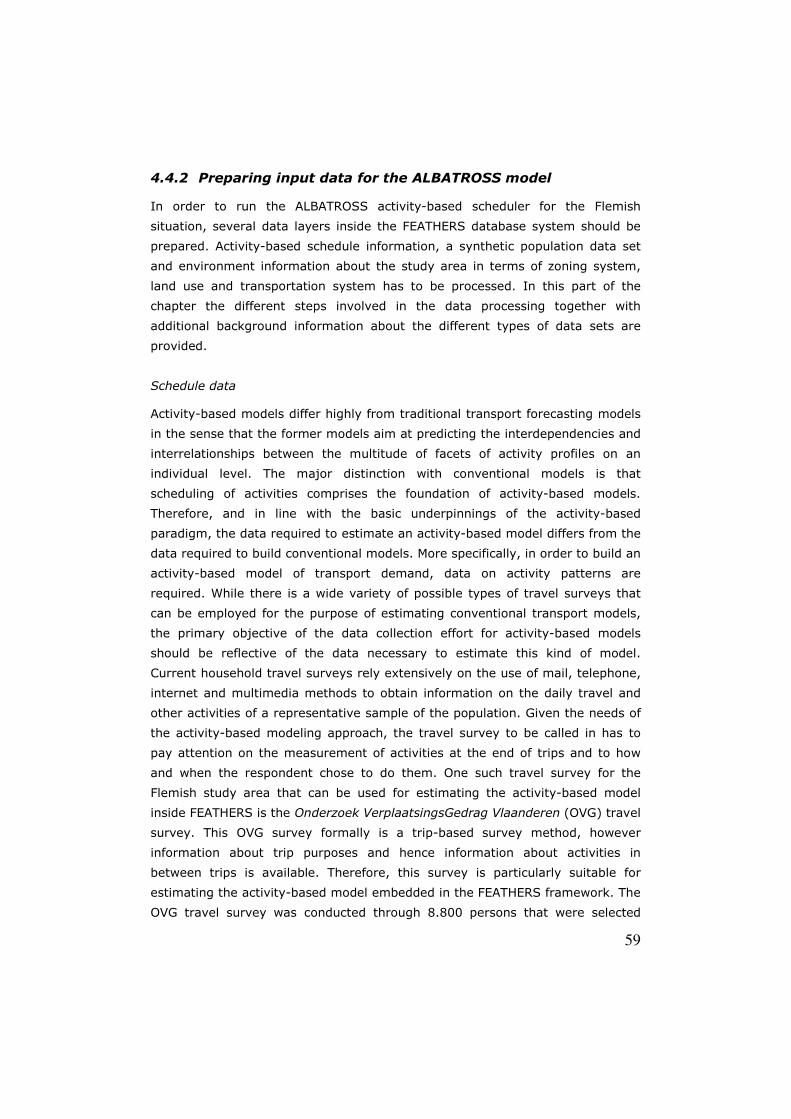
59
4.4.2 Preparing input data for the ALBATROSS model
In order to run the ALBATROSS activity-based scheduler for the Flemish
situation, several data layers inside the FEATHERS database system should be
prepared. Activity-based schedule information, a synthetic population data set
and environment information about the study area in terms of zoning system,
land use and transportation system has to be processed. In this part of the
chapter the different steps involved in the data processing together with
additional background information about the different types of data sets are
provided.
Schedule data
Activity-based models differ highly from traditional transport forecasting models
in the sense that the former models aim at predicting the interdependencies and
interrelationships between the multitude of facets of activity profiles on an
individual level. The major distinction with conventional models is that
scheduling of activities comprises the foundation of activity-based models.
Therefore, and in line with the basic underpinnings of the activity-based
paradigm, the data required to estimate an activity-based model differs from the
data required to build conventional models. More specifically, in order to build an
activity-based model of transport demand, data on activity patterns are
required. While there is a wide variety of possible types of travel surveys that
can be employed for the purpose of estimating conventional transport models,
the primary objective of the data collection effort for activity-based models
should be reflective of the data necessary to estimate this kind of model.
Current household travel surveys rely extensively on the use of mail, telephone,
internet and multimedia methods to obtain information on the daily travel and
other activities of a representative sample of the population. Given the needs of
the activity-based modeling approach, the travel survey to be called in has to
pay attention on the measurement of activities at the end of trips and to how
and when the respondent chose to do them. One such travel survey for the
Flemish study area that can be used for estimating the activity-based model
inside FEATHERS is the Onderzoek VerplaatsingsGedrag Vlaanderen (OVG) travel
survey. This OVG survey formally is a trip-based survey method, however
information about trip purposes and hence information about activities in
between trips is available. Therefore, this survey is particularly suitable for
estimating the activity-based model embedded in the FEATHERS framework. The
OVG travel survey was conducted through 8.800 persons that were selected
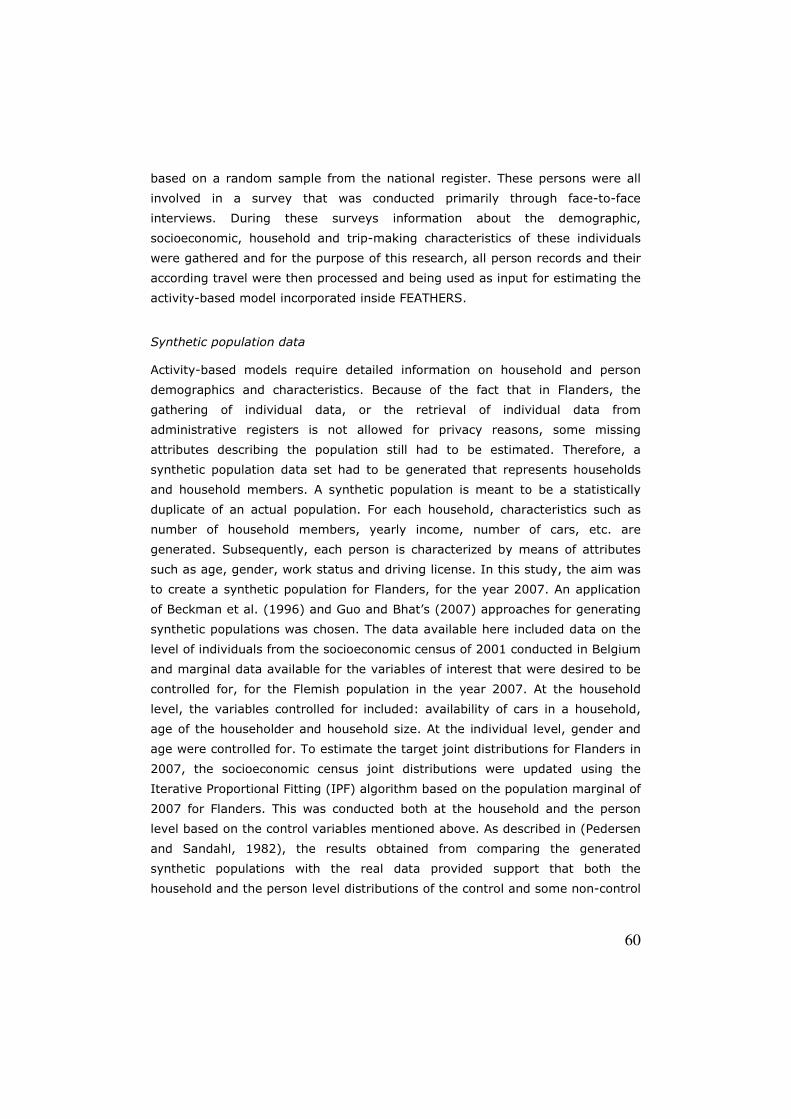
60
based on a random sample from the national register. These persons were all
involved in a survey that was conducted primarily through face-to-face
interviews. During these surveys information about the demographic,
socioeconomic, household and trip-making characteristics of these individuals
were gathered and for the purpose of this research, all person records and their
according travel were then processed and being used as input for estimating the
activity-based model incorporated inside FEATHERS.
Synthetic population data
Activity-based models require detailed information on household and person
demographics and characteristics. Because of the fact that in Flanders, the
gathering of individual data, or the retrieval of individual data from
administrative registers is not allowed for privacy reasons, some missing
attributes describing the population still had to be estimated. Therefore, a
synthetic population data set had to be generated that represents households
and household members. A synthetic population is meant to be a statistically
duplicate of an actual population. For each household, characteristics such as
number of household members, yearly income, number of cars, etc. are
generated. Subsequently, each person is characterized by means of attributes
such as age, gender, work status and driving license. In this study, the aim was
to create a synthetic population for Flanders, for the year 2007. An application
of Beckman et al. (1996) and Guo and Bhat’s (2007) approaches for generating
synthetic populations was chosen. The data available here included data on the
level of individuals from the socioeconomic census of 2001 conducted in Belgium
and marginal data available for the variables of interest that were desired to be
controlled for, for the Flemish population in the year 2007. At the household
level, the variables controlled for included: availability of cars in a household,
age of the householder and household size. At the individual level, gender and
age were controlled for. To estimate the target joint distributions for Flanders in
2007, the socioeconomic census joint distributions were updated using the
Iterative Proportional Fitting (IPF) algorithm based on the population marginal of
2007 for Flanders. This was conducted both at the household and the person
level based on the control variables mentioned above. As described in (Pedersen
and Sandahl, 1982), the results obtained from comparing the generated
synthetic populations with the real data provided support that both the
household and the person level distributions of the control and some non-control

61
variables represent the true population well and consequently the actual
population could be relatively accurately synthesized.
Environment data
Zoning system: The unit of geography inside the FEATHERS framework is
defined by means of a hierarchy of three geographical layers on top of each
other. This hierarchy stems from the land use data being available at different
levels of geographical detail. In order of increasing detail there are a total of 327
Superzones, 1145 Zones and 2386 Subzones that were developed for the 2007-
based FEATHERS framework. The list of Superzones corresponds with all
municipalities inside Flanders, the Zones correspond with administrative units at
one level lower than municipalities and the last level, the Subzone level, consists
of virtual areas that were constructed based on homogeneous characteristics
defining each Subzone.
Land use data: Data about land use are available at different levels of the zoning
system and involve opening hours and locations of facilities for out-of-home
activities. Moreover, the land use system also provides sector-specific data that
are used as indicators of availability and attractiveness of facilities for
conducting particular activities. In the FEATHERS database the following sector-
specific data are being used: total employment, number of primary school
children, employment in daily good retailing, employment in non-daily good
retailing, employment in banks/post offices and employment in restaurants. By
means of assumed relationships between these sector data sets and activity
types such as ‘shopping’, ‘bring/get’, etc., possible locations for conducting such
kind of activities can be obtained.
Transportation system: The transportation system is represented by a set of
Level Of Service (LOS) matrices by transport mode containing information about
travel distance, travel time, egress and access time. The different transport
modes that are considered include, car (driver), car (passenger), public
transport and slow mode. Each transport mode has its own pair of distance and
travel time matrices. These travel distances and travel times were derived in a
pre-processing stage outside the system using a GIS tool. Furthermore, in a
transport demand model it is also important to have time-of-day dependent
travel times rather then an average. For this reason, free-flow, morning-peak
and evening-peak travel time data were derived accordingly.

62
4.5 Travel demand and traffic assignment model
chain
The 4 steps of a classical transportation planning system model are: trip
generation, trip distribution, mode choice and traffic assignment. In line with
this traditional 4-step travel demand model where the first 3 steps result in OD
trip matrices and the 4th step comprehends traffic assignment, the travel
demand and traffic assignment model chain presented in this chapter, also
consists of an OD trip matrices generation part, done by FEATHERS, and a traffic
assignment part as a separate modeling step next to FEATHERS’ involvement in
the chain. In this part, the several steps in the model chain are explained into
more detail.
4.5.1 FEATHERS-based transportation demand
The output of FEATHERS consists of activity-travel diary data sets for a day in
the 2007 base year, however output differs across 7 days of an average week.
In addition to this day-dependency of schedules and at a more detailed level,
trip start times inside these schedules are available in minutes thus allowing
trips to be categorized easily according to hourly start times. This categorization
is a usual step done while deriving OD matrices necessary for the traffic
assignment step. Next to this time aspect of schedules, trips can also be
characterized by one of several modes of transport, among which two types of
car mode, a public transport mode and slow mode. Therefore, trips done by all
kinds of transport mode can be taken into account. When combining the time
and transport mode dimension in generating OD matrices, for each hour of the
day and for each day of the week, these diary data sets can be processed
yielding 168 OD trip matrices when focused on car mode only. This large amount
of OD matrices will then serve as input for the traffic assignment part.
4.5.2 Traffic assignment
Traffic assignment is the last step in the traditional 4-step approach and assigns
the OD matrix trips to the network links by minimizing travel costs providing the
final output of the modeling process. The user equilibrium traffic assignment
method available in a standard transportation GIS software was used for this
last step following the travel demand model step. The main assumption of this
equilibrium traffic assignment method is that travelers are rational and will act in
a way that minimizes their transportation cost (i.e. travel time). This method is
an iterative process which converges when no traveler can improve his travel

63
time by changing the current path. A capacity constrained function, which
approximates the equilibrium of congested travel paths in the network, was used
to model the impacts of congestion on travel times. The Bureau of Public Roads
(BPR) function was used to account for the reduction in travel speeds caused by
congestion.
As Flanders as a study area is not generating traffic in isolation with its
neighboring countries, it is desirable to obtain all traffic on the Flemish network
links. Next to internal-to-internal, also external-to-internal, internal-to-external
and external-to-external trips have to be considered during the traffic
assignment. Therefore, to not only account for internal study area trips but also
external trips, an additional 517 external zones were included at the Subzone
geographical level of the zoning system and an independent matrix providing
external trip information was used in this traffic assignment step so that also
these external trips could contribute to the traffic on the network. The OD
matrices derived in FEATHERS, representing Flemish OD matrices, were
systematically extended with external trip OD matrices so that on Flemish
network links also non-internal trips could be taken under consideration.
Another important issue concerns freight transport on the network. As
FEATHERS currently is conceived as a person transport demand framework only,
no freight trips are predicted. However, freight trips share the same network
links as person cars and because link capacities are restrained, during this traffic
assignment step, freight trips stemming outside the FEATHERS framework were
preloaded on the network resulting in a more crowded network. Preloads form
settled background volumes on network links and are incorporated into the
assignment process so that person trips, while being assigned on the network,
experience these freight transport preloads on specific links as a form of
reduction of the respective network link capacities. The overall idea of using
preloaded freight traffic in this part therefore is to eventually increase the
accuracy of the computed link loadings and congested travel times.
The output from the equilibrium traffic assignment, accounting for external trips
and freight transport trips, consists of the person traffic volume on each link in
the network over time. This output proves to be important as real-life traffic
intensity measurements are available at different locations and for different
times of day, which can be used in the validation process as will be discussed
later on in this chapter.

64
4.6 Validation of Flemish simulation results
In case of transport demand models, model validation tests the ability of the
model to predict travel behavior. Validation requires comparing the model
predictions with information other than that used in estimating the model. If the
model output and the independent data are in acceptable agreement, the model
can be considered validated (Pedersen and Sandahl, 1982).
In this chapter validation is performed on 4 different levels, namely on the level
of internal model components consisting of the decision trees, by exploring the
time and space dimensions of the activity-travel output of FEATHERS and as a
last part, by comparing predicted traffic assignment link volumes with traffic
counts and by collocating predicted vehicle kilometers travelled with official
reports by the government at the level of the transport model chain.
4.6.1 Validation on the level of model components
The activity-based model inside FEATHERS uses a CHAID-based decision tree
induction method to derive decision trees from activity diary data. This part of
the validation therefore describes the quality of the resulting trained decision
trees, for each step in the decision process model. Most decision trees involve a
choice between discrete alternatives, e.g. transport mode, however, activity
duration and activity start time decisions are modeled as a continuous choice
and therefore a continuous decision tree is constructed for each of these kind of
choices.
To be able to test the validity of the presented model on a holdout sample, only
a subset of the cases is used to build the model (i.e. training set). The purpose
of the validation test is also to evaluate the predictive ability of the decision
trees for a new set of cases. For each decision step, a random sample of 70% of
the cases was used to build the decision trees, the other subset of 30% of the
cases was presented as ‘unseen’ data to the models; this part of the data was
used as the validation set. The percentages that show the predictive
performance of the decision trees on the training and validation sets are
presented in Table 1. The predictive performance of each discrete choice
decision tree was calculated by means of the Confusion Matrix Accuracy (CMA)
measure (Kohavi and Provost, 1998). To be able to make a judgment about the
predictive ability of decision trees, a null-model for each tree is calculated as
well so that the relative performance of each tree can be determined. A null-
model is defined as a model that randomly selects a choice alternative. Note

65
that the performance of a null-model can simply be derived by dividing 100 by
the number of choice alternatives. By comparing the null-models with the
respective decision trees it becomes possible to see whether or not the decision
trees are vigorous enough to score better then the null-models.
Choice Tree
type
Nr of
choices
Null
model (%)
CMA
Training
set (%)
CMA
Test
set (%)
RAME
Training
set (%)
RAME
Test
set (%)
Inclusion of work episode D 2 50.0 77.9 77.8 - -
Total duration of work episodes C - - - - 27.9 26.4
Number of work episodes D 2 50.0 68.8 68.1 - -
Duration of separate work
episodes C - - - - 27.5 31.4
Duration of break time C - - - - 71.0 71.5
Timing of work episodes C - - - - 11.8 12.9
Location, same as previous D 2 50.0 70.6 67.9 - -
Location, in/out home Superzone D 2 50.0 63.1 61.4 - -
Location, Superzone order D 5 20.0 30.0 27.7 - -
Location, Superzone nearest
order D 2 50.0 75.7 72.3 - -
Location, Superzone distance band
D 6 16.6 25.9 24.2 - -
Location, Subzone order D 4 25.0 35.1 32.4 - -
Location, Subzone distance band D 5 20.0 37.3 36.4 - -
Transport mode work episodes D 4 25.0 65.3 62.1 - -
Inclusion of fixed episode D 2 50.0 87.2 86.8 - -
Number of fixed episodes D 4 25.0 48.2 45.5 - -
Duration of fixed episodes C - - - - 140.1 154.0
Chaining with work episode D 5 20.0 48.8 48.2 - -
Timing of fixed episodes C - - - - 33.3 34.6
Inclusion of flexible episode D 2 50.0 79.6 78.8 - -
Duration of flexible episode D 3 33.3 41.8 39.5 - -
Timing of flexible episode D 6 16.6 49.5 47.4 - -
Chaining of flexible episode D 4 25.0 90.6 89.9 - -
Location, same as previous D 3 33.3 60.0 59.1 - -
Location, distance-size class D 25 4.0 8.9 7.7 - -
Transport mode non-work episodes
D 4 25.0 52.7 49.8 - -
Table 1 Predictive performance of discrete (D) and continuous (C) decision trees2.
2 A dash (-) in the table indicates that the respective missing figure has no meaning

66
As can be seen in Table 1 all trees perform better then the null-models where a
random choice alternative is being selected. This is the case for all trees, even
for the location-decision-size tree where at first sight this tree performs worse
when compared with other trees. However, this tree being inferior to the other
trees, scores low because of the fact that this tree has the highest number of
choice options, namely 25, where every option describes a location category.
Selecting the correct category out of 25 possibilities inherently makes this
prediction difficult. This is indicated by the very low mathematical chance of a
correct prediction, 4% in this case. Therefore from this point of view a CMA of
8.9% indicates that this particular tree performs relatively well.
Based on Table 1, it can also be concluded that the degree of over-fitting, i.e.
the difference between the training and the validation set, is low for all decision
trees. Therefore, it can be underlined that the transferability of the model to a
new set of cases is satisfactory.
For continuous decision trees however, another measure than the Confusion
Matrix Accuracy is used, namely the Relative Absolute Mean Error (RAME), as no
confusion matrix can be determined for these kind of trees. The Relative
Absolute Mean Error is calculated by taking the sum over all absolute differences
between observed and predicted cases and then dividing this value by the sum
over the observed values of all cases. Table 1 lists the Relative Absolute Mean
Error for the continuous decision trees for the validation and test set. As can be
seen, the RAME for each decision tree separately is approximately the same for
the training and validation set, implying that the decision trees perform well in
case of unseen data cases. However, values differ much across all trees. This is
caused by the fact that the nature of the different choices to be determined is
very diverse. For example, the duration of work episodes tend to be rather
stable as opposed to the duration of fixed episodes (e.g. bring/get activity).
Nevertheless, overall, the continuous decision trees perform quite well.
4.6.2 Validation of the FEATHERS activity-travel time dimension
Transportation allows people to participate in different kind of activities at
different locations. These activities, such as work, leisure, shopping, etc. occur
at different times of the day and therefore, it is not surprising that the number
of trips varies by time of day.
For the time dimension aspect of the validation, a comparison with official OVG
reports is made. Despite the fact that raw OVG survey data has been used in
order to train the ALBATROSS model inside FEATHERS, the official OVG reports
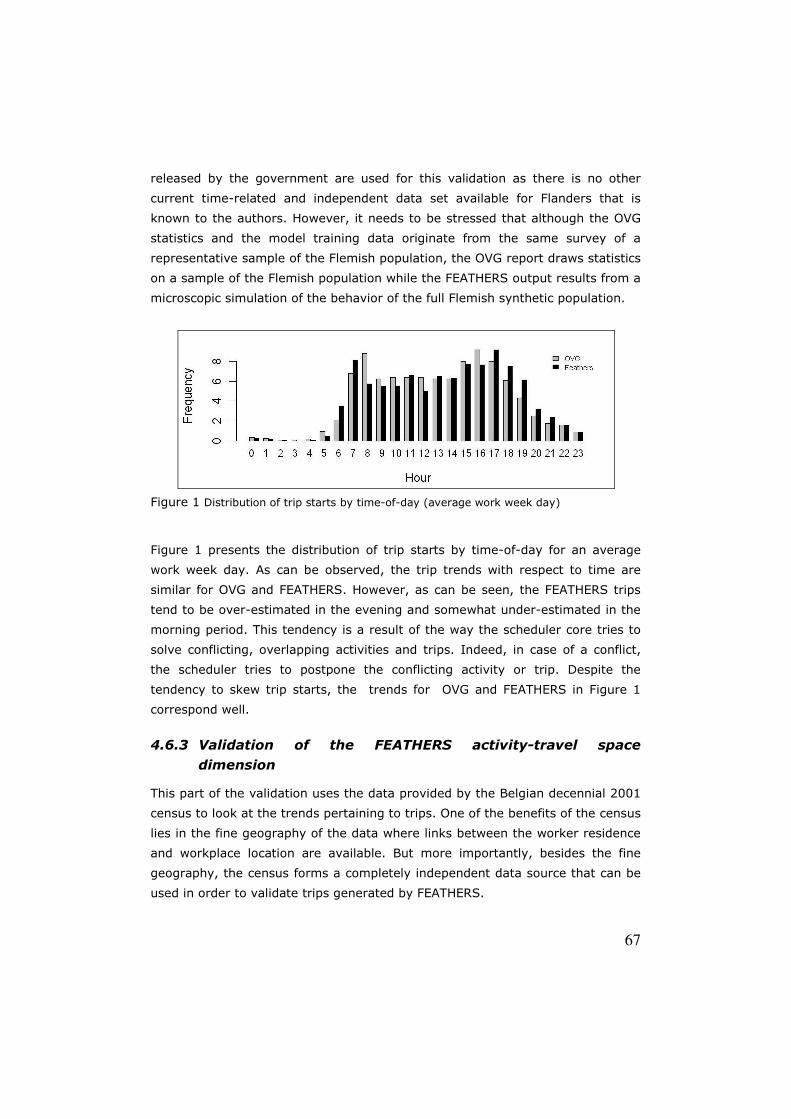
67
released by the government are used for this validation as there is no other
current time-related and independent data set available for Flanders that is
known to the authors. However, it needs to be stressed that although the OVG
statistics and the model training data originate from the same survey of a
representative sample of the Flemish population, the OVG report draws statistics
on a sample of the Flemish population while the FEATHERS output results from a
microscopic simulation of the behavior of the full Flemish synthetic population.
Figure 1 Distribution of trip starts by time-of-day (average work week day)
Figure 1 presents the distribution of trip starts by time-of-day for an average
work week day. As can be observed, the trip trends with respect to time are
similar for OVG and FEATHERS. However, as can be seen, the FEATHERS trips
tend to be over-estimated in the evening and somewhat under-estimated in the
morning period. This tendency is a result of the way the scheduler core tries to
solve conflicting, overlapping activities and trips. Indeed, in case of a conflict,
the scheduler tries to postpone the conflicting activity or trip. Despite the
tendency to skew trip starts, the trends for OVG and FEATHERS in Figure 1
correspond well.
4.6.3 Validation of the FEATHERS activity-travel space
dimension
This part of the validation uses the data provided by the Belgian decennial 2001
census to look at the trends pertaining to trips. One of the benefits of the census
lies in the fine geography of the data where links between the worker residence
and workplace location are available. But more importantly, besides the fine
geography, the census forms a completely independent data source that can be
used in order to validate trips generated by FEATHERS.

68
While the census data forms a powerful and independent data set for
comparison with FEATHERS, there are some difficulties pertaining to this
comparison. First of all the census asks about specific trips only, namely the
usual travel to work and school, however the usual travel for other purposes is
not obtained. So therefore, it is only possible to compare work and school trips
as observed in the census with the corresponding trips as predicted with
FEATHERS. Secondly, the census covers all persons in the population including
young persons under the age of 18. FEATHERS on the other hand only regards
adults of age higher or equal to 18 years because the underlying transport
model ALBATROSS imposes this limitation. This means that a lot of school trips
are missing in FEATHERS, more specifically those trips made by youngsters on
their own. School trips where parents bring and get their children to school do
appear in the predicted set of trips so this partly makes up for the drawback of
the model inside FEATHERS. Thirdly, the FEATHERS base year is the year 2007,
while the census, as it is a decennial survey, stems from the year 2001 which is
the last available census.
Despite these shortcomings in comparison, the census can still be used as in this
part of the validation process the primary focus is on the spatial patterns
pertaining to trips in Flanders, and not on the actual number of trips. Here,
FEATHERS’ trip patterns are evaluated for reasonableness based on the
indicative census spatial trip pattern as a reference.
To be able to compare patterns in the census trips and FEATHERS trips every OD
pair of the census is joined with the corresponding OD pair in FEATHERS. This
way it becomes possible to see whether or not the number of trips belonging to
each FEATHERS OD pair is of the same order of magnitude as the number of
trips related to the corresponding census OD pair. By applying a linear
regression model it now becomes possible to identify the correlation between
the census and FEATHERS trips.
Figure 2 shows the results of the linear regression analysis in case all OD pairs
are included in the analysis. As can be seen on Figure 2 a strong linear
relationship is seen between the census observed number of trips and the
FEATHERS predicted number of trips indicating that FEATHERS replicates the trip
pattern as seen in the census across Flanders nicely. The linear regression
model yields an R2 of 0.9743 however care must be taken when interpreting this
regression result. As can be seen in the figure on the upper-right side, there are
4 OD pairs with a high number of trips as some major cities in Flanders attract
many trips. These OD pairs have a large impact on the regression model.

69
Therefore, in a second step, the same OD pairs, excluding the 4 high-value OD
pairs, are being used to perform a linear regression yielding an R2 of 0.8938
which still indicates a strong correlation between the census observed number of
trips and the FEATHERS predicted number of trips.
Figure 2 Predicted versus observed number of trips for each OD pair
Based on the linear regression models it can be concluded that the model inside
FEATHERS is able to replicate, to a large degree, the spatial trip pattern that can
be observed in the independent census. It suggests that the model has
successfully picked up the key conditions, contexts and rules that individuals use
to organize their daily trips. These findings, overall, show that FEATHERS can
predict observed work trip patterns quite well, even though the rules underlying
the model inside FEATHERS are based on data pertaining to a totally different
travel survey.
4.6.4 FEATHERS validation in terms of traffic counts and vehicle
kilometers travelled
The final phase of the validation process involves a validation of the assigned car
driver traffic demand after assignment to the road network. This is achieved by
modeled traffic volumes on network links with traffic counts from the field. Since
time-of-day modeling is performed within FEATHERS, 24 hourly matrices are at
one's disposal for the traffic assignment step and therefore the traffic counts
comparison will be made at the level of AM, PM and OP time slots.

70
Time slot R2
24 hours 0.782
AM - 07h 0.743
AM - 08h 0.749
PM - 16h 0.742
PM - 17h 0.758
OP 0.778
Table 2 Correlation of traffic counts versus traffic volumes for different time slots
Table 2 summarizes for a 24 hours day and for 5 different time slots of an
average day, the correlation, as expressed in R2 values, between modeled traffic
volumes on network links with observed traffic counts. As can be seen, R2 values
for the time slots range between 0.74 and 0.77. However, for 4-step models, a
suggested R2 value of more than 0.88 has been proposed in literature
(Assignment Procedures Travel Model Improvement Program, 2011, and Federal
Highway Administration, 2001).
At this point, an important remark is in place concerning the rather low value of
the R2 correlation. In this study, only the decision trees inside the FEATHERS
model are calibrated, i.e. trained, based on activity-based travel diaries. No
other kinds of calibrations based on traffic measurements were performed. Each
model part hands over its output to the next model part until the complete
sequence of the model chain has been walked through. Therefore, it is expected
that the FEATHERS model chain will result in a lower goodness-of-fit, achieved
between observed behavior and the base year prediction. However, in case
traffic counts were used in order to calibrate the activity-based model inside
FEATHERS, higher correlation values could have been anticipated. Recently it
has been demonstrated by Cools (2010) that it is by all means possible to
actively link activity-based models with traffic counts. Two approaches exist that
calibrate such models with traffic counts - an indirect and a direct approach. The
indirect approach tries to incorporate findings based on the analysis of traffic
counts into the components of the activity-based models. The direct approach
calibrates the parameters of the travel demand model in such a way that the
model replicates the observed traffic counts (quasi-) perfectly. This study
demonstrated that different options exist in fine-tuning activity-based models.
Therefore, it may be concluded that in case such a calibration process would be
established within FEATHERS, higher values for the R2 correlation can be
foreseen.

71
For the current situation, this rather low value for R2, which can be improved by
means of traffic counts calibration processes, does not cast a slur on activity-
based models since such kind of models do have significant advantages over
traditional 4-step and other kind of transport models. It is well-known from
literature that one of the major promises and reasons for existence of the
activity-based modeling approach is an increased sensitivity for scenarios that
are generally important in transport planning and policy making. In contrast to
trip-based and tour-based models, activity-based models are sensitive to
institutional changes in society in addition to land-use and transportation-system
related factors. Such changes may be related, for example, to work times and
work durations of individuals and opening hours of stores or other facilities for
out-of-home activities. It is this sensitivity to a very wide range of possible
changes that constitutes the attractiveness of the activity-based modeling
approach over other transport modeling approaches.
Reported VKT 46.71
Predicted VKT 45.03
Table 3 Reported VKT versus predicted VKT (x 109 km)
As a last part of the validation process the focus is put on vehicle kilometers
travelled. The total Vehicle Kilometers Travelled (VKT) is defined here as the
total number of kilometers travelled by road users on a yearly basis. It is a
function of the number of trips generated and the length of those trips, which
depend on the OD pairs and the route choice. Using FEATHERS, for every hour
of the day and for every day of the week, OD matrices can be generated and
assigned to the network. Once the OD matrices are assigned, for each hour and
for each day of the week, the traffic intensity on each link is known. By selecting
Flemish roads only and by aggregating the products of network link lengths and
traffic intensities on the associated links one can obtain the VKT for 1 specific
hour and day combination. By doing so for all 168 available OD matrices, thus
for every car mode OD matrix for every day of the week and for every hour of
the day, and by assuming that a simulation week is representative as an
average week across a year, total vehicle travel can be calculated. Table 3
shows the predicted total vehicle kilometers travelled for the 2007 base year
and compares it with the official reported values by the government for the
same year. As can be seen, the difference between both values is small implying
that predictions are close to reality.

72
4.7 Conclusion and discussion
This chapter presented the different steps in the operationalization of the first
static activity-based model implemented inside the FEATHERS framework. To
this end the ALBATROSS scheduling core was implemented and updated for the
Flemish region. In addition, data about the study area such as activity-based
diaries, population and environment data was collected and compiled in the
database structure of FEATHERS. Next to this operationalization, a validation on
different levels, i.e. model-, time-, space- and network level was performed.
Based on the validation results, it is concluded that the presented activity-based
model is able to realistically mimic the spatial and temporal dimension of
transportation demand in Flanders, as well as the evolution of the state of the
road network in both space and time. As the model performs well, a next step is
to investigate transportation demand management policies for Flanders.

73
References
Arentze, T.A., and Timmermans, H.J.P., 2005. The sensitivity of activity-based
models of travel demand: results in the case of ALBATROSS, In A. Jaszkiewicz,
M. Kacmarek, J. Zak, M. Kubiak(ed.): Advanced OR and AI methods in
Transportation, pp. 573-578.
Arentze, T.A., and Timmermans, H.J.P. ALBATROSS 2: A Learning-Based
Transportation Oriented Simulation System. European Institute of Retailing and
Services Studies. Eindhoven, The Netherlands, 2005.
Assignment Procedures Travel Model Improvement Program. Model Validation
and Reasonableness Checking Manual 7.0. U.S. Department of Transportation.
http://tmip.fhwa.dot.gov. Accessed July 20, 2011.
Beckman, R.J., Baggerly, K.A., and McKay, M.D., 1996. Creating synthetic
baseline populations. Transportation Research Part A: Policy and Practice, Vol.
30(6), pp. 415-429.
Bellemans, T., Kochan, B., Janssens, D., Wets, G., Arentze, T.A., and
Timmermans, H.J.P., 2010. Implementation framework and development
trajectory of the FEATHERS activity-based simulation platform. Transportation
Research Record, Vol. 2175, Washington D.C., U.S.A., pp. 111-119.
Cools, M., E. Moons, and G. Wets. 2010. Calibrating Activity-Based Models with
External Origin-Destination Information Overview of Possibilities. Transportation
Research Record, Vol. 2175, pp. 98-110.
Davidson, W., Donnelly, R., Vovsha, P., Freedman, J., Ruegg, S., Hicks, J.,
Castiglione, J., and Picado, R., 2007. Synthesis of first practices and operational
research approaches in activity-based travel demand modeling. Transportation
Research Part A, Vol. 41, pp. 464-488.
Federal Highway Administration. Model Validation and Reasonable Checking
Manual. Barti-Ashman Associates, Inc., Washington D.C., U.S.A., 2001
Guo, J., and Bhat, C.R., 2007. Population synthesis for micro simulating travel
behavior. Transportation Research Record, Vol. 2014, Washington D.C., U.S.A.,
pp. 92-101.
Kass, G.V., 1980. An exploratory technique for investigating large quantities of
categorical data. Applied Statistics, Vol. 29, pp. 119-127.
Kohavi, R., and Provost, F. Glossary of terms: Machine Learning. Kluwer
Academic Publishers, Boston, U.S.A., 1998.
MATSIM, Multi Agent Traffic SIMulation. http://www.matsim.org. Accessed July
20, 2011.

74
Nakamya, J., 2010 Creating Synthetic Data Sets for Micro simulation Models.
Ph.D. Dissertation, Hasselt University.
Pedersen, N., and Sandahl, D., 1982. Highway traffic data for urbanized area
project planning and design. Publication NCHRP Report 255. Transportation
Research Board of the National Academies, Washington D.C., U.S.A.

75
Chapter 5 An estimation of total vehicle
travel reduction in the case of telecommuting.
Detailed analyses using an activity-based
modeling approach
Concerning activity-based models, there are many conceivable practical
applications possible. Applications can range from aging scenarios, towards
public transport level of service scenarios, over opening hours scenarios,
towards travel-time and travel-costs scenarios. In this chapter, by means of the
activity-based model inside FEATHERS, a specific application is worked out about
an estimation of the total vehicle travel reduction in the case of a telecommuting
scenario. To this end, first a more traditional methodology for calculating
reductions as a result of telecommuting is elaborated on, where after the
outcomes of this method will be placed next to FEATHERS’ output. As will turn
out, based on the results, FEATHERS and its activity-based model generate
credibility so that in regard with this specific telecommuting scenario, FEATHERS
can be used for policy making.
This chapter is adapted from: Kochan, B., Bellemans, T., Cools, M., Janssens, D.,
and Wets, G., 2011. An estimation of total vehicle travel reduction in the case of
telecommuting. Detailed analyses using an activity-based modeling approach.
Proceedings of BIVEC, Namur, Belgium, May 25.
Transportation Demand Management (TDM) is often referred to as a strategy
adopted by transport planners with the goal to increase transport system
efficiency. One of the possible measures that can be adopted in TDM is the
implementation of telecommuting. A significant number of studies have been
conducted in the past to evaluate the effect of telecommuting on peak-period
trips. However it is less studied whether telecommuting also effectively and
significantly reduces total vehicle travel. For this reason, a conventional
modeling approach was adopted in this chapter to calculate total kilometers of
travel saved in the case telecommuting would materialize in the Flanders area.
In a second part, the chapter also introduces the use of an activity-based
modeling approach to evaluate the effect of telecommuting. By doing so, an
operational activity-based framework is externally validated by means of

76
another completely different model, both calibrated for the same application and
study area.
5.1 Introduction
According to a study by the United Nations (Anon., 2004), population growth will
show a significant rise in the years to come. Population growth together with
employment and motor vehicle growth in cities and even rural environments can
have a large effect on the region’s transportation system. Travel demand
management (TDM) is therefore seen as an important means to counteract
travel. Moreover, it increases the performance of the transportation system
through the encouragement and support of alternative modes of travel such as
carpooling, vanpooling, transit, bicycling, and walking. However, TDM also
endorses for example different work tables and reorganization of work
implementations such as flex-time work schedules, which can rearrange and roll
back demand on the transportation system.
The past decade showed a trend in increasing telecommunications technology.
The emergence of this technology offers employees the opportunity to work
from distant locations, other than the employer’s site. Employees choosing for
this type of work conditions are referred to as ‘telecommuters’. As a TDM,
telecommuting could offer some prospects for reducing trips, however it is not
clear whether telecommuting also effectively and significantly reduces total
vehicle travel.
At the start of the millennium, telecommuting has been adopted in nearly all of
the European countries. Many of these countries with an already relatively high
degree of telecommuting also experienced higher growth rates in the five year
period 2000 to 2005 (Welz and Wolf, 2010). Among these countries, the
percentage of telecommuters more than doubled in Belgium. The figures from
the previous study have been confirmed by Statistics Netherlands (Centraal
bureau voor statistiek, CBS) who came across the conclusion that the share of
companies employing telecommuters has doubled within four years (Statistics
Netherlands, 2009). Because of the growing interest in telecommuting, both by
employers and employees and because telecommuting could be used as a TDM,
it is interesting to investigate the impact of telecommuting on traffic in terms of
total vehicle travel.
This chapter therefore addresses the assessment of the impact of telecommuting
on traffic in terms of total vehicle travel by means of the activity-based
simulation platform FEATHERS (Bellemans et al., 2010). However, next to

77
FEATHERS another method for assessing the impact of telecommuting will be
employed so that both results can be compared.
5.2 The FEATHERS activity-based simulation
platform
Transportation problems are structurally multi-dimensional by nature. Indeed,
traffic congestions are related to CO2 emissions but they also have an influence
on for example the economy. At the same time the necessity for transportation
infrastructure is high due to globalization, urbanization, sprawl, etc. and in
addition to this governments cannot afford transportation hindrances to have a
negative impact on future competitiveness. However, changing the current
infrastructure is sometimes costly, there is not always a certainty for success
and changing infrastructure is not always easy or feasible due to existing spatial
zones, constitutional constraints by local and federal governments, etc.
Therefore, transportation models are often used as they can assist in ex-ante
management decision making and they can make predictions in unforeseen and
uncertain situations. Therefore, the goal of these models is to mimic reality as
close as possible.
In the past different approaches have been used, such as conventional trip-
based models where single trips are predicted following a simple 4-step
mathematical calculus (Ruiter and Ben-Akiva, 1978), without taking information
about timing or sequences of trips into account. Therefore these conventional
trip-based models were often replaced by tour-based models. While the tour-
based approach captures more of the behavioral interactions across trips, it can
still miss some important ones. For example, the mode of travel and departure
times for the work-based sub-tour will tend to be constrained by the mode of
travel and departure times for the home-based work tour that “surrounds” it.
Also, changes to one tour can also influence the aspects of other tours made
during the day. Activity-based models, on the other hand, aim at predicting
which activities are conducted where, when, for how long, with whom, the
transport mode involved and ideally also the implied route decisions. The major
advantages of this type of models is that (i) it can deal simultaneously with the
participation in various types of activities across the full day, which means that
inter-tour relations can be accounted for and (ii) a micro simulation approach is
often adopted which allows for taking into account a higher behavioral realism of
the individual agent in the model.

78
The activity-based scheduling model that is currently implemented in the
FEATHERS framework is based on the scheduling model that is present in
ALBATROSS (Arentze and Timmermans, 2005). Currently, the framework is fully
operational at the level of Flanders. The real-life representation of Flanders, is
embedded in an agent-based simulation model which consists of over six million
agents, each agent representing one member of the Flemish population. The
scheduling is static and based on decision trees, where a sequence of 26
decision trees is used in the scheduling process. Decisions are made based on a
number of attributes of the individual (e.g., age, gender), of the household (e.g.,
number of cars) and of the geographical zone (e.g., population density, number
of shops). For each agent with its specific attributes, it is for example decided if
an activity is performed. Subsequently, amongst others, the location, transport
mode and duration of the activity are determined, taking into account the
attributes of the individual.
5.3 Travel demand management strategies that can
be addressed within FEATHERS
It is well-known from literature that one of the major promises and reasons for
existence of the activity-based modeling approach is an increased sensitivity for
scenarios that are generally important in transport planning and policy making.
In contrast to trip-based and tour-based models, activity-based models are
sensitive to institutional changes in society in addition to land-use and
transportation-system related factors. Such changes may be related, for
example, to work times and work durations of individuals and opening hours of
stores or other facilities for out-of-home activities. Furthermore, the models
should not ideally only be sensitive to primary but also to secondary responses
to land-use and transportation-related changes that in the past have been
responsible for unforeseen and unintended effects of transport demand
measures by policy makers. Examples of a primary response are changing
transport modes, reducing frequency of trips or changing departure time. The
primary response can thus be defined as the choice of a strategy which is aimed
at reducing a negative impact or increasing a positive impact of the policy. A
secondary response then involves adaptations which are required to make the
broader activity pattern consistent with the change. Typical examples of such
possible effects are an increase of out-of-home social activities in response to
measures stimulating telecommuting or an increased use of cars for shorter trips
as a secondary effect of stimulating car-pooling for trips to work (car stays at

79
home and can then be used by other members of the household). Also, by
means of example, switching from car to public transport for trips to work may
limit the possibilities for trip chaining and hence induce extra separate trips as a
secondary response.
Potentially, activity-based models should be sensitive to several groups of TDM,
including: population, schedule, opening-hours, land-use measures as well as
travel costs and travel times scenarios. As Arentze and Timmermans (2005)
described, in terms of population scenarios, several large trends can be
potentially evaluated, for instance the increasing participation of women in the
labor force, the increasing number of single-adult households resulting in a
decreasing average number of persons per household, the increasing household
income as a consequence of general economic growth, the aging of the
population in terms of graying and de-greening, the increasing number of cars
per household etc. Also institutional changes in society, for instance by means of
the implementation of a workweek or work start time changes can be modeled
in an activity-based framework. A similar application is the widening and
shortening of opening hours of for instance service related facilities. Not only
time-specific measures can be evaluated, but also spatial scenarios can be
computed. For instance, there might be a need to evaluate the result of an
increasing spatial separation of locations for residence, work and facilities as a
consequence of sub-urbanization or alternatively, a concentration of facilities in
commercially attractive neighborhoods. Finally, typical travel-time or pricing
scenarios can be computed by means of the new operational activity-based
models.
However, in addition to the more traditional policy measures mentioned above,
the applicability of TDM can be increased to environmental and health effects,
using the activity-based paradigm as a starting point. Indeed, general traffic
policy measures influence road safety, emissions and human health in an
indirect way, i.e. indirectly through exposure. First results, using an activity-
based model for analyzing emission and health impacts, have been reported in
Beckx et al. (2007).
5.4 Estimating the impacts of telecommuting on
travel: Method of Mokhtarian
Before explaining the employment of the FEATHERS system to calculate a
possible reduction in travel, another method is being used as a benchmark. One
such method, by Mokhtarian (1998) allows one to estimate the impacts of

80
telecommuting on travel, given a series of variables. The model consists of two
parts. In the first part an estimation is made of the current number of
telecommuters based on the total number of employees and the possibility and
willingness of the employees to implement telecommuting. The second part
estimates the reduction in total vehicle travel by telecommuters which will
subsequently be expressed as a percentage with respect to the total vehicle
travel in Flanders on one working day. In the next section the different
calculation steps of the model are elaborated.
5.4.1 Introduction
Before explaining the employment of the FEATHERS system to calculate a
possible reduction in travel, another method is being used as a benchmark. One
such method, by Mokhtarian (1998) allows one to estimate the impacts of
telecommuting on travel, given a series of variables. The model consists of two
parts. In the first part an estimation is made of the current number of
telecommuters based on the total number of employees and the possibility and
willingness of the employees to implement telecommuting. The second part
estimates the reduction in total vehicle travel by telecommuters which will
subsequently be expressed as a percentage with respect to the total vehicle
travel in Flanders on one working day. In the next section the different
calculation steps of the model are elaborated.
5.4.2 Calculation steps
Table 1 lists all the different steps for calculating the reduction in total vehicle
travel in the case of telecommuting.
The model starts with the number of employees during an average work day (E).
This first determinant equals to 2504000 for Flanders in 2002.
A study performed by Empirica (Kordey, 2002) showed that the proportion of
employees that are able and willing to telecommute (C) amounted to 10.6% for
Belgium in 2002. Since there are no data available for the number of
telecommuters in Flanders, the data for Belgium is used in this model (Kordey,
2002).
According to a study performed by Walrave and De Bie (2005) 53.3%
telecommute less than 1 time per week, 21.3% 1 to 3 days per week and 25.2%
more than 3 days per week. This means that for telecommuting employees, the

81
average telecommute frequency (F), equals 1.8 days per week or 36% of the
work week.
Variable Definition Result
E The number of employees during an average work
day 2504000
C Proportion of employees that are able and willing to
telecommute 0.106
F Average telecommuting frequency 0.36
O The expected number of telecommuters during an
average work day 95553
D Average back and forth home-work distance during
a non-telecommuting work day 57 km
α Proportion of the number of telecommuting
opportunities that eliminates a home-work trip 0.501
V The total eliminated home-work distance during an
average work day 2728707 km
P The net change in total vehicle travel as a
proportion of the total vehicle travel during an average work day
-0.016
Table 1 The impact of telecommuting on travel (method of Mokhtarian)
The expected number of telecommuters during an average work day (O) is
calculated by multiplying all preceding variables, that is O = E x C x F. For study
area Flanders this multiplication equals 95553 telecommuters per work day.
According to the Flemish study OVG (Zwerts and Nuyts, 2002) the average
home-work distance amounts to 19 km. This means that, on average,
employees cover 38 km between the home location and the employer’s premises.
However, other studies also indicate that on average telecommuters live further
away from their actual place of work when compared to non-telecommuters
(Pidaparthi, 2003). Therefore, a factor of 1.5 is being considered as a correction
factor (Verbeke et al., 2006). Because of this factor the average back and forth
home-work distance during a non-telecommuting work day for telecommuters
equals to 57 km.
The proportion of the number of telecommuting opportunities that eliminates a
home-work trip (α) is calculated by dividing the share of car drivers by the
average seat occupancy. According to OVG (Zwerts and Nuyts, 2002) 68.6% of
employees use transport mode car as an option to commute. In addition to this,
Statistics Belgium (Anon., 2002) reports a seat occupancy of 1.369 so that
variable α equals to 0.501.
The total eliminated home-work distance during an average work day (V) is
calculated by multiplying the expected number of telecommuters during an

82
average work day (O) with the eliminated home-work distance (αD) as a result
of telecommuting. For Flanders this yields 2728707 of eliminated home-work
kilometers during an average work day.
The net change in total vehicle travel as a proportion of the total vehicle travel
during an average work day (P) is calculated according to following formula: V x
5 / (R x M) where R stands for the number of persons in Flanders in possession
of a driver's license and M stands for the average distance in kilometers per
capita in possession of a driver’s license during a calendar week. In Flanders, in
2002, approximately 4043573 persons had a driver's license (Zwerts and Nuyts,
2002) and the average distance in kilometers came to 210 km. On the basis of
these data the net change in total vehicle travel as a proportion of the total
vehicle travel amounts to 1.6%. This means that in 2002, in Flanders, the total
travel distance decreased with 1.6% as a result of telecommuting.
5.5 Estimating the impacts of telecommuting on
travel: FEATHERS
5.5.1 Introduction
A second approach for calculating the impacts of telecommuting is based on the
Activity-Based model FEATHERS. This method first aggregates travel demand in
OD matrices and subsequently assigns these OD matrices to a transportation
network. This method is followed by the calculation of the total vehicle travel for
a null scenario and for a telecommuting scenario. Afterwards both the null and
telecommuting scenario are compared so that the change in total vehicle travel
can be obtained.
Since FEATHERS is run for a specific day, 7 predictions are worked out and
averaged for a week so that the reduction in vehicle travel can be compared
with the first method.
5.5.2 Implementation of the telecommuting scenario
Currently the FEATHERS framework incorporates the core of the ALBATROSS
Activity-Based scheduler. This scheduler assumes a sequential decision process,
consisting of 26 decision trees, that intends to simulate the way individuals solve
scheduling problems.
The scheduler first starts with an empty schedule or diary where after it will
evaluate whether or not work activities will be included. If this is the case, then
the number of work activities will be estimated (1 or 2 work activities), their
83
beginning times, their durations and also the time in-between the work activities
in case 2 work activities are present.
In a second step the locations of the work activities are determined. The system
sequentially assigns locations to the work activities in order of schedule position.
This is done by systematically consulting a fixed list of specific decision trees.
After the locations of the work activities have been determined, the
telecommuting scenario comes into play. A dedicated procedure randomly
selects employees as telecommuters and assigns a new location to the work
location(s) in the schedule. The proportion of telecommuters selected is exactly
the same as for the first method, namely C x F = 0.038. Furthermore, the
selection procedure also takes into account the fact that telecommuters show an
average back and forth home-work distance during non-telecommuting work
days that equals to 57 km. This last assumption is necessary to make a correct
comparison with the first method.
After the selection of telecommuters has been done, their work location(s) will
be replaced by the home address and their schedules will be updated with this
new information. This way telecommuters work at home instead of the usual
employer’s premises.
Now that telecommuting has been enforced, the scheduler returns back to
normal scheduling and proceeds with the next decision steps, that is: selection
of work related transport modes, inclusion and time profiling of non-work fixed
and flexible activities, determination of fixed and flexible activity locations and
finally determination of fixed and flexible activity transport modes.
5.5.3 Derivation of OD matrices
The output of FEATHERS consists of activity-travel diary data sets for 7 days for
both the null and telecommuting scenario. These diaries include several modes
of transport, however, since we focused on car mode only in the first method,
only trips done by car are taken into account.
For each hour of the day and for each day of the week, these diary data sets are
processed yielding 168 OD matrices when focused on car mode only. This large
amount of OD matrices will then serve as input for the traffic assignment part.
5.5.4 Traffic assignment
Traffic assignment models are used to estimate the flow of traffic on a network.
These models take as input a matrix of flows that indicate the volume of traffic

84
between origin and destination pairs. The flows for each OD pair are loaded onto
the network based on the travel time or impedance of the alternative paths that
could carry this traffic.
A wide variety of traffic assignment methods exist. A well-known assignment
method is the All-or-Nothing assignment, which uses a shortest path method to
assign traffic to the network. This method, however, ignores the fact that link
travel times are flow dependent. Therefore, for this study, an equilibrium traffic
assignment model was selected. This kind of traffic assignment uses an iterative
process to achieve a convergent solution in which no travelers can improve their
travel times by shifting routes. In each iteration, network link flows are
computed which incorporate capacity effects and flow-dependent travel times.
Figure 1 Equilibrium traffic assignment in Flanders
As an illustration, figure 1 shows the equilibrium traffic assignment of the
FEATHERS output for 8 o’clock on Monday.
5.5.5 Calculation steps
Once the OD matrices are assigned for each scenario, for each hour and for each
day of the week, the traffic intensity on each link is known. By selecting Flemish
roads only and by aggregating the products of network link lengths and traffic
intensities on the associated links one can obtain the total vehicle travel for 1
specific hour and day combination. By doing so for all 168 OD matrices and by

85
assuming that each simulation day is representative as an average day across a
year, total vehicle travel can be calculated.
Null scenario Telecommuting
Day vkm (10^9) vkm (10^9) Difference (%)
Mon 0.137 0.134 -1.96
Tue 0.141 0.138 -1.89
Wed 0.135 0.132 -2.16
Thu 0.138 0.135 -2.11
Fri 0.136 0.134 -1.96
Sat 0.119 0.118 -0.95
Sun 0.102 0.102 -0.31
Total sum 0.909 0.894 -1.68
Table 2 Total vehicle travel by car
Table 2 summarizes these calculations from Monday till Sunday. If the total
vehicle travel for the telecommuting scenario is compared with the null scenario
situation then we can highlight a reduction of 1.68%.
5.5.6 Additional micro simulation analyses in FEATHERS
As can be observed in literature and among transportation researchers, some
proponents of the activity-based paradigm claim that activity-based models tend
to be better suited for predicting travel behavior, supporting the notion that
aggregate models ignore important behavioral distinctions across the population.
In this chapter, while comparing vehicle travel reductions based on the
outcomes of the traditional method presented by Mokhtarian and the more
complex method brought by FEATHERS, only aggregated vehicle travel
reductions were calculated simply because of the fact that the method of
Mokhtarian is aggregated by nature. However, as FEATHERS accommodates an
activity-based model, more detailed calculations concerning vehicle travel
reductions can be made. Therefore, in this paragraph, additional and more
detailed analyses will be made on the output of FEATHERS. However, before
considering vehicle travel reductions, first general tendencies in differences in
travel behavior with regard to regular workers and teleworkers will be examined.
Figure 2 shows the distribution of the share in persons performing n trips per
schedule, for all persons in the FEATHERS population. In this graph, regular
workers are placed next to teleworkers. This way, interesting differences can be
seen between workers and teleworkers. First of all, when having a look at the

86
general pattern, the share of teleworkers executing n trips monotonously
decreases with increasing number of trips per schedule. Whereas regular
workers show an exception in this monotonous decrease in the case of 4 trips
per schedule. Apparently there are more regular workers performing 4 trips than
3 trips.
Figure 2 Number of trips distribution: Work vs. Telework
A second phenomenon that can be found is the fact that there are more
teleworkers than regular workers that perform non-work related trips, in case
the number of trips per schedule is rather low. When the number of non-work
related trips is higher, starting from 3 non-work trips per schedule, then there
are approximately as many teleworkers as regular workers.
Figure 3 reveals the difference in behavior between regular workers and
teleworkers when having a look at the share of persons performing n tours per
schedule. As can be seen, in general, there are more workers performing n tours
than teleworkers. This is a very intuitive result, as it might be expected that
workers at least have to perform a single work trip in order to arrive at their
work premises.

87
Figure 3 Number of tours distribution: Work vs. Telework
The graph depicted below, in figure 4, shows the distribution of the number of
persons performing n trips in their tours. As can be seen clearly, there are more
teleworkers than workers performing 2 trips in a tour.
Figure 4 Number of trips in tour distribution: Work vs. Telework

88
Furthermore, there seems to be an approximately equal share of persons
performing 3 trips in a tour, while, as the graph shows, there are less
teleworkers than workers performing 4 and more trips. Also this result is very
intuitive as we can expect that workers combine more activities in their path to
their work premises or while going back to home. Such activities might be
bring/get, daily shopping, non-daily shopping, leisure, services and other
activities.
Figure 5, depicted below, shows the distribution of the share in activity
sequences in a schedule for all persons in the FEATHERS population. As can be
seen in this graph, teleworkers perform different kind of tours when compared
with regular workers. As the graph shows, workers tend to perform a lot of only-
work related tours. The same workers will also try to combine work activities
with other kind of activities such as bring/get, flexible and other activities.
Teleworkers on the other hand will especially perform only-non-work related
trips, even much more than in the case of regular workers. Also this result is
plausible as it might be expected that regular workers will try to combine their
work related trips with non-work related trips, meaning that the share of
persons performing only-non-work trips will be much lower.
Figure 5 Tour activity sequence distribution: Work vs. Telework (Legend: 1 = Work, 2 = Bring/get, 3 = Flexible activity, 4 = Other activity)

89
Now that some differences of travel behavior between regular workers and
teleworkers have been demonstrated by means of a micro-simulation framework,
the original problem statement of proving that it is possible to calculate
disaggregated vehicle travel reductions according to different kind of dimensions
with a micro simulation framework like FEATHERS, can be resumed.
Day Gender Null scenario Telecommuting Difference (%)
Monday Male 50.73 15.77 -68.92
Female 41.84 10.55 -74.78
Tuesday Male 49.12 15.56 -68.32
Female 41.93 10.52 -74.91
Wednesday Male 49.74 15.71 -68.41
Female 42.71 11.46 -73.17
Thursday Male 50.98 16.23 -68.17
Female 42.35 11.47 -72.93
Friday Male 50.03 15.95 -68.12
Female 42.65 11.41 -73.25
Saturday Male 60.55 25.95 -57.15
Female 44.53 12.70 -71.47
Sunday Male 59.80 24.62 -58.83
Female 44.30 13.33 -69.91
Table 3 Total trip length (km) by car in schedule according to gender
To this end an example of a disaggregation of the vehicle travel reductions
according to gender is worked out in table 3. As shown, this table gives an
indication of the average reductions in travelled kilometers driven by car per day
in case of a null-scenario and the telecommuting scenario. As can clearly be
seen for all days is that females, compared to men, tend to drive less according
to the null-scenario, however their vehicle travel reductions overall are higher
when compared to men. This is a result that cannot be derived from traditional
aggregated methods like the one worked out in this chapter. Therefore, these
calculations based on FEATHERS, prove that micro-simulation activity-based
models have significant advantages over traditional aggregated methods.
5.6 Conclusions
This chapter presented the calculation of the reduction in total vehicle travel for
two entirely different methods. Nonetheless, the outcomes are quite similar. The
first method shows a reduction in vehicle travel of 1.6% whereas the second
approach, based on the Activity-Based modeling framework FEATHERS, displays
a reduction of 1.68%. This can be seen as an extra validation result for

90
FEATHERS specifically but it also gives a lot of credibility in the application of
Activity-Based models in general when dealing with travel demand management
strategies.
Secondly, because of the usage of an Activity-Based model for calculating the
total vehicle travel reduction, it is now also possible to obtain the reductions not
only on a weekly basis, but also on specific days and even specific hours. This is
hard to do with the more conventional straight-forward models such as the one
used in this study.
Thirdly and lastly, because Activity-Based models are able to differentiate
between many household and person characteristics such as gender, age,
number of cars, etc., it is also possible to explore the effect or impact of a
scenario such as telecommuting according to these characteristics. And this last
observation is what makes Activity-Based transportation models a powerful tool.

91
References
Anon., Statistics Belgium, www.statbel.fgov.be, 2002.
Anon., World Population to 2300, New York: United Nations, The Department of
Economic and Social Affairs, 2004.
Arentze, T.A., and Timmermans, H.J.P. ALBATROSS 2: A Learning-Based
Transportation Oriented Simulation System. European Institute of Retailing and
Services Studies. Eindhoven, The Netherlands, 2005.
Arentze, T.A., and Timmermans, H.J.P., 2005. The sensitivity of activity-based
models of travel demand: results in the case of ALBATROSS. In A. Jaszkiewicz,
M. Kacmarek, J. Zak, M. Kubiak(ed.): Advanced OR and AI methods in
Transportation, pp. 573-578.
Beckx, C., Int Panis, L., Arentze, T.A., Timmermans, H.J.P., Janssens, D., and
Wets, G., 2007. Applying an activity-based modeling framework to the
evaluation of vehicle exhaust emissions. Proceedings of the 10th International
Conference on Computers in Urban Planning and Urban Management, Iguassu,
Brazil.
Bellemans, T., Kochan, B., Janssens, D., Wets, G., Arentze, T.A., and
Timmermans, H.J.P., 2010. Implementation Framework and Development
Trajectory of the FEATHERS Activity-Based Simulation Platform. Transportation
Research Record, Vol. 2175, pp. 111-119.
Kordey, N. Verbreitung der Telearbeit in 2002. Internationaler Vergleich und
Entwicklungstendenzen, www.empirica.com, 2002.
Mokhtarian, P.L., 1998. A synthetic approach to estimating the impacts of
telecommuting on travel, Urban Studies, pp. 215-241.
Pidaparthi, P. Do You Work From Home? Studying the Travel Behavior of
Telecommuters, University of Minnesota, 2003.
Ruiter, E., and Ben-Akiva M., 1978. Disaggregate travel demand models for the
San Francisco bay area. Transportation Research Record, Vol. 673, pp. 121-128.
Statistics Netherlands, Share of companies employing teleworkers has doubled
within four years, www.cbs.nl, 2009.
Verbeke, A., Dooms, M., and Illegems, V. De impact van telewerken op de
verkeersexternaliteiten in Vlaanderen. Brussel: Vrije Universiteit Brussel, Solvay
Business School, Vakgroep Bedrijfseconomie en Strategisch Beleid, 2006.
Walrave, M., and De Bie, M. Teleworking@home or close to home. University of
Antwerp, faculty political and social sciences, 2005.

92
Welz, Ch., and Wolf, F., Telework in the European Union. European Foundation
for the Improvement of Living and Working Conditions,
www.eurofound.europa.eu, 2010.
Zwerts, E., and Nuyts, E., Onderzoek Verplaatsingsgedrag Vlaanderen.
Diepenbeek: Provinciale Hogeschool Limburg, 2002.

93
Chapter 6 Using activity-based modeling to
predict spatial and temporal electrical vehicle
power demand in Flanders
As in the previous chapter, also in this chapter an application of FEATHERS and
its current activity-based model is discussed. Here, activity-travel schedules
predicted by the activity-based model inside FEATHERS are used in order to
predict energy demand and power peaks due to electric vehicle charging as a
function of time and location for several electric vehicle market penetration
scenarios and pluggable hybrid electric vehicle / battery-only electric vehicle
ratios. This electric vehicle scenario can fully take advantage of the fine spatial
and temporal detail in the travel demand forecasts by FEATHERS, and can in
turn provide electric vehicle researchers with more accurate predictions. This
scenario is more advanced and demonstrates that the range of applications of
FEATHERS can be very wide. This scenario also proves that FEATHERS is
designed not only for research purposes but also for more general application.
This chapter is adapted from: Knapen, L., Kochan, B., Bellemans, T., Janssens,
D., and Wets, G., 2012. Using activity-based modeling to predict spatial and
temporal electrical vehicle power demand in Flanders. Forthcoming in:
Transportation Research Record: Journal of the Transportation Research Board
Electric power demand for household generated traffic is estimated as a function
of time and space for the region of Flanders. An activity-based model is used to
predict traffic demand. Electric vehicle (EV) type and charger characteristics are
determined on the basis of car ownership and by assuming that EV categories
market shares will be similar to the current ones for internal combustion engine
vehicles (ICEV) published in government statistics. Charging opportunities at
home and work locations are derived from the predicted schedules and by
estimating the possibility to charge at work. Simulations are run for several EV
market penetration levels and for specific BEV/PHEV (battery-only/pluggable
hybrid electric vehicle) ratios. A single car is used to drive all trips in a daily
schedule. Most of the Flemish schedules can be driven entirely by a BEV even
after reducing published range values to account for range anxiety and for the
over-estimated ranges resulting from tests according to standards. The current

94
low tariff electricity period overnight is found to be sufficiently long to allow for
individual cost optimizing while peak shaving overall power demand.
6.1 Introduction
The economy’s dependency on fossil combustibles is attempted to be decreased
for both environmental and strategic reasons. Resulting effects are an expected
increase of electric vehicle (EV) use and use of alternative sources for electric
energy production. Sustainable electric energy sources (wind, solar) deliver
power at variable rates that cannot easily be predicted. Furthermore, storing
electric energy is a major problem.
The use of EV generates challenging questions but also opportunities: when EV
are used in a vehicle to grid (V2G) configuration, they can serve as electric
energy storage devices. Designing and operating an electricity grid having lots of
small unpredictable producers combined with relocatable storage capacity that is
time dependent, is a complex problem.
The problem receives more than pure technical attention. White-House-NSTC
(2011) states: President Obama has set a national goal of generating 80% of
[the] electricity from clean energy sources by 2035 and has reiterated his goal
of putting one million electric vehicles on the road by 2015.
6.2 Activity-based models to predict energy demand
by electric vehicles
Activity-based modeling predicts daily schedules for people based on the
behavioral characteristics for each individual. As a result, each individual actor
can be designed to adapt in its own specific way to changes applied in scenarios
when using feedback mechanisms during simulation. Activity-based models
therefore allow for policy evaluation. The schedules generated by activity-based
models contain information about the transport modes used and about the
activity type, activity duration and activity location. As a result they provide the
tools to investigate the feasibility of goals like the one stated in White-House-
Nstc (2011) both by modeling in a closed loop, individual behavior change
(adaptation) and the effect thereof on the public infrastructure.
This chapter explores the case for Flanders. The region counts 6 million
inhabitants on 13000 square kilometers and is part of Belgium (Europe) (11
million inhabitants on 30000 square kilometers). The area is subdivided in 2368
zones. A synthetic population of actors has been built to mimic each inhabitant

95
of the study area. Actor behavior is determined by characteristics of the
surroundings like road transportation network, distance between locations suited
for specific types of activities, public transport availability, delays induced by
congestion. The FEATHERS activity-based modeling framework described in
Bellemans et al. (2010) has been used. Within FEATHERS, actor behavior is
modeled by 26 decision trees, each one of which takes as input attributes of
both the individual actor and the environment as well as the outcome of
decisions already made. The decision trees have been trained by means of the
CHAID method using data from regional time specific travel behavior OVG
surveys. A single survey covers up to 8800 respondents. The decision trees are
used to predict (in the order specified) attributes for work episodes, work
locations, work-travel mode, fixed non-work activities, flexible non-work
activities, non-work locations, non-work-travel mode. At this moment FEATHERS
does not adapt actor behavior to car type (ICEV, EV). Car type is determined
after schedule prediction. Resulting schedules are used to predict time and
location for travel related electric energy consumption.
First it will be explained what hypotheses about EV drivers behavior have been
made and how EV characteristics have been determined from literature and from
available statistical data. Next, calculation details are described. Finally, results
for the Flemish region are presented: area specific energy and power
requirements as a function of time identify critical parts in the electric grid. The
fraction of the household transportation market that can be served by EV
without range extenders, is calculated.
6.3 Related work
Many research projects are driven by the goals to reduce greenhouse emissions.
Recently European research has been focusing on the problem of matching the
supply and demand of electric energy from sustainable sources (solar, wind). Cui
et al. (2011) used a car selection model, a budget prediction model and an
agent based simulator (stigmergy) to predict pluggable hybrid electric vehicle
(PHEV) market penetration for Knox County (190000 households). Davies and
Kurani (2011) predicted the electric power demand for the PHEV used by 25
households from data recorded in an experiment and from a PHEV car design
game conducted by the households: the effect of work location charging is
simulated. Kang and Recker (2009) and Recker and Kang (2010) used an
activity-based model for California based on statewide travel diaries and several
charging scenarios to predict the power demand for the whole area as a function

96
of time. Bliek et al. (2010) described how PowerMatcher predicts electric energy
in a smartgrid containing small unpredictable solar and wind energy sources and
tries to match supply and demand using an agent based auction for electric
energy. Clement-Nyns et al. (2009) evaluated coordinated charging strategies
for a Belgian case. In such systems customers need to specify time limits for
charging (which can be produced by activity-based models). Waraich et al.
(2009) evaluated energy tariff effects on charging behavior for the city of Berlin
by coupling MATSim-T (travel demand simulator framework) to PMPSS (PHEV
Management and Power Systems Simulation). Binding and Sundstroem (2011)
described an agent-based simulator for an auction based energy pricing system
aimed at matching sustainable power supply and demand: they planned to
integrate the V2G (Vehicle to Grid) concept to temporary store energy in car
batteries. Hadley and Tsvetkova (2008) predefined a charging profile and
analyzed the effect on power demand when applying it to 13 US regions at
different times of the day.
6.4 Smart grids and transport engineering
Smart grids are required when trying to meet electric energy demand in
networks containing many small production units exposing difficult to predict
behavior (solar, wind energy). Several techniques are used to try smoothing
power requirement over time and to adapting it to uncontrollable time
dependent production. With central coordination based schemes, the energy
provider is allowed to turn on/off electric loads remotely. Other schemes rely on
intelligence local to the consumer to determine electric demand at any moment
in time: auction based configurations try to adapt demand to production by
negotiating location specific prices every 15 minutes. Each one of those schemes
requires intelligent components but also a lot of information about the
environment and efficient adequate short time forecasting techniques. Activity-
based models in transport engineering can contribute to the problem solution by
creating adequate tools to forecast the energy and power demand as a function
of time and location in order to decide when and where energy can be delivered
proactively or stored in batteries for later retrieval. Several papers mentioned
under section Related Work predict energy demand: they do so either for a
small population or as an aggregated value for a wide region. Related work on
smartgrid design, shows that the auction based pricing system simulators need
predictions about when and where electric power is demanded. Therefore, this

97
paper estimates the electric energy and power requirements for Flanders using
activity based modeling.
6.5 Electric energy demand evolution – Power
demand
6.5.1 Energy demand
According to several sources (Parque et al., 2009, and Perujo et al., 2010) the
total amount of energy drawn from the grid by electric vehicles is relatively
small: a 30% market share EV would represent 3% of the total annual electric
energy consumption for the region of Milan, Italy.
For a Flemish household, the estimated yearly amount of electric energy
required by the car (0.2 kWh/km, 15000 km) is of the same order of magnitude
as the amount of electric energy consumed by the household for other purposes
(current electric energy consumption value). According to figures published on
Oxford University Environmental Change Institute website (UO_ECI, 2011) the
average yearly consumption for a Belgian household amounts to 3899
[kWh/year]. A similar figure (3500 [kWh/year]) for Belgium is mentioned by
EABEV (2010). As a consequence, the relative contribution of transport in the
overall demand, will grow significantly with increasing EV market penetration.
The evolution of electric energy demand per sector for Belgium is given by
Ramage (2007). Total consumption in 2005 was 80.2 TWh. The transport sector
contribution increases but amounted to only 2.12% in 2005. According to
several sources (Ramage et al., 2010, and Parque et al., 2009) the energy
demand by EV is not expected to cause problems on the electricity grid provided
it is distributed over time.
6.5.2 Power demand
Activity-based models help to assess where and when peak power demand
would exceed limits imposed by the grid. Perujo and Ciuffo (2010) studied power
demand for the Milan region using the assumptions that people will not charge
their car batteries everyday but only when needed and that charging starts
between 16:00h and 19:00h in the evening obeying a uniform distribution over
time. Parque and Ciuffo (2009) recognize the need for statistical values
(estimated distributions) on daily commuter trips for a particular region. The
study presented in this chapter uses activity-based modeling to calculate
charging time and location resulting in a prediction of EV power demand.

98
6.6 The use of activity-based models
Electric energy demand estimates require detailed data about location and
timing as well as trip purpose and activity information for each simulated
individual. This chapter investigates following scenarios for charging of both
battery-only EV (BEV) and pluggable hybrid EV (PHEV) in order to calculate peak
power demand as a function of time and location starting from FEATHERS
predicted schedules:
• Scenario EarlyLowTariff: people start charging as soon as possible
during the low tariff period (night-time, reduced-rate electricity).
• Scenario UniformLowCost: people start charging at a uniformly
distributed moment in time but so that their cost is minimal (maximum use
of low tariff period).
• Scenario LastHome: people start charging batteries as soon as the car
gets parked at the last home arrival of the day irrespective of any low-tariff
period.
• Scenario AlwaysAtHome: people charge batteries immediately after
each home arrival.
In all cases, charging period is assumed to be contiguous (uninterrupted) which
means that no auction based dynamic pricing for fifteen minute charging blocks
has been considered. Furthermore we hypothesize that everyone recharges
batteries everyday due to range anxiety and furthermore that all cars are
charged at home with additional charging at the work location in well defined
cases only.
6.7 Electric vehicle fleet attributes
Since the EV market is only emerging, predictions cannot be based on extensive
statistics. The assumptions in this chapter are explained and argued below.
6.7.1 Vehicle categories
Electric cars are subdivided into the categories small, medium, large similar to
what is done in Perujo (2010).
In order to estimate the energy requirement, one needs to know the
contribution of each category to the complete vehicle fleet. Belgian government
statistics provide the distribution of registered cars along a classification based
on the ICEV cylinder volume. We state the one-to-one mapping of categories

99
given in table 1 that shows market share and technical characteristics for each
category. Vehicle characteristics in the table have been derived from data in
Perujo (2010) and Nemry (2009), the market share figures have been taken
from the Belgian federal government 2009 Transport Indicator statistics (Federal
Planning Bureau, 2009).
Vehicle categories
Equivalent engine cylinder
volume [cc] (ICEV
category)
V<1400 1400<V<2000 2000<V
Market share 0.496 0.364 0.140
EV category small medium large
Battery capacity (kWh) 10 20 35
Range (km) 100 130 180
Energy consumption
(kWh/km): lower limit
0.090 0.138 0.175
Energy consumption
(kWh/km): upper limit
0.110 0.169 0.214
Charger type at home:
prob(3.3[kW])
0.8 0.4 0.1
Charger type at home:
prob(7.2[kW])
0.2 0.6 0.9
Charger type at work:
prob(3.3[kW])
0.1 0.1 0.1
Charger type at work:
prob(7.2[kW])
0.9 0.9 0.9
Table 1: Correspondence between EV and ICEV for categories specified in Belgian Government statistics.
6.7.2 Available chargers
Locally available 3.3 [kW] and 7.2 [kW] chargers are considered. Our model
distinguishes between home and work location chargers. Charger type
occurrence probability is given in table 1. The power value for home chargers is
assumed to depend on the car category: smaller cars are equipped with a less
powerful charger. On the other hand, companies offering car charging facilities
are assumed to provide powerful chargers in order to save time and to extend
the distance that can be bridged during one day. The company investment in a
powerful charger is assumed to be a profitable one.
6.7.3 Company cars in Belgium
Employers are believed to allow company car (CC) drivers to charge at the work
location because it is less expensive than providing fuel cards to employees.
However, for technical reasons, not all companies can provide the required

100
infrastructure. The fraction of actors who can charge batteries at the work
location has been determined as a fraction of company car drivers. It has been
assumed that 50% of the CC drivers can charge at the work location.
The activity-based model inside FEATHERS predicts trips and provides
information about car availability but not about car ownership (private vs.
company owned). In order to estimate the number of people able to charge
batteries at the work location, we need to estimate the fraction of work trips
traveled by company car. The COCA (Company Car analysis) report (Cornelis et
al., 2007) states that depending on the context, multiple definitions of a
company car are in use because both fiscal and operational aspects are
concerned. The COCA definition (A company car is made available by a company
to an employee for both professional and private use) is used in our study. The
same COCA report states that, based on two Belgian reports, OVG for Flanders
and ERMMW for Wallonia, it can be concluded from data up to 2005, that 6% to
7% of the car fleet in use by Belgian households, is company owned (Cornelis et
al., 2007). The OVG42 report (Cools et al., 2011) estimates the fraction of
company cars available to households in 2009 to 10%.
The model presented in this chapter assumes that 10% of the actors driving to
work, make use of a company car. Cars used in schedules without any work
trips, are assumed to be privately owned cars (POC).
6.7.4 Relation between EV ownership and EV type
The portions of EV being PHEV are assumed to differ between privately owned
and company cars. Currently no data about the respective expected market
shares are available. PHEV rates 0.0, 0.5 and 1.0 for both CC and POC have
been combined to run simulations.
PHEV do not have practical range limitations but long All-Electric-Range (AER)
versions are more expensive than BEV. Temporal unavailability of a car induces
high hourly costs for a company: the investment in a more expensive PHEV is
assumed to be a profitable one. Private owners, on the other hand, are assumed
to be more reluctant against large initial investments for private use.
6.8 Simulations
6.8.1 Method overview
The FEATHERS activity-based modeling framework (Bellemans et al., 2010)
created by the Transportation Research Institute (IMOB) has been used to

101
generate activity-travel schedules (daily agendas for each individual of the
Flemish population). Each schedule consists of trips and activities. For each trip,
departure time, trip duration, origin and destination zones are predicted. For
each activity, the purpose (e.g. work, shopping, bring-get, etc.) is predicted. In
this study, only work and non-work activities are distinguished. FEATHERS
results apply to a single 24-hour period. A working day simulation has been used.
Energy and power demand are computed from FEATHERS results as follows. In a
first step, schedules having at least one car trip are extracted and data
structures are set up. In the second step, car ownership, possibility of work
location charging, car characteristics (range, distance specific energy
consumption, battery capacity) and the types of home and work location
chargers used, are determined. Both a BEV and a PHEV belonging to a same
category, are assigned to the schedule. A feasibility indicator is calculated which
tells whether or not the schedule can be executed using the assigned BEV
electric car (PHEV always is feasible since the internal combustion engine (ICE)
always is available as a range extender). Each individual schedule is assumed to
be executed using a single car and a predefined fraction of the company cars
can get recharged at the work location. The set of schedules is partitioned as
specified in figure 1.
Figure 1: Car users partitioning. (1) Work trip based partitioning follows from the activity-based model generated schedules. (2) Ownership (POC, CC) and the possibility to charge at work are specified by parameters.
For each one of the leaf node parts, the market share has been specified: the
results shown in this study hold for 10% non-work trip and 10% work trip
electrification. In the third and last step, charging scenarios are evaluated.
Schedules are sampled from the partitions set up in the second step and the

102
start time for each charging operation is determined. Energy requirement and
power demand are accumulated for every minute of the day for each one of the
2368 zones in Flanders.
6.8.2 Vehicle characteristics determination
Vehicle characteristics for each schedule are determined by random selection
using the joint probabilities shown in the Bayesian network in figure 2. Arrows
designate dependencies between probability densities. For example, the EV type
depends on the ownership and on the fact that the schedule can be executed
using a BEV (block BEV-feasibility). The shaded rectangle Electrified represents
the probability density from which EV are sampled. The shaded rectangle
EnergyReq represents the probability density for the electric energy required to
complete all trips in the schedule. The ovals represent change of variable
functions. Function f(schedule, consumption) calculates whether or not the
sequence of trips in a given schedule can be driven by a BEV given the
stochastic value for the distance specific consumption of the vehicle and the
charge opportunities in the schedule. Function f(schedule, consumption)
corresponds to the conditions detailed in equations 1 and 2 (see further).
The function g(schedule, consumption) calculates the stochastic value for the
energy required during each minute of the day for the given schedule.
Figure 2: Bayesian network showing conditional dependencies for stochastic variables. Continuous line rectangles designate probability densities. The domain for the variable is listed between curly braces. Each continuous line arrow designates a conditional dependency. Ovals designate change of variable functions. Dashed lines represent regular functional dependencies.

103
Vehicle characteristics are determined as follows:
• Vehicle category is randomly selected from the distribution specified in
table 1.
• Vehicle range is selected from table 1.
• Work location charging is allowed for 0.50 of the company car drivers.
Privately owned cars cannot be recharged at work. The charger power is
randomly selected for both home and work location chargers using the
distribution specified in table 1.
• Vehicle consumption is randomly selected using a uniform distribution in
the interval specified for the vehicle category (from table 1). This is the
consumption determined by official US and European standard test suites
(FTP, WP.29) that do not account for cabin clima (heating, airco) nor for
frequent acceleration and deceleration.
• The specific energy consumption as determined by European (UNECE
WP.29 R101) and US standard methods is argued to be an
underestimation (Elgowainy et al., 2010). The standardized test
conditions differ from operating conditions: hence, a range reduction
coefficient of 0.75 has been applied. The range reduction coefficient is
used to adjust the specific consumption which is used in schedule
feasibility and energy demand calculations. This is done for both BEV and
PHEV in the same way.
• The battery capacity is derived from range and distance specific
consumption and has been verified with data found in literature (Nemry et
al., 2009, Wu et al., 2010, and Kromer et al., 2007).
• Different PHEV categories are considered and have been mapped to the
categories small, medium and large respectively in order to determine the
relative market shares (see table 1). The number in the category
identifier designates the All Electric Range (AER) in kilometers.
• Finally, the charger power is randomly selected for both home and work
location chargers using the distribution specified in table 1.
6.8.3 BEV-feasibility
In order to be feasible for a BEV, each location in the schedule shall be
reachable when starting with a fully charged battery in the morning: this is
expressed by the condition (set of #L inequalities)

104
� < � ∀�, � ∈ �1, #�: � − ��,� ∗ ���� +��� ∗ �� ≥ � ∗ � �
� = 1 where i and j are location indexes, � is the battery capacity, L is the set of all locations used in the schedule, �� is the charge-period duration at the j-th
location and �� is the corresponding power, ��,� is the total distance from the first
origin to the i-th destination, ���� is the distance specific energy consumption
and � � = 0.1 is the maximal deep charge depletion coefficient. � � has been
applied to specify the minimal battery level that shall be available at all times; it
is used to model range anxiety and is used in BEV-electrification feasibility
calculation only. The condition that the battery cannot get over-charged is given
by following set of inequalities using the same symbols
� ≤ � ∀�, � ∈ �1, #�: � − ��,� ∗ ���� +��� ∗ �� ≤ �
� = 1
6.8.4 Vehicle sampling
The vehicle type (BEV, PHEV) is determined using the conditional probability
values specified under Relation between EV ownership and EV type above. The
probability for a vehicle to be a PHEV is given by following expressions
containing given probabilities in the right hand sides
#$% = #&'(| *. #++ + #&'(|#, *. #-�+ #-.$% = #++ . #&'(| *. #&#/'(|'(˄ * + #-�+ . #&'(|#, *. #&#/'(|'(˄#, *
where '( designates Electric Vehicle, designates Company Car, #, designates Privately Owned Car, #/'( designates Pluggable Hybrid Electric
Vehicle. It follows that
#1$% = #$% . 21 − #&#/'(|'(*3 = #$% − #-.$%
where 4'( designates Battery Electric Vehicle. Let 56 be the number of cars. A
set of #1$% . 56 elements is sampled from the set of schedules that can be
executed by a BEV (the BEV-feasible schedules); then #-.$% . 56 cars are sampled
from all remaining schedules (BEV-feasible and BEV-infeasible ones).
(1)
(2)
(3)
(4)
(5)
105
6.8.5 Charging parameters
6.8.5.1 Assumptions valid for all scenarios concerned
Energy cost is assumed to conform to the current tariff scheme used in Belgium:
it consists of one contiguous regular tariff period and one contiguous low tariff
period during the night (from 22:00h to 07:00h). Furthermore, the schedules
apply to a working day and schedules are assumed to repeat on successive days.
This assumption allows to determine the period of time available for recharging
overnight. Everyone is assumed to recharge batteries every day. Finally, when
plugged to the electric grid, charging occurs during a single uninterrupted period
of time.
For each schedule and each charging opportunity, the required charge duration
for full recharge and the available charge period are calculated. The available
charge period is determined from the arrival and departure times at the charge
location. If the available period length is larger than the required charge
duration, their difference is the slack time (otherwise slack time equals zero). A
non-zero slack time implies a degree of freedom for selecting the time to start
charging. In many cases, there is an interval ∆� = ��8, �9� of starting times �: such that ∀�: ∈ ∆� the energy cost is the same.
6.8.5.2 Scenario specific assumptions
• Scenario EarlyLowTariff: If ∆� is contained in the low tariff period, the
actor starts charging as soon as possible; otherwise, in the case where the
charge period contains the low-tariff period, the actor starts charging as
late as possible thereby pushing energy demand to the morning hours. This
scenario conforms to the situation where people are using simple timers to
start charging.
• Scenario UniformLowCost: Each actor tries to minimize energy cost by
charging during the low tariff period as much as possible. The charge period
start time �: is chosen from ∆� by random selection using a uniform
distribution.
• Scenario LastHome: All actors ignore the existence of a low-tariff period
and start charging immediately when arriving at home after the last trip of
the day.

106
• Scenario AlwaysAtHome: All actors ignore the existence of a low-tariff
period and start charging immediately when arriving at home after each
home arrival.
Note that scenarios EarlyLowTariff and UniformLowCost are energy cost
minimizing scenarios at the individual actor level, but the other ones are not.
6.8.5.3 Aggregation of micro simulation results
Battery charging opportunities are identified during micro simulation and
inserted in the schedules according to the applied scenario. For each charge
opportunity, the required power is accumulated and recorded for each minute in
the charging period. This process results in a power requirement time series for
each zone. Plots are generated for the zones having maximal energy
requirement (power integrated over time) and maximal power peak value
for the full day, the normal-tariff period and the low-tariff periods respectively.
6.9 Summary of results for the Flemish region
FEATHERS statistics and energy demands have been summarized in table 2.
Scenarios are identified by the ratio of the EV fleet being a PHEV for company
cars (CC) and privately owned cars (POC) respectively. Replacing BEV by PHEV
increases power demand since longer distances are driven on electricity. PHEV
can exhaust the full AER while BEV can drive distances strictly smaller than the
anxiety reduced range only.
Scenario FEATHERS activity-based modeling prediction
All Fraction of actors performing
work trips
0.406
All Fraction of actors performing car
trips
0.555
All Fraction of car using schedules
containing work activity
0.531
All Average work related car trip
distance (km)
19.376
All Fraction of trips that are work
trips
0.160
EV Energy demand calculation
CC=0.0 and POC=0.0 Total energy demand 1380[MWh]
CC=0.5 and POC=0.5 Total energy demand 1652[MWh]
CC=1.0 and POC=1.0 Total energy demand 1829[MWh]
Table 2: FEATHERS Results Statistics.
Table 3 shows the fractions of BEV-feasible schedules determined in the second
step (accounting for work location recharge). Note that only 10% of the
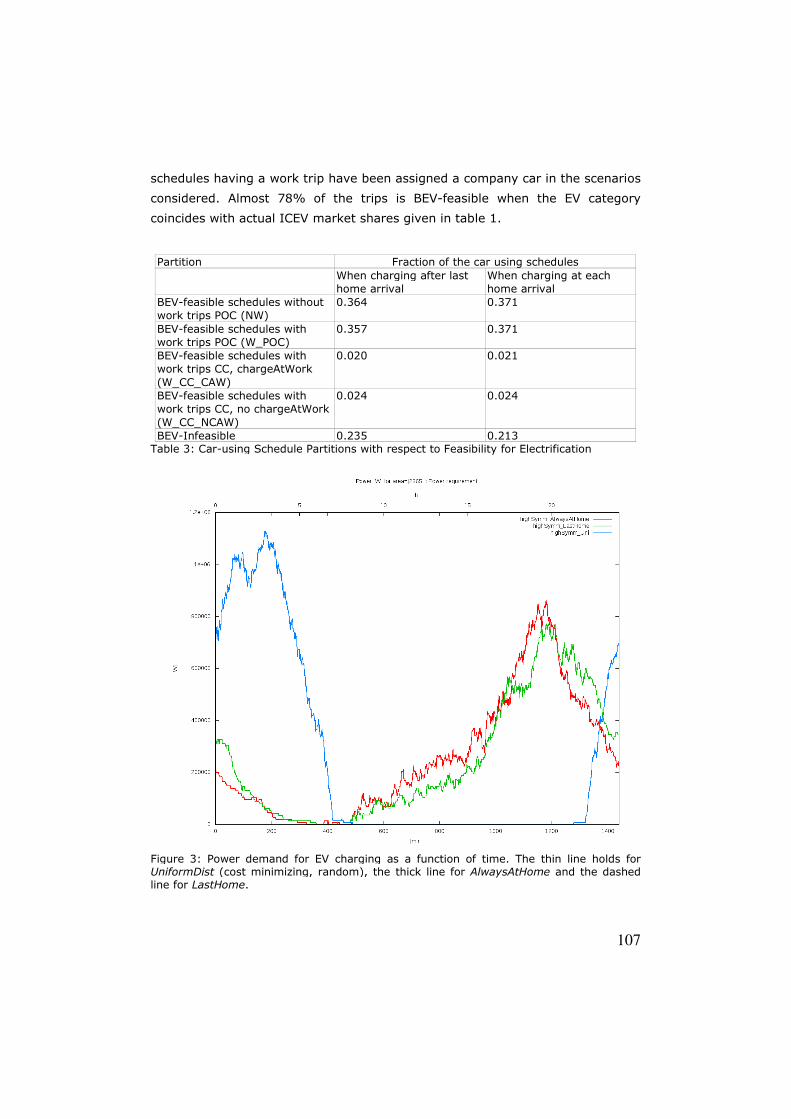
schedules having a work trip have been assig
considered. Almost 78% of the trips is BEV
coincides with actual ICEV market shares given in table
Partition
When charging after last
home arrival
BEV-feasible schedules without
work trips POC (NW)
0.364
BEV-feasible schedules with
work trips POC (W_POC)
0.357
BEV-feasible schedules with
work trips CC, chargeAtWork
(W_CC_CAW)
0.020
BEV-feasible schedules with
work trips CC, no chargeAtWork
(W_CC_NCAW)
0.024
BEV-Infeasible 0.235
Table 3: Car-using Schedule Partitions with
Figure 3: Power demand for EV charging as a function of time. The thin line holds for UniformDist (cost minimizing, random), the thick line for line for LastHome.
107
schedules having a work trip have been assigned a company car in the scenarios
considered. Almost 78% of the trips is BEV-feasible when the EV category
coincides with actual ICEV market shares given in table 1.
Fraction of the car using schedules
When charging after last
home arrival
When charging at each
home arrival
0.364 0.371
0.357 0.371
0.020 0.021
0.024 0.024
0.235 0.213
using Schedule Partitions with respect to Feasibility for Electrification
Figure 3: Power demand for EV charging as a function of time. The thin line holds for (cost minimizing, random), the thick line for AlwaysAtHome and the dashed

108
Figure 3 shows the power demand for an area with 5835 inhabitants for
scenarios UniformLowCost, LastHome and AlwaysAtHome. The power peak
for UniformLowCost (individual actor cost minimizing) is the bigger one and
the peak shifts from about 20:00h to about 02:30 between scenarios. Note that
the power demand shown is to be added to the already existing zone-specific
demand but at the time of writing only countrywide aggregated time dependent
electricity consumption data were available; hence data have not yet been
presented geographically to pinpoint problematic areas. The result shows that it
is worth extending the activity-based model to make it sensitive to electricity
prices.
The power peak for scenario EarlyLowTariff at 22:00h amounts to eight times
the UniformLowCost peak value because everyone is assumed to start
charging at the same moment using a timer. This peak is expected to cause
problems for the electric grid and has not been included in the diagram.
Table 4 shows the fraction of charge opportunities used and the daily charge
frequency for each use case partition and scenario. BEV and PHEV owners are
assumed to share the same charging behavior.
Partition Home charging scenario
EarlyLowTariff UniformLowCost LastHome AlwaysAtHome
FracOp NumCh FracOp NumCh FracOp NumCh FracOp NumCh
NW 0.853 1.000 0.850 1.000 0.854 1.000 1.000 1.196
W_POC 0.822 1.000 0.822 1.000 0.823 1.000 1.000 1.262
W_CC_CAW 0.911 2.194 0.914 2.199 0.905 2.203 1.000 2.450
W_CC_NCA
W
0.817 1.000 0.828 1.000 0.821 1.000 1.000 1.260
Table 4: Fraction of charge opportunities used (FracOp) and number of charge operations
per day (NumCh) for each scenario and partition (N: No, W: Work, POC: Privately Owned Car, CC: Company Car, CAW: Can Charge at Work).
Table 5 shows absolute and relative energy demand for the scenario where 10%
of the cars are EV and BEV/PHEV ratio is 50/50.
Partition Energy [MWh] Relative
BEV PHEV Total
NW 280.346 414.969 695.315 0.421
W_POC 363.328 486.132 849.460 0.515
W_CC_CAW 25.846 31.915 57.761 0.035
W_CC_NCAW 20.126 28.110 48.236 0.029
Total 689.647 961.126 1650.773
Relative 0.418 0.582 1.000
Table 5: Absolute and relative daily energy demand when 10% of cars are EV and 50% of the EV are PHEV both for POC (privately owned cars) and CC (company cars) for scenario AlwaysAtHome.

109
Almost 60% of the energy consumption is by PHEV, almost 94% by privately
owned cars.
6.10 Conclusions
Schedules predicted by the activity-based model inside FEATHERS have been
used to predict energy demand and power peaks due to electric vehicle charging
as a function of time and location for several EV market penetration scenarios
and PHEV/BEV ratios. For the Flanders case, 78% of distances travelled daily
using a single car on working days, seem to be BEV-feasible assuming that EV
categories deployment conforms to current one for ICEV. Secondly, replacing
BEV by PHEV increases electric energy consumption because PHEV can exploit
their full electric range. Finally, the current reduced rate electricity period is
sufficiently long to allow for charging period distribution over time in order to
avoid unwanted power peak demand while allowing people to minimize cost.
6.11 Future research
Although activity based models have a firm statistical basis, some aspects of
reality do not yet have been translated to AB-model parameters. Therefore, this
study cen be seen as the base for following research paths.
On the one hand, more accurate technical and market related data need to be
determined from literature, surveys and experimentation. Data about distance
specific energy consumption in real situations are based on measurements
based on standards and are underestimated: they need to be refined (cabin
clima effects). The amount of car users who are able to charge at home has not
been considered a limiting factor for the current study but could be one of the
main factors when estimating EV market share.
The software be extended to remove the constraint of using a single vehicle for
schedule trips executed by multi-car households. The behavioral model is to be
extended to integrate car selection decisions based on the actor specific
charging decision strategy.
Finally, AB-models and smartgrid models need to get integrated in a closed loop.
Since typical activity based models account for price elasticity and allow for
learning, results feedback allows for evaluation of smartgrid strategies for
charging timeslot allocation. Evaluation of the vehicle to grid (V2G) concept
requires integration of smartgrid controllers with AB-models.
110
References
Bellemans, T., Kochan, B., Janssens, D., Wets, G., Arentze, T.A., and
Timmermans, H.J.P., 2010. Implementation Framework and Development
Trajectory of the FEATHERS Activity-Based Simulation Platform. Transportation
Research Record, Vol. 2175, pp. 111-119.
Binding, C., and Sundstroem, O., 2011. A simulation environment for vehicle-to-
grid integration studies. In Summer Computer Simulation Conference 2011,
SCSC, Den Haag, the Netherlands, pp. 248.
Bliek, F., van den Noort, A., Roossien, B., Kamphuis, R., de Wit, J., van de Velde,
J., and Eijgelaar, M., 2010. PowerMatching City, a living lab smart grid
demonstration. IEEE, Goteborg, Sweden.
Clement-Nyns, K., Haesen, E., and Driesen, J., 2009. Analysis of the impact of
plug-in hybrid electric vehicles on residential distribution grids by using
quadratic and dynamic programming. World Electric Vehicle Journal, Vol. 3.
Cools, M., Declercq, K., Janssens, D., and Wets, G., Onderzoek
Verplaatsingsgedrag Vlaanderen 4.2 (2009-2010). Universiteit Hasselt, IMOB,
2011.
Cornelis, E., Malchair, A., Asperges, T., and Ramaekers, K., 2007. COCA:
Company Cars Analysis (Rapport final), 2007.
Cui, X., Liu, C., Kim, H.K., Kao, S., Tuttle, M., and Bhaduri, B., 2011. A multi
agent-based framework for simulating household PHEV distribution and electric
distribution network impact.
Davies, J., and Kurani, K., 2011. Estimated marginal impact of workplace
charging on electricity demand and charge depleting driving. Scenarios based on
plausible early market commuters’ use of a 5kWh conversion PHEV.
D’haeseleer, W., Klees, P., Albrecht, J., Ruyck, J.D, Tonon, P., Streydio, J.,
Belmans, R., Dufresne, L., Leduc, B., Proost, S., van Ypersele, J., Chevalier, J.,
Eichhammer, W., and Terzian, P., 2007. Commission ENERGY 2030 — FINAL
REPORT : Belgium’s Energy Challenges Towards 2030.
EABEV, Energy consumption, CO2 emissions and other considerations related to
Battery Electric Vehicles, www.going-electric.org, 2010.
Elgowainy, A., Han, J., Poch, L., Wang, M., Vyas, A., Mahalik, M., and Rousseau,
A., 2010. Wellto-wheels energy use and greenhouse gas emissions analysis of
plug-in hybrid electric vehicles. Argonne National Laboratory.
Federal Planning Bureau, Transportdatabanken: Indicator PARC010 www.plan.be,
2009.

111
Hadley, S., and Tsvetkova, A., 2008. Potential impacts of plug-in hybrid electric
vehicles on regional power generation. OAK RIDGE NATIONAL LABORATORY.
Kang, J.E. and Recker, W., 2009. An activity-based assessment of the potential
impacts of plug-in hybrid electric vehicles on energy and emissions using 1-day
travel data. Transportation Research Part D: Transport and Environment, Vol.
14(8), pp. 541-556.
Kromer, M. and Heywood, J., 2007. Electric powertrains: Opportunities and
challenges in the U.S. light-duty vehicle fleet.
Nemry, F., Leduc, G., and Almudena, M., 2009. Plug-in hybrid and battery-
electric vehicles: State of the research and development and comparative
analysis of energy and cost efficiency.
Parque, A.P.M.D., and Ciuffo, B., 2009. Potential impact of electric vehicles on
the electric supply system. A case study for the province of Milan, Italy. OPOCE,
No. JRC53390.
Perujo, A., and Ciuffo, B., 2010. The introduction of electric vehicles in the
private fleet: Potential impact on the electric supply system and on the
environment. A case study for the Province of Milan, Italy. Energy Policy, Vol.
38(8), pp. 4549-4561.
Ramage, M., 2010. Transitions to alternative transportation technologies plug-in
hybrid electric vehicles. National Academies Press, Committee on Assessment of
Resource Needs for Fuel Cell and Hydrogen Technologies, Washington D.C.,
U.S.A.
Recker, W.W. and Kang, J.E., 2010. An activity-based assessment of the
potential impacts of plug-in hybrid electric vehicles on energy and emissions
using one-day travel data. University of California Transportation Center,
Working Papers 1593422.
UO_ECI, Country pictures Belgium, www.eci.ox.ac.uk/research/energy, 2011.
Waraich, R.A., and Galus, M., 2009. Plug-in hybrid electric vehicles and smart
grid: Investigations based on a micro simulation.
White-House-NSTC, A policy framework for the 21st century grid: Enabling our
secure energy future. www.whitehouse.gov/sites/default/files/microsites/ostp/
nstc-smart-grid-june2011. pdf, 2011
Wu, D., Aliprantis, D., and Gkritza, K., 2010. Electric energy and power
consumption by light-duty plug-in electric vehicles.

112

113
Chapter 7 Final discussion and conclusion
7.1 Conclusions
This section summarizes the main conclusions that evolved from this research.
Research results can be classified under the following topics:
7.1.1 The PARROTS survey tool
A custom-made survey tool, PARROTS, was developed to assist in collecting
activity-travel diary data and Global Positioning (GPS) based location data
during trips. The idea of this new tool was to offer traffic researchers dealing
with activity-based models a means for gathering in the field travel behaviour
data of a higher quality then traditional paper-and-pencil survey systems. This
PARROTS tool eventually has been deployed in a survey that was carried out on
2,500 households in Flanders. To be able to judge the effect of the PARROTS
tool on the quality of activity-travel diaries, also a paper-and-pencil diary was
designed and deployed as well.
In this dissertation, the impact on travel and location data quality of this GPS-
enabled PDA data collection tool featuring consistency checks was discussed.
This impact included both activity-travel diary data quality and GPS data quality.
The quality of the GPS-based location data collection was assessed in terms of
both quantity and quality of the obtained GPS logs. The location data quality was
obtained using the fraction of GPS logs containing actual location information.
Based on the GPS logger activity, a usage profile was obtained and compared to
the location data resulting from the survey.
Based on the analyses done in this dissertation, it was concluded that PARROTS
provided both high quality activity-travel diary data and GPS-based location
information, while keeping the burden for the respondents at an acceptable level.
This way, the PARROTS tool proved to be an object of value to the traffic
research community.
7.1.2 The FEATHERS framework
In order to facilitate the development of dynamic activity-based models for
transport demand, the FEATHERS framework was developed. For this framework,
a four stage development trajectory was suggested for a smooth transition from
the traditional four-step models towards an already achieved static activity
based models (see next section) and dynamic activity based models in the

114
longer term. The development stages discussed in this dissertation ranged from
an initial static activity-based model without traffic assignment to ultimately a
dynamic activity-based model incorporating rescheduling, learning effects and
traffic routing.
To illustrate the FEATHERS framework, work that was done on the development
of both static and dynamic activity-based models for Flanders and the
Netherlands was discussed. In line with this, the four stage activity-based model
development trajectory was discussed in detail.
The presentation of the modular FEATHERS framework also discussed the
functionalities of the modules and how they accommodate the requirements
imposed on the framework by each of the four stages. In a last part, this work
also concluded with a brief overview of the travel demand management
strategies that can be addressed within the FEATHERS framework.
7.1.3 Validation of an activity-based model for Flanders
In this dissertation the development of an activity-based modeling framework
was set as an important goal. However, in order to have a reason for being, the
activity-based modeling framework discussed in this dissertation, FEATHERS,
had to be equipped with a transport model of the activity-based category. For
this purpose, the Dutch activity-based model ALBATROSS was adopted as a
starting point for implementing an activity-based model in the FEATHERS
framework. However, as the study area in this case is Flanders, the activity-
based model had to be nourished with Flemish input data such as e.g. land use
data, a synthetic population and a hierarchically built geographic study area
layer. Furthermore, a survey revealing the travel behavior of the Flemish
population had to be provided in order to train the decision trees inside the
model for Flanders.
After the implementation phase, the activity-based model inside FEATHERS had
to be validated in order to be sure of our grounds. As there are different kinds of
dimensions pertaining to validation, the validation process was split up according
to some major points of interest.
In a first part, a validation on the level of model components was performed.
This part of the validation described the quality of the resulting trained decision
trees, for each step in the decision process model. The predictive performance of
each discrete choice decision tree was calculated by means of the Confusion
Matrix Accuracy (CMA) measure. To be able to make a judgment about the
predictive ability of these decision trees, a null-model for each tree was

115
calculated as well so that the relative performance of each tree could be
determined. By comparing the null-models with the respective decision trees it
became possible to see whether or not the decision trees were vigorous enough
to score better then the null-models. As it turned out, all trees performed better
then the null-model. For continuous decision trees however, another measure
than the Confusion Matrix Accuracy was used, namely the Relative Absolute
Mean Error (RAME), as no confusion matrix can be determined for these kind of
trees. As could be demonstrated, the RAME for each decision tree separately
was approximately the same for the training and validation set, implying that
the decision trees performed quite well in case of unseen data cases.
In a second part, a validation according to the activity-travel time dimension
was carried out. To this purpose, the number of trips distributed on a 24 hour
axis were compared with official OVG reports. Despite the fact that raw OVG
survey data had been used in order to train the activity-based model inside
FEATHERS, the official OVG reports released by the government were used for
this validation as there were no other current time-related and independent data
sets available for Flanders. As could be observed, the trip trends with respect to
time were similar for OVG and FEATHERS. However, FEATHERS trips tended to
be over-estimated in the evening and somewhat under-estimated in the morning
period. Nevertheless, despite the tendency to skew trip starts, the trends for
OVG and FEATHERS corresponded quite well.
In a third part, FEATHERS was validated according to the activity-travel space
dimension. This validation process utilized the data provided by the Belgian
decennial 2001 census to look at the trends pertaining to trips. One of the
benefits of the census was that the census formed a completely independent
data source that could be used in order to validate trips generated by FEATHERS.
Based on linear regression models, that compared the number of trips for each
FEATHERS and census origin-destination pair, it could be concluded that the
model inside FEATHERS was able to replicate, to a large degree, the spatial trip
pattern that could be observed in the independent census.
As a last part of the validation process the focus was put on vehicle kilometers
travelled. Using FEATHERS, for every hour of the day and for every day of the
week, OD matrices were generated and assigned to the network. By doing so for
all available OD matrices, thus for every car mode OD matrix for every day of
the week and for every hour of the day, the total vehicle travel was calculated
on a yearly basis. Subsequently, the predicted total vehicle kilometers travelled
for the 2007 base year were compared with the official reported values by the

116
government for the same year. As could be observed, the difference was very
small, implying that predictions with FEATHERS were close to reality.
7.1.4 Traffic demand scenario's
In order to demonstrate the true potential of activity-based models, two traffic
demand scenario’s were built. The first scenario that was implemented in
FEATHERS is one that evaluates the effect of telecommuting according to the
total kilometers of travel being reduced. For this scenario, also a more
conventional modeling approach was adopted to calculate the total kilometers of
travel saved in case telecommuting would materialize in the Flanders area. By
doing so, the operational FEATHERS activity-based framework was tested on it’s
ability to implement a scenario and, at the same time, FEATHERS was also
externally validated once more on top of the original validation process. As it
appeared, for both the conventional calculation method and the first FEATHERS
scenario, total kilometers of travel reductions were equal indicating that
FEATHERS, on the one hand, is capable of implementing a traffic demand
scenario such as telecommuting, and on the other hand, as stated before, the
equality of the total kilometers of travel reductions is also indicative of a well-
validated activity-based model.
The second scenario that was implemented was a scenario that has been
subdivided in 4 scripts where for each of the 4 scenario scripts the spatial and
temporal electrical vehicle power demand was calculated for Flanders. To this
end, FEATHERS was first used to predict activity-travel schedules for all adult
inhabitants of Flanders so that for those inhabitants the activities and trips were
known throughout the day. Subsequently, in a second step, the electrical vehicle
power demand could then be calculated under 4 different and possible electrical
vehicle charging scenario scripts. The first scenario script assumed that people
start charging their electrical vehicle as soon as possible during the low tariff
period at night-time. The second one assumed that people start charging at a
uniformly distributed moment in time however at minimal cost. In the third
scenario script people started charging batteries as soon as the car got parked
at the last home arrival and the last scenario script assumed that people charge
batteries immediately after each home arrival. Simulations ran for each scenario
script revealed that for Flanders, it is feasible for 78% of all car trips that they
can be performed by a battery-only electrical vehicle. Secondly, replacing
battery-only electrical vehicles by pluggable-hybrid electrical vehicles could
increase electric energy consumption because pluggable-hybrid electrical

117
vehicles can exploit their full electric range. And finally, calculations revealed
that the current reduced rate electricity period is sufficiently long to allow for
charging period distribution over time in order to avoid unwanted power peak
demand while allowing people to minimize costs.
7.2 Future research
Developing an activity-based modeling framework for implementing activity-
based models was an important accomplishment in this Ph.D. research. Applying
the developed model chain to the Flemish region was another important
realization. However, some challenges still remain to improve both the activity-
based model and the FEATHERS activity-based modeling framework. For a wide
variety of problems and topics, recommendations are mentioned which can or
should be applied to improve the work presented in this dissertation. In this
section, these challenges are briefly described and discussed.
7.2.1 Redressing equilibrium between traffic demand and traffic
supply
The activity-based model inside FEATHERS does not contain a traffic model that
assigns traffic onto a network. In a next step this should be done so that
FEATHERS generates OD matrices that will be assigned on a network including a
feedback loop to the traffic demand part of the model. At equilibrium the
demand for travel must be consistent with the network performance in servicing
that level of demand. The importance of the need to find the point of equilibrium
with some accuracy must be emphasized. In practice, there is no direct way of
calculating the equilibrium solution, and it is necessary to set up iterative
procedures, hence a feedback loop is needed as indicated before.
The outcome of this exercise would be new travel time matrices that would
function as new input to the activity-based model inside FEATHERS. New travel
time matrices would lead to new and adjusted activity-travel patterns. This
exercise would have as a goal to investigate whether or not this procedure
would yield added value to the modeling approach. It would also have to
indicate if plausible results will be obtained and whether this well-conceived
iterative system would converge to a unique equilibrium solution and if so, how
many iterations would be involved. Issues that will have to be investigated are
computational accuracy and the possibility to limit computing time. In addition,
it is also conceivable that the iterative system is not well conceived. This could
mean that it takes a very long time to converge, at worst, that convergence is

118
not obtained at all. In order to address this issue, it would be necessary to
develop some criteria for correct model convergence. For a detailed model such
as the one that has been implemented in FEATHERS, the total number of
demand estimates tends to be large, and while it would be possible to test each
element for its stability, the requirement for compromise would mean that these
criteria may have to be defined at more aggregated levels. However, while the
procedure at first sight might appear to converge according to these criteria, in
practice stability might not be achieved at more detailed levels. These and more
issues should all be investigated into more detail.
7.2.2 Activity travel planning and rescheduling behavior
Travel behavior research of the past few years has shown an increasing interest
in dynamic activity scheduling. In line with this observation, research could be
done to analyze factors influencing the actual activity scheduling process by
using the detailed activity travel data from the extensive data set collected for
Flanders by means of the PARROTS survey tool.
It is generally accepted in activity-based research that executed activities are
the result of a complex scheduling process in which activity episodes are
inserted, deleted, and modified, and that attributes other than activity type
alone are required to model the scheduling process. Most activity-based
scheduling models, however, assume that activities are scheduled in a fixed
order and do not attempt to model activity rescheduling. This means that
activity scheduling is almost always considered to be a static process, whereas it
is really a dynamic combination of (re)scheduling decisions. Recognizing this
limitation of existing activity scheduling models, some researchers already
developed conceptual frameworks describing the effect of time pressure on
activity rescheduling. Particular models predict how individuals change their
activity schedule during the day as a result of unexpected events or time
pressure.
Since scheduling and rescheduling decisions are difficult to observe and since
traditional trip- and activity-based diaries are not developed to collect this type
of information, a specific computer-based survey instrument that has been
designed in this Ph.D. research, namely PARROTS, can be used and already has
been brought into action in order to gather empirical data on scheduling process
dynamics. Studies reveal that some activities are scheduled days or even weeks
in advance. Other activities, so-called impulsive activities, do not appear to be
scheduled in advance. This kind of planning behavior can be derived by

119
analyzing the filled in PARROTS diaries where respondents were asked to fill in a
planning of their activities before executing those activities.
The activity data, stemming from the PARROTS tool, and its changes in attribute
values through time already has been investigated internally according to the
(re)planning behavior of respondents. Moreover, currently, different models
have been developed by members of our research group. One model examined
the attributes that influence activity planning, while a second model analyzed
the factors that affect activity rescheduling. Now that this point has been
reached, the outcomes of both models could now be used in order to enhance
the activity-based model inside FEATHERS so that more realistic scheduling and
rescheduling decisions could be made. Adopting both models only requires
extending the activity-based model inside FEATHERS by implementing the
former models according to the programming paradigms, rules and concepts.
This is a process that definitely should be elaborated on as research by our
group members indicate that the rescheduling models might be very useful to
the activity-based model inside FEATHERS.
7.2.3 A synthetic population creator
As has been demonstrated in this dissertation it is possible to build an activity-
based model for Flanders inside the FEATHERS framework. However, if the
model inside FEATHERS needs to be applied to a new study area, an important
requirement is that the population of that study area needs to be forecasted.
Not only for new study areas, but also in case Flanders is considered, then a
solid synthetic population creator should be designed as well, so that different
population changes and trends can be adopted while creating a new population
in case of a scenario like for example an aging scenario or a migration scenario.
Other scenarios or changes might be related to for example the proportion of
single workers, the average number of household members, and so on.
Micro-simulation is suggested here to simulate each member of this synthetic
population. One might think of techniques such as iteratively proportional fitting
(IPF) to generate a sample consistent with known statistics of a target
population of the study area. In IPF, the sample defines an initial frequency
cross table of all attributes involved. Demographic data are also used to define
constraints on marginal distributions of the tables. IPF is then applied to find cell
proportions that are consistent with given marginals.
As can be done as additional research, in order to enhance and extend the
FEATHERS framework, it would be convenient and practical to develop an IPF-

120
based method or another similar method that meets the data needs of the
activity-based model inside FEATHERS while accounting for available data
sources of the study area under concern. Therefore, it is decided to implement
an approach as a synthetic population creator agent in the FEATHERS framework
together with a suitable and user-friendly interface for editing the input data.
7.2.4 A more detailed transport mode choice model
In the ALBATROSS-based transport model implemented in the FEATHERS
framework, a distinction is made between 4 types of transport modes, namely
Car driver (by car as car driver), Car passenger (by car as passenger), Slow
mode (walk, bike, moped, etc.) and Public transport (train, bus, metro, tram,
etc.). However, even though all transport modes cover all kinds of vehicle types,
the exact vehicle type is lost in this rough categorization. For example, if the
model predicts that a trip has been carried out by Public transport, the exact
transport mode (train, bus, metro, tram) is not known. The same applies for
cars and slow mode.
Therefore, it would be interesting to extend the ALBATROSS-based transport
model with transport modes that also take into account the vehicle type, so that
next to these 4 generic transport mode categories, Car driver, Car Passenger,
Slow mode and Public transport, we would also know which type of car and
which type of public transport has been chosen.
As FEATHERS can be used for calculating emission scenario’s, it is of the utmost
importance to know the type of car that has been used (gasoline or diesel driven
engines) and moreover the car its age, as age also influences emissions. The
same holds for Public transport where differences between trains and buses also
affect emission calculations. But not only in case of vehicle emissions, but also in
case of electrical vehicle scenarios it becomes important to get more insights
into the use of those vehicle types.
Currently, different surveys are being employed, for example a survey where
different types of Slow modes are investigated and classified. Also surveys for
cars are needed so that more detailed vehicle types can be predicted based on,
among others, household and person attributes.
Once that more information is known about those different vehicle types, their
distributions among the population and when the relationship is known between
user type and vehicle type, then a new transport mode choice model can be
implemented in the ALBATROSS-based transport model inside the FEATHERS
framework.

121
7.2.5 Retailoring the ALBATROSS-based transport model
In this research, the implementation of the ALBATROSS-based transport model
into FEATHERS was achieved by first reverse engineering the original
ALBATROSS model into its components and by combing out every single detail
of this model. Therefore, after the implementation phase, the transport model
inside FEATHERS shows a strong resemblance with ALBATROSS.
However, during the investigation of the computational process model inside
ALBATROSS, the model core attracted the attention because of its complexity. It
seems that a lot of decision trees are included in the model, and also each
decision tree contains lots of condition variables that are being used in order to
make decisions. In total 26 dimensions or choice facets need to be modeled.
This observation raises the question whether this enormous number of decision
trees, that also accommodate a lot of condition variables, is realistic. Moreover,
one can ask whether or not the complexity might be reduced without reducing
the predictive accuracy of the model core.
Within our research group, initiatives for investigating ALBATROSS’ complexity
already has been undertaken in the past. To this end, complex and parsimonious
models within ALBATROSS were applied and results of predictions were
compared. Two different ways of attaining parsimony were achieved, the first
one by applying simple heuristics like for instance One R and Naïve Bayes, and
the second one by employing Feature and Variable Selection.
The conclusion of this research revealed that simple models do not perform
better, but are also not inferior to more complex models. Moreover, findings
endorse primary belief that people do not rely on a complex series of rules to
make a decision indicating that ALBATROSS could be reduced in complexity.
The research described above was done based on the very first version of
ALBATROSS where only 9 decision trees were being used. Currently ALBATROSS
accommodates 26 decision trees, meaning that its complexity only increased
over time. Therefore, it becomes even more paramount to have a look at the
complexity of the currently implemented model core inside FEATHERS. Future
research should bear this issue in mind to improve the transport model inside
FEATHERS in terms of the number of decision trees and the number of condition
variables. Moreover, also the scheduler dealing with these decision trees should
also be investigated on its potential for reducing model complexity.

122
7.2.6 Extending FEATHERS with an urban simulation model
One of the underpinnings of the activity-based paradigm is that activities to be
conducted generate trips. These activities generate trips because they are
carried out at certain locations, separated from each other, so that these gaps
will have to be bridged by means of trips. Therefore, one can easily see that
those locations will have an impact on the trips that will be predicted by the
transport model inside FEATHERS. Activities at locations not far from each other
generate short trips, while locations that are more dispersive will tend to
produce longer trips.
Based on the reasoning above, it is clear that extending FEATHERS with an
urban simulation model can have an impact on the eventual locations where
people perform their activities and hence on the trips pertaining to those
activities. Currently, in FEATHERS, land use data is being used in order to
predict where individuals will carry out their activities. For example, bring/get
activities are typically performed at school locations, service-related activities
can be performed at banks and post offices, and social activities could be carried
out at any place except for example industrial environments.
An urban simulation model could nicely complement the already existing land
use component inside FEATHERS. Urban simulation models here, are interpreted
as operational models that attempt to represent dynamic processes and
interactions of urban development and transportation. Urban systems nowadays
are becoming more important as urban economies, social en political structures
and norms, and transportation and other infrastructure systems and
technologies evolve.
Urban simulation models can be used for location choice predictions, but equally
important, because of the very nature of these dynamic urban simulation models,
they can also be used in conjunction with a framework like FEATHERS in order to
calculate different kind of scenarios. For example, one might think of impacts of
proposed land use and transportation policies on trip patterns. Other scenarios
could involve policies that are designed to promote densification, infill and
redevelopment of certain locations. Also the effects of real estate development,
distinguishing residential, nonresidential and mixed-use types, and the location
of households and firms can be investigated with urban simulation models.
Furthermore, also environmental scenarios are imaginable, as the impacts of
environmental regulations that affect the development of environmentally
sensitive lands can be assessed by means of urban simulation models. Also
demographic processes can be tackled by means of urban simulation models,

123
implying that changes in household sizes and structures can be used in order to
calculate ensuing changes in activity-trip patterns by making use of FEATHERS.
As a last example, modeling economic growth also belongs to the possibilities of
urban simulation models, where a macroeconomic component could be used to
model economic activities in the region and hence related trip patterns when
using FEATHERS.
All of the above examples strongly indicate that a solid urban simulation model
could massively increase the number of scenario’s that can be implemented
within the FEATHERS framework. Therefore, it should be underlined that
sufficient amount of time should be invested in the development of an urban
simulation model inside FEATHERS. It will only make FEATHERS more important
and valuable for transport planners and researchers.

124

125
Summary
This dissertation describes the development and application of two software
packages that can be used to assist transport researchers and practitioners.
The first software package, PARROTS, is an electronic survey tool that enables
traffic researchers to carry out surveys yielding activity-travel diary data of a
higher quality than traditional paper-and-pencil surveys. Furthermore, as this
electronic tool is a GPS-enabled PDA data collection tool, it also provides the
researcher with a rich GPS data set at the same time. To judge the effect of the
PARROTS tool on the quality of activity-travel diaries, a paper-and-pencil diary
was designed and deployed as well. Based on the analyses between the
PARROTS survey tool and the paper-and-pencil survey, it could be concluded
that PARROTS provides both high quality activity-travel diary data and GPS-
based location information while keeping the burden for the respondents at an
acceptable level.
The second software package, FEATHERS, is a modeling framework specifically
designed for implementing activity-based transport models. As this framework
became operational after a substantial development period, an already existing
and proven activity-based model, namely ALBATROSS, was reverse engineered
and re-implemented from the bottom up into the FEATHERS framework in order
to prove this framework’s right to exist. As this process proved to be successful,
following on the implementation phase of this activity-based model, a validation
was performed on this model in order to demonstrate its capability to represent
an activity-based model for Flanders, which was the study area of interest.
The validation of the activity-based transport model inside FEATHERS was split
up according to different dimensions. In a first part, a validation on the level of
the model components, i.e. decision trees was performed. This validation
indicated that the decision trees of the activity-based model inside FEATHERS
were capable of capturing people’s travel behavior in a decent way. Moreover,
based on some data-mining criteria, it could also be concluded that the decision
trees were capable of predicting travel behavior of unseen test cases when
compared with the cases of the model’s training data set. In a second part, a
validation of the FEATHERS model according to the activity-time travel time
dimension was worked out. Here it was demonstrated that the model was able
to replicate the so called “camelback” curve when compared with the same kind
of curve stemming from the Onderzoek Verplaatsingsgedrag (OVG) survey. The

126
third part of the validation comprehended a model validation according to the
activity-travel space dimension. For this purpose, a completely independent
census data set was chosen in order to see whether or not the prediction data
set within FEATHERS matched with this census data set. As it turned out, a very
high correlation was found between both data sets indicating that the model
inside FEATHERS was able to pick up the observed spatial travel patterns of the
OVG survey respondents nicely. The fourth and last part of the validation was
carried out in terms of comparing traffic counts and vehicle kilometers travelled
of all predicted diaries with official governmental reports on those same kind of
figures. To this end, within FEATHERS, activity-travel schedules were simulated
for all the individuals of the Flemish population. Next, the predicted trips for the
entire population were assigned to a road network and traffic flows were
determined so that traffic counts and vehicle kilometers could be calculated. Also
in this case, the model inside FEATHERS showed a very good correspondence
with what can be seen in reality.
Now that the model inside FEATHERS was accepted, based on the detailed
validation, two scenario’s were implemented so that FEATHERS could be brought
into service. The first scenario comprehended the calculation of the total vehicle
travel reduction in the case of telecommuting. To this end, also a more
conventional method for calculating the total vehicle travel reduction was
adopted. As became clear, both FEATHERS and the conventional method showed
exactly the same reduction of travel in the case of the same telecommuting
scenario. This similarity in figures therefore proved that FEATHERS can be used
for modeling scenario’s such as the telecommuting scenario. The second
scenario comprehended the assessment of the spatial and temporal electrical
vehicle power demand for Flanders under 4 different electrical vehicle charging
scenario scripts. To this end, FEATHERS was first used in order to predict
activity-travel schedules so that in a second step, those schedules could be used
in order to evaluate the charging power demand under 4 different scenario
scripts. The results of those 4 scenario scripts revealed that most predicted trips
can be performed by a battery-only electrical vehicle. Moreover, it could also be
concluded that replacing battery-only electrical vehicles by pluggable-hybrid
electrical vehicles might increase electric energy consumption as pluggable-
hybrid electrical vehicles can exploit their full electric range. Overall, this
electrical vehicle scenario proved that, next to the telecommuting scenario,
FEATHERS can also be used for more specific and detailed scenario’s, paving the
way for even more detailed future scenario’s.

127
In summary, this dissertation demonstrated that both software packages,
namely PARROTS and FEATHERS, can be a true aid for traffic researchers and
practitioners. As demonstrated, PARROTS can be used as an electronic state-of-
the-art activity-travel survey tool, yielding data of high quality. FEATHERS, on
his turn, can easily be used for implementing activity-based models for a specific
study area and secondly, for working out scenario’s that can be employed for
predicting different kinds of changes in the travel behavior of the Flemish
citizen.

128

129
Samenvatting
Dit proefschrift beschrijft de ontwikkeling en de toepassing van twee software
pakketten die gebruikt kunnen worden door transport onderzoekers en technici.
Het eerste software pakket, PARROTS, is een electronisch instrument dat
onderzoekers kan ondersteunen om transport enquetes uit te voeren waarbij de
activiteiten-verplaatsingen data van een hoger niveau is dan het geval is bij de
traditionele papier-en-potlood enquetes. Bovendien, aangezien het PDA data
collectie instrument ook een GPS bevat, levert dit instrument de onderzoeker
ook tegelijkertijd een rijke GPS data set. Om de kwaliteit van het PARROTS
instrument te beoordelen wat betreft de verzamelde activiteiten-verplaatsingen
dagboekjes, werd er ook een papier-en-potlood enquete samengesteld en
ingezet. Op basis van de daarop volgende analyses van beide data sets, kan
geconcludeerd worden dat PARROTS een hoog kwalitatieve activiteiten-
verplaatsingen data set verschaft samen met GPS-gebaseerde locatie informatie,
terwijl tegelijkertijd de belasting van de respondent op een acceptabel niveau
gehouden kon worden.
Het tweede software pakket, FEATHERS, levert een geraamte voor het
ontwikkelen van activiteiten-gebaseerde modellen. Nadat het raamwerk na een
substantiële ontwikkelingsperiode operationeel werd, werd een reeds bestaand
en beproefd activiteiten-gebaseerd model, namelijk ALBATROSS, zorgvuldig
doorzocht en opnieuw geïmplementeerd in het FEATHERS raamwerk. Na het
succesvol uitwerken van het activiteiten-gebaseerd model ALBATROSS, werd
een validatie uitgevoerd op dit model zodanig dat de capaciteit om een
volwaardig activiteiten-gebaseerd model voor Vlaanderen te kunnen zijn, kon
worden aangetoond.
De validatie van het activiteiten-gebaseerd transport model in FEATHERS werd
uitgesplitst volgens verschillende dimensies. In het eerste deel, werd er een
validatie uitgevoerd op de model componenten, namelijk de beslissingsbomen.
Dit deel van de validatie toonde aan dat de beslissingsbomen van het
activiteiten-gebaseerd model in FEATHERS in staat waren om het
verkeersgedrag van de burgers vast te leggen. Bovendien, was het op basis van
data-mining criteria ook mogelijk om vast te stellen dat de beslissingsbomen in
staat bleken te zijn om het verkeersgedrag te voorspellen van nieuwe test
records. In een tweede deel werd de validatie van het FEATHERS model volgens
de tijdsdimensie uitgewerkt. Hier werd aangetoond dat het model in staat is om

130
de zogenaamde “kamelenrug curve” te voorspellen zoals ze voorkomt in de
Onderzoek Verplaatsingsgedrag (OVG) enquete. Het derde gedeelte van de
validatie behelsde aan model validatie volgens de ruimtelijke dimensie. Hiervoor
werd een volledig onafhankelijke census data set gebruikt om te zien of de
voorspelde data set in FEATHERS overeen zou komen met de census data set.
Uit deze analyse bleek dat er een heel hoge correlatie bestond tussen beide data
sets waaruit geconcludeerd kon worden dat het model in FEATHERS in staat was
om de geobserveerde ruimtelijke verkeerspatronen van de OVG enquete op een
ordentelijke wijze op te nemen. Het vierde en laatste gedeelte van de model
validatie betrof een vergelijking van verkeerstellingen en totaal aantal
voertuigkilometers tussen de voorspelde FEATHERS dagboekjes en officiële
reporten van de overheid. Hiervoor werd eerst op basis van FEATHERS
activiteiten-verplaatsingen patronen gesimuleerd voor al de Vlaamse burgers. In
een volgende stap werden al de verplaatsingen van de Vlamingen toegekend
aan een netwerk zodat verkeersstromen konden worden bepaald op basis
waarvan verkeerstellingen en totaal aantal voertuigkilometers konden berekend
worden. Op basis van deze analyse kon nogmaals worden aangetoond dat de
voorspellingen op basis van FEATHERS een heel goede overeenkomst tonen met
de werkelijkheid.
Nudat het model in FEATHERS op basis van de validatie geaccepteerd kon
worden, werden er twee scenario’s geselecteerd om uitgewerkt te worden wat
de uiteindelijke doelstelling van FEATHERS is. Het eerste scenario betrof een
berekening van de totale voertuigkilometer reductie in het geval een deel van de
bevolking zou telewerken. Om in te kunnen schatten of FEATHERS juiste
resultaten zou opleveren werd er ook een conventionele berekeningswijze
uitgevoerd en vergeleken met de berekeningen op basis van FEATHERS. Uit de
vergelijking tussen beide berekeningen kon worden geconcludeerd dat
FEATHERS exact dezelfde reductie in totaal aantal voertuigkilometers berekende
als het geval is met de conventionele berekeningswijze. De sterke overeenkomst
tussen beide resultaten toonde aan dat FEATHERS in staat is om scenario’s uit te
werken vergelijkbaar met dit telewerken scenario. Het tweede scenario betrof
een inschatting van de ruimtelijke en temporale component van de electrische
voertuig energie vraag voor Vlaanderen gegeven 4 verschillende electrische
voertuig oplading scenario scripts. Hiervoor werd FEATHERS eerst toegepast om
activiteit-trip dagboekjes te voorspellen om dan vervolgens, in een tweede stap,
deze dagboekjes te gebruiken om de energie oplading vraag te evalueren,
gegeven de 4 verschillende scenario scripts. De resultaten van deze 4 scenario

131
scripts onthulden dat de meeste trips uitgevoerd kunnen worden door een
‘battery-only’ electrisch voertuig. Verder kon er ook afgeleid worden dat het
vervangen van ‘battery-only’ electrische voertuigen door ‘pluggable-hybrid’
electrische voertuigen het electrische ernergieverbruik zou kunnen verhogen
aangezien ‘pluggable-hybrid’ electrische voertuigen hun volledige capaciteit
kunnen benutten. Alles samen beschouwd, heeft het electrische voertuig
scenario kunnen aantonen dat, naast het telewerken scenario, FEATHERS ook
gebruikt kan worden voor meer specifieke en gedetailleerde scenario’s,
waardoor de weg gebaand kon worden voor nog meer gedetailleerde toekomst
scenario’s.
Kort samengevat kan worden gesteld dat dit proefschrift heeft kunnen aantonen
dat de beide software pakketten, namelijk PARROTS en FEATHERS, een ware
hulp kunnen betekenen voor verkeerskundige onderzoekers en technici. Zoals
aangetoond kon worden, kan PARROTS gebruikt worden als een electronische
state-of-the-art activiteiten-verplaatsingen enquete instrument waarmee data
van een hoge kwaliteit mee verzameld kan worden. FEATHERS, op zijn beurt,
kan gebruikt worden om activiteiten-gebaseerde transport modellen te
implementeren voor een specifiek studie gebied en bijkomend, voor het
uitwerken van scenario’s die kunnen worden ingezet voor het voorspellen van
allerhande veranderingen in het verplaatsingspatroon van de Vlaamse burger.