Embed Size (px)
Citation preview

SCRS/2013/150 Collect. Vol. Sci. Pap. ICCAT, 70(3): 1355-1364 (2014)
IMPLEMENTATION OF A HARVEST
CONTROL RULE FOR NORTHERN ATLANTIC ALBACORE
Laurence T. Kell1, Paul De Bruyn
1, Gorka Merino
2 and Josetxu Ortiz de Urbina
3
SUMMARY
A Harvest Control Rule was developed for North Atlantic albacore during the 2013 assessment,
this paper documents the procedure used.
RÉSUMÉ
Une norme de contrôle de la ponction a été élaborée pour le germon de l’Atlantique Nord
pendant l'évaluation de 2013 ; le présent document décrit la procédure utilisée.
RESUMEN
Durante la evaluación de 2013, se desarrolló una norma de control de la captura para el atún
blanco del Atlántico norte, en este documento se documenta el procedimiento utilizado.
KEYWORDS
Albacore, Harvest control rule, Management, Surplus Production model
1. Introduction
The ICCAT Commission [Rec. 11-04] asked the SCRS to develop a Limit Reference Point (LRP) for North
Atlantic albacore that will trigger a rebuilding plan if biomass drops below it. The FAO Technical Consultation
on the Precautionary Approach to Capture Fisheries (FAO, 1996) recommended the use of a harvest control rule
(HCR) to specify in advance what actions should be taken when a LRP is reached. Therefore during the
Albacore stock assessment working group a HCR was developed that was implemented as a Management
Procedure (MP). Where a MP is the combination of pre-defined data, together with an algorithm to which such
data are input to provide a value for a TAC or efiort control measure, e.g. a stock assessment method including
the estimation of reference points for use in a harvest control rule (HCR). A main objective of an MSE is to
show through simulation trials whether a proposed MP or harvest strategies is robust to uncertainty. A HCR is
set of well-defined rules used for determining a management action in the form of a TAC or allowable fishing
effort. The MP uses an biomass dynamic model to derive population parameters and reference points from
historical data (i.e. catch and efiort) and to projection the stock as part of a HCR.
2. Management Objectives
The main Management Objective of ICCAT is to maintain the populations of tuna and tuna-like fishes at levels
which will permit the maximum sustainable catch. Originally interpreted as using MSY as a target. Whole the
Precautionary Approach [?] requires stock status to be assessed relative to limits and targets, to predict outcomes
of management alternatives for reaching targets and avoiding limits, and to characterise uncertainty. The
Commission has therefore asked the SCRS to develop a Limit Reference Point for North Atlantic swordfish that
will trigger a rebuilding plan if biomass drops below it.
1 ICCAT Secretariat, C/Corazón de María, 8. 28002 Madrid, Spain; [email protected]; Phone: +34 914 165 600, Fax: +34 914 152 612. 2 AZTI-Tecnalia, Herrera Kaia Portualdea, 20110, Pasaia, Spain; [email protected]; Phone: +34 667 174 456 Fax: +34 94 657 25 55. 3 Instituto Espa~nol de Oceanografía IEO- CO Málaga, Pto. Pesquero s/n, 29640 Fuengirola (Málaga), Spain; [email protected]; Phone: +34 952 19 71 24 Fax: +34 952 46 38 08.
1355

2.1 Precautionary Approach
The Precautionary Approach imposes specific needs for research, stock assessments, monitoring and
management. A harvest control rule (HCR) is recommended to specify in advance what actions should be taken
when limits are reached. Although HCRs may include precautionary elements, it does not mean that they will be
precautionary in practice (Kirkwood and Smith 1996). If HCRs are not evaluated formally to determine whether
they will actually achieve the goals for which they were designed, given the uncertainty inherent in the system
being managed (Punt 2008). Therefore Management Strategy Evaluation (MSE) is increasingly been used to
evaluate the impact of the main sources of uncertainty inherent in the system being managed (Cooke 1999). As
well as reference points and HCRs, the minimum data and knowledge required for the assessment methods used
for decision-making are evaluated. MSE allows uncertainty, beyond just the assessment process, to be
considered. In this paper we detail a Management Procedure based on ASPIC that uses a HCR to set a total
allowable catch (TAC)
2.2 Tuna RFMOs
Many of the tuna Regional Fisheries Management Organisations (tRFMOs) have been developing LRPs using
MSE to evaluate them i.e.
ICCAT is using MSE to develop LRPs for North Atlantic Albacore; about to embark on MSE for
Bluefin tuna in order to develop long term management plans.
WCPFC have evaluated reference points using MSE, without feedback and made recommendations on
LRPs
IOTC is starting to evaluate reference points using MSE with feedback, initially defined interim
reference points for immediate use which will then be evaluated using MSE.
CCSBT Have used MSE to develop a full Management Procedure
IATTC are not using MSE, and are considering using the IOTC interim approach o define limit
reference points based on percentages of BMSY and FMSY.
2.2.1 ICCAT
ICCAT is developing LRP for North Atlantic swordfish as well as albacore. i.e. In advance of the next
assessment of Northern Atlantic Albacore, the SCRS shall develop a Limit Reference Point (LRP) for this stock.
Future decisions on the management of this stock shall include a measure that would trigger a rebuilding plan,
should the biomass decrease to a level approaching the defined LRP as established by the SCRS. [Rec. 11-04]
The principles of Decision Making [REC 11-13] require that if a stock is in the Red Quadrant of the Kobe phase
plot that management should ensure a high probability of ending overfishing in as short a period as possible. A
plan must also be adopted for rebuilding taking into account the biology of the stock and SCRS advice. However
the risk levels, probabilities and time scales required to implement an appropriate management framework are
not specified.
For stocks that are in the Green Quadrant, i.e. those that are not overfished and not subject to overfishing,
management measures shall be designed to result in a high probability of maintaining the stock within the green
quadrant.
2.2.2 WCPFC
WCPFC has asked SPC to provide advice on candidate reference points. To do this SPC used MSE (without
feedback) based on Multifan. They subsequently recommended a three tier approach based on decreasing levels
of information i.e.
FMSY and BMSY but only when there are reliable and precise estimates of steepness
FSPR and 20%SSB0 when steepness is uncertain but M, maturity, selectivity is well known
20%SSB0 alone when key fishery and biological variables are uncertain
2.2.3 IOTC
IOTC resolution (RES-12/01) on the Implementation of the Precautionary Approach states that in applying the
precautionary approach, the Commission shall adopt, after due consideration of the advice supplied by the
Scientific Committee
1356
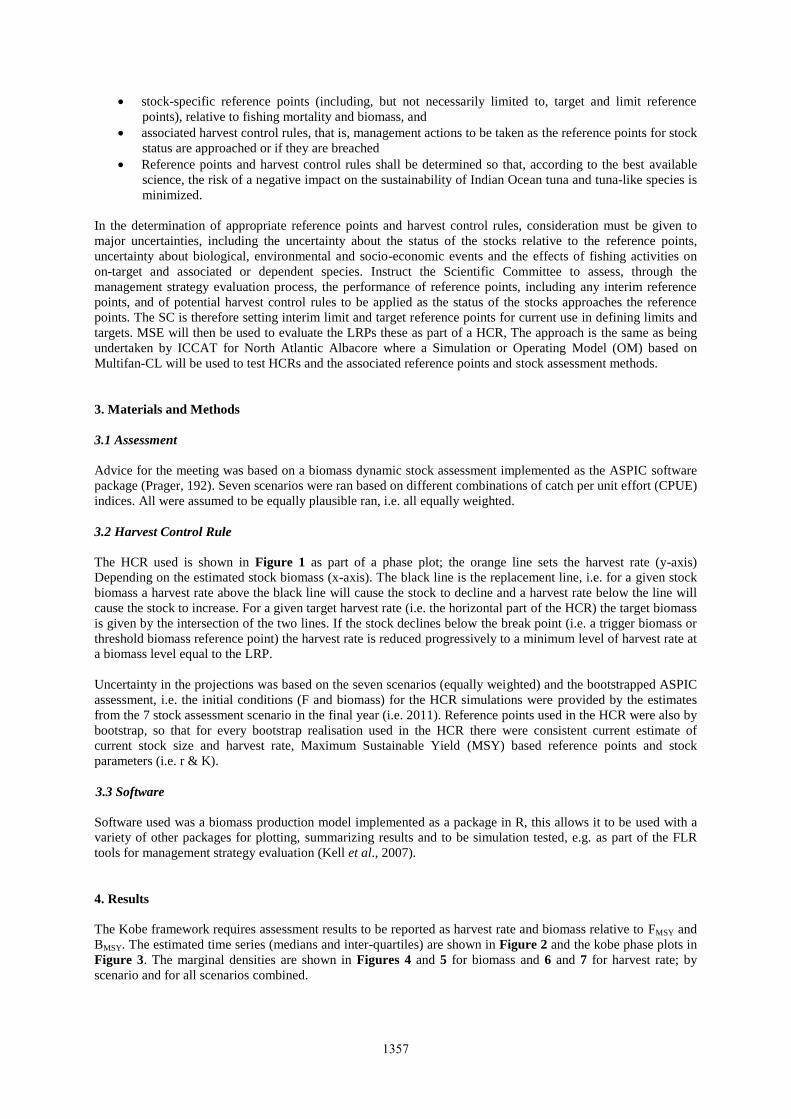
stock-specific reference points (including, but not necessarily limited to, target and limit reference
points), relative to fishing mortality and biomass, and
associated harvest control rules, that is, management actions to be taken as the reference points for stock
status are approached or if they are breached
Reference points and harvest control rules shall be determined so that, according to the best available
science, the risk of a negative impact on the sustainability of Indian Ocean tuna and tuna-like species is
minimized.
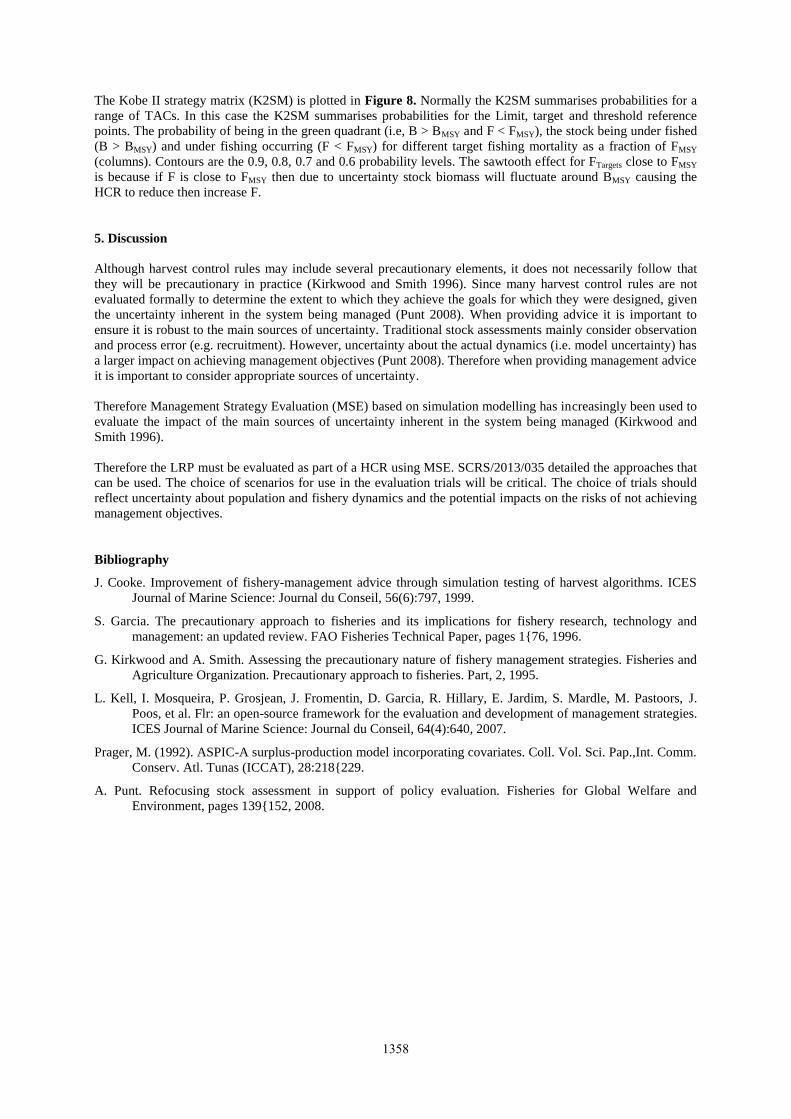
In the determination of appropriate reference points and harvest control rules, consideration must be given to
major uncertainties, including the uncertainty about the status of the stocks relative to the reference points,
uncertainty about biological, environmental and socio-economic events and the effects of fishing activities on
on-target and associated or dependent species. Instruct the Scientific Committee to assess, through the
management strategy evaluation process, the performance of reference points, including any interim reference
points, and of potential harvest control rules to be applied as the status of the stocks approaches the reference
points. The SC is therefore setting interim limit and target reference points for current use in defining limits and
targets. MSE will then be used to evaluate the LRPs these as part of a HCR, The approach is the same as being
undertaken by ICCAT for North Atlantic Albacore where a Simulation or Operating Model (OM) based on
Multifan-CL will be used to test HCRs and the associated reference points and stock assessment methods.
3. Materials and Methods
3.1 Assessment
Advice for the meeting was based on a biomass dynamic stock assessment implemented as the ASPIC software
package (Prager, 192). Seven scenarios were ran based on different combinations of catch per unit effort (CPUE)
indices. All were assumed to be equally plausible ran, i.e. all equally weighted.
3.2 Harvest Control Rule
The HCR used is shown in Figure 1 as part of a phase plot; the orange line sets the harvest rate (y-axis)
Depending on the estimated stock biomass (x-axis). The black line is the replacement line, i.e. for a given stock
biomass a harvest rate above the black line will cause the stock to decline and a harvest rate below the line will
cause the stock to increase. For a given target harvest rate (i.e. the horizontal part of the HCR) the target biomass
is given by the intersection of the two lines. If the stock declines below the break point (i.e. a trigger biomass or
threshold biomass reference point) the harvest rate is reduced progressively to a minimum level of harvest rate at
a biomass level equal to the LRP.
Uncertainty in the projections was based on the seven scenarios (equally weighted) and the bootstrapped ASPIC
assessment, i.e. the initial conditions (F and biomass) for the HCR simulations were provided by the estimates
from the 7 stock assessment scenario in the final year (i.e. 2011). Reference points used in the HCR were also by
bootstrap, so that for every bootstrap realisation used in the HCR there were consistent current estimate of
current stock size and harvest rate, Maximum Sustainable Yield (MSY) based reference points and stock
parameters (i.e. r & K).
3.3 Software
Software used was a biomass production model implemented as a package in R, this allows it to be used with a
variety of other packages for plotting, summarizing results and to be simulation tested, e.g. as part of the FLR
tools for management strategy evaluation (Kell et al., 2007).
4. Results
The Kobe framework requires assessment results to be reported as harvest rate and biomass relative to FMSY and
BMSY. The estimated time series (medians and inter-quartiles) are shown in Figure 2 and the kobe phase plots in
Figure 3. The marginal densities are shown in Figures 4 and 5 for biomass and 6 and 7 for harvest rate; by
scenario and for all scenarios combined.
1357
The Kobe II strategy matrix (K2SM) is plotted in Figure 8. Normally the K2SM summarises probabilities for a
range of TACs. In this case the K2SM summarises probabilities for the Limit, target and threshold reference
points. The probability of being in the green quadrant (i.e, B > BMSY and F < FMSY), the stock being under fished
(B > BMSY) and under fishing occurring (F < FMSY) for different target fishing mortality as a fraction of FMSY
(columns). Contours are the 0.9, 0.8, 0.7 and 0.6 probability levels. The sawtooth effect for FTargets close to FMSY
is because if F is close to FMSY then due to uncertainty stock biomass will fluctuate around BMSY causing the
HCR to reduce then increase F.
5. Discussion
Although harvest control rules may include several precautionary elements, it does not necessarily follow that
they will be precautionary in practice (Kirkwood and Smith 1996). Since many harvest control rules are not
evaluated formally to determine the extent to which they achieve the goals for which they were designed, given
the uncertainty inherent in the system being managed (Punt 2008). When providing advice it is important to
ensure it is robust to the main sources of uncertainty. Traditional stock assessments mainly consider observation
and process error (e.g. recruitment). However, uncertainty about the actual dynamics (i.e. model uncertainty) has
a larger impact on achieving management objectives (Punt 2008). Therefore when providing management advice
it is important to consider appropriate sources of uncertainty.
Therefore Management Strategy Evaluation (MSE) based on simulation modelling has increasingly been used to
evaluate the impact of the main sources of uncertainty inherent in the system being managed (Kirkwood and
Smith 1996).
Therefore the LRP must be evaluated as part of a HCR using MSE. SCRS/2013/035 detailed the approaches that
can be used. The choice of scenarios for use in the evaluation trials will be critical. The choice of trials should
reflect uncertainty about population and fishery dynamics and the potential impacts on the risks of not achieving
management objectives.
Bibliography
J. Cooke. Improvement of fishery-management advice through simulation testing of harvest algorithms. ICES
Journal of Marine Science: Journal du Conseil, 56(6):797, 1999.
S. Garcia. The precautionary approach to fisheries and its implications for fishery research, technology and
management: an updated review. FAO Fisheries Technical Paper, pages 1{76, 1996.
G. Kirkwood and A. Smith. Assessing the precautionary nature of fishery management strategies. Fisheries and
Agriculture Organization. Precautionary approach to fisheries. Part, 2, 1995.
L. Kell, I. Mosqueira, P. Grosjean, J. Fromentin, D. Garcia, R. Hillary, E. Jardim, S. Mardle, M. Pastoors, J.
Poos, et al. Flr: an open-source framework for the evaluation and development of management strategies.
ICES Journal of Marine Science: Journal du Conseil, 64(4):640, 2007.
Prager, M. (1992). ASPIC-A surplus-production model incorporating covariates. Coll. Vol. Sci. Pap.,Int. Comm.
Conserv. Atl. Tunas (ICCAT), 28:218{229.
A. Punt. Refocusing stock assessment in support of policy evaluation. Fisheries for Global Welfare and
Environment, pages 139{152, 2008.
1358

Table 1. Fleet definitions
Figure 1. Example of a Harvest Control Rule (orange) plotted on a phase plot of harvest rate relative to FMSY
and stock biomass relative to BMSY. The black line is the replacement line.
1359
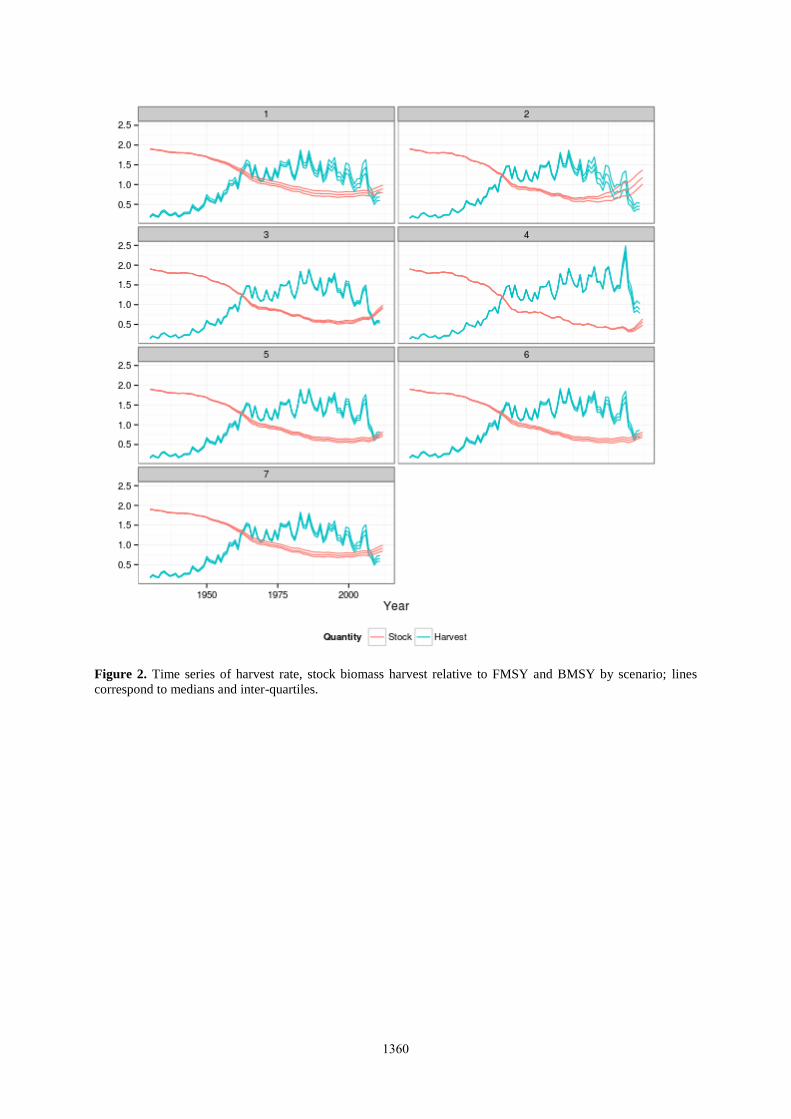
Figure 2. Time series of harvest rate, stock biomass harvest relative to FMSY and BMSY by scenario; lines
correspond to medians and inter-quartiles.
1360
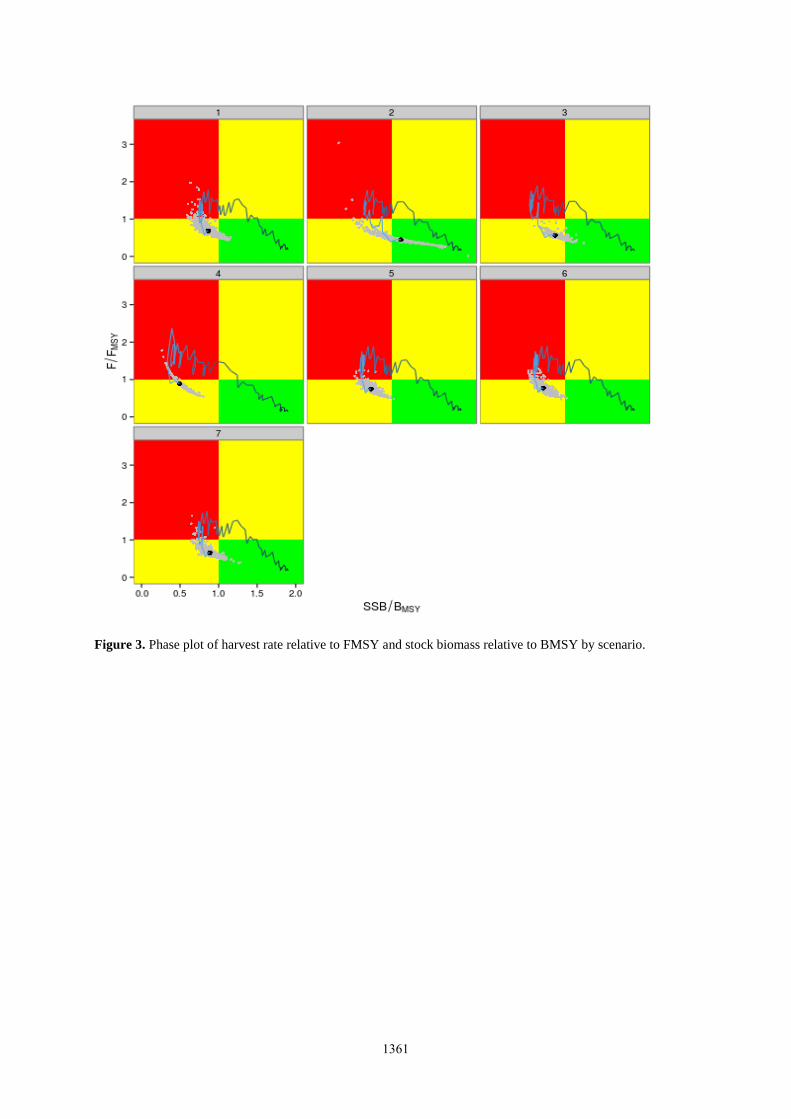
Figure 3. Phase plot of harvest rate relative to FMSY and stock biomass relative to BMSY by scenario.
1361

Figure 4. Marginal distributions of B: BMSY in the last assessment year (2011) by scenario.
Figure 5. Marginal distributions of B: BMSY in the last assessment year (2011); densities are stacked.
1362
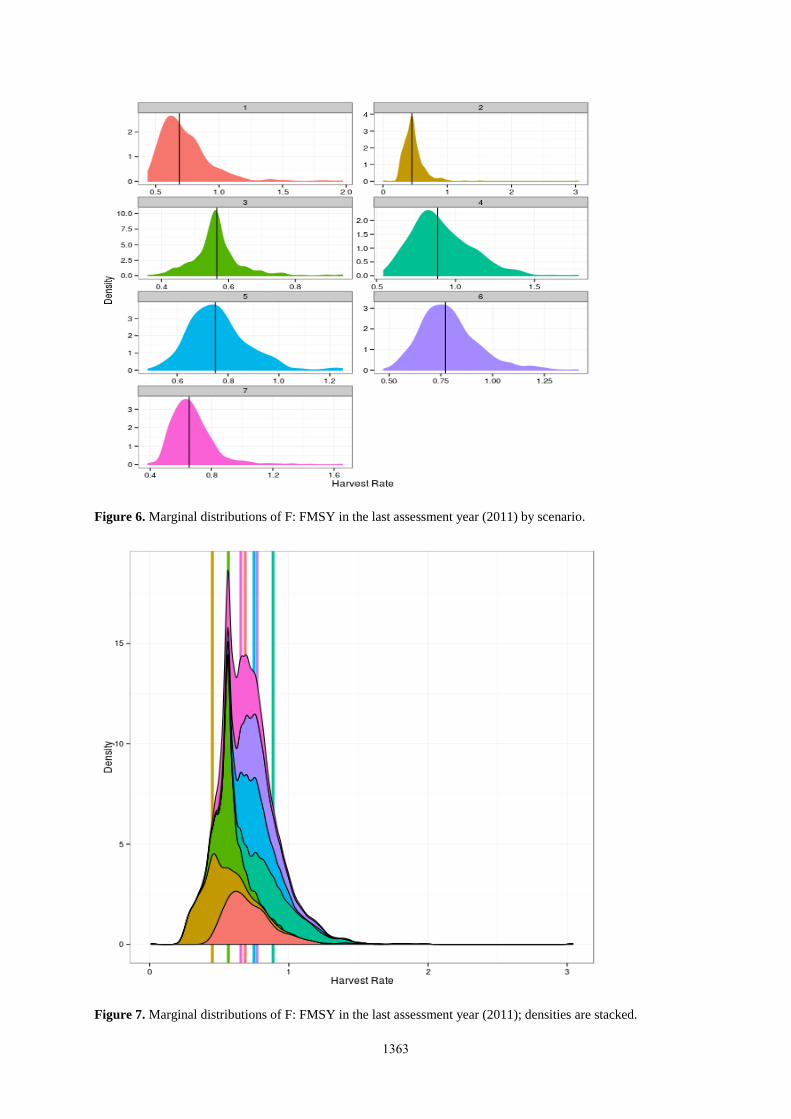
Figure 6. Marginal distributions of F: FMSY in the last assessment year (2011) by scenario.
Figure 7. Marginal distributions of F: FMSY in the last assessment year (2011); densities are stacked.
1363
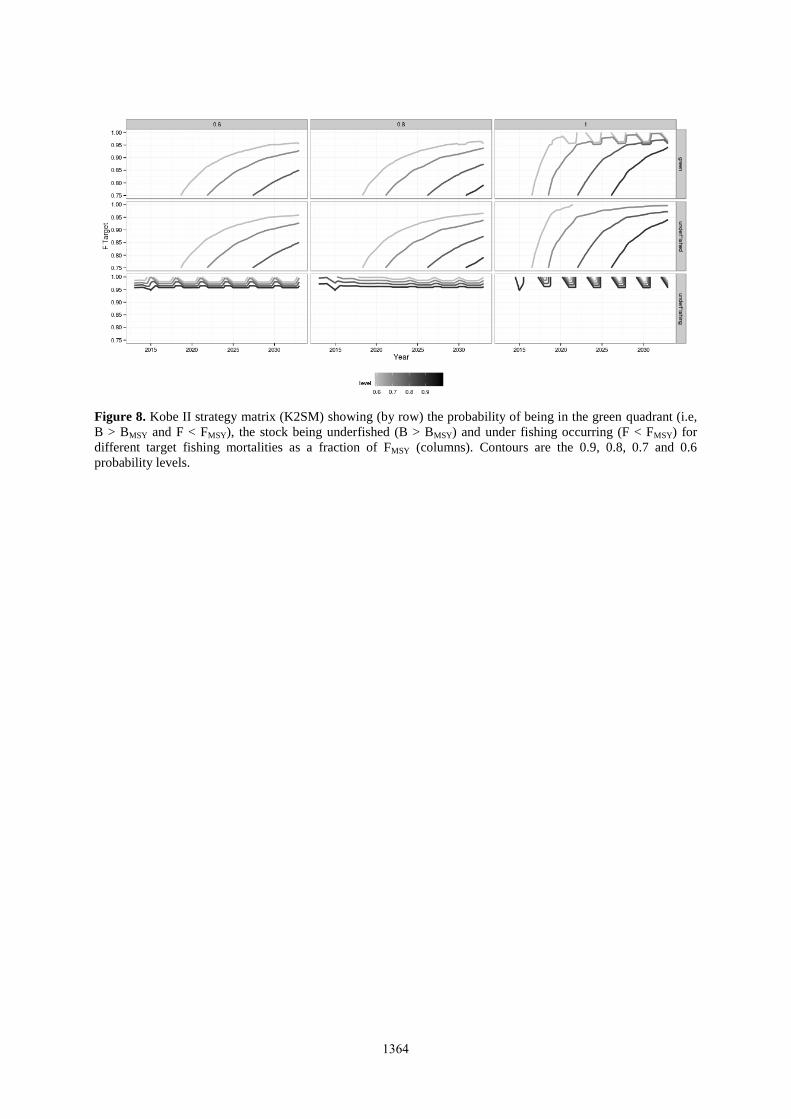
Figure 8. Kobe II strategy matrix (K2SM) showing (by row) the probability of being in the green quadrant (i.e,
B > BMSY and F < FMSY), the stock being underfished (B > BMSY) and under fishing occurring (F < FMSY) for
different target fishing mortalities as a fraction of FMSY (columns). Contours are the 0.9, 0.8, 0.7 and 0.6
probability levels.
1364