Embed Size (px)
Citation preview
SCRS/2017/092 Collect. Vol. Sci. Pap. ICCAT, 74(2): 432-456 (2017)
432
UNCERTAINTY GRID FOR NORTH ATLANTIC ALBACORE MANAGEMENT STRATEGY EVALUATION: CONDITIONING OPERATING MODELS
Gorka Merino1, Haritz Arrizabalaga1, Josu Santiago2, Rishi Sharma3, Victoria Ortiz de Zarate4, Paul De Bruyn5, Laurence T. Kell5
SUMMARY
Management Strategy Evaluation (MSE) requires characterizing the main sources of uncertainty inherent to fisheries. The unknowns that challenge the interpretation of fish stock assessments include gaps on biological processes and fishery dynamics. The first are often dealt by imposing ranges of input biological parameters to stock assessment models; and the second with assumptions over the available datasets. The uncertainties explored in the North Atlantic albacore MSE so far include the range of stock assessment scenarios tested in 2013 with the statistical, size-based, age structured model Multifan-CL. These explore the impacts of a range of data series combinations as the main source of uncertainty together with a natural mortality scenario. In this paper, we condition a grid of Operating Models by expanding the initial set of runs from 2013 using (a) alternatives for input biological parameters (natural mortality and steepness) and fishery dynamics (1% increase of catchability), and (b) projections using three scenarios for future recruitment. This work aims to expand the grid of OMs so that the tested HCRs are robust to a wider range of uncertainty.
RÉSUMÉ
L’évaluation de la stratégie de gestion (MSE) implique la caractérisation des principales sources d’incertitude inhérentes aux pêcheries. Les inconnues qui compliquent l’interprétation des évaluations des stocks de poissons incluent les lacunes des processus biologiques et des dynamiques des pêcheries. La première difficulté est souvent abordée en imposant des gammes de paramètres biologiques d’entrée dans les modèles d’évaluation des stocks tandis que la deuxième est résolue avec des postulats concernant les jeux de données disponibles. Les incertitudes explorées dans la MSE du germon de l'Atlantique Nord jusqu’à présent incluent la gamme de scénarios d’évaluation des stocks testés en 2013 avec le modèle Multifan-CL de type statistique, fondé sur les tailles et structuré par âge. Ceux-ci explorent les impacts d’une gamme de combinaisons de séries de données en tant que principale source d’incertitude ainsi qu’un scénario de mortalité naturelle. Ce document fait état du conditionnement d’une gamme de modèles opérationnels réalisé en élargissant le jeu initial de scénarios de 2013 au moyen de (a) alternatives aux paramètres biologiques d'entrée (mortalité naturelle et pente « steepness ») et aux dynamiques des pêcheries (augmentation de 1% de la capturabilité) et (b) projections réalisées au moyen de trois scénarios de recrutement futur. Le présent travail vise à élargir la gamme des modèles opérationnels de manière à ce que les HCR testées résistent à une plus grande gamme d’incertitudes.
RESUMEN
La evaluación de estrategias de ordenación (MSE) requiere la caracterización de las principales fuentes de incertidumbre inherentes a las pesquerías. Los elementos desconocidos que plantean un reto a la interpretación de las evaluaciones de stocks de peces incluyen lagunas relacionadas con los procesos biológicos y la dinámica de las pesquerías. Las primeras suelen abordarse mediante la imposición de gamas de parámetros biológicos de entrada en los modelos de evaluación de stock y la segunda con supuestos sobre los conjuntos de datos disponibles. Las
1 AZTI, Herrera Kaia Portualdea, 20110, Pasaia, Spain; E-mail: [email protected] 2 AZTI, Txatxarramendi uhartea, 48395, Sukarrieta, Spain. 3 NOAA-Fisheries, Southeast Fisheries Science Center, 75 Virginia Beach Dr., Miami, FL 33149, US. 4 Instituto Español de Oceanografía, Apdo.240, 39080 Santander, Spain. 5 ICCAT Secretariat, c/Corazón de María, 8. 28002 Madrid, Spain.
433
incertidumbres exploradas en la MSE de atún blanco del Atlántico norte hasta la fecha incluyen la gama de escenarios de evaluación de stock probados en 2013 con el modelo estadístico estructurado por edad y basado en la talla Multifan-CL. Dichos escenarios exploran los impactos de una gama de combinaciones de series de datos como la principal fuente de incertidumbre junto con un escenario de mortalidad natural. En este documento, se condiciona una gama de modelos operativos expandiendo el conjunto de ensayos inicial de 2013 utilizando a) alternativas para los parámetros biológicos de entrada (mortalidad natural e inclinación) y dinámica de la pesquería (incremento del 1% en la capturabilidad), y b) proyecciones que utilizan tres escenarios para el reclutamiento futuro. El objetivo de este trabajo es expandir la gama de OM de tal modo que las HCR probadas sean robustas frente a un mayor grado de incertidumbre.
KEYWORDS
Tuna fisheries, Stock Assessment, Fishery Management, Quota Regulations, Resource Conservation, Harvest
Control Rules, Management Strategy Evaluation, North Atlantic albacore, Operating Models
1. Introduction
Management Strategy Evaluation (MSE) is used to evaluate the impacts of the uncertainties inherent to fisheries (Punt et al., 2014). Conducting an MSE requires following a series of basic steps, which among others include (from Punt et al., 2014): (a) identifying a range of uncertainties related to biology, the environment, the fishery and the management system, to which a management strategy should be robust; (b) developing a set or grid of models which provide mathematical representation of the plausible dynamics of the fishery system (operating models, OM); and (c) fitting or conditioning the OMs and quantifying the impact of the uncertainties considered. The foundational objective of the International Commission for the Conservation of Atlantic Tunas (ICCAT) is to maintain populations at levels that can permit the maximum sustainable yield (or above). For that, a series of recommendations have fostered the development of reference points (Rec. 11-04) and guidelines of decision making including Harvest Control Rules (Rec. 11-13 and Rec. 15-04). In 2016, the ability of a series of Harvest Control Rules to achieve management objectives for North Atlantic albacore was evaluated using MSE (Merino et al., 2016) and discussed in ICCAT’s Panel 2 (ICCAT, 2016a). In 2016, the SCRS developed a schedule for the development of MSE and Harvest Control Rules, which included further evaluations of HCRs through MSE for North Atlantic albacore. In the workplan agreed by the SCRS for North Atlantic albacore as part of the multiyear Albacore Research program, priority was given to exploring broader scenarios for the OMs available in 2016 and to exploring the impact of recruitment regime shifts in the OMs (ICCAT, 2016b). Finally, in 2016, the Commission adopted a multiannual conservation and management program for North Atlantic albacore (Rec. 16-06). This Rec. requests that “in 2017, the SCRS shall refine the testing of candidate reference points (e.g., SSBTHRESHOLD, SSBLIM and FTARGET) and associated harvest control rules (HCRs) that would support the management objective expressed in paragraph 2 above. The SCRS shall also provide statistics to support decision‐making in accordance with the performance indicators in Annex 2. The result of the analyses described in paragraph 12 will be discussed in a dialogue between scientists and managers to be organised in 2017, either during a meeting of the SWGSM or as an inter‐sessional meeting of Panel 2. Based on the SCRS inputs and advice provided pursuant to paragraph 12 above and the dialogue process indicated in paragraph 13, the Commission shall then endeavor in 2017 to adopt HCRs for the North Atlantic albacore, including pre‐agreed management actions to be taken under various stock conditions” (ICCAT, 2016c). In this paper we have increased the number of OMs upon which evaluate the effectiveness of Harvest Control Rules for North Atlantic albacore. The new grid has been built upon the 2013 Multifan-CL scenario runs (ICCAT, 2013; Kell et al., 2017; Merino et al., 2016). Multifan-CL is a computer program that implements a statistical, size-based, age-structured, and spatial-structured model for use in fisheries stock assessment (Kleiber et al., 2012). The program is used routinely for tuna stock assessments by the Oceanic Fisheries Programme (OFP) of the Secretariat of the Pacific Community (SPC) in the western and central Pacific Ocean (WCPO) and both the Indian Ocean Tuna Commission (IOTC) and ICCAT have used this model for stock assessment. The model is fit to time series of catch and size composition data from either one or many fishing fleets. Size composition data may be in the form of either length or weight-frequency data, or both. The model may also be fit simultaneously to tagging data, if available. The scenarios run in the 2013 assessment of North Atlantic albacore include a base case and alternate runs with a series of specific changes to include/exclude certain sources of data. The list of runs also includes one with an age-specific natural mortality vector. From the list of 10 runs from the 2013 assessment, we reproduced each run for

434
higher and lower natural mortality values, obtaining a total of 30 scenarios. For each, we also developed a dynamic catchability scenario (mimicking an effort creep through time). In 2013, the steepness of the stock recruitment relation was estimated through a weak prior. Here, we created additional scenarios by imposing strict priors of steepness at a range of values (0.7, 0.8 and 0.9). The combination of the initial 10 runs with two additional natural mortalities, a dynamic catchability and three additional steepness scenarios results in a grid of 240 runs, which will be explained in detail in the next sections. The OMs are conditioned from the output of the 240 Multifan-CL model runs. The overall selectivity, age-specific natural mortality, stock recruitment relationship, maturity and growth are taken directly from the Multifan-CL output files. The resulting OMs are projected forward to 2014, which was the last year of the data series’ used in the 2016 assessment of this stock (ICCAT, 2016d). During the following sections we explore how the hypotheses considered when building the grid may impact the stock status, fishery indicators and reference points of North Atlantic albacore. Finally, we project forward each of the OMs with their estimated fishing mortality at MSY under three assumptions on the recruitment regime (current and ± 20% change). 2. Material and methods
2.1. Multifan-CL runs
The Multifan-CL scenarios for the 2013 scenarios are run through a series of files:
1) mfcl.exe: The executable file. 2) albN.ini: Information on biological characteristics of the fish. 3) albN.frq: Catch, effort and size data. 4) doitallN.alb: Batch execution file. 5) albN.tag: Tag release information (if available).
The starting point for the new grid was the 10 scenarios run with Multifan-CL in the 2013 stock assessment (ICCAT, 2013) (Table 1). In brief, the common features of the scenarios are (Merino et al., 2013; Kell et al., 2017):
• Single region, • Catch data from 1930 to 2011 and size frequency from 1959 to 2011, • 12 separate fisheries (with specific selectivity’s), • Beverton-Holt recruitment model following a weak relationship, • Length-at-age assumed to be normally distributed for each age class with mean lengths at age following
a von Bertalanffy growth curve, • Time series of catchability for the Spanish bait boat and the Japanese longline fleets, • Constant natural mortality at M=0.3, • Maturity vector with 50% of mature at age-class 5 and 100% at age-class 6 onwards, • China Taipei longline size frequency data not included, • Japanese longline catch per unit of effort down-weighted.
a) Natural mortality: From the initial list (Table 1), the impact of the input natural mortality values was
explored by reproducing the same scenarios with constant natural mortality of M=0.2 and M=0.4, plus the age-specific natural mortality vector of scenario Alt5 multiplied by 0.2/03 and by 0.4/0.3. This was done by modifying line 11 in the albN.ini file:
For the scenarios derived from Alt5, the following age pars needed to be modified too:
# natural mortality 0.3
# age_pars m=0.3 [10 sets of age-specific parameters for each age class] Includes fixed M not growth 0 0 0 0 0 0 0 0 0 0 0 0 0 0 0 0 0 0 0 0 0 0 0 0 0 0 0 0 0 0 0 0 0 0 0 0 0 0 0 0 0 0 0 0 0 0 0 0 0 0 0 0 0 0 0 0 0 0 0 0 -0.614336 -0.877070019 -1.046969056 -1.167962367 -1.255266099 -1.241328591 -1.158362293 -1.072944542 -0.975510092 -0.867500568 -0.74865989 -0.610645959 -0.610645959 -0.610645959 -0.610645959

435
The 15 mortality values for each of the 15 age classes are introduced in their log form in the age-pars in line 19 of the file. For example, for age-class 0, the value -0.614336 represents a value of M0=0.541.
b) Dynamic catchability: A 1% increase in catchability was considered for all fisheries since 1980. Starting from line 44, the albN.frq files supply monthly data per fishery and age of fish. The sixth number of each line after line 44 corresponds to fishing effort, which is modified with equation (eq. 1):
(eq. 1) Effortt,dynq = Effortt x 1.01year-τ ; τ being max(1980, initial year of the series) c) Steepness: It is defined as the ratio of the equilibrium recruitment produced by 20% SSB0 and the
equilibrium recruitment at SSB0. In 2013, the prior used corresponds to a mode of 0.75 and a standard deviation of 0.15, which is considered a weak prior. Steepness priors are introduced through age flags 153 and 154 in phase 7 of the doitall_mod.alb file, in this case with values of 35 and 21 (Merino et al., 2013):
We have added three more steepness prior alternatives (modes of 0.7, 0.8 and 0.9), all with standard deviations of 0.05, which can be considered stricter than the 2013 prior. To do so, the 153 and 154 age-flags need to be replaced with the numbers Table 2. To sum up, 240 scenarios were available to run in Multifan-CL, which were named with a string containing the name of the original scenario, followed by a mortality identifier (M02, M03, M04), a steepness identifier (h6, h7, h8, h9; h6 being the weak prior of 0.75 and the following the strong priors of 0.7, 0.8, 0.9), and a dynamic catchability identifier (q0 and q1, being the latest the dynamic q). For example, the scenario Alt4_M02_h8_q1 is based on the original Alt4 but with a natural mortality value of 0.2, a strong steepness prior of 0.8 and effort data modified to simulate the impacts of a 1% increase in catchability since 1980.
2.2. Conditioning of the Operating Models
The outputs of the Multifan-CL runs were used to condition 240 OMs. The results of the stock assessments are contained in the files 07.par and plot-07.par for each scenario. The OMs were conditioned using libraries from the FLR-project (www.flr-project.org). The libraries used are FLCore, FLash and FLBRP, all available from the FLR repository (http://flr-project.org/R). In particular, the function readMFCL applied to the two results files creates an FLR object of the type FLStock, containing the features of the stock as estimated from Multifan-CL. The new object is composed by a single fishery and includes parameters (selectivity, growth, natural mortality, stock-recruitment and maturity), time series of catch and biomass (in total and by age) and harvest time series, among other information. Additional FLR functions were used to estimate reference points and equilibrium curves. Finally, the OM were projected forward to 2014 with total catch information from 2012-2014.
Regime shifts projections: Changes in recruitment can also be part of the Operating Models and hypotheses to which harvest strategies need to be robust in a MSE framework (Merino et al., 2016). As a preliminary exploration of what an overall increase of recruitment can produce on this fishery we projected forward the grid of scenarios under FMSY and three regimes for future recruitment: 1) Future recruitment will follow the stock-recruitment relationship as estimated by Multifan-CL, 2) recruitment will follow the same relationship but the estimates will be increased in a 20% and, 3) recruitment will follow the same relationship but the estimates will be reduced in a 20%.
# Year Month Week Fishery Catch(t) Effort Length_sample [30 32 34 36 ….
2 153 35 # 2 154 21 #

436
3. Results
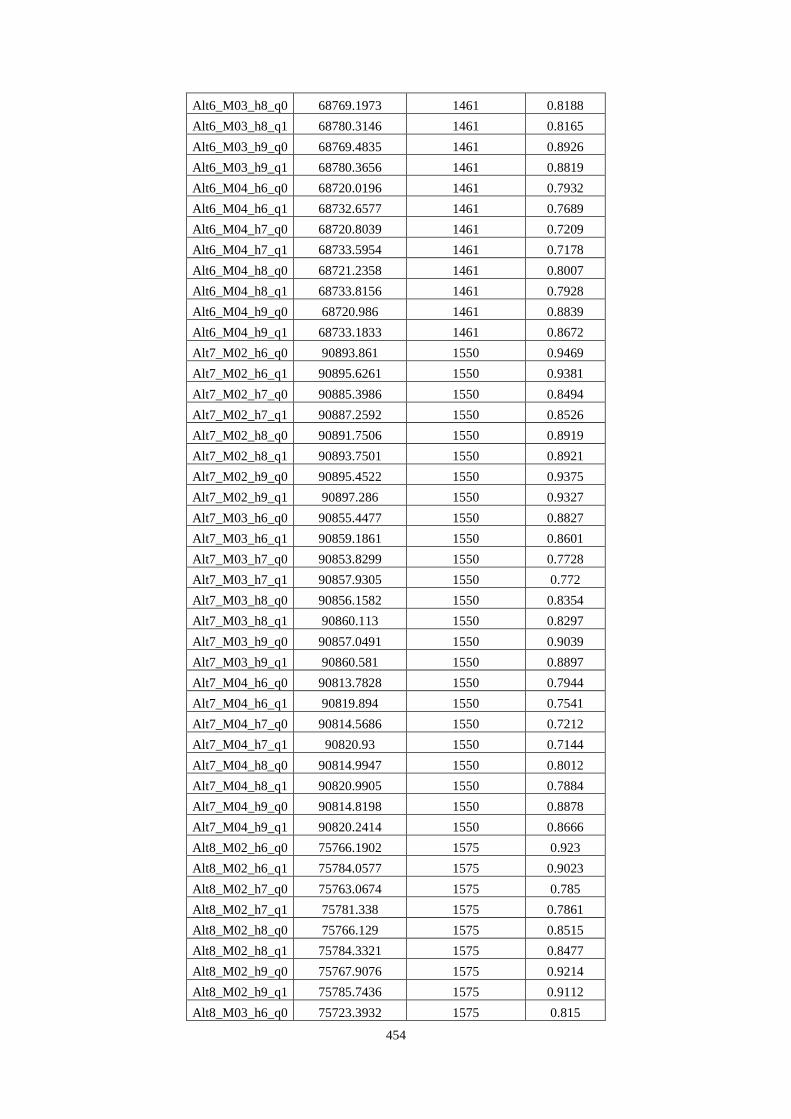
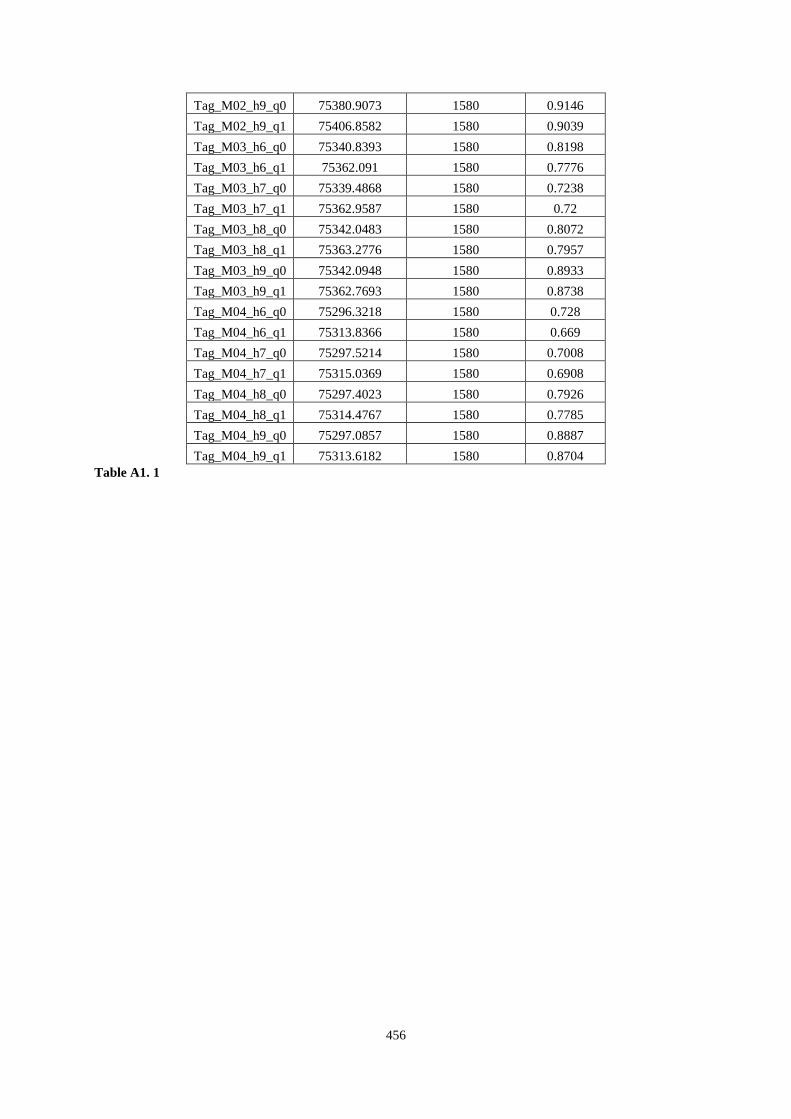
When fitting a model with multiple parameters it is possible to initially fix some parameters during the first optimization (of some other parameters), the fixed parameters are then being estimated in later phases. This helps in fitting since the most influential parameters can be addressed first. Figures 1 and Figure 2 show the values of the objective function and the number of parameters estimated for each scenario and phase (see also Table A1). The scenarios in these figures are colored relative to their original scenario from 2013 runs. Overall, all the runs fit a major part of parameters in the first phase. The biggest change in the likelihoods is seen between phase 1 and 2 when selectivity is estimated. Note that scenario Alt5 has 8 phases.
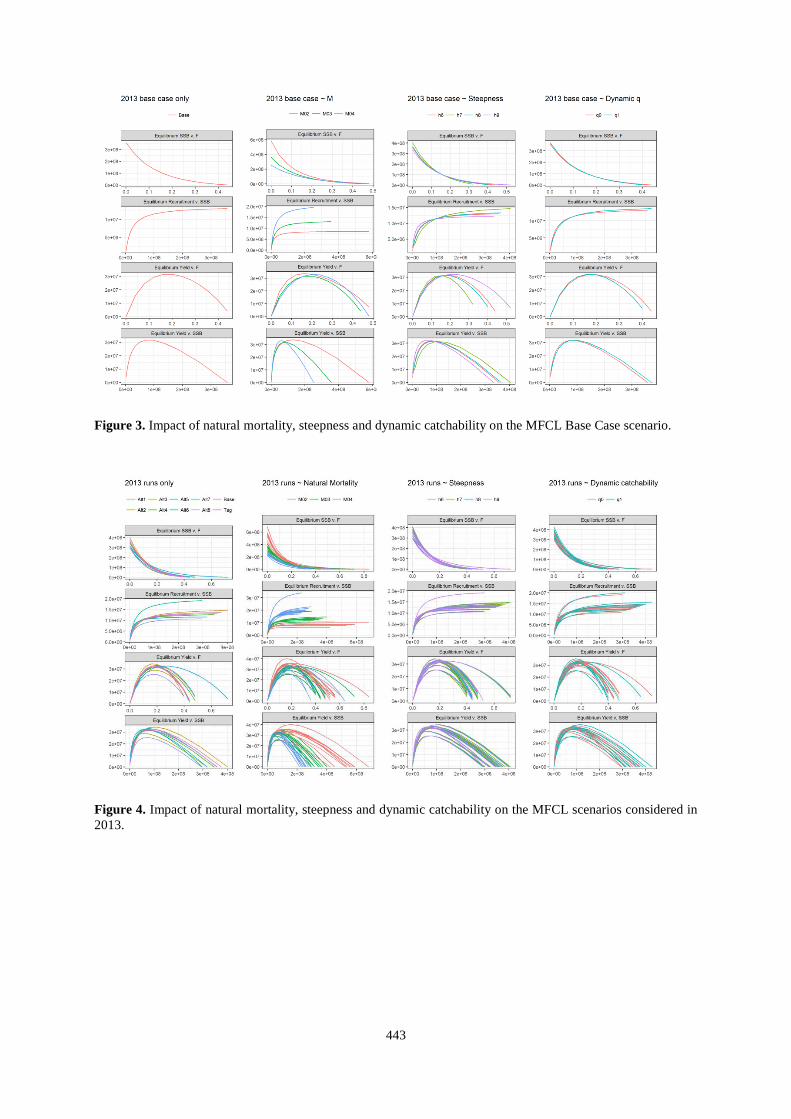
The impact of each of the components of the grid proposed here are shown in Figures 3 and 4. Figure 3 shows the ranges of equilibrium management indicators and reference points produced for each of the components on the 2013 base case scenario. Figures 3, 4 and 6 show the impact of variations on natural mortality, steepness and catchability on: (i) equilibrium spawning stock biomass (ssb) vs fishing mortality, (ii) equilibrium recruitment vs ssb, (iii) equilibrium yield vs fishing mortality, and (iv) equilibrium yield vs ssb. The 2013 base case scenario assumes a production function skewed to the left with an estimated MSY slightly above 30 th tons. The greatest impacts on the 2013 base case are produced by natural mortality. In particular, increasing natural mortality requires that the model compensates the consequent loss of biomass by increasing recruitment. In contrast, lower M produces a lower estimate of recruitment for the same amount of ssb. Another relation that changes notable with M is the equilibrium yield vs ssb. The estimated unexploited biomass and the biomass at MSY are significantly reduced for higher M. In contrast, the estimated MSY is not modified. With regards to the steepness priors, the impact is noted in the estimated stock recruitment relation and the yield vs F curve. Higher steepness produces lower recruitment at high ssb but higher recruitment at low levels of ssb. As expected, the OM conditioned with the highest steepness scenarios will be more resilient when the stock is severely overexploited. With regards to the assumption of dynamic catchability, it does not produce notable changes on the estimated equilibria and reference points of the fishery.
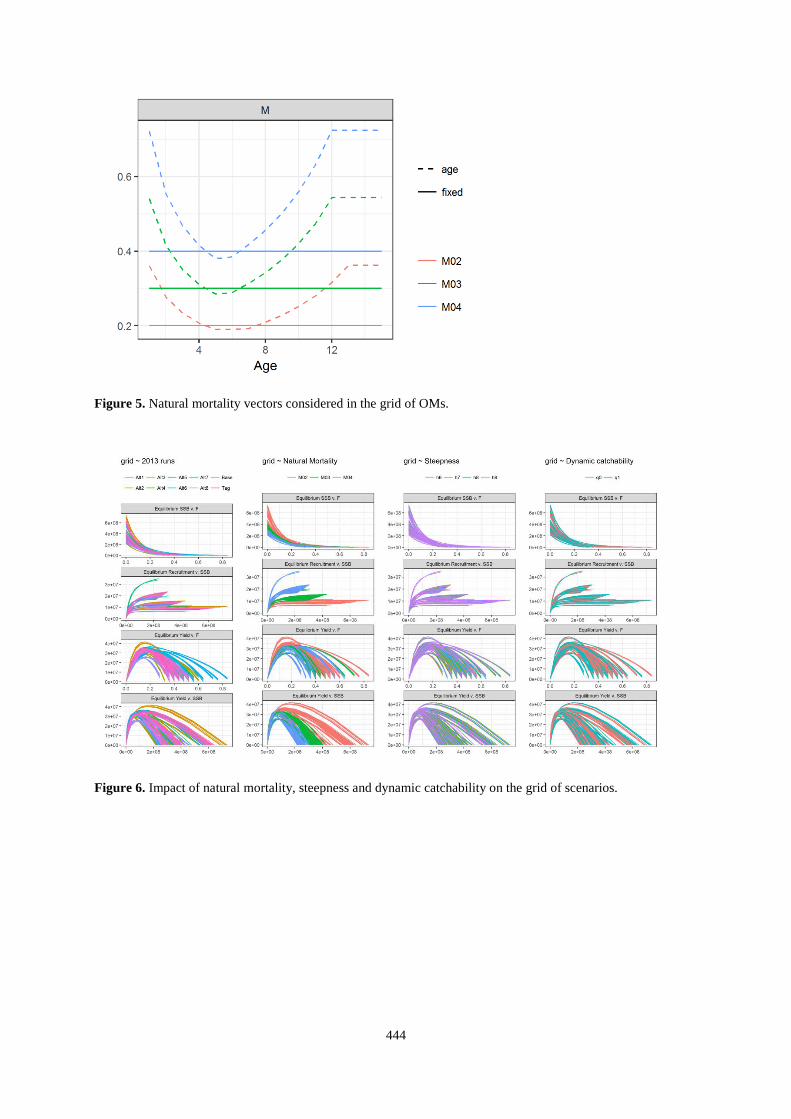
In 2013, the range of modelling specifications considered produced alternative estimations of albacore’s population dynamics (Figure 4). Looking at the 2013 scenarios only, the largest differences in production functions are between scenarios Alt2 and Alt8, which included the lowest estimated recruits-per-spawner and estimated MSY for Alt2 and the highest for Alt8. Alt8 was originally designed to explore if combining CPUE and catch data in numbers and in weight into Multifan-CL could produce appreciable impacts on the overall results of the assessment. Scenario Alt2 excluded data prior to 1950 and results suggest that the previous period may have been less productive than the more recent. Alt5 scenario assumes higher natural mortality for all ages than its corresponding scenario with M constant for all ages (e.g M03, see Figure 5). Therefore, the model requires higher recruits to explain the available data. Scenario Alt3 also estimates a fish stock with lower productivity than average. This scenario down-weighs all the size frequency information.
The effect of each of the biological parameters explored here upon the initial scenarios also suggests that the assumptions on natural mortality produce the major effect on fisheries’ productivity. As said earlier, increasing the input natural mortality parameter produces higher recruits-per-spawner in order to sustain the observed catch levels. The impact of the initial priors on steepness produces relevant changes for the response of severely overexploited stocks. Also, there is no appreciable pattern on the dynamic catchability assumption on fish stocks productivity across 2013 scenarios.
Similar results are seen in Figure 6, where the impact of each biological parameter is explored for all the grid of scenarios. Again, a clear relation is seen between the fixed natural mortality level, recruitment per spawner and production functions. Higher M produce estimates of lower MSY and higher recruit-per-spawner.
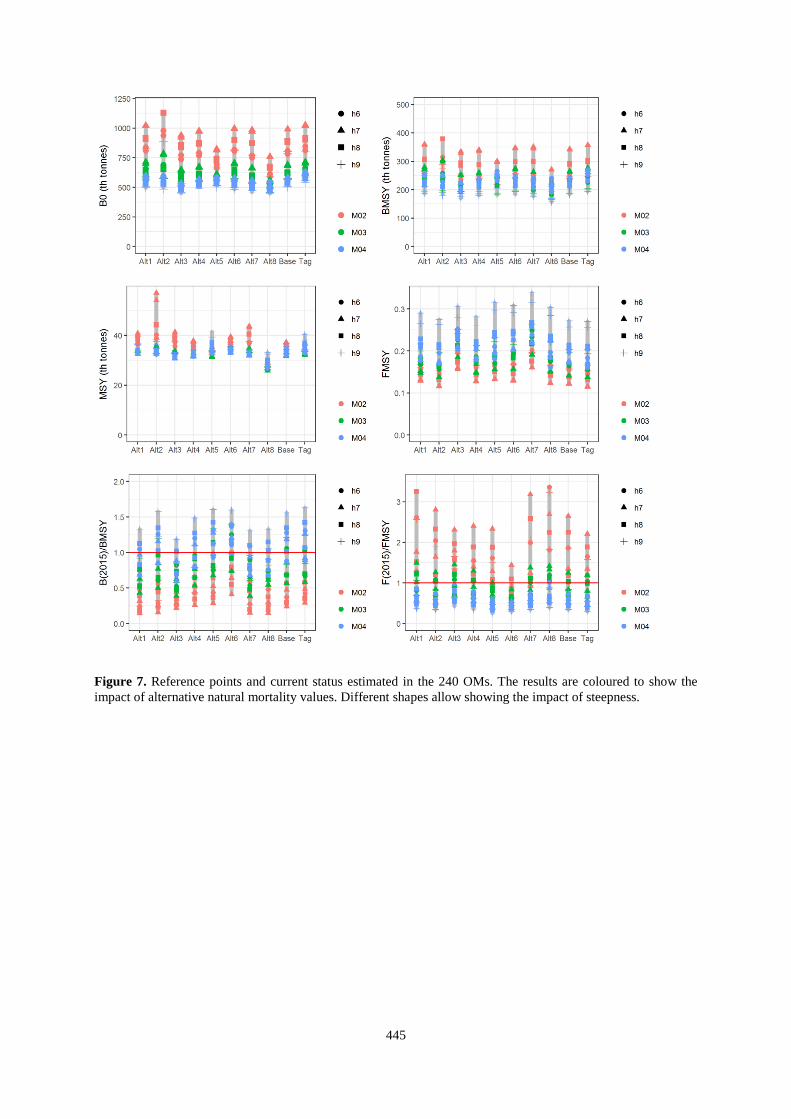
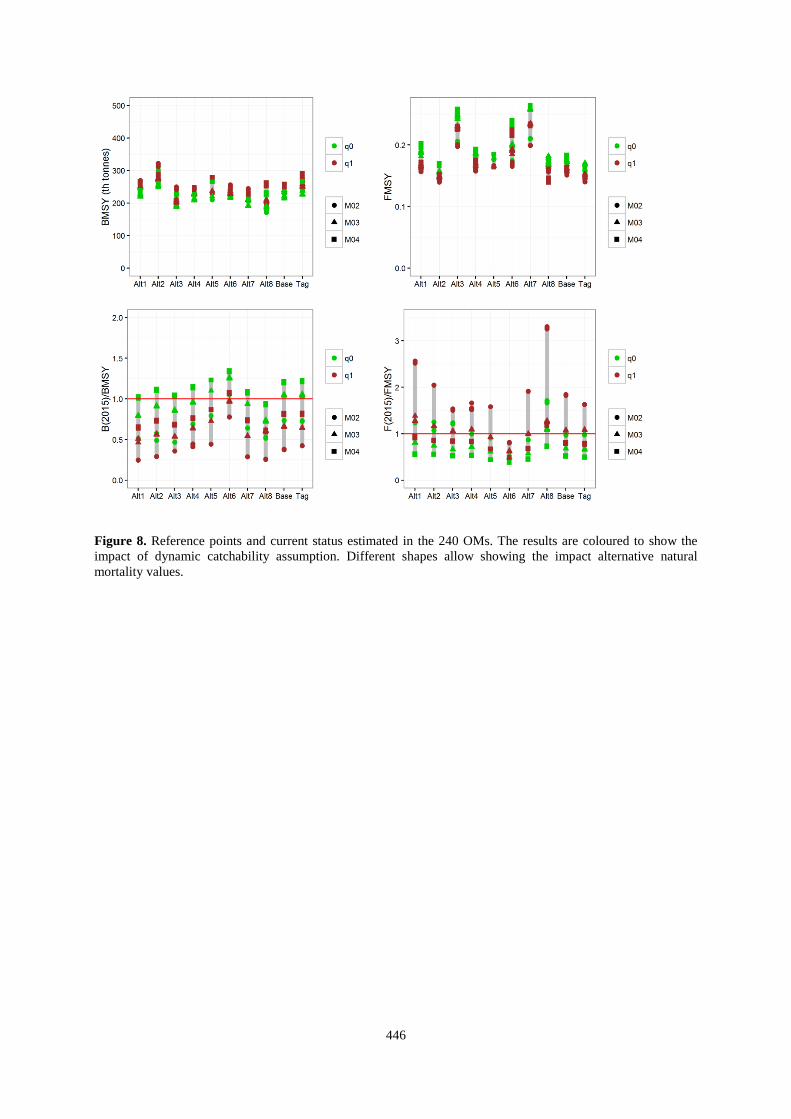
Figure 7 explores the impact of the biological parameters on reference points and stock status in 2015. The relation between M, steepness, virgin biomass and MSY is clearly appreciated. Again, higher M produces estimates of lower B0 and MSY. The patterns observed for the relation between M, BMSY, FMSY and relative B and F in 2015 are also noted but also depend on the catchability assumptions. Figure 8 shows these with a different color scale, where the impact of the assumption on dynamic catchability is more clearly appreciated. Assuming the dynamic q produces higher estimates of BMSY and lower of FMSY. However, the impact of the dynamic q is less than M in some cases. For example, using 0.2 as M scenario can produce wider differences than the dynamic q alone (Alt 7). However, for equal M and h scenarios, the assumption of dynamic q produces higher BMSY and lower FMSY. With regards to stock status, lower natural mortality produces estimates of lower relative biomass and higher relative fishing mortality in 2015 (Figure 6). In addition, dynamic q produces more pessimistic estimates of stock status. The impact of steepness priors is also appreciated in reference points and stock status: The highest levels of steepness correspond to lower estimates of B0, BMSY and relative F; and higher estimates of FMSY and relative biomass.
437
Figure 9 shows the dependency of the estimated aggregate selectivity with biological parameters on the 2013 set of scenarios. This figure shows that in general, increasing the fixed natural mortality produces a reduction on the overall selectivity in the early ages and a minor increase in older age classes. However, scenario Alt3 shows an inverse tendency, increasing M produce estimates of higher selectivity at early ages and higher for older. As said earlier, Alt3 is the scenario with all size-frequency data downweighted. With regards to steepness and assumption on catchability, this figure shows that they do not produce effects on the estimated selectivity except for scenario Alt3, where the assumption of increased catchability produces a reduction of the estimated selectivity for the early ages and increased selectivity for the older.
The estimated time series of recruitment (Rec), spawning stock biomass (SSB), catch and harvest or fishing mortality rates are shown in Figure 10. This figure shows the trajectory of the North Atlantic albacore as estimated with the alternative modelling options described in the uncertainty grid. Each of the scenarios has its own residuals of fit to the available and estimated data series. For example, Figure 11 explores the residuals of the scenario used in 2013 as a base case (Base_M03_h6_q0). Among other information, this figure shows a potential sinusoidal pattern on the temporal estimate of residuals. Before 1950 the residuals are negative while since then start to increase until a peak in the late 1960s, where residuals start to decrease until now, when they are negative again. This result may suggest that this stock has gone through different phases of recruitment productivity, i.e. periods where the stock has been able to produce more recruits with the same amount of ssb.
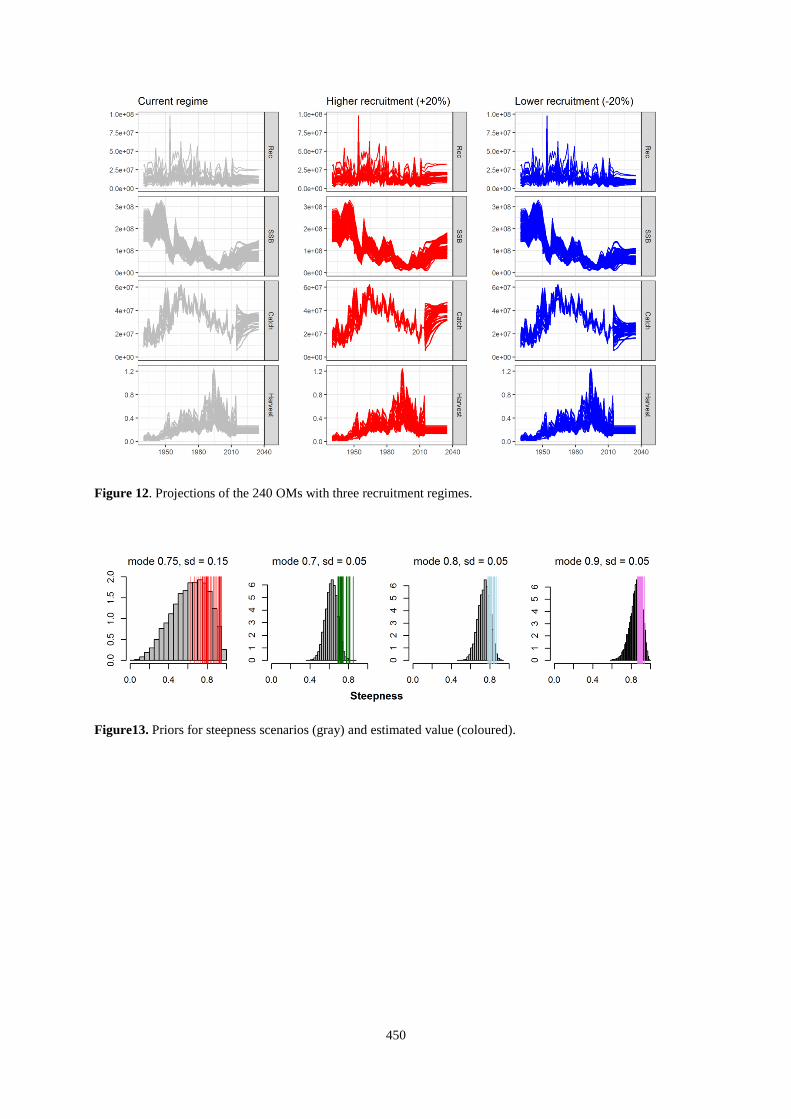
As a preliminary exploration of what an overall increase on recruitment can produce on this fishery we projected forward the grid of scenarios under three regimes for future recruitment. Figure 12 shows the expected increase/decrease in fishery indicators driven by changes on current recruitment regime. 4. Discussion
In order to develop MSE, it is necessary getting agreement on the scenarios considered as Operating Models (tRFMO-MSE, 2016). A grid of OM scenarios (i.e. a design based on factors and levels) dealing with parameter and structural uncertainty has primarily been the basis of most development work so far across fisheries. Following SCRS workplan for albacore (ICCAT, 2016b), this paper shows how the OMs for the North Atlantic albacore MSE have been built. This document aims at elucidating the impact of the range of uncertainties covered by the OMs and at adding transparency and credibility to the North Atlantic albacore MSE. Our results show that fishery indicators’ trends are similar in all runs (Figure 10), but also confirm that estimates of stock status, equilibrium curves and reference points are highly dependent upon the assumed biology and fishery dynamics (Kell et al., 2013). In 2013, a list of scenarios was developed to explore the impact of including/excluding certain parts of the available information. Overall, most of the scenarios produced similar estimates of productivity except the scenario with the age structured natural mortality, the scenario starting in 1950 and the combination of data in weights and number. From the 2013 list, a grid of scenarios was developed exploring the combined impacts of alternatives of input natural mortality, steepness priors and catchability.
Natural mortality is the most relevant parameter of the grid. Overall, the fixed natural mortality produces changes on the estimates of the reference points, selectivity and stock status. In order to explain the catch information, the Multifan-CL compensates the losses of catch and natural mortality with recruitment. Higher levels of M produce estimates of higher recruitment for the same amount of SSB. Virgin biomass and estimated MSY are greater for lower levels of M. Stock status, BMSY and FMSY are also related to M but the wide range of estimates is explained by catchability assumptions.
Changes on steepness priors have also produced changes on the indicators explored, in particular on the resilience of the stock to severe overexploitation states. Figure 13 shows a series of histograms produced with the mode and standard deviations for each scenario in gray and the estimated values of steepness (in colors). The estimated values tend to be in the upper region of the priors.
Stock status, FMSY and BMSY are also dependent upon catchability assumptions. The assumption of increased catchability since 1980 affects the estimation of current stock status (higher fishing mortality and lower biomass). This assumption has generally been used to reflect the technological improvements of the fleets. This is particularly evident for purse seine gears targeting tropical tuna, which in the 1980s decade started using artificial fish aggregating devices and high-tech monitoring and observation tools, reaching catchability increases of up to 3% per year (Lopez et al., 2015; Lopez et al., 2014). For longline fleets fishing power has increased more moderately than for purse seiners (Hoyle and Okamoto, 2011). Despite the increasing recent contribution from pelagic
438
trawlers, North Atlantic albacore is mostly fished by artisanal fleets (baitboat and trolling) and only partially by longline fleets that capture albacore as by-catch. Traditional gears have not experienced the same level of catchability increase (at least due to improved technology of the fishing gear). In addition, for this stock, due to its spatial distribution during the fishing season, it is more likely that catchability has decreased due to reduced availability in the recent period rather than increased due to improvements in technology. However, the dynamic catchability scenarios reflect the possibility that effective effort has yet increased at a 1% rate, on top of what is already standardized for.
Following the tRFMO MSE working group (2016), scenarios dealing with sampling and time series approaches that account for non-stationarity of ecological processes should be examined also. Here, we have explored the direct impact of increasing and decreasing average recruitment due to regime shifts. The runs shown are very preliminary but we think that they should contribute to the MSE development for North Atlantic albacore in the future.
For the North Atlantic albacore MSE to be developed, the grid of OMs needs to be agreed. Our proposed grid expands the previous list of OMs (Table 3), and now includes options with respect to the information available (2013 scenarios: catch, CPUE, size frequency data), biological parameters (natural mortality and steepness) and fishery dynamics (technological improvements and regime shifts) and are similar to the MSE developments in other tRFMOs (Bentley and Adam, 2016; Kolody and Jumppanen, 2016; Mosqueira, 2016; tRFMO, 2016). The plausibility of the hypotheses considered in this grid can be further evaluated before MP evaluations, in order to select Reference Case scenarios, robustness trials or simply to discard some of them. Also, additional scenarios could have been tested (Kell et al., 2013) but so far we have considered a range of uncertainties that are disseminated through the models and produce alternative views of North Atlantic albacore’s dynamics, productivity and current state.
439
References Bentley, N. and S. Adam. 2016. Management strategy evaluation for the Indian Ocean skipjack tuna fishery.
IOTC/WPM07/015. Hoyle, S.D.,Okamoto, H. 2011. Analyses of Japanese longline operational catch and effort for bigeye and
yellowfin tuna in the Western Central Pacific Ocean. SC7/2011/SA IP-01 ICCAT. 2011. Recommendation by ICCAT on the principles of decision making for ICCAT conservation and
management measures (Rec. 11-13). ICCAT. 2016a. Report of the intersessional meeting of Panel 2. Sapporo-Japan. ICCAT. 2016b. Report of the Standing Committee on Research and Statistics (SCRS), Madrid, Spain, 3 to 7
October 2016. 429 pp. ICCAT. 2016c. Recommendation by ICCAT on a multi-annual conservation and management program for North
Atlantic albacore (Rec. 16-06). ICCAT. 2016d. Report of the 2016 ICCAT North and South Atlantic albacore stock assessment meeting, Madeira
(Portugal) - April 28 to May 6, 2016. ICCAT. 2015. Recommendation by ICCAT to establish harvest control rules for the North Atlantic albacore stock
(Rec. 15-04). ICCAT. 2013. Report of the 2013 ICCAT North and South Atlantic albacore stock assessment meeting, Sukarrieta
(Spain), 114pp. ICCAT. 2011. Supplemental recommendation by ICCAT concerning the North Atlantic albacore rebuilding
program (Rec. 11-04). Kell, L., Arrizabalaga, H., Merino, G., De Bruyn, P. 2017. Conditioning an Operating Model for North Atlantic albacore. Collect. Vol. Sci. Pap., ICCAT 73(4): 1296-1327.
Kell, L., Merino, G., de Bruyn,Ortiz de Urbina, J., Arrizabalaga, H., Santiago, J., Murua, H. 2013. An example of conditioning an Operating Model using Multifan-CL. ICCAT, SCRS/2013/34 Technical Paper.
Kleiber, P.,Hampton, J.,Davies, N.,Hoyle, S.,Fournier, D.A. 2012. MULTIFAN-CL User's Guide. 152 pp. Kolody, D. and P. Jumppanen. 2016. IOTC yellowfin and bigeye tuna Management Strategy Evaluation: Phase 1
Technical Support. Project Final Report. IOTC/2016/032. Lopez, J.,Fraile, I.,Murua, J.,Santiago, J.,Merino, G.,Murua, H. 2015. Technological and fisher's evolution on
fishing tactics and strategies on FADs vs. non-associated fisheries. IOTC/2015/WPTT17. Lopez, J.,Moreno, G.,Sancristobal, I.,Murua, J. 2014. Evolution and current state of the technology echo-sounder
buoys used by Spanish tropical tuna purse seiners in the Atlantic, Indian and Pacific Oceans. Fisheries Research. 155:127-137.
Merino, G.,Arrizabalaga, H.,Murua, H.,Santiago, J.,Ortiz de Urbina, J.,Scott, G.P.,Kell, L. 2016. Evaluation of
Harvest Control Rules for North Atlantic albacore through Management Strategy Evaluation. SCRS/2016/015.
Merino, G.,De Bruyn, P.,Kell, L.,Arrizabalaga, H. 2013. A preliminary stock assessment for Northern albacore
using the fully integrated stock assessment model, Multifan-CL. SCRS/2013/58. Mosqueira, I. Management Strategy Evaluation for the Indian Ocean Tuna Albacore stock. 2016.
IOTC/2016/WPM07-08.

440
Punt, A.,Butterworth, D.D.S.,de Moor, C.L.,De Olveira, A.A.,Haddon, M. 2014. Management strategy evaluation: best practices. Fish and Fisheries.
tRFMO-MSE. 2016. Kobe MSE Working Group Kick off Meeting Report, Madrid, 1-3 Nov 2016. Santiago, J.,Arrizabalaga, H. 2005. An integrated growth study for North Atlantic albacore (Thunnus alalunga
Bonn. 1788). ICES Journal of Marine Science. 62:740-749.
441
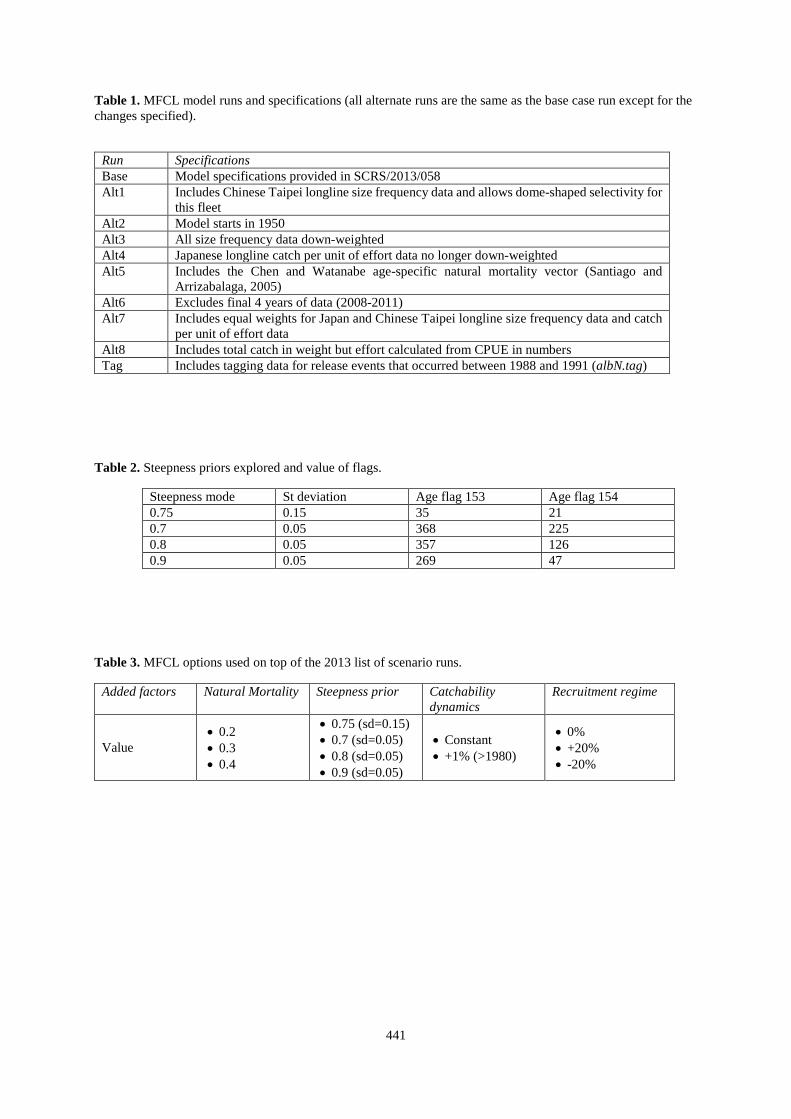
Table 1. MFCL model runs and specifications (all alternate runs are the same as the base case run except for the changes specified).
Run Specifications Base Model specifications provided in SCRS/2013/058 Alt1 Includes Chinese Taipei longline size frequency data and allows dome-shaped selectivity for
this fleet Alt2 Model starts in 1950 Alt3 All size frequency data down-weighted Alt4 Japanese longline catch per unit of effort data no longer down-weighted Alt5 Includes the Chen and Watanabe age-specific natural mortality vector (Santiago and
Arrizabalaga, 2005) Alt6 Excludes final 4 years of data (2008-2011) Alt7 Includes equal weights for Japan and Chinese Taipei longline size frequency data and catch
per unit of effort data Alt8 Includes total catch in weight but effort calculated from CPUE in numbers Tag Includes tagging data for release events that occurred between 1988 and 1991 (albN.tag)
Table 2. Steepness priors explored and value of flags.
Steepness mode St deviation Age flag 153 Age flag 154 0.75 0.15 35 21 0.7 0.05 368 225 0.8 0.05 357 126 0.9 0.05 269 47
Table 3. MFCL options used on top of the 2013 list of scenario runs.
Added factors Natural Mortality Steepness prior Catchability dynamics
Recruitment regime
Value • 0.2 • 0.3 • 0.4
• 0.75 (sd=0.15) • 0.7 (sd=0.05) • 0.8 (sd=0.05) • 0.9 (sd=0.05)
• Constant • +1% (>1980)
• 0% • +20% • -20%

442
Figures
Figure 1. Objective function in the different phases of the fit to MFCL scenarios.
Figure 2. Number of parameters in the different phases of the fit to MFCL scenarios.
443
Figure 3. Impact of natural mortality, steepness and dynamic catchability on the MFCL Base Case scenario.
Figure 4. Impact of natural mortality, steepness and dynamic catchability on the MFCL scenarios considered in 2013.
444
Figure 5. Natural mortality vectors considered in the grid of OMs.
Figure 6. Impact of natural mortality, steepness and dynamic catchability on the grid of scenarios.
445
Figure 7. Reference points and current status estimated in the 240 OMs. The results are coloured to show the impact of alternative natural mortality values. Different shapes allow showing the impact of steepness.
446
Figure 8. Reference points and current status estimated in the 240 OMs. The results are coloured to show the impact of dynamic catchability assumption. Different shapes allow showing the impact alternative natural mortality values.

447
Figure 9. Aggregated selectivity.

448
Figure 10. Time series of recruitment, spawning stock biomass, catch and fishing mortality rate for the 240 OMs.

449
Figure 11. Residuals of the scenario used in 2013 as a base case (Base_M03_h6_q0).
450
Figure 12. Projections of the 240 OMs with three recruitment regimes.
Figure13. Priors for steepness scenarios (gray) and estimated value (coloured).
451
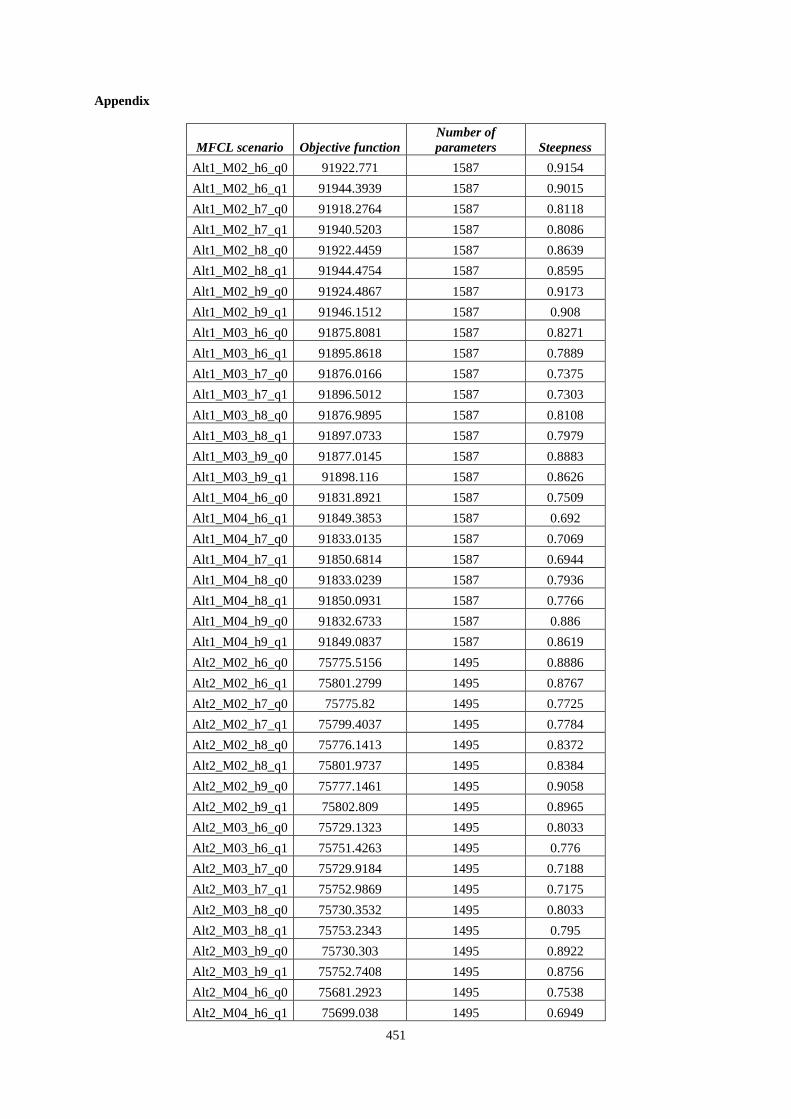
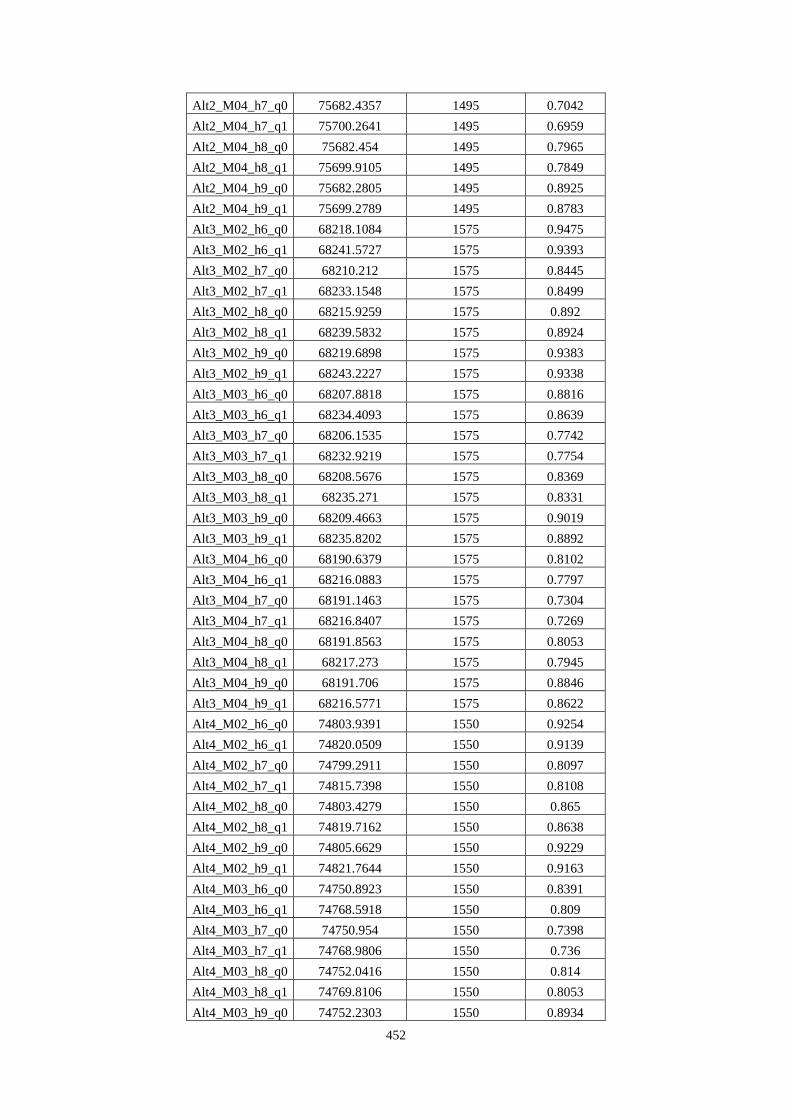
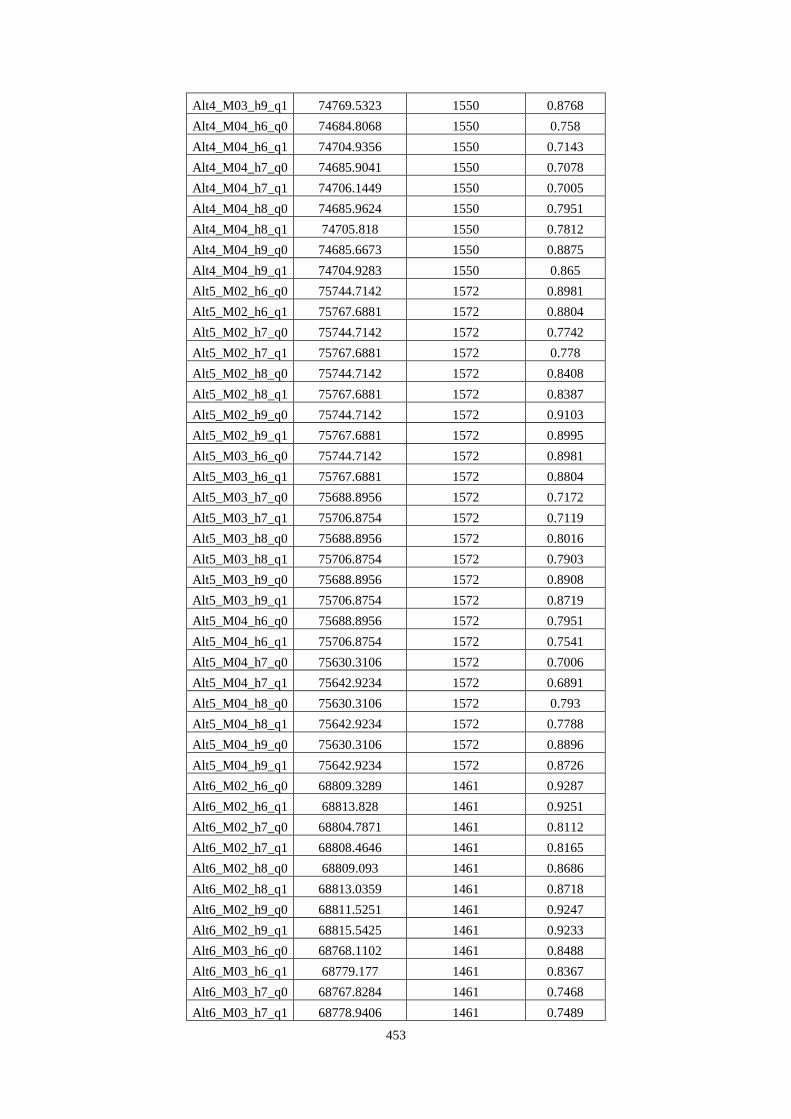
Appendix
MFCL scenario Objective function Number of parameters Steepness
Alt1_M02_h6_q0 91922.771 1587 0.9154 Alt1_M02_h6_q1 91944.3939 1587 0.9015 Alt1_M02_h7_q0 91918.2764 1587 0.8118 Alt1_M02_h7_q1 91940.5203 1587 0.8086 Alt1_M02_h8_q0 91922.4459 1587 0.8639 Alt1_M02_h8_q1 91944.4754 1587 0.8595 Alt1_M02_h9_q0 91924.4867 1587 0.9173 Alt1_M02_h9_q1 91946.1512 1587 0.908 Alt1_M03_h6_q0 91875.8081 1587 0.8271 Alt1_M03_h6_q1 91895.8618 1587 0.7889 Alt1_M03_h7_q0 91876.0166 1587 0.7375 Alt1_M03_h7_q1 91896.5012 1587 0.7303 Alt1_M03_h8_q0 91876.9895 1587 0.8108 Alt1_M03_h8_q1 91897.0733 1587 0.7979 Alt1_M03_h9_q0 91877.0145 1587 0.8883 Alt1_M03_h9_q1 91898.116 1587 0.8626 Alt1_M04_h6_q0 91831.8921 1587 0.7509 Alt1_M04_h6_q1 91849.3853 1587 0.692 Alt1_M04_h7_q0 91833.0135 1587 0.7069 Alt1_M04_h7_q1 91850.6814 1587 0.6944 Alt1_M04_h8_q0 91833.0239 1587 0.7936 Alt1_M04_h8_q1 91850.0931 1587 0.7766 Alt1_M04_h9_q0 91832.6733 1587 0.886 Alt1_M04_h9_q1 91849.0837 1587 0.8619 Alt2_M02_h6_q0 75775.5156 1495 0.8886 Alt2_M02_h6_q1 75801.2799 1495 0.8767 Alt2_M02_h7_q0 75775.82 1495 0.7725 Alt2_M02_h7_q1 75799.4037 1495 0.7784 Alt2_M02_h8_q0 75776.1413 1495 0.8372 Alt2_M02_h8_q1 75801.9737 1495 0.8384 Alt2_M02_h9_q0 75777.1461 1495 0.9058 Alt2_M02_h9_q1 75802.809 1495 0.8965 Alt2_M03_h6_q0 75729.1323 1495 0.8033 Alt2_M03_h6_q1 75751.4263 1495 0.776 Alt2_M03_h7_q0 75729.9184 1495 0.7188 Alt2_M03_h7_q1 75752.9869 1495 0.7175 Alt2_M03_h8_q0 75730.3532 1495 0.8033 Alt2_M03_h8_q1 75753.2343 1495 0.795 Alt2_M03_h9_q0 75730.303 1495 0.8922 Alt2_M03_h9_q1 75752.7408 1495 0.8756 Alt2_M04_h6_q0 75681.2923 1495 0.7538 Alt2_M04_h6_q1 75699.038 1495 0.6949
452
Alt2_M04_h7_q0 75682.4357 1495 0.7042 Alt2_M04_h7_q1 75700.2641 1495 0.6959 Alt2_M04_h8_q0 75682.454 1495 0.7965 Alt2_M04_h8_q1 75699.9105 1495 0.7849 Alt2_M04_h9_q0 75682.2805 1495 0.8925 Alt2_M04_h9_q1 75699.2789 1495 0.8783 Alt3_M02_h6_q0 68218.1084 1575 0.9475 Alt3_M02_h6_q1 68241.5727 1575 0.9393 Alt3_M02_h7_q0 68210.212 1575 0.8445 Alt3_M02_h7_q1 68233.1548 1575 0.8499 Alt3_M02_h8_q0 68215.9259 1575 0.892 Alt3_M02_h8_q1 68239.5832 1575 0.8924 Alt3_M02_h9_q0 68219.6898 1575 0.9383 Alt3_M02_h9_q1 68243.2227 1575 0.9338 Alt3_M03_h6_q0 68207.8818 1575 0.8816 Alt3_M03_h6_q1 68234.4093 1575 0.8639 Alt3_M03_h7_q0 68206.1535 1575 0.7742 Alt3_M03_h7_q1 68232.9219 1575 0.7754 Alt3_M03_h8_q0 68208.5676 1575 0.8369 Alt3_M03_h8_q1 68235.271 1575 0.8331 Alt3_M03_h9_q0 68209.4663 1575 0.9019 Alt3_M03_h9_q1 68235.8202 1575 0.8892 Alt3_M04_h6_q0 68190.6379 1575 0.8102 Alt3_M04_h6_q1 68216.0883 1575 0.7797 Alt3_M04_h7_q0 68191.1463 1575 0.7304 Alt3_M04_h7_q1 68216.8407 1575 0.7269 Alt3_M04_h8_q0 68191.8563 1575 0.8053 Alt3_M04_h8_q1 68217.273 1575 0.7945 Alt3_M04_h9_q0 68191.706 1575 0.8846 Alt3_M04_h9_q1 68216.5771 1575 0.8622 Alt4_M02_h6_q0 74803.9391 1550 0.9254 Alt4_M02_h6_q1 74820.0509 1550 0.9139 Alt4_M02_h7_q0 74799.2911 1550 0.8097 Alt4_M02_h7_q1 74815.7398 1550 0.8108 Alt4_M02_h8_q0 74803.4279 1550 0.865 Alt4_M02_h8_q1 74819.7162 1550 0.8638 Alt4_M02_h9_q0 74805.6629 1550 0.9229 Alt4_M02_h9_q1 74821.7644 1550 0.9163 Alt4_M03_h6_q0 74750.8923 1550 0.8391 Alt4_M03_h6_q1 74768.5918 1550 0.809 Alt4_M03_h7_q0 74750.954 1550 0.7398 Alt4_M03_h7_q1 74768.9806 1550 0.736 Alt4_M03_h8_q0 74752.0416 1550 0.814 Alt4_M03_h8_q1 74769.8106 1550 0.8053 Alt4_M03_h9_q0 74752.2303 1550 0.8934
453
Alt4_M03_h9_q1 74769.5323 1550 0.8768 Alt4_M04_h6_q0 74684.8068 1550 0.758 Alt4_M04_h6_q1 74704.9356 1550 0.7143 Alt4_M04_h7_q0 74685.9041 1550 0.7078 Alt4_M04_h7_q1 74706.1449 1550 0.7005 Alt4_M04_h8_q0 74685.9624 1550 0.7951 Alt4_M04_h8_q1 74705.818 1550 0.7812 Alt4_M04_h9_q0 74685.6673 1550 0.8875 Alt4_M04_h9_q1 74704.9283 1550 0.865 Alt5_M02_h6_q0 75744.7142 1572 0.8981 Alt5_M02_h6_q1 75767.6881 1572 0.8804 Alt5_M02_h7_q0 75744.7142 1572 0.7742 Alt5_M02_h7_q1 75767.6881 1572 0.778 Alt5_M02_h8_q0 75744.7142 1572 0.8408 Alt5_M02_h8_q1 75767.6881 1572 0.8387 Alt5_M02_h9_q0 75744.7142 1572 0.9103 Alt5_M02_h9_q1 75767.6881 1572 0.8995 Alt5_M03_h6_q0 75744.7142 1572 0.8981 Alt5_M03_h6_q1 75767.6881 1572 0.8804 Alt5_M03_h7_q0 75688.8956 1572 0.7172 Alt5_M03_h7_q1 75706.8754 1572 0.7119 Alt5_M03_h8_q0 75688.8956 1572 0.8016 Alt5_M03_h8_q1 75706.8754 1572 0.7903 Alt5_M03_h9_q0 75688.8956 1572 0.8908 Alt5_M03_h9_q1 75706.8754 1572 0.8719 Alt5_M04_h6_q0 75688.8956 1572 0.7951 Alt5_M04_h6_q1 75706.8754 1572 0.7541 Alt5_M04_h7_q0 75630.3106 1572 0.7006 Alt5_M04_h7_q1 75642.9234 1572 0.6891 Alt5_M04_h8_q0 75630.3106 1572 0.793 Alt5_M04_h8_q1 75642.9234 1572 0.7788 Alt5_M04_h9_q0 75630.3106 1572 0.8896 Alt5_M04_h9_q1 75642.9234 1572 0.8726 Alt6_M02_h6_q0 68809.3289 1461 0.9287 Alt6_M02_h6_q1 68813.828 1461 0.9251 Alt6_M02_h7_q0 68804.7871 1461 0.8112 Alt6_M02_h7_q1 68808.4646 1461 0.8165 Alt6_M02_h8_q0 68809.093 1461 0.8686 Alt6_M02_h8_q1 68813.0359 1461 0.8718 Alt6_M02_h9_q0 68811.5251 1461 0.9247 Alt6_M02_h9_q1 68815.5425 1461 0.9233 Alt6_M03_h6_q0 68768.1102 1461 0.8488 Alt6_M03_h6_q1 68779.177 1461 0.8367 Alt6_M03_h7_q0 68767.8284 1461 0.7468 Alt6_M03_h7_q1 68778.9406 1461 0.7489
454
Alt6_M03_h8_q0 68769.1973 1461 0.8188 Alt6_M03_h8_q1 68780.3146 1461 0.8165 Alt6_M03_h9_q0 68769.4835 1461 0.8926 Alt6_M03_h9_q1 68780.3656 1461 0.8819 Alt6_M04_h6_q0 68720.0196 1461 0.7932 Alt6_M04_h6_q1 68732.6577 1461 0.7689 Alt6_M04_h7_q0 68720.8039 1461 0.7209 Alt6_M04_h7_q1 68733.5954 1461 0.7178 Alt6_M04_h8_q0 68721.2358 1461 0.8007 Alt6_M04_h8_q1 68733.8156 1461 0.7928 Alt6_M04_h9_q0 68720.986 1461 0.8839 Alt6_M04_h9_q1 68733.1833 1461 0.8672 Alt7_M02_h6_q0 90893.861 1550 0.9469 Alt7_M02_h6_q1 90895.6261 1550 0.9381 Alt7_M02_h7_q0 90885.3986 1550 0.8494 Alt7_M02_h7_q1 90887.2592 1550 0.8526 Alt7_M02_h8_q0 90891.7506 1550 0.8919 Alt7_M02_h8_q1 90893.7501 1550 0.8921 Alt7_M02_h9_q0 90895.4522 1550 0.9375 Alt7_M02_h9_q1 90897.286 1550 0.9327 Alt7_M03_h6_q0 90855.4477 1550 0.8827 Alt7_M03_h6_q1 90859.1861 1550 0.8601 Alt7_M03_h7_q0 90853.8299 1550 0.7728 Alt7_M03_h7_q1 90857.9305 1550 0.772 Alt7_M03_h8_q0 90856.1582 1550 0.8354 Alt7_M03_h8_q1 90860.113 1550 0.8297 Alt7_M03_h9_q0 90857.0491 1550 0.9039 Alt7_M03_h9_q1 90860.581 1550 0.8897 Alt7_M04_h6_q0 90813.7828 1550 0.7944 Alt7_M04_h6_q1 90819.894 1550 0.7541 Alt7_M04_h7_q0 90814.5686 1550 0.7212 Alt7_M04_h7_q1 90820.93 1550 0.7144 Alt7_M04_h8_q0 90814.9947 1550 0.8012 Alt7_M04_h8_q1 90820.9905 1550 0.7884 Alt7_M04_h9_q0 90814.8198 1550 0.8878 Alt7_M04_h9_q1 90820.2414 1550 0.8666 Alt8_M02_h6_q0 75766.1902 1575 0.923 Alt8_M02_h6_q1 75784.0577 1575 0.9023 Alt8_M02_h7_q0 75763.0674 1575 0.785 Alt8_M02_h7_q1 75781.338 1575 0.7861 Alt8_M02_h8_q0 75766.129 1575 0.8515 Alt8_M02_h8_q1 75784.3321 1575 0.8477 Alt8_M02_h9_q0 75767.9076 1575 0.9214 Alt8_M02_h9_q1 75785.7436 1575 0.9112 Alt8_M03_h6_q0 75723.3932 1575 0.815

455
Alt8_M03_h6_q1 75735.7316 1575 0.7801 Alt8_M03_h7_q0 75724.0476 1575 0.7227 Alt8_M03_h7_q1 75736.6141 1575 0.7188 Alt8_M03_h8_q0 75724.6087 1575 0.8058 Alt8_M03_h8_q1 75736.9821 1575 0.7974 Alt8_M03_h9_q0 75724.646 1575 0.8942 Alt8_M03_h9_q1 75736.6012 1575 0.88 Alt8_M04_h6_q0 75681.4688 1575 0.714 Alt8_M04_h6_q1 75693.1999 1575 0.628 Alt8_M04_h7_q0 75682.6651 1575 0.6986 Alt8_M04_h7_q1 75694.399 1575 0.6844 Alt8_M04_h8_q0 75682.5128 1575 0.792 Alt8_M04_h8_q1 75693.6263 1575 0.7755 Alt8_M04_h9_q0 75682.1965 1575 0.8893 Alt8_M04_h9_q1 75692.719 1575 0.8705 Base_M02_h6_q0 75771.1004 1575 0.9215 Base_M02_h6_q1 75797.8631 1575 0.9098 Base_M02_h7_q0 75767.1543 1575 0.7995 Base_M02_h7_q1 75793.8105 1575 0.8058 Base_M02_h8_q0 75770.8237 1575 0.8591 Base_M02_h8_q1 75797.7066 1575 0.8609 Base_M02_h9_q0 75772.8185 1575 0.9208 Base_M02_h9_q1 75799.5772 1575 0.914 Base_M03_h6_q0 75727.5904 1575 0.8308 Base_M03_h6_q1 75750.4136 1575 0.8005 Base_M03_h7_q0 75727.9207 1575 0.7321 Base_M03_h7_q1 75750.9796 1575 0.7304 Base_M03_h8_q0 75728.7744 1575 0.8106 Base_M03_h8_q1 75751.6341 1575 0.8024 Base_M03_h9_q0 75728.8997 1575 0.8938 Base_M03_h9_q1 75751.2958 1575 0.8766 Base_M04_h6_q0 75679.7505 1575 0.7596 Base_M04_h6_q1 75698.4539 1575 0.705 Base_M04_h7_q0 75681.4528 1575 0.707 Base_M04_h7_q1 75699.6769 1575 0.6981 Base_M04_h8_q0 75681.5101 1575 0.7958 Base_M04_h8_q1 75699.3182 1575 0.7823 Base_M04_h9_q0 75681.2619 1575 0.8893 Base_M04_h9_q1 75698.524 1575 0.8705 Tag_M02_h6_q0 75379.2025 1580 0.9083 Tag_M02_h6_q1 75405.2359 1580 0.8896 Tag_M02_h7_q0 75376.3792 1580 0.7801 Tag_M02_h7_q1 75402.8703 1580 0.783 Tag_M02_h8_q0 75379.1662 1580 0.8458 Tag_M02_h8_q1 75405.7076 1580 0.844
456
Tag_M02_h9_q0 75380.9073 1580 0.9146 Tag_M02_h9_q1 75406.8582 1580 0.9039 Tag_M03_h6_q0 75340.8393 1580 0.8198 Tag_M03_h6_q1 75362.091 1580 0.7776 Tag_M03_h7_q0 75339.4868 1580 0.7238 Tag_M03_h7_q1 75362.9587 1580 0.72 Tag_M03_h8_q0 75342.0483 1580 0.8072 Tag_M03_h8_q1 75363.2776 1580 0.7957 Tag_M03_h9_q0 75342.0948 1580 0.8933 Tag_M03_h9_q1 75362.7693 1580 0.8738 Tag_M04_h6_q0 75296.3218 1580 0.728 Tag_M04_h6_q1 75313.8366 1580 0.669 Tag_M04_h7_q0 75297.5214 1580 0.7008 Tag_M04_h7_q1 75315.0369 1580 0.6908 Tag_M04_h8_q0 75297.4023 1580 0.7926 Tag_M04_h8_q1 75314.4767 1580 0.7785 Tag_M04_h9_q0 75297.0857 1580 0.8887 Tag_M04_h9_q1 75313.6182 1580 0.8704
Table A1. 1