Embed Size (px)
Citation preview

Molecular and Cellular Neuroscience 21, 312–323 (2002)
Impaired Adult Neurogenesis in Mice Lacking theTranscription Factor E2F1
Christiana M. Cooper-Kuhn,* Maurice Vroemen,* Jason Brown,*Hong Ye,† Margaret A. Thompson,† Jurgen Winkler,* andH. Georg Kuhn* ,1
*Department of Neurology, University of Regensburg, D-93053 Regensburg, Germany; and†Division of Neuroscience, Children’s Hospital, Boston, Massachusetts 02115
During nervous system development the fate of neuralstem cells—whether to undergo proliferation, differentia-tion, or apoptosis—is controlled by various signals, suchas growth factors. Here, we demonstrate that the tran-scription factor E2F1, which is targeted by several signal-ing cascades that are activated by growth factors, is in-volved in neurogenesis in the adult brain. When analyzingthe brains of E2F1-deficient mice, we found significantlydecreased stem cell and progenitor division in the prolif-erative zones of the lateral ventricle wall and the hip-pocampus. As a consequence, the production of newbornneurons in the adult olfactory bulb and dentate gyrus wasdecreased. Neuronal cell counts of the adult cerebellumrevealed a mild but significant cerebellar atrophy,whereas neocortical neurons were unaffected, suggest-ing that E2F1 deficiency produces a predominantly post-natal phenotype. The results indicate an involvement ofE2F1 in controlling proliferation and neuronal cell num-bers in the postnatal and adult brain.
INTRODUCTION
In several tissues of adult mammals, stem cells arethe active elements of tissue regeneration; however, inorder to maintain an accurate number of cells in regen-erative tissues, a precise balance of cell production andcell death is required. It is now generally accepted thatthe adult mammalian brain is able to produce newneurons throughout life (Altman, 1969; Kaplan et al.,1985; Cameron et al., 1993; Kuhn et al., 1996), but until
1 To whom correspondence should be addressed at the Department
D-93053 Regensburg, Germany. Fax: �49-941-941-3005. E-mail:[email protected].
312
recently, the significance of this mechanism was under-estimated. Several tens of thousands of neurons arebeing produced every day in the adult rodent brainfrom neural stem cells that reside in the ventricle wall(Biebl et al., 2000). This enormous neuronal productionrequires a tight molecular control in order to producethe required cell number. Moreover, it has been shownthat cell death plays an important role in regulatingadult neurogenesis, which suggests a continuous neu-ronal replacement mechanism (Biebl et al., 2000; Levi-son et al., 2000). The E2F family of transcription factorshas been implicated in controlling proliferation as wellas cell death of embryonic cells, including neural stemcells in vitro (Yoshikawa, 2000). Therefore, we hypoth-esized that individual E2F family members may play animportant role during generation and replacement ofneurons in the adult brain.
Of the six E2F family members, E2F1 is most promi-nently expressed in the embryonic nervous system,with high abundance in regions of neural stem cell andprogenitor activity (Tevosian et al., 1996; Dagnino et al.,1997; Kastner et al., 1998). Nevertheless, mice with atargeted deletion of E2F1 appeared normal in anatomyand behavior compared to wild-type mice, probablydue to functional compensation by other E2F familymembers (Field et al., 1996; Yamasaki et al., 1996). Buttwo observations suggest an important role for E2Ftranscription factors in cell cycle progression: (i) mousefibroblasts with a triple mutation of the E2F1, E2F2, andE2F3 genes reveal a complete cessation of cell cycleprogression, whereas double mutations were not af-fected (Wu et al., 2001) and (ii) in organisms such asDrosophila, in which the E2F1 homologue is the promi-
MCN
doi:10.1006/mcne.2002.1176of Neurology, University of Regensburg, Universitaetsstrasse 84,
nent E2F gene, E2F mutations are embryonic lethal(Duronio et al., 1995). These data indicate the essential1044-7431/02 $35.00© 2002 Elsevier Science (USA)
All rights reserved.

role of E2F in proliferation and an important redun-dancy between multiple E2F family members.
Depending on the cell type, the E2F1 protein has thedual capacity to differentially induce either prolifera-tion or apoptosis (Johnson et al., 1994; Yamasaki et al.,1996; DeGregori et al., 1997). In E2F1-deficient mice,organs like the testis suffer from atrophy, whereas areduced apoptotic elimination of thymocytes duringT-cell maturation leads to a postnatal hyperplasia of thethymus (Field et al., 1996; Yamasaki et al., 1996). More-over, E2F1-deficient mice have a higher risk of devel-oping intestinal tumors in later stages of life (Yamasakiet al., 1996), leaving it open as to whether organs such asthe brain are affected in one way or another.
The current study investigates the adult brain ofE2F1�/� mice, focusing on regions of adult neural stemcell proliferation, neurogenesis, and cell death. We haveperformed five separate analyses to address the effect ofE2F1 deficiency on postnatal neurogenesis: (1) We com-pared brain and body weights of E2F1-deficient andwild-type mice as neonates and as adults to get anoverall measure of alterations that may occur duringpostnatal maturation of the brain. (2) A neuroanatomi-cal characterization of adult E2F1-deficient brains givesindications as to whether developmental brain defectsthat would compromise the analysis of adult neurogen-esis are present. This analysis includes the stereologicalneuronal counts in the cerebellum, a brain structurepredominantly generated postnatally, in comparison tothe neocortex, whose neurons are generated entirelyduring embryonic stages. (3) To study the effect of E2F1deficiency on adult neural stem cell proliferation in vivo,we used bromodeoxyuridine (BrdU) labeling and ste-reological analysis to determine the number of cells in Sphase in the hippocampus and in the lateral ventriclewall. (4) Consecutively, in the hippocampus and olfac-tory bulb, we also determined the number of new neu-rons being generated from dividing stem cells and pro-genitors at 4 weeks after BrdU labeling. (5) Finally,because E2F1 has been reported to be involved in celldeath of postmitotic cells, we also determined the fre-quency of apoptotic cells in the regions of adult neuro-genesis.
RESULTS AND DISCUSSION
E2F1 continues to be expressed in the nervous systemin postnatal periods while other E2F family membersare downregulated at later stages of development (Te-vosian et al., 1996; Dagnino et al., 1997; Kastner et al.,1998). Therefore, we hypothesized that a possible effect
of E2F1 deletion in the CNS could reveal a phenotype inlate-born granule cell populations of the olfactory bulb,hippocampus, and cerebellum. As a basic, but crudemeasurement for quantitative changes in E2F1-deficientmice, we first compared the body weight and the wetbrain weight of wild-type and E2F1-deficient animals at4 days after birth (neonatal) and at 3 months of age(adult). Table 1 shows that neither body weight norbrain weight differed between newborn wildtype andE2F1-deficient mice. But in adulthood, the E2F1-defi-cient mice were slightly, but significantly, smaller inbody weight (20% reduction) and brain weight (10%reduction) compared to wildtype, which is in accor-dance with previous data on atrophy of several organs(Field et al., 1996; Yamasaki et al., 1996).
Neuroanatomy of Adult E2F1-Deficient Animals
The study of neural stem cell activity in adult micewith targeted mutations requires that the animals areviable and have no apparent abnormalities from em-bryonic brain development. E2F1-deficient mice havebeen reported to be fertile, viable, and without grossanatomical malformations (Field et al., 1996; Yamasakiet al., 1996). Since the brains of E2F1-deficient animalshave not yet been systematically analyzed, we com-pared the brain morphology of E2F1-deficient animalsto that of wild-type littermates. Analysis of multiplebrain regions, such as neocortex, diencephalon, mid-brain, and cerebellum, in Nissl-stained sections re-vealed no missing or overtly altered cell groups (Fig.1A). All layers of the neocortex are present and appear
TABLE 1
Neonatal and Adult Body and Brain Weights
Wildtype E2F1 deficient P value
Neonatal (P4)Body weight 2.384 � 0.054 2.504 � 0.125 0.39Brain weight 0.196 � 0.004 0.206 � 0.006 0.16
Adult (P90)Body weight 27.591 � 1.087 22.083 � 0.941 0.001**Brain weight 0.475 � 0.007 0.431 � 0.005 0.001**
Note. Neonatal and adult body and brain weights were determinedon postnatal day 4 (P4) and day 90 (P90), respectively (n � 12 pergroup). Equal numbers of male and female mice were used in eachgroup. Weights (g) are presented as group means �/� SEM. Signif-icance levels in the unpaired two-tailed t test are given as P values.
** Statistically significant difference between wildtype and E2F1-deficient mice at the 1% level.
313Regulation of Adult Neurogenesis by E2F1

to have identical organization and size (Fig. 1C). Todetect possible differences between prenatally andpostnatally generated brain structures, we compared
neuronal cell numbers in the neocortex, whose neuronsare generated exclusively during the embryonic phase,with the postnatally generated granule cell layer of the
FIG. 1. Neuroanatomical characterization of E2F1-deficient animals. (A, C) Anatomical overview of adult E2F1-deficient brains in comparisonto wildtype as demonstrated on representative Nissl-stained parasagittal sections. The E2F1�/� brains appear to develop normally. We confirmedthe presence of multiple brain nuclei in the forebrain, thalamus, hypothalamus, ventral midbrain, and brain stem (details not shown) as well asthe normal layering of the neocortex (C—primary motor cortex). (B, D) When we stereologically counted neurons in the cerebellum and theneocortex, we observed a significant reduction in cerebellar granule cell numbers (B) of E2F1-deficient mice, whereas cortical neuron numbers(D) were not altered. Neuronal cell counts are represented as group means �/� SEM (n � 6 animals per group). *Statistically significantdifference between wildtype and E2F1-deficient mice at the 5% level (Student’s t test).
314 Cooper-Kuhn et al.

cerebellum. Stereological cell counts of Nissl-stainedtissue sections revealed a small, but significant reduc-tion in the number of cerebellar granule cells in E2F1-deficient mice (Fig. 1B). In contrast, the neuronal num-bers of the neocortex were not significantly decreased(Fig. 1D). These data imply that structural changes, dueto the lack of functional E2F1 protein, become moreprominent in postnatal stages of life.
Stem Cell Activity and Neurogenesis in theAdult Brain
In order to determine the role of E2F1 in adult neu-rogenesis, we analyzed neural stem cell and progenitorproliferation in the dentate gyrus and the lateral ven-tricle wall. Adult E2F1-deficient and wild-type litter-mates (2 month of age) received a single BrdU injection
FIG. 2. Proliferation in brain regions with stem cell activity. Cell division was visualized by BrdU immunohistochemistry at 2 h after BrdUinjection, which labels only cells in the S phase of the cell cycle. (A–C) Cell division in the dentate gyrus granule cell layer of (A) wild-type and(B) E2F1-deficient mice. Note the typical location of newborn cells at the inner border of the granule cell layer. (C) Quantification. The dorsalhippocampus was analyzed on approx 8 coronal sections per animal (n � 5 per group). The proliferative activity in the dentate gyrus isexpressed as the total number of BrdU-positive cells per dentate gyrus granule cell layer. (D–F) Cell division in the subventricular zone of (D)wild-type and (E) E2F1-deficient mice. (F) Stereological BrdU cell counts are represented as the total number of BrdU-positive cells persubventricular zone (n � 5 animals per group). *Statistically significant difference between wild-type and E2F1-deficient mice at the 5% and *atthe 1% level, respectively (Student’s t test). Interference contrast optics. Scale bars in A and D, 100 and 50 �m, respectively.
315Regulation of Adult Neurogenesis by E2F1

(50 mg/kg) 2 h before perfusion (n � 5 animals pergroup) to restrict BrdU labeling to the S phase of the cellcycle. BrdU-immunopositive cells were counted using astereological counting procedure (Williams and Rakic,1988). In the dentate gyrus granule cell layer, quantifi-cation of BrdU-labeled cells detected a significantlylower level of cell proliferation in the absence of func-tional E2F1 (Figs. 2A–2C). In the ventricle wall a similarreduction of cells in S phase was observed (Figs.2D–2F).
Lower numbers of proliferating cells, as observed inthe E2F1-deficient animals, could be due to (i) a lowerproliferation rate of the existing neural precursor cellsor (ii) size differences in the proliferative region, whichmay have restricted the amount of progenitors duringdevelopment. We tested these hypotheses by determin-ing the density of BrdU-positive cells in relation to thevolume (volumetric density) and to the total number ofcells (labeling index). In the dentate gyrus granule celllayer, 175 BrdU-positive cells/mm3 represent 0.21% ofthe total cell population in wild-type animals; whereasin E2F1-deficient mice, 109 BrdU-positive cells/mm3
represent 0.13% of the total cell population (P � 0.01).A significant difference is also observed in the subven-tricular zone with 330,290 BrdU-positive cells/mm3
representing 34% of the total cell population in wild-type animals, whereas 181,200 BrdU-positive cells/mm3 represent 16% of the total cell population in E2F1-deficient mice (P � 0.05). These results illustrate thatthe reduced proliferation observed under E2F1 defi-ciency is independent from the volume and cell num-bers of the respective proliferative areas.
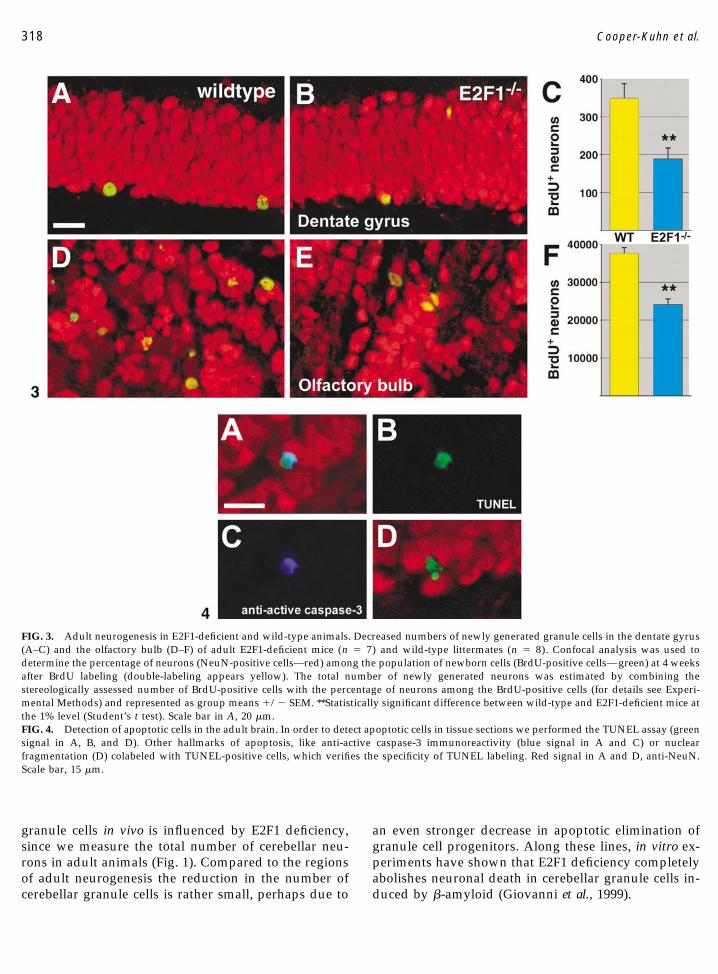
In order to determine whether E2F1-dependentchanges in proliferation affect adult neurogenesis, weanalyzed E2F1-deficient and wild-type mice (n � 8animals per group) after injection of BrdU at 2 monthsof age and perfusion at 3 months of age. A stereologicalquantification procedure was used to estimate the totalnumber of BrdU-positive cells at 4 weeks after labeling(Table 2). The numbers of newborn neurons as pre-sented in Fig. 3 were then calculated from the stereo-logical count of BrdU-positive cells (Table 2) multipliedby the percentage of neurons among the newborn cellsas determined by confocal microscopy.
In all brain regions with prominent adult neurogen-esis—the granule cell layers of the dentate gyrus and ofthe olfactory bulb—we found a statistically significantreduction in BrdU-positive cells in E2F1-deficient miceat 4 weeks after BrdU labeling (Table 2). When deter-mining the relative proportion of neurons among thenewborn cells we revealed that significantly fewer newneurons were generated in the adult CNS of E2F1-deficient mice. The number of newborn granule cells inE2F1-deficient mice was reduced to 53% of control lev-els in the dentate gyrus and to about 63% in the olfac-tory bulb (Fig. 3). Although proliferation of other celltypes, such as glial cells and endothelial cells, was notdirectly assessed, neighboring regions containing noknown neurogenesis, but rather glial and endothelialproliferation, e.g., the dentate gyrus molecular layer,the hilus region, and the olfactory plexiform region,revealed no significant changes in the number of BrdU-positive cells (Table 2).
TABLE 2
BrdU Labeling in the Dentate Gyrus, Olfactory Bulb, and Lateral Ventricle Wall
Area Wildtype E2F1 deficient P value
Estimated total number of BrdU-positive cells per structureDentate gyrus—4 weeks after BrdU
Granule cell layer 480.7 � 52.7 242.6 � 36.3 0.003**Molecular layer 60.7 � 13.9 73.7 � 8.9 0.45Hilus 23.2 � 5.6 25.7 � 6.4 0.77
Olfactory bulb—4 weeks after BrdUGranule cell layer 38,971.9 � 1609.2 25,718.9 � 1840.0 �0.001**Plexiform layer 1,972.9 � 187.8 1,460.2 � 197.2 0.08
Percentage neuronal (NeuN�) cells among newborn (BrdU�) cellsDentate gyrus—granule cell layer 73.0% 78.0%Olfactory bulb—granule cell layer 97.0% 93.2%
Note. The number of BrdU-positive cells for each area was estimated using immunohistochemistry and a systematic randomized samplingprocedure (Williams and Rakic, 1988) similar to the optical disector (Gundersen et al., 1988). Note the high numbers of cells being labeled by asingle injection of BrdU. When combined with confocal analysis these numbers reveal a very prominent neurogenic activity in the adult mouseforebrain (see Fig. 3). Values are presented as group means �/� SEM. Significance levels in the unpaired two-tailed t test are given as P values.
** Statistically significant difference between wild-type and E2F1-deficient mice at the 1% level.
316 Cooper-Kuhn et al.

Postnatal Phenotype of E2F1 Deficiency
It has been hypothesized that a functional compen-sation for the lack of E2F1 is accomplished by otherfamily members, leading to the assumption that noapparent phenotype is observed during embryonicbrain development of E2F1-deficient mice (Field et al.,1996). In fact, five E2F family members are highly ex-pressed in the developing brain, and in situ hybridiza-tion signals for E2F1, E2F2, and E2F5 are preferentiallydetected in the ventricular zone, where neural stemcells and progenitors undergo rapid cell division(Dagnino et al., 1997).
In E2F1-deficient animals the neurogenesis of granulecells in the olfactory bulb, dentate gyrus, and cerebel-lum is affected; however, the number of neurons of theneocortex, which develops exclusively during the em-bryonic phase, is unchanged by E2F1 deficiency, prob-ably due to compensation by other E2F family members(Tevosian et al., 1996; Dagnino et al., 1997; Kastner et al.,1998). But why are the other E2F family membersdownregulated postnatally? One explanation could liein the decreased complexity of neurogenic activity inthe postnatal brain compared to prenatal neural devel-opment. Postnatal and adult neurogenesis is mainlyrequired for the production of large homogeneous pop-ulations of interneurons. Therefore, from an evolution-ary point of view a decline of redundancy between E2Ffamily members in the postnatal CNS is probably morepermissive than during embryonic brain development.
Functional Significance of E2F1 in OtherAnimal Models
Although E2F1-deficient mice are viable and fertile,the functional importance of E2F transcription factorsfor cell cycle progression becomes obvious in otheranimal models. In Drosophila, mutation of the E2F1 ho-mologue (dE2F) is early embryonic lethal (Duronio etal., 1995). Once the maternal contribution of gene prod-ucts in the fly embryo has ended, a cessation of DNAsynthesis is observed in virtually all cells of the embryo.In mammals, the functional redundancy of E2F familymembers becomes apparent when the effects of multi-ple deletions are studied. A recent report of fibroblastsdefective in E2F1, E2F2, and E2F3 showed a completeabolition of S-phase entry, whereas single- and double-mutant cells were not affected (Wu et al., 2001). Fromthese experiments it becomes apparent that the E2Ftranscription factors play an essential role in cell cycleprogression, proliferation, and development.
Cell Death in Regions of Adult Neurogenesis
Several members of the E2F family of transcriptionfactors affect cell cycle progression, but E2F1 is the onlyknown member to induce cell death as well (Shan andLee, 1994; Hiebert et al., 1995; Field et al., 1996; DeGre-gori et al., 1997). The mechanism of the proapoptoticE2F1 activity is not fully understood, but it is assumedthat forcing proliferation-incompetent cells past theG1–S restriction point of the cell cycle may induce ab-errant proliferation and subsequent apoptosis (Shan etal., 1996; Chiarugi et al., 1997; Tsai et al., 1998). In theinitial description of E2F1-deficient mice, one of themost prominent effects found was a hyperplasia of thethymus due to a defect in apoptotic elimination ofthymocytes during T-cell maturation (Field et al., 1996).Other experiments demonstrated, that overexpressionof E2F1 in postmitotic neurons in vitro induces apopto-sis (Hou et al., 2000; O’Hare et al., 2000), whereas elim-ination of E2F1 function can prevent induction of apo-ptosis in neurons (Athanasiou et al., 1998; Swenson etal., 1999; Hou et al., 2000).
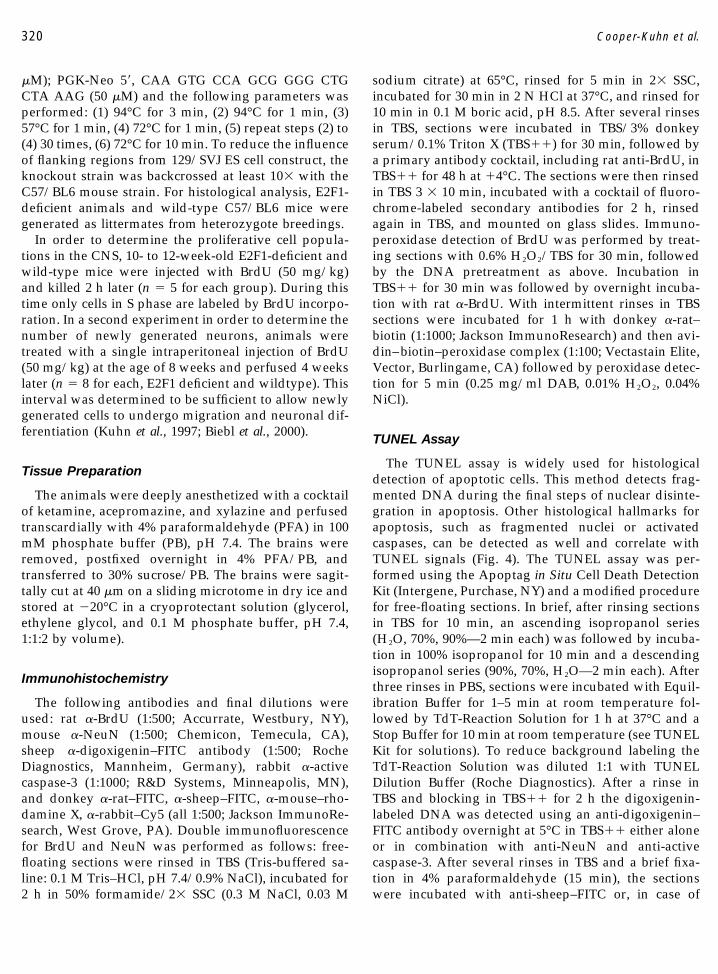
For the rat, we have previously shown that the gen-eration of new neurons in the adult CNS is controlledby a balance of neural stem cell proliferation and apo-ptotic elimination of progenitors and neurons (Biebl etal., 2000) and that the highest number of apoptotic cellswas found in the olfactory bulb, where postmitoticneuroblasts and mature neurons are eliminated. Thus,we determined whether apoptosis is present in regionsof stem cell proliferation and neuronal differentiation ofthe adult mouse brain using the terminal dUTP nick-end labeling (TUNEL) assay. As previously shown forthe rat, regions of neurogenesis in the adult mouse CNSharbor a high density of TUNEL-positive cells (Figs. 4and 5); therefore, we quantitatively evaluated TUNELprofiles to detect possible differences between E2F1-deficient and wild-type mice. Specificity of TUNEL la-beling was controlled by colabeling of apoptotic profileswith anti-active caspase-3 antibody (Fig. 4). In E2F1-deficient animals the numbers of TUNEL-positive pro-files in the granule cell layer of the dentate gyrus andolfactory bulb were about 60–70% lower than in wild-type animals (Figs. 5A and 5B). The lateral ventriclewall revealed no significant changes in cell death (Fig.5C); however, a trend toward reduced apoptotic cellswas detected.
The effect of E2F1 deficiency on apoptosis suggeststhat the reduction in neurogenesis and cell numberswould be more drastic if apoptosis were not affected inparallel. As for the cerebellar granule cells, we can onlyspeculate how the neonatal generation of cerebellar
317Regulation of Adult Neurogenesis by E2F1
granule cells in vivo is influenced by E2F1 deficiency,since we measure the total number of cerebellar neu-rons in adult animals (Fig. 1). Compared to the regionsof adult neurogenesis the reduction in the number ofcerebellar granule cells is rather small, perhaps due to
an even stronger decrease in apoptotic elimination ofgranule cell progenitors. Along these lines, in vitro ex-periments have shown that E2F1 deficiency completelyabolishes neuronal death in cerebellar granule cells in-duced by �-amyloid (Giovanni et al., 1999).
FIG. 3. Adult neurogenesis in E2F1-deficient and wild-type animals. Decreased numbers of newly generated granule cells in the dentate gyrus(A–C) and the olfactory bulb (D–F) of adult E2F1-deficient mice (n � 7) and wild-type littermates (n � 8). Confocal analysis was used todetermine the percentage of neurons (NeuN-positive cells—red) among the population of newborn cells (BrdU-positive cells—green) at 4 weeksafter BrdU labeling (double-labeling appears yellow). The total number of newly generated neurons was estimated by combining thestereologically assessed number of BrdU-positive cells with the percentage of neurons among the BrdU-positive cells (for details see Experi-mental Methods) and represented as group means �/� SEM. **Statistically significant difference between wild-type and E2F1-deficient mice atthe 1% level (Student’s t test). Scale bar in A, 20 �m.FIG. 4. Detection of apoptotic cells in the adult brain. In order to detect apoptotic cells in tissue sections we performed the TUNEL assay (greensignal in A, B, and D). Other hallmarks of apoptosis, like anti-active caspase-3 immunoreactivity (blue signal in A and C) or nuclearfragmentation (D) colabeled with TUNEL-positive cells, which verifies the specificity of TUNEL labeling. Red signal in A and D, anti-NeuN.Scale bar, 15 �m.
318 Cooper-Kuhn et al.

In vitro overexpression of E2F1 leads to a strongupregulation of cell death activators (Muller et al., 2001).The induction of E2F1 in postmitotic neurons activatesDNA synthesis and concomitant cell death (Hou et al.,2000; O’Hare et al., 2000). For the pathophysiology ofAlzheimer’s disease, it has become increasingly evidentthat neuronal cell death is accompanied by an upregu-lation of cell cycle activators, including E2F, and S-phase entry (Arendt, 2000; Husseman et al., 2000; Rainaet al., 2000; Yang et al., 2001). Under E2F1 deficiency,neurons were resistant to staurosporine-, large T-anti-gen, and low K�-induced neurotoxicity in vitro (Atha-nasiou et al., 1998; Swenson et al., 1999; Hou et al., 2000;O’Hare et al., 2000). The ability of Myc to induce apo-ptosis in fibroblasts is also markedly reduced in cellsdeleted for E2F1 (Leone et al., 2001). These studies hinttoward an active and direct role of E2F1 in the molec-ular regulation of apoptosis.
CONCLUSION
Adult neurogenesis is a cellular mechanism that en-compasses rapid cell division of neural stem cells andprogenitors in the ventricle wall and hippocampus, fol-lowed by migration and neuronal and glial differentia-tion. With a cell cycle length of 14 h for progenitors inthe ventricle wall (Smith and Luskin, 1998) and 25 h forthe dentate gyrus (Cameron and McKay, 2001) and thedaily generation of several tens of thousands of neuronsin adult rodent brain, a tight molecular regulation ofcell cycle progression and cell death is required. Thepresent study shows that E2F1 plays a significant role inthe generation of granule cells in the postnatal andadult CNS by affecting proliferation and cell death.E2F1 deficiency reduces neuronal cell numbers, ratherthan distorting brain structures, suggesting a role incontrolling the number of granule cells in the postnatalbrain.
EXPERIMENTAL METHODS
Animals and BrdU Injections
E2F1 mutant mice were previously generated by in-serting a PGK-Neo cassette into exons 3 and 4 (Field etal., 1996), leading to a deletion of the DNA binding andheterodimer regions. To determine the genotype ofthe breedings, PCR analysis using three primers E2F15�, GGA TAT GAT TCT TGG ACT TCT TGG (50 �M);E2F1 3�, CTA AAT CTG ACC ACC AAA CGC (100
FIG. 5. Apoptosis in regions of adult neurogenesis. Apoptoticcells were consistently detected throughout the neurogenic regionsof the adult brain. (A, C, E) We identified numerous TUNEL-positive cells (green) in (A) the granule cell layer of the dentategyrus–DG, (C) the granule cell layer of the olfactory bulb–OB,and (E) the subventricular zone–SVZ. (B, D, F) Quantificationof TUNEL-positive cells in wild-type (n � 8) and E2F1-deficient mice (n � 7) revealed a significant reduction in the dentategyrus and olfactory bulb of the knockout animals, whereas in theSVZ no significant changes were detected (Student’s t test). Redsignal, nuclear counterstaining ToPro 3. Scale bars in A, C, and E,7.5 �m.
319Regulation of Adult Neurogenesis by E2F1
�M); PGK-Neo 5�, CAA GTG CCA GCG GGG CTGCTA AAG (50 �M) and the following parameters wasperformed: (1) 94°C for 3 min, (2) 94°C for 1 min, (3)57°C for 1 min, (4) 72°C for 1 min, (5) repeat steps (2) to(4) 30 times, (6) 72°C for 10 min. To reduce the influenceof flanking regions from 129/SVJ ES cell construct, theknockout strain was backcrossed at least 10� with theC57/BL6 mouse strain. For histological analysis, E2F1-deficient animals and wild-type C57/BL6 mice weregenerated as littermates from heterozygote breedings.
In order to determine the proliferative cell popula-tions in the CNS, 10- to 12-week-old E2F1-deficient andwild-type mice were injected with BrdU (50 mg/kg)and killed 2 h later (n � 5 for each group). During thistime only cells in S phase are labeled by BrdU incorpo-ration. In a second experiment in order to determine thenumber of newly generated neurons, animals weretreated with a single intraperitoneal injection of BrdU(50 mg/kg) at the age of 8 weeks and perfused 4 weekslater (n � 8 for each, E2F1 deficient and wildtype). Thisinterval was determined to be sufficient to allow newlygenerated cells to undergo migration and neuronal dif-ferentiation (Kuhn et al., 1997; Biebl et al., 2000).
Tissue Preparation
The animals were deeply anesthetized with a cocktailof ketamine, acepromazine, and xylazine and perfusedtranscardially with 4% paraformaldehyde (PFA) in 100mM phosphate buffer (PB), pH 7.4. The brains wereremoved, postfixed overnight in 4% PFA/PB, andtransferred to 30% sucrose/PB. The brains were sagit-tally cut at 40 �m on a sliding microtome in dry ice andstored at �20°C in a cryoprotectant solution (glycerol,ethylene glycol, and 0.1 M phosphate buffer, pH 7.4,1:1:2 by volume).
Immunohistochemistry
The following antibodies and final dilutions wereused: rat �-BrdU (1:500; Accurrate, Westbury, NY),mouse �-NeuN (1:500; Chemicon, Temecula, CA),sheep �-digoxigenin–FITC antibody (1:500; RocheDiagnostics, Mannheim, Germany), rabbit �-activecaspase-3 (1:1000; R&D Systems, Minneapolis, MN),and donkey �-rat–FITC, �-sheep–FITC, �-mouse–rho-damine X, �-rabbit–Cy5 (all 1:500; Jackson ImmunoRe-search, West Grove, PA). Double immunofluorescencefor BrdU and NeuN was performed as follows: free-floating sections were rinsed in TBS (Tris-buffered sa-line: 0.1 M Tris–HCl, pH 7.4/0.9% NaCl), incubated for2 h in 50% formamide/2� SSC (0.3 M NaCl, 0.03 M
sodium citrate) at 65°C, rinsed for 5 min in 2� SSC,incubated for 30 min in 2 N HCl at 37°C, and rinsed for10 min in 0.1 M boric acid, pH 8.5. After several rinsesin TBS, sections were incubated in TBS/3% donkeyserum/0.1% Triton X (TBS��) for 30 min, followed bya primary antibody cocktail, including rat anti-BrdU, inTBS�� for 48 h at �4°C. The sections were then rinsedin TBS 3 � 10 min, incubated with a cocktail of fluoro-chrome-labeled secondary antibodies for 2 h, rinsedagain in TBS, and mounted on glass slides. Immuno-peroxidase detection of BrdU was performed by treat-ing sections with 0.6% H2O2/TBS for 30 min, followedby the DNA pretreatment as above. Incubation inTBS�� for 30 min was followed by overnight incuba-tion with rat �-BrdU. With intermittent rinses in TBSsections were incubated for 1 h with donkey �-rat–biotin (1:1000; Jackson ImmunoResearch) and then avi-din–biotin–peroxidase complex (1:100; Vectastain Elite,Vector, Burlingame, CA) followed by peroxidase detec-tion for 5 min (0.25 mg/ml DAB, 0.01% H2O2, 0.04%NiCl).
TUNEL Assay
The TUNEL assay is widely used for histologicaldetection of apoptotic cells. This method detects frag-mented DNA during the final steps of nuclear disinte-gration in apoptosis. Other histological hallmarks forapoptosis, such as fragmented nuclei or activatedcaspases, can be detected as well and correlate withTUNEL signals (Fig. 4). The TUNEL assay was per-formed using the Apoptag in Situ Cell Death DetectionKit (Intergene, Purchase, NY) and a modified procedurefor free-floating sections. In brief, after rinsing sectionsin TBS for 10 min, an ascending isopropanol series(H2O, 70%, 90%—2 min each) was followed by incuba-tion in 100% isopropanol for 10 min and a descendingisopropanol series (90%, 70%, H2O—2 min each). Afterthree rinses in PBS, sections were incubated with Equil-ibration Buffer for 1–5 min at room temperature fol-lowed by TdT-Reaction Solution for 1 h at 37°C and aStop Buffer for 10 min at room temperature (see TUNELKit for solutions). To reduce background labeling theTdT-Reaction Solution was diluted 1:1 with TUNELDilution Buffer (Roche Diagnostics). After a rinse inTBS and blocking in TBS�� for 2 h the digoxigenin-labeled DNA was detected using an anti-digoxigenin–FITC antibody overnight at 5°C in TBS�� either aloneor in combination with anti-NeuN and anti-activecaspase-3. After several rinses in TBS and a brief fixa-tion in 4% paraformaldehyde (15 min), the sectionswere incubated with anti-sheep–FITC or, in case of
320 Cooper-Kuhn et al.
triple labeling with anti-sheep–FITC, anti-mouse–rho-damine X and anti-rabbit–Cy5 secondary antibodies for2 h in TBS��. Sections that received only TUNELlabeling were incubated with the nuclear counterstainToPro-3 (1:2500; Molecular Probes, Eugene, OR).
Stereological Counting Procedure
For quantification, a systematic, random countingprocedure similar to the optical disector (Gundersen etal., 1988) was used as described by Williams and Rakic(1988). For total cell counts in specific brain areas sec-tions were counterstained with cresyl violet for Nisslstaining (cerebellum and cortex) or with the fluorescentnuclear marker 4�,6-diamidino-2-phenylindole (DAPI;dentate gyrus and subventricular zone). To determinethe number of Nissl- or DAPI-stained cells as well asBrdU-positive or TUNEL-positive cells in individualbrain regions, separate series of every sixth section(240-�m interval) of the left hemisphere from eachbrain were analyzed. The volume of each structure wasdetermined by tracing the areas using a semiautomaticstereology system (StereoInvestigator; MicroBright-Field, Colchester, VT). Positive cells, which intersectedthe uppermost focal plane (exclusion plane) and thelateral exclusion boundaries of the counting frames,were not counted. As BrdU-labeled cells and TUNEL-labeled cells are comparatively rare in the dentate gy-rus, no counting frames were used, but rather all cells inthe dentate gyrus were counted on each section underexclusion of the uppermost focal plane.
Area Definitions
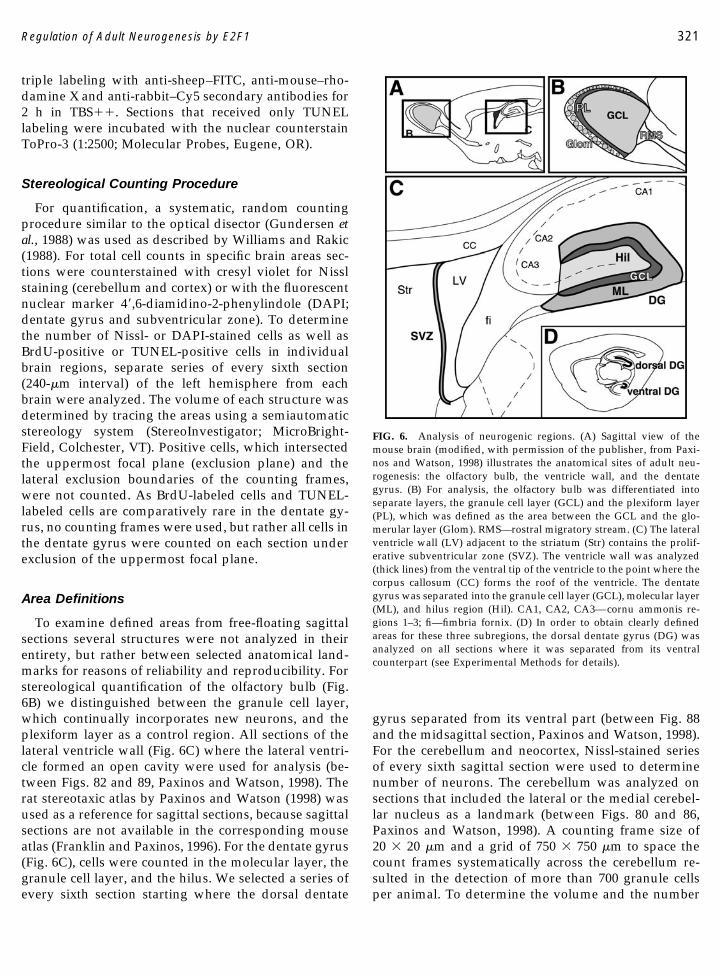
To examine defined areas from free-floating sagittalsections several structures were not analyzed in theirentirety, but rather between selected anatomical land-marks for reasons of reliability and reproducibility. Forstereological quantification of the olfactory bulb (Fig.6B) we distinguished between the granule cell layer,which continually incorporates new neurons, and theplexiform layer as a control region. All sections of thelateral ventricle wall (Fig. 6C) where the lateral ventri-cle formed an open cavity were used for analysis (be-tween Figs. 82 and 89, Paxinos and Watson, 1998). Therat stereotaxic atlas by Paxinos and Watson (1998) wasused as a reference for sagittal sections, because sagittalsections are not available in the corresponding mouseatlas (Franklin and Paxinos, 1996). For the dentate gyrus(Fig. 6C), cells were counted in the molecular layer, thegranule cell layer, and the hilus. We selected a series ofevery sixth section starting where the dorsal dentate
gyrus separated from its ventral part (between Fig. 88and the midsagittal section, Paxinos and Watson, 1998).For the cerebellum and neocortex, Nissl-stained seriesof every sixth sagittal section were used to determinenumber of neurons. The cerebellum was analyzed onsections that included the lateral or the medial cerebel-lar nucleus as a landmark (between Figs. 80 and 86,Paxinos and Watson, 1998). A counting frame size of20 � 20 �m and a grid of 750 � 750 �m to space thecount frames systematically across the cerebellum re-sulted in the detection of more than 700 granule cellsper animal. To determine the volume and the number
FIG. 6. Analysis of neurogenic regions. (A) Sagittal view of themouse brain (modified, with permission of the publisher, from Paxi-nos and Watson, 1998) illustrates the anatomical sites of adult neu-rogenesis: the olfactory bulb, the ventricle wall, and the dentategyrus. (B) For analysis, the olfactory bulb was differentiated intoseparate layers, the granule cell layer (GCL) and the plexiform layer(PL), which was defined as the area between the GCL and the glo-merular layer (Glom). RMS—rostral migratory stream. (C) The lateralventricle wall (LV) adjacent to the striatum (Str) contains the prolif-erative subventricular zone (SVZ). The ventricle wall was analyzed(thick lines) from the ventral tip of the ventricle to the point where thecorpus callosum (CC) forms the roof of the ventricle. The dentategyrus was separated into the granule cell layer (GCL), molecular layer(ML), and hilus region (Hil). CA1, CA2, CA3—cornu ammonis re-gions 1–3; fi—fimbria fornix. (D) In order to obtain clearly definedareas for these three subregions, the dorsal dentate gyrus (DG) wasanalyzed on all sections where it was separated from its ventralcounterpart (see Experimental Methods for details).
321Regulation of Adult Neurogenesis by E2F1

of neurons in the neocortex, we selected sections thatincluded the capsula interna as an external landmark(Paxinos and Watson, 1986). On these sections the neo-cortex was analyzed in its entire depth (layer I–VI) andlength (from the rhinal fissue to the occipital pole). Inorder to estimate the total number of cortical neurons acounting frame size of 30 � 30 �m and a grid of 300 �1200 �m was used, leading to the detection of morethan 500 neurons per animal. In order to determine thefraction of BrdU-positive cells among the total popula-tion of cells, we stereologically counted DAPI-positivecells in the granule cell layer of the dentate gyrus(counting frame size of 20 � 20 �m and a grid of 120 �120 �m) and the subventricular zone (counting framesize of 30 � 30 �m and a grid of 100 � 100 �m). Theresulting cell number was used to calculate the percent-age of BrdU-positive cells relative to the total number ofcells.
Neuronal Differentiation
To determine the percentage of neuronal differentia-tion of newborn cells, a series of every sixth section wasstained for double immunofluorescence using antibod-ies against BrdU and NeuN. For each brain and eachneurogenic region, 50 BrdU-positive cells were ran-domly selected and analyzed for BrdU/NeuN-doublelabeling (Fig. 3). Using a confocal microscope (TCS-NT;Leica Microsystems, Bensheim, Germany) equippedwith a 40� PL APO oil objective (1.25 NA) and apinhole setting that corresponded to a thickness of thefocal plane of less than 2 �m, each BrdU-positive cellwas analyzed in its entire z axis in order to exclude falsedouble labeling due to an overlay of signals from dif-ferent cells (Kuhn et al., 1997). The resulting percentagesfor each group were multiplied with the stereologicallyestimated numbers of BrdU-positive cells in order toestimate the number of newly generated neurons.
Statistical Analysis
The data are expressed as mean values �/� standarderror of mean (S.E.M.) Statistical analysis was per-formed using the unpaired, two-sided t-test comparison(Student’s t-test) between E2F1-deficient and wildtypegroups (Statview, SAS Institute, Cary, NC). Significantdifferences were assumed at a level of p � 0.05.
ACKNOWLEDGMENTS
We thank Fred Gage, Gerd Kempermann, and Jonas Frisen for theircritical review of the manuscript and Ludwig Aigner, Ulrich Bog-
dahn, and Michael E. Greenberg for their support, comments, anddiscussions during these studies. This work was supported by theDeutsche Forschungsgemeinschaft and the ReForM program of theSchool of Medicine at the University of Regensburg.
REFERENCES
Altman, J. (1969). Autoradiographic and histological studies of post-natal neurogenesis. IV. Cell proliferation and migration in theanterior forebrain, with special reference to persisting neurogenesisin the olfactory bulb. J. Comp. Neurol. 137: 433–457.
Arendt, T. (2000). Alzheimer’s disease as a loss of differentiationcontrol in a subset of neurons that retain immature features in theadult brain. Neurobiol. Aging 21: 783–796.
Athanasiou, M. C., Yunis, W., Coleman, N., Ehlenfeldt, R., Clark,H. B., Orr, H. T., and Feddersen, R. M. (1998). The transcriptionfactor E2F-1 in SV40 T antigen-induced cerebellar Purkinje celldegeneration. Mol. Cell. Neurosci. 12: 16–28.
Biebl, M., Cooper, C. M., Winkler, J., and Kuhn, H. G. (2000). Analysisof neurogenesis and programmed cell death reveals a self-renewingcapacity in the adult rat brain. Neurosci. Lett. 291: 17–20.
Cameron, H. A., and McKay, R. D. (2001). Adult neurogenesis pro-duces a large pool of new granule cells in the dentate gyrus.J. Comp. Neurol. 435: 406–417.
Cameron, H. A., Woolley, C. S., McEwen, B. S., and Gould, E. (1993).Differentiation of newly born neurons and glia in the dentate gyrusof the adult rat. Neuroscience 56: 337–344.
Chiarugi, V., Magnelli, L., and Cinelli, M. (1997). Complex interplayamong apoptosis factors: RB, p53, E2F, TGF-beta, cell cycle inhibi-tors and the bcl2 gene family. Pharmacol. Res. 35: 257–261.
Dagnino, L., Fry, C. J., Bartley, S. M., Farnham, P., Gallie, B. L., andPhillips, R. A. (1997). Expression patterns of the E2F family oftranscription factors during mouse nervous system development.Mech. Dev. 66: 13–25.
DeGregori, J., Leone, G., Miron, A., Jakoi, L., and Nevins, J. R. (1997).Distinct roles for E2F proteins in cell growth control and apoptosis.Proc. Natl. Acad. Sci. USA 94: 7245–7250.
Duronio, R. J., O’Farrell, P. H., Xie, J. E., Brook, A., and Dyson, N.(1995). The transcription factor E2F is required for S phase duringDrosophila embryogenesis. Genes Dev. 9: 1445–1455.
Field, S. J., Tsai, F. Y., Kuo, F., Zubiaga, A. M., Kaelin, W. G., Jr.,Livingston, D. M., Orkin, S. H., and Greenberg, M. E. (1996). E2F-1functions in mice to promote apoptosis and suppress proliferation.Cell 85: 549–561.
Franklin, K. B. J., and Paxinos, G. (1996). The Mouse Brain in StereotaxicCoordinates. Academic Press, New York.
Giovanni, A., Wirtz-Brugger, F., Keramaris, E., Slack, R., and Park,D. S. (1999). Involvement of cell cycle elements, cyclin-dependentkinases, pRb, and E2F � DP, in �-amyloid-induced neuronal death.J. Biol. Chem. 274: 19011–19016.
Gundersen, H. J., Bagger, P., Bendtsen, T. F., Evans, S. M., Korbo, L.,Marcussen, N., Moller, A., Nielsen, K., Nyengaard, J. R., Pakken-berg, B., et al. (1988). The new stereological tools: Disector, frac-tionator, nucleator and point sampled intercepts and their use inpathological research and diagnosis. APMIS 96: 857–881.
Hiebert, S. W., Packham, G., Strom, D. K., Haffner, R., Oren, M.,Zambetti, G., and Cleveland, J. L. (1995). E2F-1:DP-1 induces p53and overrides survival factors to trigger apoptosis. Mol. Cell. Biol.15: 6864–6874.
Hou, S. T., Callaghan, D., Fournier, M. C., Hill, I., Kang, L., Massie, B.,
322 Cooper-Kuhn et al.

Morley, P., Murray, C., Rasquinha, I., Slack, R., and MacManus, J. P.(2000). The transcription factor E2F1 modulates apoptosis of neu-rons. J. Neurochem. 75: 91–100.
Husseman, J. W., Nochlin, D., and Vincent, I. (2000). Mitotic activa-tion: A convergent mechanism for a cohort of neurodegenerativediseases. Neurobiol. Aging 21: 815–828.
Johnson, D. G., Cress, W. D., Jakoi, L., and Nevins, J. R. (1994).Oncogenic capacity of the E2F1 gene. Proc. Natl. Acad. Sci. USA 91:12823–12827.
Kaplan, M. S., McNelly, N. A., and Hinds, J. W. (1985). Populationdynamics of adult-formed granule neurons of the rat olfactory bulb.J. Comp. Neurol. 239: 117–125.
Kastner, A., Espanel, X., and Brun, G. (1998). Transient accumulationof retinoblastoma/E2F-1 protein complexes correlates with the on-set of neuronal differentiation in the developing quail neural retina.Cell Growth Differ. 9: 857–867.
Kuhn, H. G., Dickinson-Anson, H., and Gage, F. H. (1996). Neuro-genesis in the dentate gyrus of the adult rat: Age-related decreaseof neuronal progenitor proliferation. J. Neurosci. 16: 2027–2033.
Kuhn, H. G., Winkler, J., Kempermann, G., Thal, L. J., and Gage, F. H.(1997). Epidermal growth factor and fibroblast growth factor-2 havedifferent effects on neural progenitors in the adult rat brain. J. Neu-rosci. 17: 5820–5829.
Leone, G., Sears, R., Huang, E., Rempel, R., Nuckolls, F., Park, C. H.,Giangrande, P., Wu, L., Saavedra, H. I., Field, S. J., Thompson,M. A., Yang, H., Fujiwara, Y., Greenberg, M. E., Orkin, S., Smith, C.,and Nevins, J. R. (2001). Myc requires distinct E2F activities toinduce S phase and apoptosis. Mol. Cell 8: 105–113.
Levison, S. W., Rothstein, R. P., Brazel, C. Y., Young, G. M., andAlbrecht, P. J. (2000). Selective apoptosis within the rat subependy-mal zone: A plausible mechanism for determining which lineagesdevelop from neural stem cells. Dev. Neurosci. 22: 106–115.
Muller, H., Bracken, A. P., Vernell, R., Moroni, M. C., Christians, F.,Grassilli, E., Prosperini, E., Vigo, E., Oliner, J. D., and Helin, K.(2001). E2Fs regulate the expression of genes involved in differen-tiation, development, proliferation, and apoptosis. Genes Dev. 15:267–285.
O’Hare, M. J., Hou, S. T., Morris, E. J., Cregan, S. P., Xu, Q., Slack,R. S., and Park, D. S. (2000). Induction and modulation of cerebellargranule neuron death by E2F-1. J. Biol. Chem. 275: 25358–25364.
Paxinos, G., and Watson, C. (1998). The Rat Brain in Stereotaxic Coor-dinates. Academic Press, San Diego.
Raina, A. K., Zhu, X., Rottkamp, C. A., Monteiro, M., Takeda, A., andSmith, M. A. (2000). Cyclin’ toward dementia: Cell cycle abnormal-ities and abortive oncogenesis in Alzheimer disease. J. Neurosci. Res.61: 128–133.
Shan, B., Durfee, T., and Lee, W. H. (1996). Disruption of RB/E2F-1interaction by single point mutations in E2F-1 enhances S-phaseentry and apoptosis. Proc. Natl. Acad. Sci. USA 93: 679–684.
Shan, B., and Lee, W. H. (1994). Deregulated expression of E2F-1induces S-phase entry and leads to apoptosis. Mol. Cell. Biol. 14:8166–8173.
Smith, C. M., and Luskin, M. B. (1998). Cell cycle length of olfactorybulb neuronal progenitors in the rostral migratory stream. Dev.Dyn. 213: 220–227.
Swenson, J. J., Mauser, A. E., Kaufmann, W. K., and Kenney, S. C.(1999). The Epstein–Barr virus protein BRLF1 activates S phaseentry through E2F1 induction. J. Virol. 73: 6540–6550.
Tevosian, S. G., Paulson, K. E., Bronson, R., and Yee, A. S. (1996).Expression of the E2F-1/DP-1 transcription factor in murine devel-opment. Cell Growth Differ. 7: 43–52.
Tsai, K. Y., Hu, Y., Macleod, K. F., Crowley, D., Yamasaki, L., andJacks, T. (1998). Mutation of E2f-1 suppresses apoptosis and inap-propriate S phase entry and extends survival of Rb-deficient mouseembryos. Mol. Cell 2: 293–304.
Williams, R. W., and Rakic, P. (1988). Three-dimensional counting: Anaccurate and direct method to estimate numbers of cells in sec-tioned material. J. Comp. Neurol. 278: 344–352.
Wu, L., Timmers, C., Maiti, B., Saavedra, H. I., Sang, L., Chong, G. T.,Nuckolls, F., Giangrande, P., Wright, F. A., Field, S. J., Greenberg,M. E., Orkin, S., Nevins, J. R., Robinson, M. L., and Leone, G. (2001).The E2F1–3 transcription factors are essential for cellular prolifer-ation. Nature 414: 457–462.
Yamasaki, L., Jacks, T., Bronson, R., Goillot, E., Harlow, E., andDyson, N. J. (1996). Tumor induction and tissue atrophy in micelacking E2F-1. Cell 85: 537–548.
Yang, Y., Geldmacher, D. S., and Herrup, K. (2001). DNA replicationprecedes neuronal cell death in Alzheimer’s disease. J. Neurosci. 21:2661–2668.
Yoshikawa, K. (2000). Cell cycle regulators in neural stem cells andpostmitotic neurons. Neurosci. Res. 37: 1–14.
Received January 28, 2002Revised May 23, 2002
Accepted June 16, 2002
323Regulation of Adult Neurogenesis by E2F1