Embed Size (px)
Citation preview

IMPACTS TO MONTANA STATE HIGHWAYS DUE TO BAKKEN OIL DEVELOPMENT
Final Report
prepared forTHE STATE OF MONTANADEPARTMENT OF TRANSPORTATION
in cooperation withTHE U.S. DEPARTMENT OF TRANSPORTATIONFEDERAL HIGHWAY ADMINISTRATION
February 2013
prepared byAlan DybingEunSu LeeChristopher DeHaanNimish Dharmadhikari
Upper Great Plains Transportation InstituteNorth Dakota State University
FHWA/MT-13-002/8219
R E S E A R C H P R O G R A M S

You are free to copy, distribute, display, and perform the work; make derivative works; make commercial use of the work under the condition that you give the original author
and sponsor credit. For any reuse or distribution, you must make clear to others the license terms of this work. Any of these conditions can be waived if you get permission from the sponsor. Your fair use and other rights are in no way affected by the above.

Impacts to Montana State Highways Due to Bakken Oil Development
Impacts to Montana State Highways Due to Bakken Oil Development
Final Report
February 2013
Prepared by the Upper Great Plains Transportation Institute
Prepared for the MONTANA DEPARTMENT OF TRANSPORTATION
In cooperation with the U.S. DEPARTMENT OF TRANSPORTATION & FEDERAL HIGHWAY ADMINISTRATION

Impacts to Montana State Highways Due to Bakken Oil Development
ii
TECHNICAL REPORT DOCUMENTATION PAGE
1. Report No. MT/FHWA-13-002/8219
2. Government Accession No.
3. Recipient's Catalog No.
4. Title and Subtitle Impacts to Montana State Highways Due to Bakken Oil Development
5. Report Date February 2013 6. Performing Organization Code
7. Author(s) Alan Dybing, EunSu Lee, Christopher DeHaan, Nimish Dharmadhikari
8. Performing Organization Report No.
9. Performing Organization Name and Address Upper Great Plains Transportation Institute NDSU Dept. 2880 P.O. Box 6050 Fargo, ND 58108-6050
10. Work Unit No. 11. Contract or Grant No. 8219
12. Sponsoring Agency Name and Address Research Programs Montana Department of Transportation 2701 Prospect Avenue PO Box 201001 Helena MT 59620-1001
13. Type of Report and Period Covered Final Report May 2012-January 2013 14. Sponsoring Agency Code 5401
15. Supplementary Notes Research performed in cooperation with the Montana Department of Transportation and the US Department of Transportation, Federal Highway Administration. This report can be found at http://www.mdt.mt.gov/research/projects/pave/oil.shtml. 16. Abstract This study developed a detailed truck traffic forecasting model with specific attention to truck movements related to oil development in the Bakken formation in eastern Montana and western North Dakota. Oil forecast scenarios as specified by MDT were analyzed to assess the differences in impacts under differing development scenarios. Locations of input sources were identified through industry websites, Departments of Transportation, and other regulatory bodies. Routes between aggregate well locations and input and output sources were estimated utilizing ESRI Network Analyst©. A series of capacity constrained optimization models were used to select the least cost set of routes for oil distribution in the region, and results were aggregated to the highway segment level. Traffic data provided by MDT was used to calibrate and validate the traffic forecasting model. Traffic forecasting results are presented in shapefile format, which allows the user to retrieve segment specific forecasts and display changes in traffic volumes over the analysis period. 17. Key Words: Freight Modeling, Oil, Network Optimization, Traffic Forecasting, Forecasting, Freight Transportation, Geographic Information Systems, Oil Recovery Equipment, Traffic Distribution, Traffic Model
18. Distribution Statement Unrestricted. This document is available through the National Technical Information Service, Springfield, VA 21161.
19. Security Classif. (of this report) Unclassified
20. Security Classif. (of this page) Unclassified
21. No. of Pages 91
22. Price

Impacts to Montana State Highways Due to Bakken Oil Development
iii
Disclaimer Statement
This document is disseminated under the sponsorship of the Montana Department of Transportation (MDT) and the United States Department of Transportation (USDOT) in the interest of information exchange. The State of Montana and the United States assume no liability for the use or misuse of its contents.
The contents of this document reflect the views of the authors, who are solely responsible for the facts and accuracy of the data presented herein. The contents do not necessarily reflect the views or official policies of MDT or the USDOT.
The State of Montana and the United States do not endorse products of manufacturers.
This document does not constitute a standard, specification, policy or regulation.
Alternative Format Statement
MDT attempts to provide accommodations for any known disability that may interfere with a person participating in any service, program, or activity of the Department. Alternative accessible formats of this information will be provided upon request. For further information, call 406/444.7693, TTY 800/335.7592, or Montana Relay at 711.

Impacts to Montana State Highways Due to Bakken Oil Development
iv
TABLE OF CONTENTS OVERVIEW ............................................................................................................................ 1 1.
DEVELOP GIS PRODUCTION DATABASE ...................................................................... 2 2.
Township as production locations .................................................................................... 2 2.1.
Freshwater sites ................................................................................................................ 3 2.2.
Salt water disposal (SWD) sites ....................................................................................... 6 2.3.
Railroad transloading facilities ......................................................................................... 7 2.4.
Pipeline transloading facilities ......................................................................................... 9 2.5.
Oil towns ........................................................................................................................ 11 2.6.
Sand ................................................................................................................................ 12 2.7.
Gravel/scoria .................................................................................................................. 14 2.8.
SYNTHESIZE FORECASTS OF OIL DEVELOPMENT ................................................... 15 3.
DEVELOP A DETAILED GIS NETWORK OF STATE HIGHWAYS .............................. 16 4.
Road networks ................................................................................................................ 16 4.1.
Border crossings ............................................................................................................. 19 4.2.
INTERSECTIONS AND JUNCTIONS ................................................................................ 21 5.
Attribute settings ............................................................................................................ 21 5.1.
5.1.1. Segment length........................................................................................................ 21
5.1.2. Travel speed through networks ............................................................................... 21
Sample routing verification ............................................................................................ 23 5.2.
ESAL ESTIMATES .............................................................................................................. 28 6.
ANALYSIS OF EXISTING TRAFFIC DATA .................................................................... 32 7.
Distribution of AADT on major highways: ................................................................... 32 7.1.
TRAFFIC MODELING ........................................................................................................ 40 8.
ROUTE ASSIGNMENT/DISTRIBUTION MODEL ........................................................... 41 9.
Route disaggregation and segment assignment .............................................................. 42 9.1.
RESULTS .......................................................................................................................... 43 10.
Scenario: 20 Rigs ........................................................................................................ 44 10.1.
Scenario: 40 Rigs ........................................................................................................ 52 10.2.
IMPLEMENTATION ........................................................................................................ 60 11.
Base GIS Shapefile ..................................................................................................... 60 11.1.

Impacts to Montana State Highways Due to Bakken Oil Development
v
Traffic forecast dBase files ......................................................................................... 61 11.2.
Joining the traffic forecasts to the MDT shapefile, and viewing forecasts ................ 62 11.3.
Utilization of Data ...................................................................................................... 62 11.4.
CONCLUSION .................................................................................................................. 64 12.
REFERENCES ............................................................................................................................. 65
APPENDIX A: 80 Rig Scenario .................................................................................................. 67
APPENDIX B: 160 Rig Scenario ................................................................................................ 75

Impacts to Montana State Highways Due to Bakken Oil Development
vi
LIST OF TABLES
Table 2-1: Railroad transloading facilities in Montana. ................................................................. 7 Table 2-2: Rail transloading sites in North Dakota (Dakota Plains Holdings Inc. 2012). .............. 9 Table 5-1: Estimation of the traveling speed of trucks during a daytime in Montana (miles per hour). ............................................................................................................................................. 23 Table 6-1: ESAL Estimates for Rig Related Movements, Drilling Phase ................................... 29 Table 6-2: ESAL Estimates Freshwater Movements, Drilling Phase .......................................... 30 Table 6-3: ESAL Estimates Sand Movements, Drilling Phase .................................................... 31 Table 11-1: Data elements of MDT highway shapefile ................................................................ 61 Table 11-2: dBase filename and corresponding scenario ............................................................. 61 Table 11-3: Data elements in scenario data files .......................................................................... 62

Impacts to Montana State Highways Due to Bakken Oil Development
vii
LIST OF FIGURES
Figure 2-1: Township centroids as production sources. ................................................................. 3 Figure 2-2: Selected freshwater locations. ...................................................................................... 5 Figure 2-3: SWD locations. ............................................................................................................ 6 Figure 2-4: Railroad oil transloading facilities (Poplar station in the near future). ........................ 8 Figure 2-5: Interactive map of the Enbridge pipelines (Enbridge Inc. 2011). ................................ 9 Figure 2-6: Poplar system in Montana (Bridger Pipeline LLC 2011). ......................................... 10 Figure 2-7: Pipeline transloading facilities. .................................................................................. 11 Figure 2-8: Oil Towns as supply locations in Montana and North Dakota. ................................. 12 Figure 2-9: Frac sand rail supply locations. .................................................................................. 13 Figure 2-10: Gravel/scoria geographical locations in Montana. ................................................... 14 Figure 4-1: Oil Counties in Montana and North Dakota. ............................................................. 16 Figure 4-2: Roads in Montana and North Dakota Showing Different Classifications. ................ 18 Figure 4-3: Quality assurance for connectivity through border crossings. ................................... 20 Figure 5-1: Travel speed through Highway Performance Maintenance Systems (HPMS) in Montana. ....................................................................................................................................... 22 Figure 5-2: Locating township centroid to the road networks. ..................................................... 24 Figure 5-3: Unlocated centroid further than 5,000 meters from the closest road links. ............... 24 Figure 5-4: Shortest paths from township centroid to the closet facilities in North Dakota. ....... 25 Figure 5-5: Potential connection errors identified. ....................................................................... 26 Figure 5-6: Updated road networks and the output of the closest facility module without error messages. ...................................................................................................................................... 27 Figure 7-1: Average annual trucks per day: U.S. Highway 2. ..................................................... 32 Figure 7-2: Truck AADT vs. milepoints: U.S. Highway 2. ......................................................... 33 Figure 7-3: Average annual trucks per day: Montana Highway 5 ............................................... 34 Figure 7-4: Truck AADT vs. mile points: Montana Highway 5 .................................................. 34 Figure 7-5: Average annual trucks per day: Montana Highway 16 ............................................. 35 Figure 7-6: Truck AADT vs. mile points: Montana Highway 16 ................................................ 36 Figure 7-7: Average annual trucks per day: I 94 ........................................................................ 37 Figure 7-8: Truck AADT vs. mile points: I 94 ........................................................................... 37 Figure 7-9: Average annual trucks per day: Montana Highway 200 ........................................... 38 Figure 7-10: Truck AADT vs. mile points: Montana Highway 200 ............................................ 39 Figure 8-1: Oil-related transportation activities .......................................................................... 40 Figure 10-1: Truck traffic in 2012 for the 20 rig scenario. ........................................................... 44 Figure 10-2: Truck traffic in 2013 for the 20 rig scenario. ........................................................... 45 Figure 10-3: Truck traffic in 2014 for the 20 rig scenario. ........................................................... 46 Figure 10-4: Truck traffic in 2015 for the 20 rig scenario. ........................................................... 47 Figure 10-5: Truck traffic in 2016 for the 20 rig scenario. ........................................................... 48 Figure 10-6: Truck traffic in 2021 for the 20 rig scenario. ........................................................... 49 Figure 10-7: Truck traffic in 2026 for the 20 rig scenario. ........................................................... 50

Impacts to Montana State Highways Due to Bakken Oil Development
viii
Figure 10-8: Truck traffic in 2031 for the 20 rig scenario. ........................................................... 51 Figure 10-9: Truck traffic in 2012 for the 40 rig scenario. ........................................................... 52 Figure 10-10: Truck traffic in 2013 for the 40 rig scenario. ......................................................... 53 Figure 10-11: Truck traffic in 2014 for the 40 rig scenario. ......................................................... 54 Figure 10-12: Truck traffic in 2015 for the 40 rig scenario. ......................................................... 55 Figure 10-13: Truck traffic in 2016 for the 40 rig scenario. ......................................................... 56 Figure 10-14: Truck traffic in 2021 for the 40 rig scenario. ......................................................... 57 Figure 10-15: Truck traffic in 2026 for the 40 rig scenario. ......................................................... 58 Figure 10-16: Truck traffic in 2031 for the 40 rig scenario. ......................................................... 59 Figure A-1: Truck traffic in 2012 for the 80 rig scenario ............................................................. 67 Figure A-2: Truck traffic in 2013 for the 80 rig scenario. ............................................................ 68 Figure A-3: Truck traffic in 2014 for the 80 rig scenario. ............................................................ 69 Figure A-4: Truck traffic in 2015 for the 80 rig scenario. ............................................................ 70 Figure A-5: Truck traffic in 2016 for the 80 rig scenario. ............................................................ 71 Figure A-6: Truck traffic in 2021 for the 80 rig scenario. ............................................................ 72 Figure A-7: Truck traffic in 2026 for the 80 rig scenario. ............................................................ 73 Figure A-8: Truck traffic in 2031 for the 80 rig scenario. ............................................................ 74 Figure B-1: Truck traffic in 2012 for the 160 rig scenario ........................................................... 75 Figure B-2: Truck traffic in 2013 for the 160 rig scenario. .......................................................... 76 Figure B-3: Truck traffic in 2014 for the 160 rig scenario. .......................................................... 77 Figure B-4: Truck traffic in 2015 for the 160 rig scenario. .......................................................... 78 Figure B-5: Truck traffic in 2016 for the 160 rig scenario. .......................................................... 79 Figure B-6: Truck traffic in 2021 for the 160 rig scenario. .......................................................... 80 Figure B-7: Truck traffic in 2026 for the 160 Rig scenario. ......................................................... 81 Figure B-8: Truck traffic in 2031 for the 160 Rig scenario. ......................................................... 82
Impacts to Montana State Highways Due to Bakken Oil Development
ix
EXECUTIVE SUMMARY
Recent oil development in western North Dakota and eastern Montana has resulted in large-scale
highway needs which suggest the possibility that substantial investment will be required in the
near future. This report outlines the development of a regional traffic model to predict and
assess traffic increases in northeastern Montana as a result of oil development. The analysis
included a significant data collection effort to identify: existing and potential locations of inputs
to the drilling and horizontal fracturing processes, existing and potential saltwater disposal and
oil collection facilities, forecasts of future production and exploration, and detailed geographic
information system (GIS) network development. A mathematical optimization model was
estimated to predict impacted highway segments, and traffic volumes were calibrated using
observed traffic counts. Four rig count scenarios were analyzed: 20, 40, 80 and 160 rigs.
Results of the analysis show significant traffic increases in the Richland, Roosevelt, and
Sheridan county area with additional traffic increases in the surrounding areas.
The study developed traffic forecasts for all state-maintained roadways within the study area for
the next 20 years. These results are presented visually as well as in supplementary GIS shapefiles.
Traffic forecasts presented in this report are subject to assumptions made in terms of production
and extraction technology as well as the underlying forecast scenarios. It is expected that the
forecast information outlined in this report is to be used in conjunction with traditional traffic
forecasting techniques and classification count observations for use in highway planning and
design.

Impacts to Montana State Highways Due to Bakken Oil Development
1
OVERVIEW 1.
Recent improvements in oil extraction technology have increased the economic viability of
production from oil shale formations. Because of these technological innovations and continued
interests in fostering energy independence, the Bakken formation in western North Dakota and
eastern Montana has become a major focus of current and future energy development plans.
Rapid oil development in western North Dakota and eastern Montana has resulted in large-scale
highway needs which suggest that substantial investment will be required in the near future.
Given the recent history of western North Dakota and escalating activity levels in Montana, the
Montana Department of Transportation (MDT) has undertaken development of a traffic model to
further understand the future demands and traffic patterns that will result from origins and
destinations of fracking materials, as well as the transportation infrastructure needed to move
both inbound materials and outbound products to transfer locations or market. This information
is essential to forecasting the highway impacts of future oil development and production in the
state as well as for identifying potential infrastructure funding gaps and solutions that will be
critically important to the development and implementation of a comprehensive highway
transportation plan to sustain Montana’s needs.
This document outlines the data collection efforts and methodology used to develop a truck trip
forecasting model for eastern Montana. The report is organized by individual tasks as specified
in the study contract. However, because of the progression of the tasks, they are not presented in
the same order as in the study contract. Chapter 2 outlines the locations for inputs to oil
production and outbound destinations for crude and saltwater movements. Chapter 3 discusses
the rationale behind analyzed scenarios. Chapter 4 describes efforts to construct a routable GIS
model. Chapters 5 and 6 discuss additional data elements used to estimate ESAL factors and the
evaluation of existing traffic data. Chapters 7, 8 and 9 describe the processes and methodology
used to forecast and assign traffic to individual highway segments. Sample results are presented
in Chapter 10. As specified in the contract, the deliverable form for traffic forecasts results is in
GIS shapefiles. Chapter 11 describes the steps necessary to join and view the traffic forecasts
within ESRI ArcMap.

Impacts to Montana State Highways Due to Bakken Oil Development
2
DEVELOP GIS PRODUCTION DATABASE 2.
Township as production locations 2.1.
Township polygons are used in this analysis as the basis of the traffic analysis zones (TAZ). The
township data was obtained from the TIGER® website (U.S. Census Bureau 2011). To represent
the activity location in the township polygons, the centroid of the township was used to
approximate locations of oil drilling activities and production (i.e. oil production sites). This
designation provides more detailed results than aggregation to the county subdivision or zip code
level. Moreover, this level of aggregation is appropriate as permit information is unavailable.
(Figure 2-1).
In addition to truck trips generated as a result of oil development in Montana, many cross border
movements result due to oil production in North Dakota. Due to capacity constraints on crude
oil transload facilities in North Dakota, outbound oil may move to transload facilities in Montana.
Aside from capacity limitations, the geographic proximity of North Dakota production to
Montana transload facilities may generate additional crude oil truck trips. Well drilling inputs
for North Dakota wells are often sourced from Montana for the reasons mentioned above.
Therefore, North Dakota oil development areas are included in the analysis to account for cross-
border movements. A total of 363 and 206 township centroids are considered in Montana and
North Dakota respectively.

Impacts to Montana State Highways Due to Bakken Oil Development
3
Figure 2-1: Township centroids as production sources.
Freshwater sites 2.2.
Freshwater sources are critical to the traffic flow model because the locations generate a
significant amount of traffic for the hydraulic fracturing process. However, because of limited
data availability, the freshwater locations were difficult to obtain. The following are names and
departments that were contacted to determine if there were any valid geographic coordinates of
freshwater locations and possible capacities.
“Water Source” in the Oil & Gas Data shapefile provided by Jim Halvorson (Halvorson
2012)
GWIC dataset- shapefile, but no information on capacities or distinction of use for
hydraulic fracturing (Montana Groundwater Information Center 2012)
Division of Natural Resources Conservation (DNRC) Water Rights Query System
contains capacity data, but no distinction of whether the water is available for use in

Impacts to Montana State Highways Due to Bakken Oil Development
4
hydraulic fracturing at present (Montana Department of Natural Resources and
Conservation 2012a).
The ground water wells data provide completion date, purpose for water, and the drilling
company. Based on these sources and information, ground water wells that yield 300 gallons per
minute or more are used in the analysis. This yield corresponds to a capacity of 1.094 million
barrels of freshwater per year. By applying this threshold a total of 272 fresh water locations
were selected for inclusion in the analysis.
Water from Montana cannot be sold to other states (Montana Department of Natural
Resources and Conservation 2012b). The guidance for municipalities report from April
19, 2012 says:
Municipalities may utilize their existing water rights to sell water for oil
development as long as the volume and flow of the water rights are not exceeded.
Municipalities may also expand their water rights under the following conditions:
o If a municipality wishes to increase its usage, including either the flow
rate and/or the volume of its water right, then it must apply for and receive
a Beneficial Water Use Permit (Form 600) for the additional flow rate
and/or volume before actually increasing its usage. If the municipality
expands its service area outside the historic place of use and needs to
increase its flow rate and/or volume to service that growth then that also
requires a new permit.
o If the municipality expands its service area outside the historic place of
use in order to sell water, but is not increasing its flow rate or volume, an
Application to Change a Water Right (Form 606) (“Change”) will need to
be filed to add the new place of use. For example, if a municipality wants
to set up a new water depot a mile outside of its municipal boundary then
it needs to file a Change application and receive authorization before
putting the water depot to use.
The potential to haul water from North Dakota to Montana is feasible as long as the company has
been issued a “point of diversion” permit for using the water, according to state regulatory
officials. The potential to haul water from Montana to North Dakota is not feasible, unless the

Impacts to Montana State Highways Due to Bakken Oil Development
5
company or individual meets the “Montana Code Annotated 2011, 85-2-311 sub-section (4)”
criteria (Montana Legislature 2011).
The MDT has indicated that freshwater movements cross the border between Montana and North
Dakota are possible despite the stated regulations. This study includes 42 freshwater locations
from North Dakota, which will allow for cross-border movements (Figure 2-2). This model
includes two scenarios: water procurement crossing borders and water consumption within state
boundaries.
Figure 2-2: Selected freshwater locations.

Impacts to Montana State Highways Due to Bakken Oil Development
6
Salt water disposal (SWD) sites 2.3.
The Montana Oil and Gas Division provided oil well GIS shapefiles, including multiple well
type designations. Among the types of wells, 272 active and drilling disposal sites are identified
in Figure 2-3. There are 169 SWD sites in North Dakota and 103 sites in Montana. The SWD
sites in North Dakota were obtained from the North Dakota oil and gas GIS map viewer (North
Dakota Department of Mineral Resources 2012).
Figure 2-3: SWD locations.

Impacts to Montana State Highways Due to Bakken Oil Development
7
Railroad transloading facilities 2.4.
Rail transload facilities were identified and geocoded in the GIS network throughout the study
region. Sources of the locations included railroad websites, private firm websites, NDDOT data,
and visual identification from satellite imaging. Google Earth® was used to locate and verify
facilities located on the rail network. Grain elevator terminals were excluded. The rail terminals
were crosschecked with BNSF and local railroad companies’ websites to determine whether they
met the criteria for inclusion in the analysis.
Procore Inc. operates a facility in Bainville, MT, to serve the Bakken oil play (Procore Group Inc.
2002). Pioneer operates a BNSF spur located in Culbertson, MT, for off-loading super sacks of
ceramic proppants. A transload facility in Dore, ND, is served by the BNSF railroad through the
Yellowstone Valley Railroad (Pioneer Oil, LLC 2011). The crude-by-rail facility in Dore can
handle 60,000 barrels per day (Progressive Railroading 2012) Specific facility locations are
shown in Table 2-1.
Table 2-1: Railroad transloading facilities in Montana.
Latitude Longitude Place Company 48.1432 -104.5160 Culbertson, MT Pioneer oil Transloading 48.1468 -104.2325 Bainville, MT Procore 46.1058 -105.1860 Poplar, MT BNSF (Future)
Three rail transloading facilities in Montana and five rail transloading facilities in North Dakota
are geocoded based on the data collected in Montana as well as locations identified in previous
research efforts in North Dakota (Figure 2-4).

Impacts to Montana State Highways Due to Bakken Oil Development
8
Figure 2-4: Railroad oil transloading facilities (Poplar station in the near future).
The four crude-by-rail sites in operation in North Dakota were included in the analysis and
shown in Table 2-2: Trenton, Dore, Epping, and Tioga. Those facilities handle 70,000-90,000
barrels of oil per day (bbls/day). Trenton, Epping, and Tioga are located in Williams County,
Dore in McKenzie County, and Fryburg in Billings County. The crude oil from these locations is
transported via BNSF.

Impacts to Montana State Highways Due to Bakken Oil Development
9
Table 2-2: Rail transloading sites in North Dakota (Dakota Plains Holdings Inc. 2012).
Location Company Capacity (bpd)
Storage (bpd)
Pipeline Connection
Trenton Savage 90,000 300,000 Tesoro-Anacortes Dore Musket Corp. 70,000 90,000 Banner Pipeline Epping Rangeland COLT 80,000 600,000 Texon-East Coast Tioga Hess 70,000 180,000 Oil in via Gathering Fryburg Great Northern 70,000 300,000 Bakken Link Pipeline Note: bpd means barrels per day.
Pipeline transloading facilities 2.5.
Enbridge operates North Dakota Systems starting from Plentywood, MT, to Clearbrook, MN.
The pipeline network is shown in Figure 2-5.
Figure 2-5: Interactive map of the Enbridge pipelines (Enbridge Inc. 2011).
Bridger Pipeline LLC owns and operates the Poplar System in eastern Montana (Figure 2-6). The
Poplar system uses 10-inch and 12-inch lines for crude oil from the Williston Basin south to
Baker, MT. The receipt points are Poplar in Roosevelt County, Fisher and Richey in Richland
County, and Glendive in Dawson County. The stations have a capacity of 42,000 barrels per day
(bpd) (Bridger Pipeline LLC 2011).

Impacts to Montana State Highways Due to Bakken Oil Development
10
Figure 2-6: Poplar system in Montana (Bridger Pipeline LLC 2011).
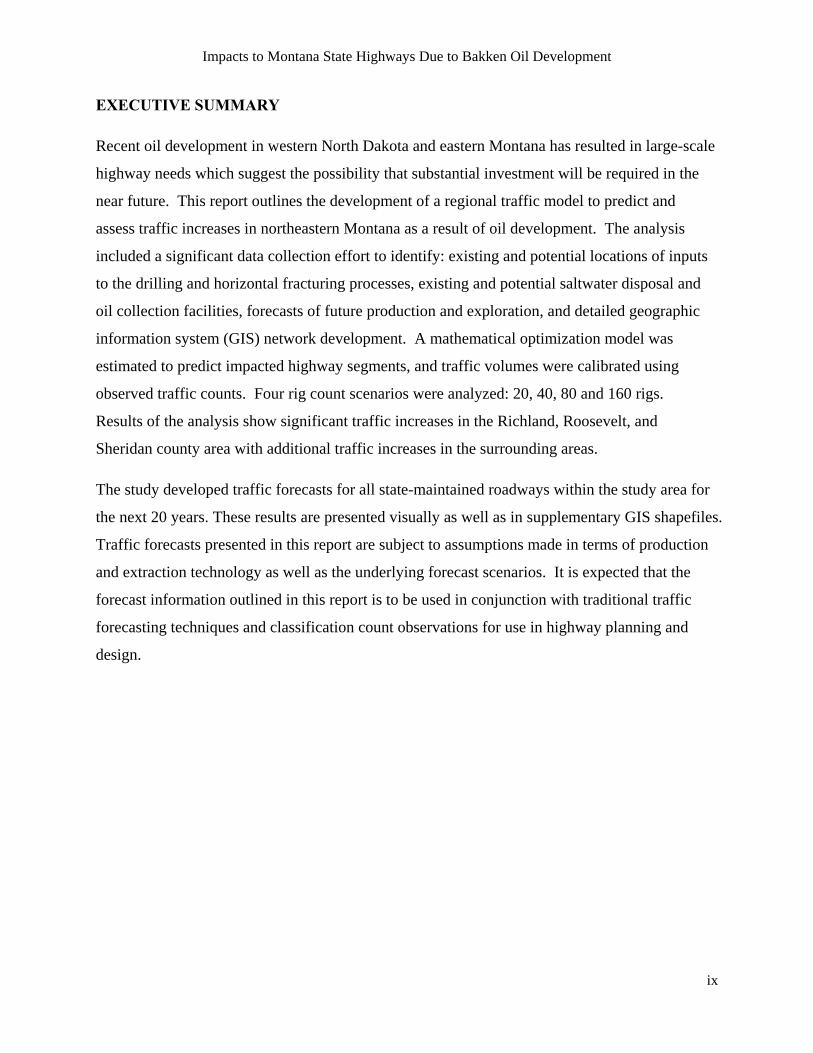
Seven pipeline transloading locations are in Montana and 15 locations are within the study area
in North Dakota (Figure 2-7).
Impacts to Montana State Highways Due to Bakken Oil Development
11
Figure 2-7: Pipeline transloading facilities.
Oil towns 2.6.
Supplies and materials originate in larger towns and cities including Williston, ND, and Glendive
and Sidney, MT. Though the city of Williston is located in North Dakota, there are no cross-
border restrictions on material movements. Cities with populations greater than 4,000 are utilized
as supply points in this study (Figure 2-8). In 2010, the populations of the three cities in the study
region as reported by the US Census Bureau were:
Sydney, MT : 5,191 Glendive, MT : 4,935 Williston, ND : 14,716

Impacts to Montana State Highways Due to Bakken Oil Development
12
Figure 2-8: Oil Towns as supply locations in Montana and North Dakota.
Sand 2.7.
BNSF Railway and U.S. Silica plan to supply frac sand on 100-car BNSF trains moving from a
sand mine in Ottawa, IL, and a new facility in Rochelle, IL, in 2013 (Progressive Railroading
2012). Frac sand also will be supplied by Chippewa Sands in Chippewa Falls, WI, and Superior
Silica Sands near New Auburn, WI, using the BNSF Railway to transport the sand to the Bakken
formation (MineralWeb 2011). In addition, ceramic proppant and frac sand from China is
currently being transported to the Bakken production region via rail. (Heartland Institute 2012)
Canadian Pacific (CP) Railway is expected to transport dry sands supplied by U.S. Silica
Holdings Inc. to the region from Sparta, WI, beginning in 2013 (Reuters 2012). Canadian
Pacific Railway is expanding the capacity of its terminals in New Town and Portal, ND, while
BNSF Railway operates North Dakota terminals in Minot, Stampede, Donnybrook, Ross, Zap
and Dore, and a terminal in Sidney, MT (Schramm 2011).
Impacts to Montana State Highways Due to Bakken Oil Development
13
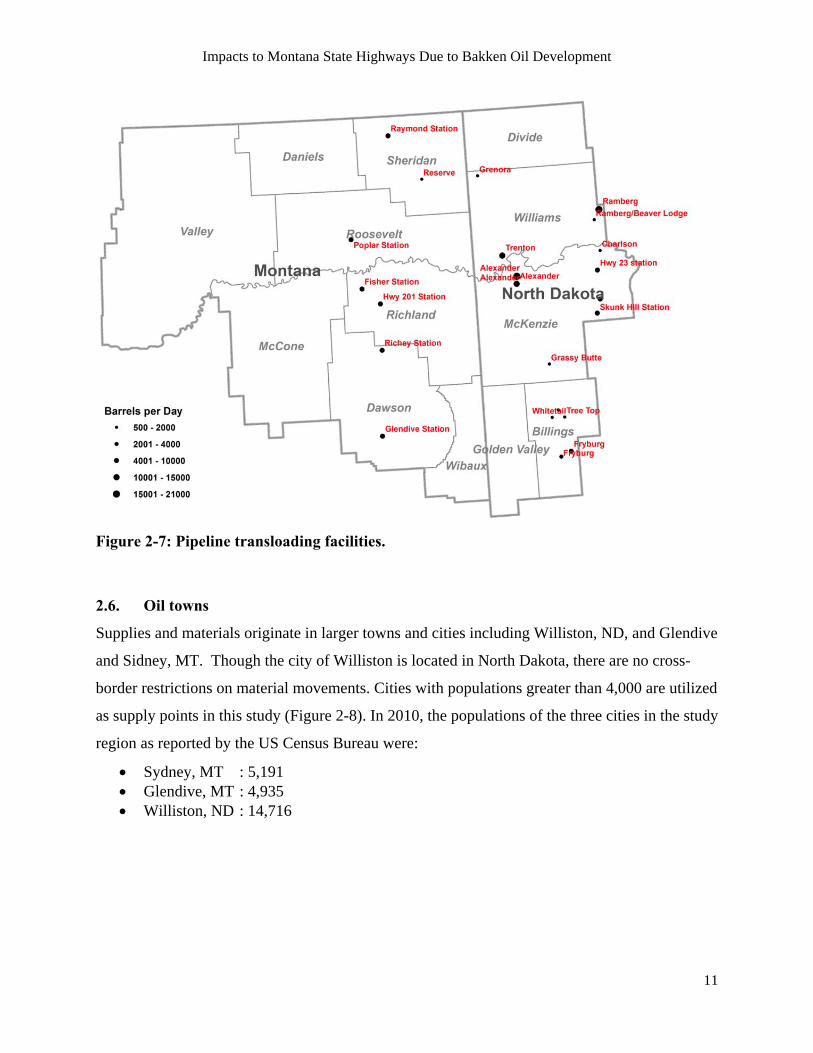
This study uses four rail terminal locations for sand supply sources: Culbertson, Glendive and
Sidney in Montana, and Williston in North Dakota as shown in Figure 2-9.
Figure 2-9: Frac sand rail supply locations.

Impacts to Montana State Highways Due to Bakken Oil Development
14
Gravel/scoria 2.8.
Gravel is a major trip generator for the construction of access roads and drilling pads. Scoria
locations were provided by the Montana Department of Environmental Quality (DEQ) for the
study. In the provided data, the study includes 113 active, private gravel locations (Figure 2-10).
A database of gravel and scoria sites is not maintained for the state of North Dakota. Cross
border movements of gravel and scoria from Montana to North Dakota are likely, but due to data
limitations, could not be quantified in this analysis.
Figure 2-10: Gravel/scoria geographical locations in Montana.

Impacts to Montana State Highways Due to Bakken Oil Development
15
SYNTHESIZE FORECASTS OF OIL DEVELOPMENT 3.
A key driver of truck trip generation is the process of drilling and hydraulically fracturing a well.
The number of new wells and duration of oil exploration must be estimated for placement of
future wells. The North Dakota Oil and Gas Division produces rig forecasts and estimates the
total number of wells by county during a 30-year time period. Forecast data by county was
obtained for North Dakota development.
Acquisition of similar data from the Montana Oil and Gas Board (OGB) was attempted, but
similar forecasts are not produced by the OGB. An interview with the OGB indicated that future
development will occur in Richland, Roosevelt, and Sheridan counties. Recent historical rig
counts have fluctuated between 10 and 17 rigs, with 20 expected in the near future. During a
May 31, 2012, meeting with MDT, it was decided that scenarios of oil development using 20, 40,
80 and 160 rigs as the break points would be constructed. This will allow MDT to select the
appropriate scenario based upon observed development and to model future impact.

Impacts to Montana State Highways Due to Bakken Oil Development
16
DEVELOP A DETAILED GIS NETWORK OF STATE HIGHWAYS 4.
Road networks 4.1.
Road networks were provided by MDT for northeast Montana. Oil activities in this area are
closely related to the oil activities in northwest North Dakota because they are encompassed in
the same oil seismic region. Therefore the network was expanded to include the road networks
from North Dakota provided by the North Dakota GIS Hub portal so that extended road
networks could be used for this comprehensive study (North Dakota GIS 2012). Thirteen
counties were considered for the study: eight in Montana and five border counties in North
Dakota (Figure 4-1).
Figure 4-1: Oil Counties in Montana and North Dakota.

Impacts to Montana State Highways Due to Bakken Oil Development
17
Montana and North Dakota maintain road inventories using different methods such as functional
classification and linear referencing system measures (kilometers in Montana and miles in North
Dakota) (see Figure 4-2). This study converts segment length to miles and travel speed to miles
per hour (mph) in order to calculate travel time on a consistent basis from state to state.

Impacts to Montana State Highways Due to Bakken Oil Development
18
(a) Interstate and Non-Interstate Highways and Primary Roads in Montana
(b) Interstate, U.S. and State Highways in North Dakota
Figure 4-2: Roads in Montana and North Dakota Showing Different Classifications.

Impacts to Montana State Highways Due to Bakken Oil Development
19
Border crossings 4.2.
For the border crossing between Montana and North Dakota, the two road network data sets were
merged into one. Because of differences in data sources, manual connection of Montana and
North Dakota roads was required to ensure cross-border connectivity. To connect the border
crossing points, the segments in the North Dakota road network were elongated or shortened. In
other words, the Montana road segments are considered as base information to extend the oil
study into North Dakota. In addition, the overlapped segments between Montana and North
Dakota were removed from the North Dakota shapefile. The connecting points are based on
TIGER® national road network 2011, which contains nationwide comprehensive road networks
for the U.S. Census Bureau and provides connectivity between states.
For quality assurance purposes, dummy locations near the state border were generated: 30
origins in Montana and 36 destinations in North Dakota (Figure 4-3a). Using the Network
Analyst tool in ArcMap 10.0, each origin point in Montana was connected to the three closest
destinations in North Dakota. All shortest routes found were reasonable and appropriate within
30 miles for further analysis (Figure 4-3b).

Impacts to Montana State Highways Due to Bakken Oil Development
20
Figure 4-3: Quality assurance for connectivity through border crossings.
(a) Three shortest paths from each origin
(b) Enlarged inspection for verification of appropriate routing

Impacts to Montana State Highways Due to Bakken Oil Development
21
INTERSECTIONS AND JUNCTIONS 5.
Connectivity between road segments to connect facilities and economic activity locations are
essential for network analysis. For the multi-state analysis, the border crossing points between
the states were manually connected. In addition, connectivity between multiple road
classifications was ensured by creating new vertices as connecting points and removing
unnecessary connections. The check points of the process:
Confirm that routes follow logical paths based on the roads considered.
Confirm that the connectivity observed conforms to expected criteria as assigned while
building the network data set from existing roads.
Determine that the closest facility is indeed the closest facility by a visual comparison of
length of routes considered.
Visual referencing is conducted to crosscheck the existence of actual connections in the
network in order to verify the routes created.
Attribute settings 5.1.
The model finds the fastest paths from origin to destination. Travel time was calculated for each
segment with travel time as a function of travel speed and length of a segment, travel time = f
(travel speed, distance).
5.1.1. Segment length
For the network analysis, the length of the segments and speed through the segments were used
to calculate travel time for use as route impedance for this study. The road networks provided by
MDT do not contain the true lengths of the road links. To quantify the discrepancy, the lengths
of the segments in Montana and North Dakota were generated by using the embedded geometric
calculator in ESRI ArcMap®. Following segment length estimation, comparison of the total
length of all segments in the provided network and estimated lengths resulted in minimal error.
5.1.2. Travel speed through networks
General speed limit in Montana was obtained from the MDT website (Montana Department of
Transportation 2010). To calibrate the speed information, speed data from the MDT highway
economic model was used, where available. It was assumed that the speed limit was

Impacts to Montana State Highways Due to Bakken Oil Development
22
representative of the actual travel speed on on-system highways. The highway economic model
data set was limited to the on-system routes and included the national highway system, all
primary routes and some secondary routes (Figure 5-1). The missing speed information of the
other off-system links was assumed.
Figure 5-1: Travel speed through Highway Performance Maintenance Systems (HPMS) in Montana.
The assumed speed limits for other county and city road speed are shown in Table 5-1. As the
table outlines, roadway speed limits vary by number of lanes, whether the highway is divided,
jurisdiction, and surface type. Not all of these types of roadways are included in the analysis, but
the decision rules were designed to consider every possible roadway combination.

Impacts to Montana State Highways Due to Bakken Oil Development
23
Table 5-1: Estimation of the traveling speed of trucks during a daytime in Montana (miles per hour).
Number of Lanes
1 2 2 2 3 3 4 4
Divided no no no yes no yes no YesType One way no no yes no no no no No Local bladed 35 35 35 35 35 35 35 35 Local graded 35 35 35 35 35 35 35 35 Local gravel 35 35 35 35 35 35 35 35 Local paved 45 45 45 45 45 45 45 45 Ramp paved 35 35 35 35 35 35 35 35 Secondary gravel 50 50 50 50 50 50 50 50 Secondary paved 50 50 50 50 50 50 50 50
Sample routing verification 5.2.
For the purpose of network and routing verification, seven random incidents (origins) in
Montana and a single destination (Williston, ND), were located. The shortest paths were based
on the shortest distance for verification purposes. Each segment was connected from any vertex
to any other segments having connectivity to generate paths.
A total of 533 townships were used in this study. The centroid of each township was connected
to the road network to ensure connectivity suitable for routing purposes (Figure 5-2). This
process requires specification of the search tolerance for ArcMap© to connect the centroid to the
road network. The greatest distance between township centroid and the road network was 9,753
meters (Figure 5-3), therefore the search tolerance was increased to 10,000 meters to ensure
maximum connectivity. All other townships were connected to the closest segment point, and the
increase in tolerance did not impact connectivity. Township centroids that were not connected
are shown in Figure 4-7b. “A” locations (township-range number T035NR038E) in Figure 5-2b
are candidate origins for oil production, while “B” locations may not be production centroids
because they are outside of the road network provided by MDT and the study area. In this case,
the “B” locations were removed.

Impacts to Montana State Highways Due to Bakken Oil Development
24
Figure 5-2: Locating township centroid to the road networks.
Figure 5-3: Unlocated centroid further than 5,000 meters from the closest road links.
A
B
9753 m 12928 m
11863 m
14356 m
A

Impacts to Montana State Highways Due to Bakken Oil Development
25
Next, Network Analyst was used to select the closest facility in North Dakota for all incidents in
Montana (i.e. township centroids). This process resulted in four different route categories as
shown in Figure 5-4.
Figure 5-4: Shortest paths from township centroid to the closet facilities in North Dakota.
Where potential connection errors were identified, manual visual verification of the errors was
conducted. Figure 5-5 provides an example of the identification of this type of error.

Impacts to Montana State Highways Due to Bakken Oil Development
26
Figure 5-5: Potential connection errors identified.
The incident connects to the facility via the closest road link. In this case, the road link is isolated
from the main road network. The model removed the isolated road segments and the centroid in
this study. The isolated segments resulted from the clipping process of the Montana road
network based on the county polygons. It is safe to remove the isolated segment and keep the
centroid in the study. Results are shown in Figure 5-6 after updating the road networks and the
township centroids.
Check Point

Impacts to Montana State Highways Due to Bakken Oil Development
27
Figure 5-6: Updated road networks and the output of the closest facility module without error messages.
Updated Area

Impacts to Montana State Highways Due to Bakken Oil Development
28
ESAL ESTIMATES 6.
Before estimating the traffic generated due to oil development, estimates of equivalent single
axle loads (ESALs) for individual truck types were compiled. The estimates presented below
were initially developed by the NDDOT, and are periodically updated to reflect changes in
technology and extraction practices.
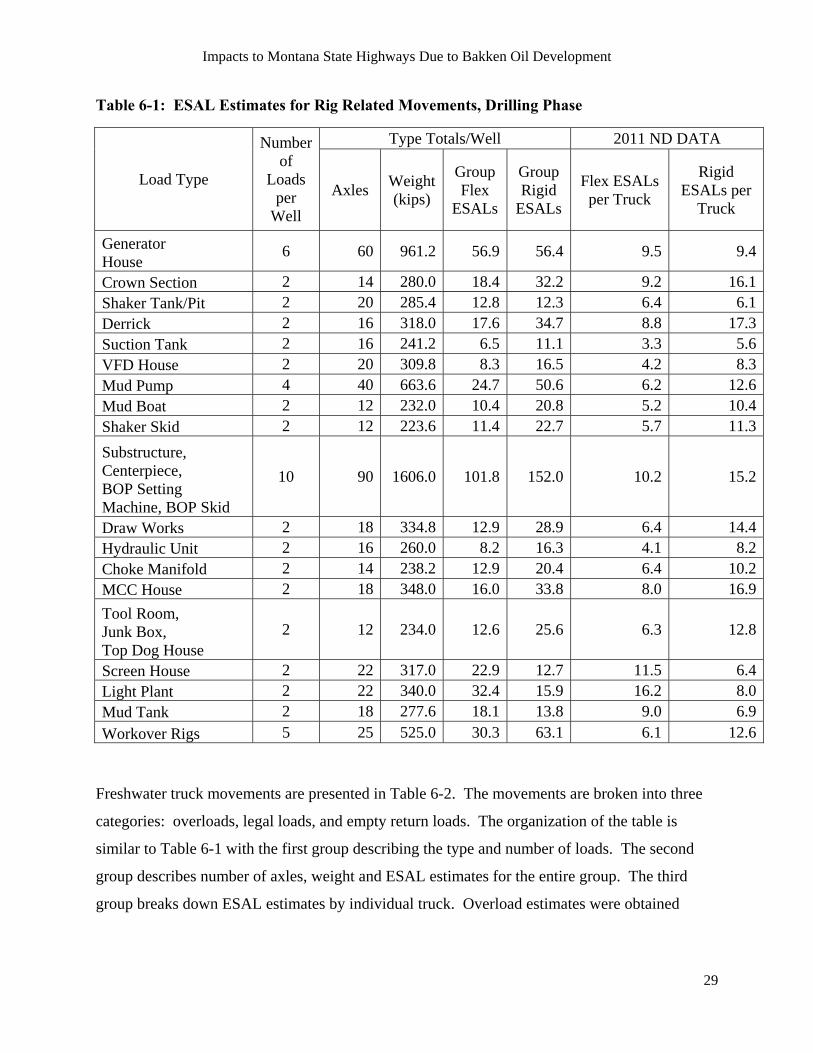
ESAL estimates for the heavy drilling related equipment are presented in Table 6-1. The first
column lists the equipment type by name, and the second column presents the total number of
loads for a typical well. The second group of columns under the heading “Type Totals/Well”
describes the number of axles, total weight and flexible and rigid ESALs for each group. The
final column group under the heading “2011 ND Data” present the estimated flexible and rigid
ESALs by individual truck type, which is used in the estimation process.
Note that for rig-related movements, all movements inbound and outbound are loaded and the
loaded ESAL estimates are used to represent the highway impacts of these movements. The
movements presented in Table 6-1 are generally indivisible, overweight or oversized loads which
require special permits to travel over the highway system.
Impacts to Montana State Highways Due to Bakken Oil Development
29
Table 6-1: ESAL Estimates for Rig Related Movements, Drilling Phase
Load Type
Number of
Loads per
Well
Type Totals/Well 2011 ND DATA
Axles Weight(kips)
GroupFlex
ESALs
GroupRigid
ESALs
Flex ESALs per Truck
Rigid ESALs per
Truck
Generator House
6 60 961.2 56.9 56.4 9.5 9.4
Crown Section 2 14 280.0 18.4 32.2 9.2 16.1Shaker Tank/Pit 2 20 285.4 12.8 12.3 6.4 6.1Derrick 2 16 318.0 17.6 34.7 8.8 17.3Suction Tank 2 16 241.2 6.5 11.1 3.3 5.6VFD House 2 20 309.8 8.3 16.5 4.2 8.3Mud Pump 4 40 663.6 24.7 50.6 6.2 12.6Mud Boat 2 12 232.0 10.4 20.8 5.2 10.4Shaker Skid 2 12 223.6 11.4 22.7 5.7 11.3
Substructure, Centerpiece, BOP Setting Machine, BOP Skid
10 90 1606.0 101.8 152.0 10.2 15.2
Draw Works 2 18 334.8 12.9 28.9 6.4 14.4Hydraulic Unit 2 16 260.0 8.2 16.3 4.1 8.2Choke Manifold 2 14 238.2 12.9 20.4 6.4 10.2MCC House 2 18 348.0 16.0 33.8 8.0 16.9
Tool Room, Junk Box, Top Dog House
2 12 234.0 12.6 25.6 6.3 12.8
Screen House 2 22 317.0 22.9 12.7 11.5 6.4Light Plant 2 22 340.0 32.4 15.9 16.2 8.0Mud Tank 2 18 277.6 18.1 13.8 9.0 6.9
Workover Rigs 5 25 525.0 30.3 63.1 6.1 12.6
Freshwater truck movements are presented in Table 6-2. The movements are broken into three
categories: overloads, legal loads, and empty return loads. The organization of the table is
similar to Table 6-1 with the first group describing the type and number of loads. The second
group describes number of axles, weight and ESAL estimates for the entire group. The third
group breaks down ESAL estimates by individual truck. Overload estimates were obtained

Impacts to Montana State Highways Due to Bakken Oil Development
30
through discussions with NDDOT, North Dakota Highway Patrol and MDT. It is estimated that
25% of freshwater loads are overloaded, with a magnitude of 10,000 lbs. overloaded.
Table 6-2: ESAL Estimates Freshwater Movements, Drilling Phase
Load Type
Number of
Loads per
Well
Type Totals/Well 2011 ND DATA
Axles Weight(kips)
GroupFlex
ESALs
GroupRigid
ESALs
Flex ESALs per Truck
Rigid ESALs per
Truck
Fresh Water Unpermitted Overloads (25% of Divisibles @ 90k - legal is 80k)
187 1496 16830.0 221.4 318.1 1.2 1.7
Fresh Water Legal Loads (76 kips) (75% of Divisibles)
562 4496 42712.0 361.9 530.5 0.6 0.9
Fresh Water Empty Return Loads (38 kips)
748 5984 28424.0 36.7 39.6 0.0 0.1
Sand truck movements are presented in Table 6-3. The movements are broken into three
categories: overloads, legal loads, and empty return loads. The organization of the table is
similar to Table 6-1 with the first group describing the type and number of loads. The second
group describes number of axles, weight and ESAL estimates for the entire group. The third
group breaks down ESAL estimates by individual truck. Overload estimates were obtained
through discussions with NDDOT, North Dakota Highway Patrol and MDT. It is estimated that
25% of sand loads are overloaded, with a magnitude of 10,000 lbs. overloaded.

Impacts to Montana State Highways Due to Bakken Oil Development
31
Table 6-3: ESAL Estimates Sand Movements, Drilling Phase
Load Type
Number of
Loads per
Well
Type Totals/Well 2011 ND DATA
Axles Weight(kips)
GroupFlex
ESALs
Group Rigid
ESALs
Flex ESALs per Truck
Rigid ESALs per
Truck
Sand Unpermitted Overloads (25% of Divisibles @ 90k - legal is 80k)
93 465 8370.0 351.4 595.3 3.8 6.4
Sand Legal Loads (76 kips) (75% of Divisibles)
281 1405 21356.0 628.6 1102.1 2.2 3.9
Sand Empty Return Loads (38 kips)
374 1870 14212.0 53.9 65.1 0.1 0.2

Impacts to Montana State Highways Due to Bakken Oil Development
32
ANALYSIS OF EXISTING TRAFFIC DATA 7.
This section provides an overview of the analysis of 2011 traffic data provide by MDT. At the
outset of this study, the most recent, complete traffic data available was the 2011 traffic
classification counts, and the analysis presented reflects actual observed traffic conditions. The
traffic counts data provides important statistics about average annual daily traffic (AADT). A
statistical analysis of this data was performed to gain insights about the traffic patterns on major
highways and other roads.
Distribution of AADT on major highways: 7.1.
The AADT distribution for the truck traffic was studied in detail for highways 2, 5, 16, 200 and
I-94. Figure 7-1 shows the average annual trucks per day (Truck AADT) on US Highway 2. It
shows three different traffic zones. There are higher truck traffic volumes near the North Dakota
border. Figure 7-2 explains this change with respect to the mile points. Near the North Dakota
border, after mile point 647, there is higher truck AADT. In addition, the data shows increases
in traffic near Glasgow, MT in Valley County, which are outside the primary oil development
area.
Figure 7-1: Average annual trucks per day: U.S. Highway 2.

Impacts to Montana State Highways Due to Bakken Oil Development
33
Figure 7-2: Truck AADT vs. milepoints: U.S. Highway 2.
Figure 7-3 shows distribution of truck AADT on Montana Highway 5. This highway also has
higher levels of traffic near North Dakota border. Though Figure 7-4 shows there are some peaks,
the average truck traffic on this highway is less. Montana highway 5 has two corridors. In the
corridor near North Dakota border it shows high levels of truck traffic as depicted in Figure 7-3
and Figure 7-4.
0
100
200
300
400
500
600
700
505+0.533
512+0.975
521+0.413
540+0.409
540+0.409
541+0.586
541+0.940
542+0.231
543+0.798
555+0.341
555+0.341
555+0.902
557+0.638
562+0.744
571+0.757
579+0.040
588+0.339
589+0.332
590+0.366
590+0.895
594+0.690
597+0.222
610+0.781
610+0.781
612+0.087
614+0.041
626+0.124
635+0.048
635+0.048
644+0.554
647+0.272
C000001E
Truck AADDT
Corridor and Mile Points (US 2 West to East)
Glasgow (MP 541)
Culbertson (MP 640)

Impacts to Montana State Highways Due to Bakken Oil Development
34
Figure 7-3: Average annual trucks per day: Montana Highway 5
Figure 7-4: Truck AADT vs. mile points: Montana Highway 5
0
20
40
60
80
100
120
140
160
180
000+0.000
000+0.000
000+0.277
006+0.586
011+0.432
011+0.432
011+0.432
011+0.432
011+0.432
011+0.432
022+0.310
022+0.310
022+0.310
030+0.309
030+0.309
038+0.521
038+0.521
038+0.521
000+0.000
007+0.103
023+0.787
023+0.787
023+0.787
C000022E C000030E
Truck AADT
Corridor and Mile Point (MT 5 West to East)
Plentywood (MP 38)

Impacts to Montana State Highways Due to Bakken Oil Development
35
The truck AADT for Montana Highway 16 is depicted in Figure 7-5. It also distinct traffic levels
over different segments of the route, primarily changing at intersections with other major routes.
Montana Highway 16 shows the lowest traffic levels in the north and increases gradually to the
south with highest traffic levels between Sidney and Glendive. Figure 7-6 shows similar
characteristics, with more traffic near the start of the mile points and less traffic at the end near
the Canadian border.
Figure 7-5: Average annual trucks per day: Montana Highway 16

Impacts to Montana State Highways Due to Bakken Oil Development
36
Figure 7-6: Truck AADT vs. mile points: Montana Highway 16
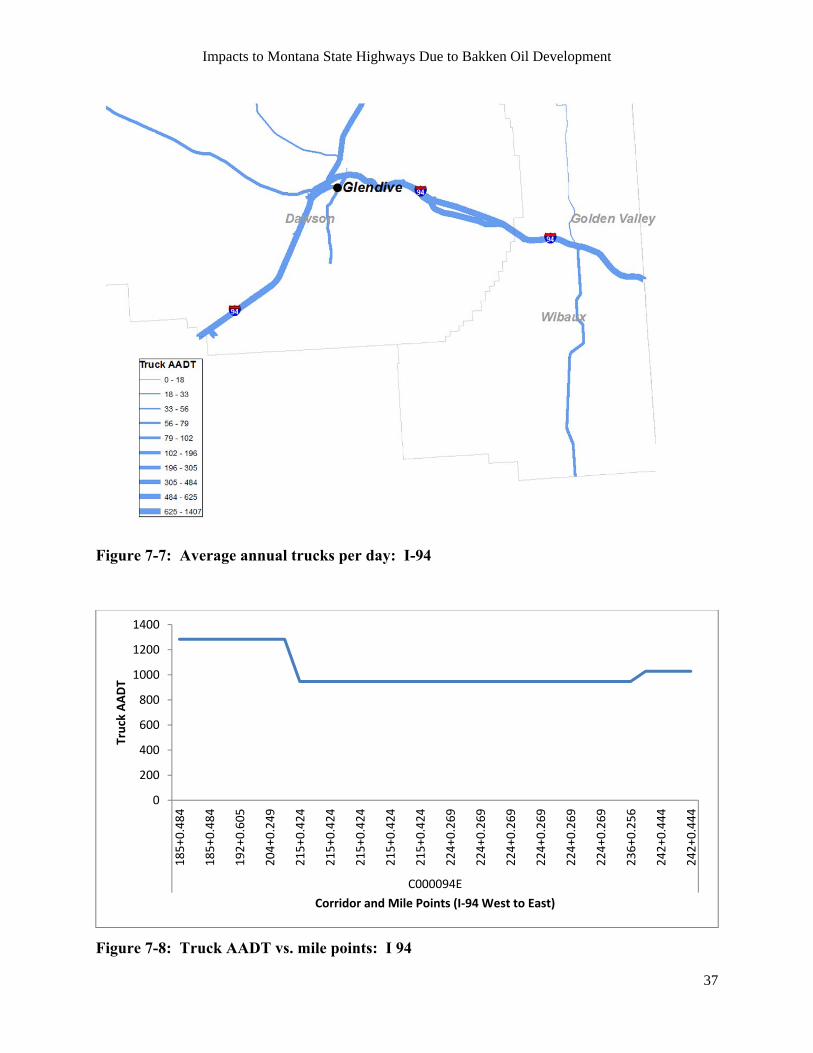
Figure 7-7 shows truck AADT on I-94. There is consistent truck traffic on I-94 over the
milepoint range. Figure 7-8 supports this observation. It shows a flat trend of truck traffic
without any major peaks or valleys.
0
200
400
600
800
1000
1200
1400
012+0.261
007+0.220
041+0.162
042+0.414
063+0.810
063+0.810
075+0.705
083+0.877
000+0.326
002+0.558
010+0.347
018+0.735
031+0.731
035+0.901
036+0.659
052+0.437
050+0.013
028+0.944
028+0.944
017+0.080
008+0.129
003+0.716
000+0.596
C000034N C000022E C000062S C000020N
Truck AADT
Corridor and Mile Point ( MT 16 North To South)
Sidney (MP 37)
Impacts to Montana State Highways Due to Bakken Oil Development
37
Figure 7-7: Average annual trucks per day: I-94
Figure 7-8: Truck AADT vs. mile points: I 94
0
200
400
600
800
1000
1200
1400
185+0.484
185+0.484
192+0.605
204+0.249
215+0.424
215+0.424
215+0.424
215+0.424
215+0.424
224+0.269
224+0.269
224+0.269
224+0.269
224+0.269
224+0.269
236+0.256
242+0.444
242+0.444
C000094E
Truck AADT
Corridor and Mile Points (I‐94 West to East)

Impacts to Montana State Highways Due to Bakken Oil Development
38
Truck AADT on Montana Highway 200 is shown in Figure 7-9. Truck traffic on Montana
Highway 200 shows a distinctive trend. It shows high levels of truck traffic from near the North
Dakota border to Sidney, MT. West of Sidney the traffic level decreases dramatically. A similar
trend can be seen in Figure 7-10. It shows lower traffic levels near the western part of the study
region (first two corridors) and higher traffic levels near Sidney (Corridor C000020N).
Figure 7-9: Average annual trucks per day: Montana Highway 200

Impacts to Montana State Highways Due to Bakken Oil Development
39
Figure 7-10: Truck AADT vs. mile points: Montana Highway 200
0
200
400
600
800
1000
1200
248+0.594
259+0.559
259+0.559
275+0.169
277+0.912
279+0.570
279+0.834
280+0.786
296+0.810
296+0.810
322+0.695
000+0.000
016+0.784
027+0.253
027+0.799
043+0.248
043+0.248
057+0.418
000+0.000
053+0.214
062+0.535
063+0.177
063+0.737
C000057E C000051E C000020N
Truck AADT
Corridor and Mile Points (MT 200 West to East)
Sidney (MP 57)

Impacts to Montana State Highways Due to Bakken Oil Development
40
TRAFFIC MODELING 8.
The traffic routing procedure generates the origin-destination (OD) matrix for all feasible routes
from origins to destinations for oil transportation activities (see Figure 8-1). The OD matrices for
all pairs of oil transportation activities include sources of sand, gravel, fresh water, and supplies
as origins for supporting drilling activities and drilling sites as destinations. Saltwater is
transported from drilling sites to saltwater disposal sites (SWD) as byproducts. Following
drilling site completion, outbound oil is transported to rail or pipeline transloading sites.
Figure 8-1: Oil-related transportation activities
The OD matrices were generated based on the Dijkstra’s shortest path algorithm embedded in
ArcMap® Ver. 10.0’s specialized module of Network Analyst®. The module requires
impedance information such as cost, distance, or time. This study used travel time to minimize
the impedance. These low-impedance routes are called the fastest paths in this study.
In the process of generating OD matrices, the capacity of the locations and links were not
considered. The constraint of capacity is considered in the optimization process, which finds the
optimal routes among all the feasible routes in the OD matrices in light of system optimization.
Sand Gravel Fresh Water Supplies
Oil Drilling
Rail Transloading Pipe Transloading Saltwater Disposal
Origin
Destination Origin
Destination
Oil Producing

Impacts to Montana State Highways Due to Bakken Oil Development
41
ROUTE ASSIGNMENT/DISTRIBUTION MODEL 9.
Assignment of routes for individual truck movements was done through a constrained
optimization model. Each township has multiple origins from which inputs could be sourced, yet
only one was chosen. Assignment of origin-destination pairs assumes that the source movement
is an all-or-nothing assignment, as the route costs of alternative sources remain the same for all
truck trips (Dybing 2012).
The objective of the oil development distribution model was to minimize the total cost of moving
six inputs and two outputs from input origins and output destinations (Equation 1), subject to the
following constraints: the demands at the township well sites (Equation 2), the supply capacities
at input origin locations (Equation 3), handling capacities at destination locations (Equation 4),
and the number of trucks on a route must be greater than or equal to zero. The model was
estimated 21 times to optimize distribution from years 2011 through 2032.
∑ ∑ ∑ ∗ ∑ ∑ ∑ ∗ Equation 1
∑ ∑ ∀ Equation 2 ∑ ∑ ∀ Equation 3
∑ ∑ ∀ Equation 4
, ,
Where: i=Index for input origin j=Index for township k=Index for freight class l=Index for outbound destination cijk=Cost of carrying freight k between i and j xijk=Truckloads of freight k between i and j cjlk=Cost of carrying freight k between j and l xjlk=Truckloads of freight k between j and l Djk=Demand at township j for freight k Sik=Supply at origin i for freight k Ulk=Capacity at destination l for freight k

Impacts to Montana State Highways Due to Bakken Oil Development
42
Route disaggregation and segment assignment 9.1.
The distribution model assigns truck movements to individual routes. An individual segment of
the state highway system may theoretically be included in each route that was chosen. For this
reason, the selected routes must be disaggregated to component highway segments in order to
assign the traffic flows to individual segments (Dybing 2012).

Impacts to Montana State Highways Due to Bakken Oil Development
43
RESULTS 10.
This section presents the results of the traffic model graphically via a series of traffic volume
maps. As described in Chapter 3, four scenarios were analyzed: 20, 40, 80 and 160 rigs to
account for the level of uncertainty surrounding oil development within the region. Included in
this section are the results for the 20 and 40 rig scenarios. Results of the 80 and 160 rig
analysis may be found in the appendix to this document. For each of the scenarios, results are
visualized by year from 2012-2016, and in five-year increments through the remainder of the
analysis period.

Impacts to Montana State Highways Due to Bakken Oil Development
44
Scenario: 20 Rigs 10.1.
Figure 10-1: Truck traffic in 2012 for the 20 rig scenario.

Impacts to Montana State Highways Due to Bakken Oil Development
45
Figure 10-2: Truck traffic in 2013 for the 20 rig scenario.

Impacts to Montana State Highways Due to Bakken Oil Development
46
Figure 10-3: Truck traffic in 2014 for the 20 rig scenario.

Impacts to Montana State Highways Due to Bakken Oil Development
47
Figure 10-4: Truck traffic in 2015 for the 20 rig scenario.

Impacts to Montana State Highways Due to Bakken Oil Development
48
Figure 10-5: Truck traffic in 2016 for the 20 rig scenario.

Impacts to Montana State Highways Due to Bakken Oil Development
49
Figure 10-6: Truck traffic in 2021 for the 20 rig scenario.
Impacts to Montana State Highways Due to Bakken Oil Development
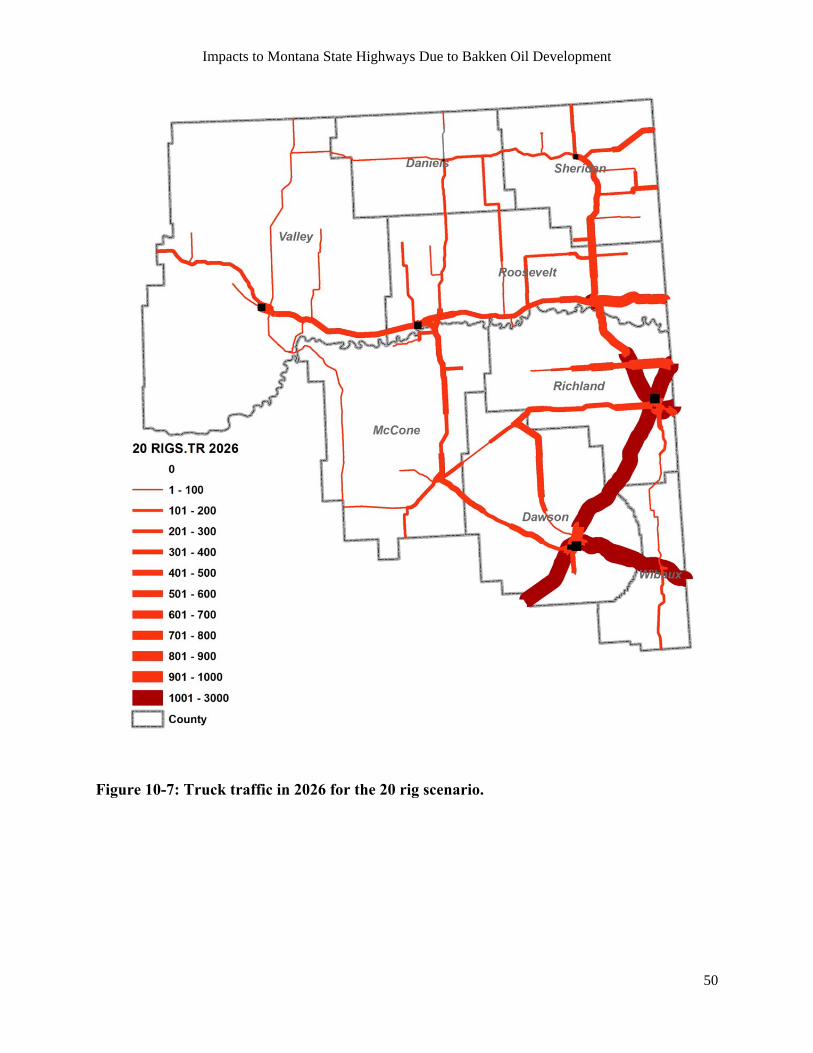
50
Figure 10-7: Truck traffic in 2026 for the 20 rig scenario.

Impacts to Montana State Highways Due to Bakken Oil Development
51
Figure 10-8: Truck traffic in 2031 for the 20 rig scenario.

Impacts to Montana State Highways Due to Bakken Oil Development
52
Scenario: 40 Rigs 10.2.
Figure 10-9: Truck traffic in 2012 for the 40 rig scenario.

Impacts to Montana State Highways Due to Bakken Oil Development
53
Figure 10-10: Truck traffic in 2013 for the 40 rig scenario.

Impacts to Montana State Highways Due to Bakken Oil Development
54
Figure 10-11: Truck traffic in 2014 for the 40 rig scenario.

Impacts to Montana State Highways Due to Bakken Oil Development
55
Figure 10-12: Truck traffic in 2015 for the 40 rig scenario.

Impacts to Montana State Highways Due to Bakken Oil Development
56
Figure 10-13: Truck traffic in 2016 for the 40 rig scenario.

Impacts to Montana State Highways Due to Bakken Oil Development
57
Figure 10-14: Truck traffic in 2021 for the 40 rig scenario.

Impacts to Montana State Highways Due to Bakken Oil Development
58
Figure 10-15: Truck traffic in 2026 for the 40 rig scenario.

Impacts to Montana State Highways Due to Bakken Oil Development
59
Figure 10-16: Truck traffic in 2031 for the 40 rig scenario.

Impacts to Montana State Highways Due to Bakken Oil Development
60
IMPLEMENTATION 11.
Chapter 10 provided an overview of the model results, with a focus on annual results for the first
five years of the analysis period, and traffic estimates at five year intervals for the remainder of
the analysis period. The primary deliverable from this study is a GIS shapefile and
corresponding traffic estimate files stored in dBase format. The combination of these files
allows for retrieval of traffic forecast estimates by individual subsegment by year. This chapter
provides information on the use of the deliverables as well as instructions for segment-specific
data retrieval.
The subsegment is a redefinition of segment length, delineated at the intersection of state
highways and county roads. This process creates smaller roadway segments to more accurately
assess the impact of trucks entering or departing a state highway because of highly localized oil
development. Since the subsegment does not possess all the attributes of the full segment, a
unique identifier is added to each subsegment for future use in connecting the dBase traffic
forecasts to the GIS shapefile.
Base GIS Shapefile 11.1.
The base GIS shapefile for use in the traffic analysis is discussed in Chapter 4. The attributes of
the data in the base shapefile are shown in Table 11-1. Each of these data elements are as
provided by MDT with the exception of SUBSEGID. As mentioned above, this variable
represents a unique identifier generated by UGPTI for use in future data merge activities.
The base shapefile delivered to MDT is titled “Montana_Roads_OilCounty_StateResponsible.”
This shapefile includes lines representing the highway network that the State of Montana is
responsible maintaining and improving as indicated by the STATE_RESP attribute in the
corresponding attribute file.

Impacts to Montana State Highways Due to Bakken Oil Development
61
Table 11-1: Data elements of MDT highway shapefile
Variable Name Meaning DEPT_ROUTE MDT Route Identifier CORRIDOR MDT Corridor Identifier ROUTE_NAME Route Name (where available) ROUTE_TYPE Road SYSTEM Route Classification (text) FC Route Classification (numeric) SURF_TYPE Surface Type SURF_WIDTH Surface Width LANES Number of Lanes DIVIDED If Highway = YES ONEWAY If One Way Highway = YES STATE_RESP If State Responsible = YES STATE_MAIN If State Maintained = YES MAINT_SEC Maintenance Jurisdiction RECON_ID MDT Internal Construction
Identifier IMPRV_ID MDT Internal Construction
Identifier IMPRV_YEAR MDT Internal Construction Year CITY City COUNTY County MILES_3D Miles SUBSEGID Unique Identifier Specified by
UGPTI
Traffic forecast dBase files 11.2.
The remaining deliverables are in the form of dBase files with filenames corresponding to the rig
scenarios outlined in Chapter 3. Specific filenames and scenarios are found in Table 11-2.
Table 11-2: dBase filename and corresponding scenario
Filename Scenario 20 Rigs.dbf 20 Rig Scenario 40 Rigs.dbf 40 Rig Scenario 80 Rigs.dbf 80 Rig Scenario
160 Rigs.dbf 160 Rig Scenario
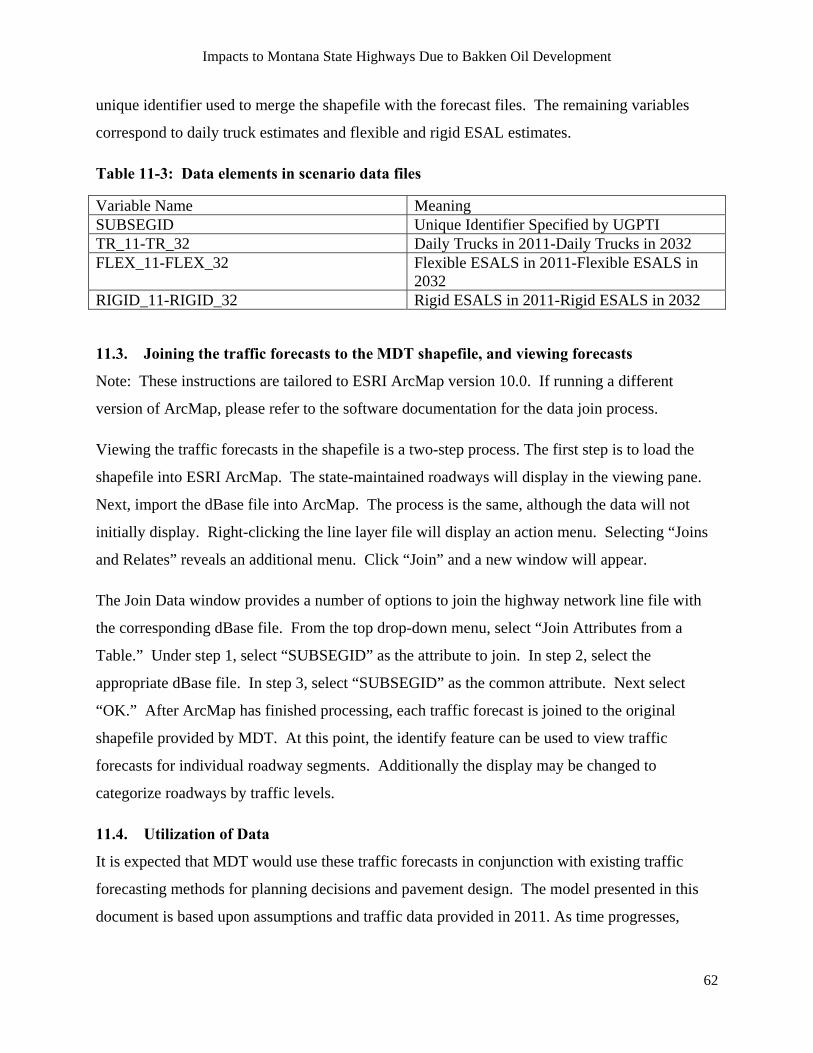
The data elements in each of these dBase files are shown in Table 11-3. The first variable is
SUBSEGID, which is common with the MDT shapefile definition above. This is the common
Impacts to Montana State Highways Due to Bakken Oil Development
62
unique identifier used to merge the shapefile with the forecast files. The remaining variables
correspond to daily truck estimates and flexible and rigid ESAL estimates.
Table 11-3: Data elements in scenario data files
Variable Name Meaning SUBSEGID Unique Identifier Specified by UGPTI TR_11-TR_32 Daily Trucks in 2011-Daily Trucks in 2032 FLEX_11-FLEX_32 Flexible ESALS in 2011-Flexible ESALS in
2032 RIGID_11-RIGID_32 Rigid ESALS in 2011-Rigid ESALS in 2032
Joining the traffic forecasts to the MDT shapefile, and viewing forecasts 11.3.
Note: These instructions are tailored to ESRI ArcMap version 10.0. If running a different
version of ArcMap, please refer to the software documentation for the data join process.
Viewing the traffic forecasts in the shapefile is a two-step process. The first step is to load the
shapefile into ESRI ArcMap. The state-maintained roadways will display in the viewing pane.
Next, import the dBase file into ArcMap. The process is the same, although the data will not
initially display. Right-clicking the line layer file will display an action menu. Selecting “Joins
and Relates” reveals an additional menu. Click “Join” and a new window will appear.
The Join Data window provides a number of options to join the highway network line file with
the corresponding dBase file. From the top drop-down menu, select “Join Attributes from a
Table.” Under step 1, select “SUBSEGID” as the attribute to join. In step 2, select the
appropriate dBase file. In step 3, select “SUBSEGID” as the common attribute. Next select
“OK.” After ArcMap has finished processing, each traffic forecast is joined to the original
shapefile provided by MDT. At this point, the identify feature can be used to view traffic
forecasts for individual roadway segments. Additionally the display may be changed to
categorize roadways by traffic levels.
Utilization of Data 11.4.
It is expected that MDT would use these traffic forecasts in conjunction with existing traffic
forecasting methods for planning decisions and pavement design. The model presented in this
document is based upon assumptions and traffic data provided in 2011. As time progresses,

Impacts to Montana State Highways Due to Bakken Oil Development
63
current traffic data should be considered when making comparisons between model results and
existing traffic forecasting methods.
Impacts to Montana State Highways Due to Bakken Oil Development
64
CONCLUSION 12.
Exploration of the Bakken formation has resulted in significant traffic increases on highways in
northeastern Montana, both as a result of exploration and production within the state, and from
spillover traffic from exploration and production activities in North Dakota. This study indicates
that the increased traffic levels will continue so long as drilling rig counts remain constant or
increase. The duration and scope of these activities is highly dependent on many exogenous
factors, so forecasts of development provided by the Montana Oil and Gas Board and the North
Dakota Oil and Gas Division of the Industrial Council are critical to the accuracy of traffic
forecasts presented in this document.
The underlying production and exploration forecasts predict significant activity in coming years,
with decreases in these activities toward the end of the analysis period. Because this study
explicitly considers origin-destination movements resulting from oil exploration activities such
as drilling and hydraulic fracturing as well as outbound saltwater and crude oil movements, it is
expected that the forecasts provided by this study will provide additional information which will
improve upon traditional traffic forecasting methods. For example, trendline forecasting is likely
to underestimate or, in certain cases, overestimate traffic increases, depending on the timing of
collected traffic observations.
As suggested earlier in this document, the traffic forecasts resulting from this study should be
used in conjunction with traditional traffic forecasting methods, and validated against observed
traffic classification counts in the future. In addition, continued monitoring of oil exploration
and development forecasts from the Montana and North Dakota regulatory bodies is necessary to
assess the validity of the underlying assumptions of this study and the potential need to modify
the forecasts based upon fundamental changes in production and exploration.

Impacts to Montana State Highways Due to Bakken Oil Development
65
REFERENCES
Bridger Pipeline LLC. Poplar Pipeline System. 2011. http://www.truecos.com/bridger/ (accessed June 12, 2012).
Dakota Plains Holdings Inc. Investment Presentations: Northland Securities. May 3, 2012. http://www.dakotaplains.com/docs/Dakota-Plains-Northland-Securities-05-02-12.pdf (accessed July 7, 2012).
Dybing, Alan. "Estimation of the Increased Traffic on Highways in Montana and North Dakota Due to Oil Development and Extraction ." PhD Dissertation, Fargo, ND, 2012.
Enbridge Inc. Liquid Pipelines. 2011. http://www.enbridge.com/DeliveringEnergy/OurPipelines/LiquidsPipelines.aspx (accessed June 12, 2012).
Halvorson, Jim. Interview by Alan Dybing. Telephone Interview. May 10, 2012.
Heartland Institute. Research & Commentary: Silica (Frac) Sand Mining. October 9, 2012. http://heartland.org/policy-documents/research-commentary-silica-frac-sand-mining (accessed January 8, 2013).
MineralWeb. Frac Sand Plant Going Up in Chippewa County, WI. July 24, 2011. http://www.mineralweb.com/2011/07/news/frack-sand-plant-going-up-in-chippewa-county-wi/ (accessed July 5, 2012).
Montana Department of Natural Resources and Conservation (a). Water Rights Query System. April 2012. http://nris.mt.gov/dnrc/waterrights/default.aspx (accessed June 5, 2012).
Montana Department of Natural Resources and Conservation (b). Water Rights in Montana. 2012. http://leg.mt.gov/content/Publications/Environmental/2012-water-rights-handbook.pdf (accessed June 10, 2012).
Montana Department of Transportation. 2006 Montana Commercial Vehicle Size and Weight and Safety Trucker's Handbook. Helena, MT: Montana Department of Transportation Motor Carrier Services Division, 2010.
Montana Groundwater Information Center. Groundwater Information Center Water Location
Database. 2012.
Montana Legislature. Montana code annotated 2011: Title 85 - Water Use. Laws of Montana, Legislative Services Division, Legislative Council, Helena, MT: Montana Legislative Services Division, 2011.
North Dakota Department of Mineral Resources. Oil and Gas: ArcIMS Viewer. April 2012. http://bogc.dnrc.mt.gov/gisdata/ (accessed May 27, 2012).

Impacts to Montana State Highways Due to Bakken Oil Development
66
North Dakota GIS. North Dakota GIS Hub Data Portal. February 2012. ttp://web.apps.state.nd.us/hubdataportal/srv/en/main.home (accessed May 25, 2012).
Pioneer Oil, LLC. Transloading. 2011. http://www.pioneeroil-co.com/transloading.aspx (accessed June 2012).
Procore Group Inc. Locations. June 2002. http://www.procoregroup.com/about/locations.cfm (accessed June 2002).
Progressive Railroading. BNSF to build sand storage facility with U.S. Silica in Eagle Ford Shale, serve expanded Musket crude-by-rail facility in Bakken Shale. June 18, 2012. http://www.progressiverailroading.com/class_is/news/BNSF-to-build-sand-storage-facility-with-US-Silica-in-Eagle-Ford-Shale-serve-expanded-Musket-crudebyrail-facility-in-Bakken-Shale--31368# (accessed July 05, 2012).
Reuters. Update 2-COP rail to ship drilling sand for U.S. Silica. June 12, 2012. http://www.reuters.com/article/2012/06/22/canadianpacific-fracsand-ussilica-idUSL3E8HM46Q20120622 (accessed July 5, 2012).
Schramm, Jill. "The Bakken boom: Rail terminal construction picking up speed." Minot Daily News, October 8, 2011.
U.S. Census Bureau. 2011 TIGER/Line Shapefiles. January 1, 2011. http://www.census.gov/geo/www/tiger/tgrshp2011/tgrshp2011.html (accessed May 23, 2012).
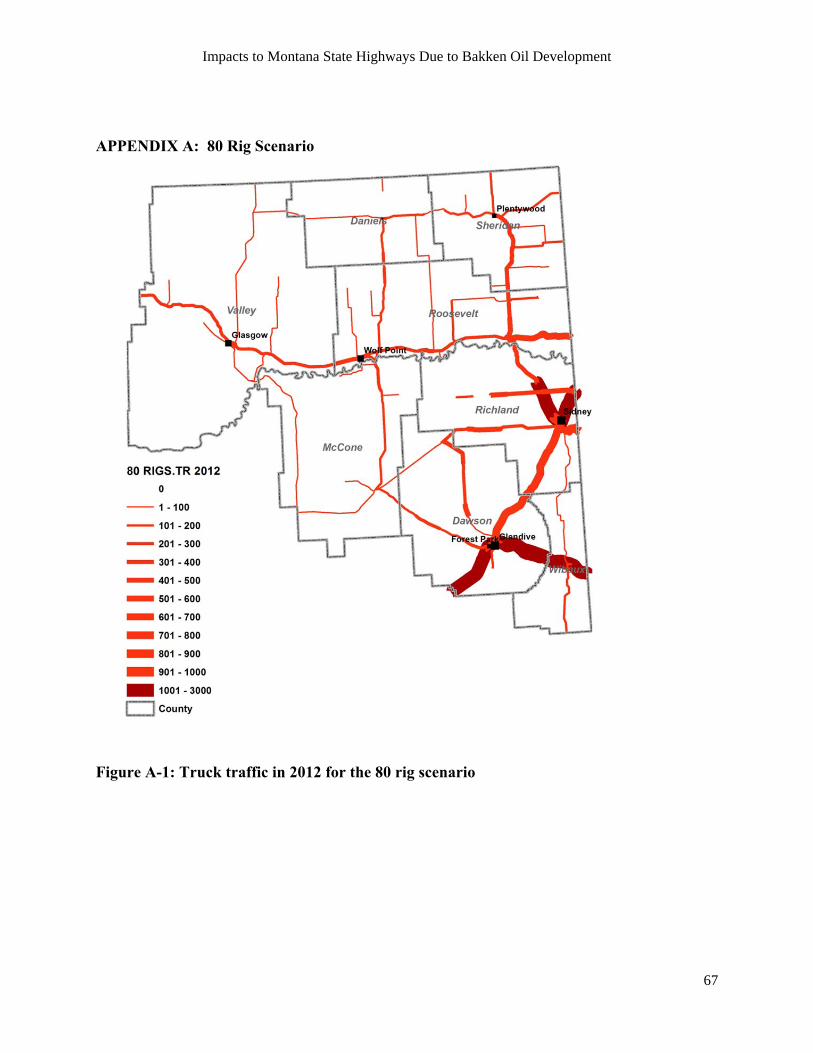
Impacts to Montana State Highways Due to Bakken Oil Development
67
APPENDIX A: 80 Rig Scenario
Figure A-1: Truck traffic in 2012 for the 80 rig scenario

Impacts to Montana State Highways Due to Bakken Oil Development
68
Figure A-2: Truck traffic in 2013 for the 80 rig scenario.

Impacts to Montana State Highways Due to Bakken Oil Development
69
Figure A-3: Truck traffic in 2014 for the 80 rig scenario.
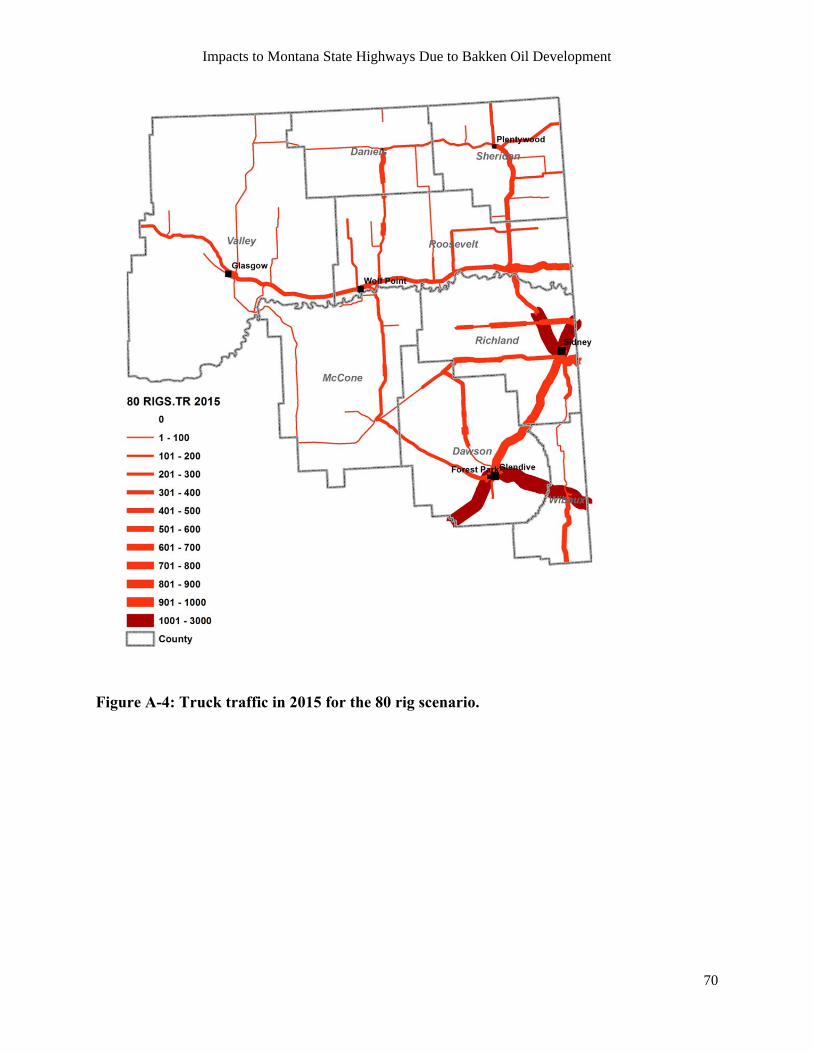
Impacts to Montana State Highways Due to Bakken Oil Development
70
Figure A-4: Truck traffic in 2015 for the 80 rig scenario.

Impacts to Montana State Highways Due to Bakken Oil Development
71
Figure A-5: Truck traffic in 2016 for the 80 rig scenario.

Impacts to Montana State Highways Due to Bakken Oil Development
72
Figure A-6: Truck traffic in 2021 for the 80 rig scenario.

Impacts to Montana State Highways Due to Bakken Oil Development
73
Figure A-7: Truck traffic in 2026 for the 80 rig scenario.

Impacts to Montana State Highways Due to Bakken Oil Development
74
Figure A-8: Truck traffic in 2031 for the 80 rig scenario.

Impacts to Montana State Highways Due to Bakken Oil Development
75
APPENDIX B: 160 Rig Scenario
Figure B-1: Truck traffic in 2012 for the 160 rig scenario

Impacts to Montana State Highways Due to Bakken Oil Development
76
Figure B-2: Truck traffic in 2013 for the 160 rig scenario.

Impacts to Montana State Highways Due to Bakken Oil Development
77
Figure B-3: Truck traffic in 2014 for the 160 rig scenario.
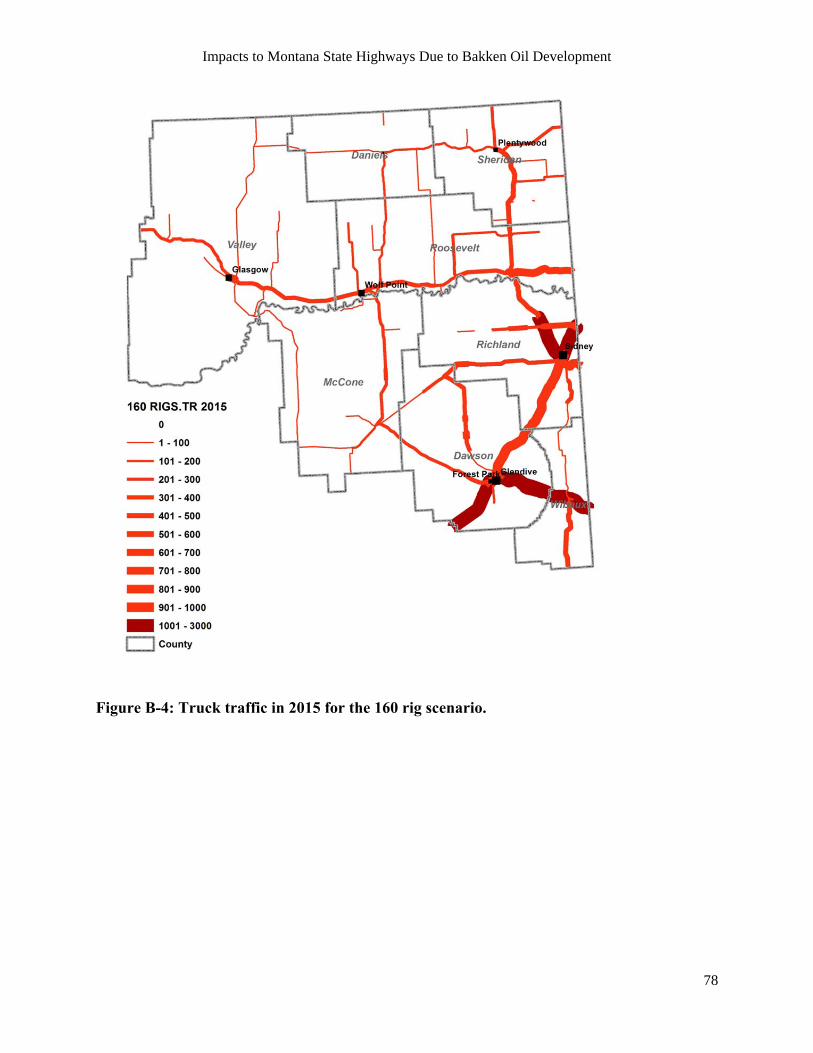
Impacts to Montana State Highways Due to Bakken Oil Development
78
Figure B-4: Truck traffic in 2015 for the 160 rig scenario.

Impacts to Montana State Highways Due to Bakken Oil Development
79
Figure B-5: Truck traffic in 2016 for the 160 rig scenario.

Impacts to Montana State Highways Due to Bakken Oil Development
80
Figure B-6: Truck traffic in 2021 for the 160 rig scenario.
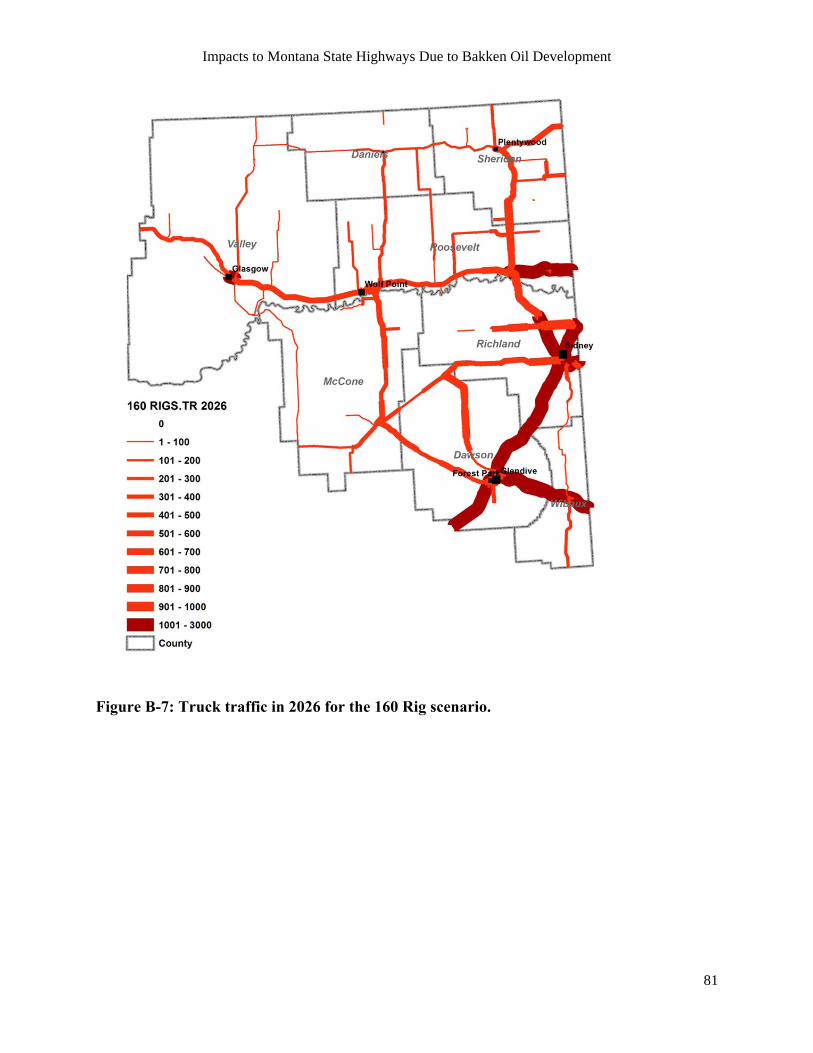
Impacts to Montana State Highways Due to Bakken Oil Development
81
Figure B-7: Truck traffic in 2026 for the 160 Rig scenario.

Impacts to Montana State Highways Due to Bakken Oil Development
82
Figure B-8: Truck traffic in 2031 for the 160 Rig scenario.

This public document was published in electronic
format at no cost for printing and distribution.