Embed Size (px)
Citation preview

Impacts of wind power on energy balance of a hydro dominated power system
EWEC 2006, Athens
MSc Juha Kiviluoma, VTT
PhD Hannele Holttinen, VTT

2
Background
Based on model developed in EU-project WILMAR (Wind power integration in liberalised electricity markets)
– Risoe, IER at University of Stutgart, Sintef, VTT, KTH, IMM at Technical University of Denmark, Elkraft, Elsam, Nord Pool Consulting
The work continues in IEA Annex on Wind & hydro and the model development in EU-project SupWind
These results part of PhD thesis work of Juha Kiviluoma– Large increases of wind and other renewables in the energy
system

3
Research questions
How hydro power regulates large amounts of wind power in hydro dominated system?
How the energy balance of the hydro dominated system changes with large amounts of wind power?
Which power plants are affected? How the prices change?

4
Model description
Market model of Nordic countries and Germany Hourly time-scale Spot market horizon Long term model for water values Stochastic presentation of wind (not used in this) Quite detailed unit presentation Also heat areas for CHP Primary and secondary reserves (dependant on wind) See Meibom at DS1 on Thursday morning

6
Cases
base 10% 20% 30%
Wind capacity [GW]
NO+SE+FI
Germany
Denmark
2.5
28.6
4.1
17.8
35.8
4.6
35.7
35.8
4.6
52.5
35.8
4.6
Energy from wind NO+SE+FI+DK [TWh]
16 49 87 119
The modelled year has 2001 profile for hydro, wind, load and heat demand
Not very windyAverage hydro year

7
Assumptions
17 €/CO2 ton Fuel price scenario Planned transmission lines up to 2010
– Fennoska II 800 MW– Storaebelt 600 MW – NorNed 700 MW (connected to Germany)– Some Nordel internal connections
Import time series from Russia and Poland Announced power plants and decomissionings until
2010 Wind is added as extra production, no capacity
taken away
Model prices
Current prices (Finland)
IEA (2010)
IEA (2030)
Light oil 53 113 $/barrel
Fuel oil 46 66 $/barrel
Crude oil 60 22 29 $/barrel
Coal 74 69 40 44 $/t
Nat_gas (Europe) 8.4 5.9 3.3 4.3 $/Mbtu
Model [€2002/GJ]
Woodwaste 4
Wood 4.3
Straw 4.4
Waste 0
Peat 1.5
Light oil 7.2
Fuel oil 6.2
Coal 2.3
Natural gas 6.2
Nuclear 0.35

0 20 40 60 80 100
01 CHP 03 Cond 04 Hydro 05 RoR 06 Wind
0 20 40 60 80 100
0 20 40 60 80 100
0 20 40 60 80 100
0 20 40 60 80 100
0 20 40 60 80 100
0 20 40 60 80 100
0 20 40 60 80 100
0 20 40 60 80 1000 20 40 60 80 100
0 100 200 300 400 500
0 20 40 60 80 100
Production [TWh] in 2010 base case
FI_R
NO_N
NO_M
NO_S
SE_N
SE_M
SE_SDK_W
DK_E
DE_NW DE_NE
DE_CS

base case: production, consumption and transmission [MWh/h]

10% case: production, consumption and transmission [MWh/h]
MW
h

20% case: production, consumption and transmission [MWh/h]
MW
h

30% case: production, consumption and transmission [MWh/h]
MW
h

Prices [€/MWh]base 10 %
20 % 30 %
18
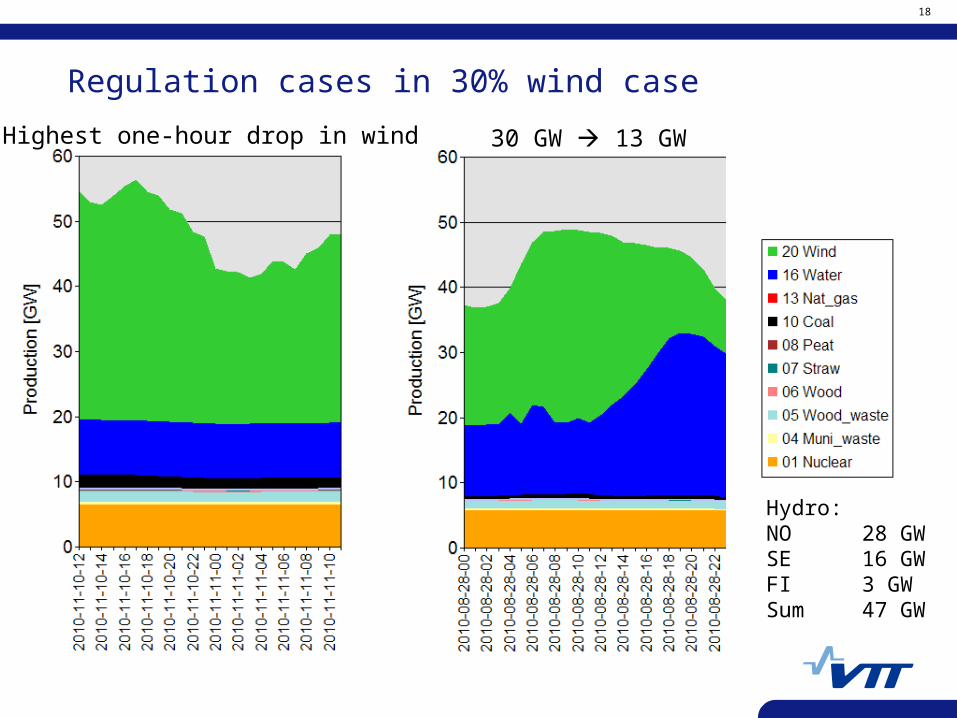
Regulation cases in 30% wind case
Hydro:NO 28 GWSE 16 GWFI 3 GWSum 47 GW
Highest one-hour drop in wind 30 GW 13 GW

19
Regulation cases in 30% wind case
High consumption – low wind Nuclear and hydro regulate
Hydro:NO 28 GWSE 16 GWFI 3 GWSum 47 GW

26
Conclusions
20-30% wind penetration changes the utilisation of other power production decisively
Wind will affect power prices strongly if penetration gets high At least in the modelled year, hydro power can regulate wind
to such extent that usage other condensing than nuclear is minimal (could be covered by demand side measures)
Limitations for wind are most likely in available sites and transmission rather than in regulation
0
10
20
30
40
50
60
€/M
Wh
base
10%
20%
30%
Nordicpricedurationcurve

27
Discussion
Power price will drop if countermeasures are not taken Additional connections to the continental grid would keep the
prices up and provide profits Possibility of increased consumption: heat pumps, industry,
traffic sector (oil dependency on agenda) Price drop obstacle also for wind Market failure?
0
10
20
30
40
50
60
€/M
Wh
base
10%
20%
30%
Nordicpricedurationcurve