Embed Size (px)
Citation preview

Asia Pacific Journal of Marketing & Management Review__________________________________________ ISSN 2319-2836 Vol.2 (4), April (2013) Online available at indianresearchjournals.com
1
IMPACT OF TQM IMPLEMENTATION ON PRODUCTIVITY AND
QUALITY - A STUDY AT GENARAL MOTORS
Dr. S.J.MANJUNATH*; G. ARUN KUMAR**
*ASSOCIATE PROFESSOR,
MBA DEPARTMENT,
B.N.BAHADUR INSTITUTE OF MANAGEMENT SCIENCES,
MYSORE, KARNATAKA, INDIA.
**ASSISTANT PROFESSOR,
MBA DEPARTMENT,
VIJANAGARA SRI KRISHNADEVARAYA UNIVERSITY,
BELLARY, KARNATAKA, INDIA.
_____________________________________________________________________________________
ABSTRACT
TQM focuses on teamwork, increasing customer satisfaction, and lowering costs. Organizations
implement TQM by encouraging managers and employees to collaborate across functions and
departments, as well as with customers and suppliers, to identify areas for improvement. The
objective of the study is to determine whether the implementation of TQM leads to higher
productivity and quality. The study was carried out at General Motors by collecting the primary
data from the managers through structured questionnaire. The data was analyzed by descriptive
analysis and Anova technique the result revealed that there is a significant relationship between
TQM implementation and high productivity and quality.
KEYWORDS: General Motors, Productivity, Quality,. Total Quality Management
_____________________________________________________________________________________
INTRODUCTION
Total Quality Management is a method by which management and employees can become
involved in the continuous improvement of the production of goods and services. It is a
combination of quality and management tools aimed at increasing business and reducing losses
due to wasteful practices. TQM views an organization as a collection of processes. It maintains
that organizations must strive to continuously improve these processes by incorporating the
knowledge and experiences of workers. The simple objective of TQM is “Do the right things,
right the first time, every time.” TQM is infinitely variable and adaptable. Although originally
applied to manufacturing operations, and for a number of years only used in that area, TQM is
now becoming recognized as a generic management tool, just as applicable in service and public
sector organizations.

Asia Pacific Journal of Marketing & Management Review__________________________________________ ISSN 2319-2836 Vol.2 (4), April (2013) Online available at indianresearchjournals.com
2
LITERATURE REVIEW
In urbanized countries such as UK, USA and JAPAN, total quality management has been a
current issue for many years in all business sectors, mainly the manufacturing industry.
However, in a developing country like India, even though it has successfully developed
substantial manufacturing industry in the last two decades, TQM has made little impact.
In manufacturing systems, quality management focuses primarily on technical issues such as
equipment reliability, measurement of defects and statistical quality control techniques (process
control). But quality management has penetrated into other areas such as product design,
research and development, human resources practices (employee empowerment) team
work,customer relations and organizational culture . Quality management pervades through the
entire organization. Idris et al.(1996) conducted a survey of Malaysian manufacturing companies
already registered to ISO 9000, with a view to examining their status as regards TQM
implementation. Less than a third of the responding companies claimed to have RQM, but there
was a strong minority claiming to have made substantial progress towards total quality practices.
Theses authors also describes the Malaysian SIRIM model of total quality training for a
company, which is multi-step process involving the adoption of such practices as a quality
improvement process, Quality Control Circles(QCC) and TPM.
Samson and Terziovski (1999) used a larger database of 1,024 usable responses from Australian
and New Zealand manufacturing organizations to examine the relationships between TQM
practices, individually and collectively, and firm performance, the study showed that the
relationship between TQM practice and organizational performance is significantly in a cross-
sectional sense. Based on 698 usable responses from Australian and New Zealand manufacturing
organizations, Dow et al. (1999) employed confirmatory factor analysis (CFA) to identifying
nine quality practices. Nine quality practices include workforce commitment, shared vision,
customer focus, and use of teams, personnel training, co-operative supplier relations, use of
benchmarking, advances manufacturing systems, and use of just-in-time principles.
Salaheldin Ismail Salaheldin (2003) conducted a study on implementation of TQM strategy in
Egyptian manufacturing firms. The study aims to explore the critical resisting and driving forces
that inhibit or promote the implementation of total quality management (TQM) strategy in Egypt,
in an attempt to determine whether TQM can be implemented effectively in this developing
country, a force-field analysis was used for identifying the salient factors affectingTQM
implementation in Egypt. The findings indicated that forces that promote or prohibit TQM
implementation obtained in one developing country might be generalizable to another less
developed country. The investigation identified some driving forces that promote the
implementation of TQM strategy by the Egyptian manufacturing firms. G.Karuppusami and R.
Gandhinathan, (2006) identified critical success factors of total quality management by using
pareto analysis. The authors discussed even through there has been a large number of articles
published related to TQM in the last few decades, only a very few articles focused on
documenting the critical success factors (CSF’s) of TQM using statistical methods. An
examination of 37 such TQM empirical studies resulted in compilation of 56 CSFs.

Asia Pacific Journal of Marketing & Management Review__________________________________________ ISSN 2319-2836 Vol.2 (4), April (2013) Online available at indianresearchjournals.com
3
Implementation difficulties exist to operationalize such a large number of CSF’s in
organizations. The study analyzed and sorted the CSF’s descending order according to the
frequency of occurrences using the quality tool “Pareto analysis”. A few vital CSF’s were
identified and reporte. In manufacturing industries, automobile companies are more interested in
implementing TQM. There are two main reasons: first, automobile manufacturing is the largest
manufacturing activity in the world.secondly, increasing global competition over the past decade
has forced automobile companies to improve quality and efficiency. Therefore, they are more
willing to implement TQM in order to improve quality, and in turn to survive in the market.
Therefore, TQM is found to be well established in the automobile industry as compared to other
industries. Baba Md Deros, et al, (2006) conducted a study on benchmarking implementation
framework for automotive manufacturing SMEs. The researchers described the need for a
framework and its relationship with benchmarking and TQM then proposing benchmarking
implementation frameworks. The frameworks were categorized into two broad types based on
the different writer’s background and the approach on how they view the benchmarking
implementation process. The researchers suggested a conceptual framework for benchmarking
implementation guides them through from the start to end of the benchmarking process. The
framework was validated at six pilot case study companies, which gave useful comments and
suggestions regarding the usefulness and applicability within the SMEs context.
OBJECTIVE OF THE STUDY-
The objective of the study is determine the impact of TQM implementation on high productivity
and quality
RESEARCH METHODOLOGY
The relevant data for the study has been collected from both primary and secondary sources.
Simple random sampling used to collect the required information through structured
questionnaire by using five point likert scale. Descriptive analysis and anova was used in this
research to analyze the data. Samples of 20 employers were selected for the study.
HYPOTHESIS
1) Ho – There is no significant influence of TQM implementation on high productivity and
quality at General Motors
H1 - There is a significant influence of TQM implementation on high productivity and quality
General Motors

Asia Pacific Journal of Marketing & Management Review__________________________________________ ISSN 2319-2836 Vol.2 (4), April (2013) Online available at indianresearchjournals.com
4
DATA ANALYSIS AND INTERPRETATION
Descriptive Statistics
N Minimum Maximum Mean
Std.
Deviation
Top management actively participates in
quality management activities. 20 3.0 5.0 4.2500 .63870
Top management learns quality-related
concepts and skills. 20 3.00 5.00 4.1000 .64072
Top management strongly encourages
employee involvement in quality
management activities
20 3.00 5.00 4.2500 .71635
Top management empowers employees to
solve quality problems 20 3.00 5.00 4.3000 .65695
Top management arranges adequate
resources for employee education and
training.
20 3.00 5.00 4.1000 .71818
Top management discusses many quality-
related issues in top management meeting 20 3.00 5.00 4.2000 .61559
Top management focuses on product quality
rather than yields 20 3.00 5.00 4.1000 .64072
Top management pursues long-term
business success. 20 3.00 5.00 4.2500 .63867
Our firm has established long-term
cooperative relations with suppliers. 20 3.00 5.00 4.3000 .65695
Our firm regards product quality as the most
important factor in selecting suppliers 20 3.00 5.00 4.1000 .64072
Our firm always participates in supplier
activities related to quality. 20 3.00 5.00 4.1000 .71818
Our firm always gives feedback on the
performance of suppliers’ products 20 3.00 5.00 4.2500 .71635
Our firm has detailed information about
supplier performance 20 3.00 5.00 3.8000 .83351
Our firm regularly conducts supplier quality
audit. 20 3.00 5.00 4.2500 .71635
Our firm has a clear long-term vision
statement. 20 3.00 5.00 3.8000 .76777
The vision effectively encourages
employees’ commitment to quality
management.
20 3.00 5.00 3.7500 .71635

Asia Pacific Journal of Marketing & Management Review__________________________________________ ISSN 2319-2836 Vol.2 (4), April (2013) Online available at indianresearchjournals.com
5
Our firm has a clear short-term business
performance plan 20 3.00 5.00 4.2000 .61559
Our firm has a clear quality policy 20 3.00 5.00 4.0500 .60481
Our firm has a detailed quality goal. 20 3.00 5.00 4.2000 .69585
Our firm has effective quality improvement
plans 20 3.00 5.00 3.7500 .78640
Various policies and plans are well
communicated to the employees 20 3.00 5.00 3.6000 .75394
Employees from different levels are
involved in making policies and plans. 20 3.00 5.00 3.8000 .83351
Our firm regularly audits various business
strategies 20 3.00 5.00 4.1500 .58714
Benchmarking is used extensively in our
firm. 20 3.00 5.00 4.0000 .72548
Valid N (listwise) 20
The descriptive analysis reveals that the top management actively participates in quality
management activities and has a mean value of 4.2500 which gives a clear indication that most
of the managers take active participation in quality management activities.
In terms of quality related concepts and skill the above table reveals that the mean value is
4.1000 which implies that the managers consider it as one of the vital aspect of TQM and give
considerable attention to this factor.
The above table reveals that the top management strongly encourages employee’s involvement in
quality management activities as the mean value is 4.2500. Thus it can be considered as one of
the important factor in implementation of TQM.
The above results revealed that top management empowers employees to solve quality problems
with the mean value of 4.300. Hence most of the managers consider this factor as the significant
attribute for the implementation of the TQM.
Top management arranges adequate resources for employee education and training which is a
important attribute as the mean value of this attribute is 4.100 and it is deemed to be an essential
attribute for implementation of TQM.
The managers have divulged that the top management discusses many quality related issue in top
management meetings and the mean value of this trait is 4.200. it gives the clear sign that it is
considered as imperative aspect in implementation of TQM.
The results revealed that the top management focuses on product quality rather than yields’ as
the mean value of this attribute is 4.100.Hence this attribute is measured as critical in TQM
implementation.
The above results reveal that top management pursues long terms business success, a mean value
of 4.250. Hence most of the managers believe that this factor is the major attribute for the
implementation of the TQM.
GM has established long term cooperative relationship with suppliers and is an imperative
attribute as the mean value of this attribute is 4.300 and it is believed to be the essential attribute
for implementation of TQM.

Asia Pacific Journal of Marketing & Management Review__________________________________________ ISSN 2319-2836 Vol.2 (4), April (2013) Online available at indianresearchjournals.com
6
The descriptive analysis reveals that GM company regards product quality as the most important
factor in selecting suppliers with a mean value of 4.1000 it gives a clear indication that most of
the managers select the suppliers who supply them with quality products.
In terms of firms participation in supplier activities related to quality the analysis reveals that the
mean value is 4.1000 which imply that the managers consider it as one of the vital aspect of
TQM and give considerable attention to this factor.
The above analysis reveals that GM managers always give feedback on the performance of the
products supplied by suppliers and the mean value is 4.2500. Thus it can be considered as one of
the important factor in implementation of TQM.
In terms of the firm detailing information about supplier’s performance the study revealed that
the mean value is 3.800 which implies that this factor is consider as a vital aspect in TQM
implementation.
GM Company regularly conducts supplies quality audit to ensure that the suppliers supply
quality products and the mean value is 4.2500.
GM Company has the clear long term vision statement which is seen in the analysis with the
mean value of 3.800, hence GM managers clearly know what they have to achieve in the future.
The descriptive analysis reveals that the vision effectively encourages employee’s commitment
to quality management with a mean value of 3.750 which gives a clear indication that most of the
managers have to take active participation in quality management activities.
In terms of short term business performance plan the above table reveals that the mean value is
4.200 which implies that the managers consider not only the long term plans but also short term
plan as the vital aspect of TQM.
The above table reveals that GM firm has a clear quality policy with a mean value of 4.0500.
Thus it is considered as one of the important factor in implementation of TQM.
The above results reveal that top GM Company has a detailed quality goal with a mean value of
4.200. Hence most of the managers consider this factor as a significant attribute for the
implementation of the TQM.
GM Company has effective quality improvement plans with a mean value 3.750 this attribute is
deemed to be an essential attribute for implementation of TQM.
The managers have divulged that the various policies and plans are well communicated to the
employees with a mean value of 3.600 it gives a clear sign that the top management informs the
employees about the different policies and plans they need to implement.
The results revealed that the employee from different levels are involved in framing policies as
the mean value of this attribute is 3.800.Hence this attribute is measured as critical in TQM
implementation.
The above results reveal that GM Company regularly audits various business strategies with a
mean value of 4.150. Hence most of the managers believe that this factor is a major attribute for
the implementation of the TQM.
GM firm has established benchmarking in order to improve the quality aspects of the product
with a mean value of 4.000 and this attribute is believed to be an essential attribute for
implementation of TQM.

Asia Pacific Journal of Marketing & Management Review__________________________________________ ISSN 2319-2836 Vol.2 (4), April (2013) Online available at indianresearchjournals.com
7
ANOVA (High Productivity and Quality)
Sum of
Squares df
Mean
Square F Sig.
Top management
actively participates in
quality management
activities.
Between
Groups 1.163 1 1.163 4.153 .043
Within Groups 6.637 18 .369
Total 7.800 19
Top management
learns quality-related
concepts and skills.
Between
Groups 3.009 1 3.009 7.975 .011
Within Groups 6.791 18 .377
Total 9.800 19
Top management
strongly encourages
employee involvement
in quality management
activities
Between
Groups 2.112 1 2.112 6.245 .022
Within Groups 6.088 18 .338
Total 8.000 19
Top management
empowers employees
to solve quality
problems
Between
Groups 2.112 1 2.112 6.245 .022
Within Groups 6.088 18 .338
Total 8.200 19
Top management
arranges adequate
resources for
employee education
and training.
Between
Groups 3.009 1 3.009 7.975 .011
Within Groups 6.791 18 .377
Total 9.800 19
Top management
discusses many
quality-related issues
in top management
meeting
Between
Groups 1.001 1 .001 5.001 .041
Within Groups 10.549 18 .586
Total 11.550 19
Top management
focuses on product
quality rather than
yields
Between
Groups 1.163 1 1.163 4.153 .043
Within Groups 6.637 18 .369
Total 7.800 19
Top management
pursues long-term
business success.
Between
Groups 3.009 1 3.009 7.975 .011
Within Groups 6.791 18 .377
Total 9.800 19

Asia Pacific Journal of Marketing & Management Review__________________________________________ ISSN 2319-2836 Vol.2 (4), April (2013) Online available at indianresearchjournals.com
8
Our firm has
established long-term
cooperative relations
with suppliers.
Between
Groups 2.112 1 2.112 6.245 .022
Within Groups 6.088 18 .338
Total 8.000 19
Our firm regards
product quality as the
most important factor
in selecting suppliers
Between
Groups 1.163 1 1.163 4.513 .048
Within Groups 4.637 18 .258
Total 5.800 19
Our firm always
participates in supplier
activities related to
quality.
Between
Groups 1.163 1 1.163 4.153 .043
Within Groups 6.637 18 .369
Total 7.800 19
Our firm always gives
feedback on the
performance of
suppliers’ products
Between
Groups 1.001 1 .001 5.001 .041
Within Groups 10.549 18 .586
Total 11.550 19
Our firm has detailed
information about
supplier performance
Between
Groups 4.255 1 4.255 8.562 .009
Within Groups 8.945 18 .497
Total 13.200 19
Our firm regularly
conducts supplier
quality audit.
Between
Groups 1.001 1 .001 5.001 .041
Within Groups 10.549 18 .586
Total 11.550 19
Our firm has a clear
long-term vision
statement.
Between
Groups 4.255 1 4.255 11.028 .004
Within Groups 6.945 18 .386
Total 11.200 19
The vision effectively
encourages
employees’
commitment to quality
management.
Between
Groups 3.091 1 3.091 8.354 .010
Within Groups 6.659 18 .370
Total 9.750 19
Our firm has a clear
short-term business
performance plan
Between
Groups 1.001 1 .001 5.001 .041
Within Groups 10.549 18 .586
Total 11.550 19

Asia Pacific Journal of Marketing & Management Review__________________________________________ ISSN 2319-2836 Vol.2 (4), April (2013) Online available at indianresearchjournals.com
9
Our firm has a clear
quality policy
Between
Groups 4.255 1 4.255 8.562 .009
Within Groups 8.945 18 .497
Total 13.200 19
Our firm has a detailed
quality goal.
Between
Groups 3.174 1 3.174 7.490 .014
Within Groups 7.626 18 .424
Total 10.800 19
Our firm has effective
quality improvement
plans
Between
Groups 1.662 1 1.662 2.966 .102
Within Groups 10.088 18 .560
Total 11.750 19
Various policies and
plans are well
communicated to the
employees
Between
Groups 3.174 1 3.174 7.490 .014
Within Groups 7.626 18 .424
Total 10.800 19
Employees from
different levels are
involved in making
policies and plans.
Between
Groups 4.255 1 4.255 8.562 .009
Within Groups 8.945 18 .497
Total 13.200 19
Our firm regularly
audits various business
strategies
Between
Groups 1.163 1 1.163 4.153 .043
Within Groups 6.637 18 .369
Total 7.800 19
Benchmarking is used
extensively in our
firm.
Between
Groups 2.112 1 2.112 6.245 .022
Within Groups 6.088 18 .338
Total 8.000 19
Top management actively participate in quality management activities – analysis of variance
revealed significant influence towards the high productivity and quality over top management
actively participate in quality management activities ( F=4.153; P=.043), as the P value is less
than .05 there is significant association.
Top management learns quality related concepts and skills: Significant difference was found for
this component with respect to high productivity and quality, where F value was found to be
7.975 and P value of .011. Hence it clearly indicates the significant relation between Top
management learning quality related concepts and skills and high productivity and quality.
Top management strongly encourages employee involvement in quality management activities:
ANOVA for Top management strongly encourages employee involvement in quality
management activities with high productivity and quality which revealed a significant difference
Asia Pacific Journal of Marketing & Management Review__________________________________________ ISSN 2319-2836 Vol.2 (4), April (2013) Online available at indianresearchjournals.com
10
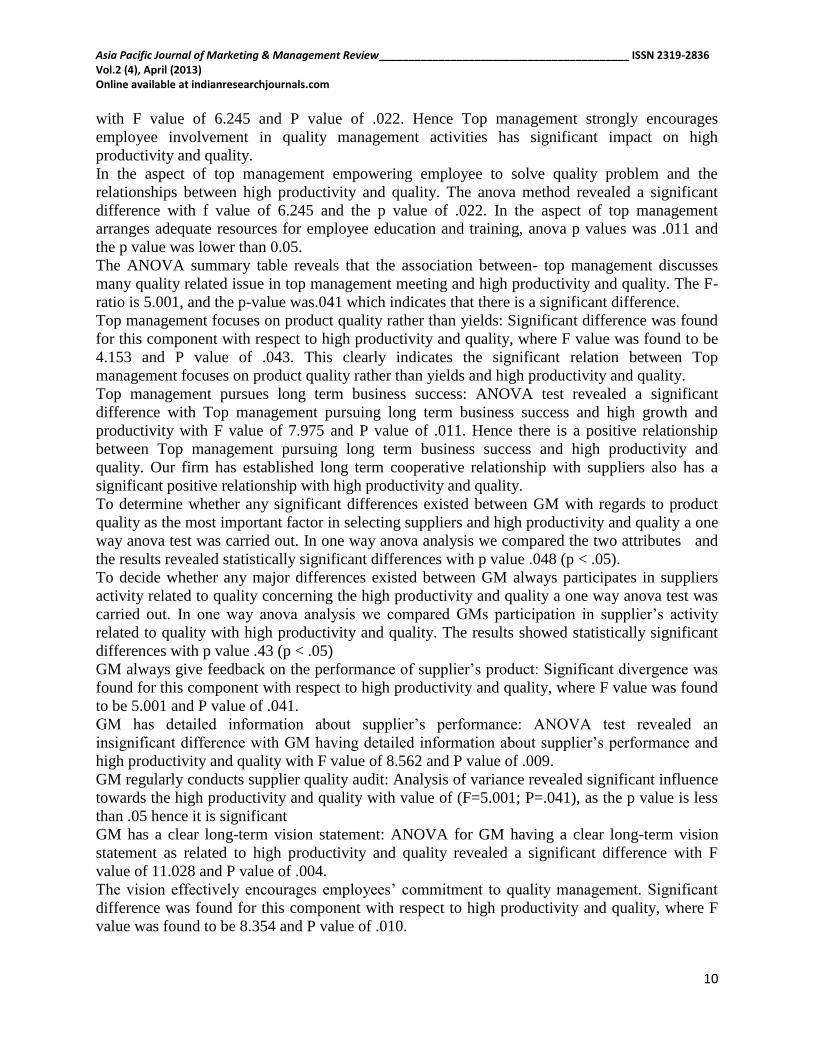
with F value of 6.245 and P value of .022. Hence Top management strongly encourages
employee involvement in quality management activities has significant impact on high
productivity and quality.
In the aspect of top management empowering employee to solve quality problem and the
relationships between high productivity and quality. The anova method revealed a significant
difference with f value of 6.245 and the p value of .022. In the aspect of top management
arranges adequate resources for employee education and training, anova p values was .011 and
the p value was lower than 0.05.
The ANOVA summary table reveals that the association between- top management discusses
many quality related issue in top management meeting and high productivity and quality. The F-
ratio is 5.001, and the p-value was.041 which indicates that there is a significant difference.
Top management focuses on product quality rather than yields: Significant difference was found
for this component with respect to high productivity and quality, where F value was found to be
4.153 and P value of .043. This clearly indicates the significant relation between Top
management focuses on product quality rather than yields and high productivity and quality.
Top management pursues long term business success: ANOVA test revealed a significant
difference with Top management pursuing long term business success and high growth and
productivity with F value of 7.975 and P value of .011. Hence there is a positive relationship
between Top management pursuing long term business success and high productivity and
quality. Our firm has established long term cooperative relationship with suppliers also has a
significant positive relationship with high productivity and quality.
To determine whether any significant differences existed between GM with regards to product
quality as the most important factor in selecting suppliers and high productivity and quality a one
way anova test was carried out. In one way anova analysis we compared the two attributes and
the results revealed statistically significant differences with p value .048 (p < .05).
To decide whether any major differences existed between GM always participates in suppliers
activity related to quality concerning the high productivity and quality a one way anova test was
carried out. In one way anova analysis we compared GMs participation in supplier’s activity
related to quality with high productivity and quality. The results showed statistically significant
differences with p value .43 (p < .05)
GM always give feedback on the performance of supplier’s product: Significant divergence was
found for this component with respect to high productivity and quality, where F value was found
to be 5.001 and P value of .041.
GM has detailed information about supplier’s performance: ANOVA test revealed an
insignificant difference with GM having detailed information about supplier’s performance and
high productivity and quality with F value of 8.562 and P value of .009.
GM regularly conducts supplier quality audit: Analysis of variance revealed significant influence
towards the high productivity and quality with value of (F=5.001; P=.041), as the p value is less
than .05 hence it is significant
GM has a clear long-term vision statement: ANOVA for GM having a clear long-term vision
statement as related to high productivity and quality revealed a significant difference with F
value of 11.028 and P value of .004.
The vision effectively encourages employees’ commitment to quality management. Significant
difference was found for this component with respect to high productivity and quality, where F
value was found to be 8.354 and P value of .010.

Asia Pacific Journal of Marketing & Management Review__________________________________________ ISSN 2319-2836 Vol.2 (4), April (2013) Online available at indianresearchjournals.com
11
In the aspect of GM having a clear short-term business performance plan there is a positive
relationships between high productivity and quality, the anova method revealed a significant
difference with f value of 5.001 and the p value of .041.
GM has a detailed quality goal - ANOVA test revealed a significant difference with GM having
a detailed quality goal and high productivity and quality with P value of .014.
GM has effective quality improvement plans: ANOVA for GM having effective quality
improvement plans with high productivity and quality revealed a significant difference with P
value of .042.
The ANOVA summary table reveals that the association between various policies and plans are
well communicated to the employees and high productivity and quality. The F-ratio is the p-
value is .014, which indicates that there is a significant difference.
Employees from different levels are involved in making policies and plans- Significant
difference was found for this component with respect to high productivity and quality, where P
value was found to be .009. Hence it clearly indicates the significant relation between high
productivity and quality and high productivity and quality.
ANOVA test revealed a significant difference with GM conduction regular audits of various
business strategies and high productivity and quality with P value of .043. Hence there is a
positive relationship between the firm regular audits of various business strategies and high
productivity and quality. Significant difference was found for Benchmarking is used extensively
by GM with respect to high productivity and quality, with a p value of .022.
CONCLUSION
Many organizations may not use the term TQM anymore but is still very much part of most
business thinking. It is seen as being a way in which a business can add value to its product and
to gain competitive advantage over its rivals. The study revealed that there is a positive
correlation between the implementation of TQM and high productivity and quality. Thus all the
TQM parameters considered in this study are positively related to high productivity and quality.
REFERENCES
1. AALBREGTSE, R.J., HEJKA, J.A. & MCNELEY, P.K. (1991) TQM: How do you do
it?, Automation, August, pp. 30 ± 32.
2. ADAMS, M.L. (1994) Quality ® rst: a model for TQM implementation & planning,
IEEE AES Systems Magazine, 9, pp. 25± 27.
3. BERRY, T.H. (1991) Managing the Total Quality Transformation (New York, McGraw-
Hill). BOLTON, J.E. (1971) Repor t of the Committee of Inquir y of Small Firms
(London, HMSO).
4. CORMAN, J. & LUSSIER, R.N. (1996) Small Business ManagementÐ A Planning
Approach (Chicago, Irwin).
5. CROSBY, P.B. (1980) Quality is FreeÐ The Ar t of Making Quality Cer tain (New York,
McGraw-Hill).
6. DALE, B.G. (1995) A quality improvement framework: application and comparative
analysis, Total Quality Management, 6, pp. 383± 397.
7. DALE, B.G. & PRAPOPOULOS, M. (1995) The introduction of a quality improvement
process in small companies: an examination in Traþ ord Park, Quality World Technical
Supplement, September, pp. 80± 88.

Asia Pacific Journal of Marketing & Management Review__________________________________________ ISSN 2319-2836 Vol.2 (4), April (2013) Online available at indianresearchjournals.com
12
8. DEMING, W.E. (1986) Quality, Productivity, and Competitive Position (Cambridge,
MA, Center for Advance Engineering Study, MIT). HEWITT, S. (1997) Business
excellence: Does it work for small companies?, The TQM Magazine, 9, pp. 76 ± 82.
9. JURAN, J.M. & GRYNA, F.M. (1993) Quality Planning and Analysis, 3rd Edn
(Singapore, McGraw-Hill).
10. KANJ I, G.K. (1996) Implementation and pitfalls of total quality management, Total
Quality Management, 7, pp. 331± 343.
11. KANJ I, G.K. & BARKER, R.L. (1990) Implementation of total quality management,
Total Quality Management, 1, pp. 375 ± 389. KANJ I, G.K. & BARKER, R.L. (1990)
Implementation of total quality management, Total Quality Management, 1, pp. 375 ±
389.
12. MANN, R.S. (1992) The development of a framework to assist in the implementation of
TQM, PhD Thesis, University of Liverpool.
13. OAKLAND, J. (1993) Total Quality Management (Oxford, Butterworth-Heinemann).
14. POPPER, K.R. (1994) The Myth of the Framework: In Defence of Science and
Rationality (London, Routledge).