Embed Size (px)
Citation preview
24th International Conference on Electricity Distribution Glasgow, 12-15 June 2017
Paper 0078
CIRED 2017 1/5
IMPACT OF THE CONTROL-COMMAND PROCESS IN A PHOTOVOLTAIC CONVERSION CHAIN ON THE POWER LINE CHANNEL TRANSFER FUNCTION IN
THE NARROWBAND PLC FREQUENCY RANGE
Christopher WAWRZYNIAK Véronique MOEYAERT François VALLEE UMONS – Belgium UMONS – Belgium UMONS - Belgium [email protected] [email protected] [email protected]
ABSTRACT This paper proposes a study of the control-command of a photovoltaic conversion chain in order to evaluate its impact on the power line channel transfer function in the framework of Power Line Communication (PLC) performance. Hence, MatLab/Simulink is used in order to simulate the photovoltaic conversion chain with and without the mechanism of contro-command. The input impedance of the chain obtained in both cases is finally used to simulate its impact on the powerline channel transfer function when connected to a classical distribution network topology.
INTRODUCTION Nowadays, the rapid development of power electronics, micro-computing and automation has led to the use of more and more converters in electrical systems. For example, the presence of renewable energy based generation units such as photovoltaic arrays or wind turbines has significantly increased in electrical networks due to concerns about the worldwide energy crisis which require to find alternatives to fossil fuels. Practically, these units are always composed of converters that can practically be controlled in order to reduce the drawbacks related to the fluctuating behavior of such a kind of electrical generation mean. In this context, the necessity of characterizing the electrical networks in terms of impedance has become mandatory for the Distribution System Operator (DSO). Indeed, with the announced development of Power Line Communication (PLC) technologies for control and command concerns in Low and Medium Voltage distribution networks, knowing how the perturbations induced by modern equipment (like PV inverters, voltage control devices…) are affecting the PLC transmission is really of significant importance. In that way, in this paper, the impact of the control-command structure of a DC/AC converter, used in a photovoltaic conversion chain, on the electrical network transfer function is studied in the narrowband PLC frequency range (between 3 kHz and 500 kHz). In the first part of the paper, the modelling approach used to represent the photovoltaic conversion chain is introduced. This approach is divided into two steps. Firstly, the photovoltaic array is simulated using a single
diode model. This model is based on the statement that a photovoltaic cell is composed of a single p-n junction and can thus be represented by a current source in parallel with a diode [1]. The PV parameters are obtained using a commercial datasheet. Secondly, the associated conversion unit (composed of a boost converter, a three-phase DC/AC converter and a LCL filter) is simulated using MatLab/Simulink. Afterwards, the control-command of the three-phase DC/AC converter using IGBT switches is presented. The control system uses two control loops: an external control loop that regulates the DC link voltage and an internal loop that regulates active and reactive current components (Id and Iq). Then, in order to conclude about the impact of the control-command structure on the PLC channel transfer function, the modelled impedance obtained without this structure is compared with the one taking into account the regulation of the DC link. Finally, once the coherence of the model is demonstrated, simulations are performed in order to study the impact of the control-command procedure on the transfer function of the distribution system including realistic elaborate network topologies.
MODELLING OF THE PHOTOVOLTAIC CONVERSION CHAIN
Figure 1 illustrates a typical photovoltaic conversion chain composed of a photovoltaic array followed by a buck-boost converter, a DC/AC converter and a LCL filter.
Figure 1: Classical PV unit conversion chain
A classical Maximum Power Point Tracking (MPPT) algorithm is used in order to generate the maximal power from the PV installation. In this section, the photovoltaic

24th International Conference on Electricity Distribution Glasgow, 12-15 June 2017
Paper 0078
CIRED 2017 2/5
array is firstly modelled using a single diode approach. Then, the associated conversion unit is simulated thanks to MatLab/Simulink. Finally, a control-command procedure is considered.
Single diode model The single diode model is based on the statement that a photovoltaic cell is composed of a single p-n junction and can thus be represented by a current source in parallel with a diode (Figure 2).
Figure 2: Single diode model
Based on this representation, the expression of the current at the output of the PV cell is given by [1]:
𝐼!" = 𝐼!! − 𝑒( !!"!!!".!! .!!!!!)
(1)
where 𝐾! =!
!"# and 𝑒!! = 𝐼!. In this equation, 𝑛 is the
diode factor, 𝐾 the Boltzmann constant [𝐽/𝐾], 𝑇 the temperature [𝐾] and 𝑞 the electron charge [𝐶]. 𝐼!! is the photocurrent [𝐴], 𝐼! the diode saturation current [𝐴], 𝐼! is the current through the diode [𝐴], 𝑉!" the PV cell voltage [𝑉], 𝐼!" the PV cell current [𝐴] and 𝑅! the series resistance which represents the resistive losses of materials [Ω]. Hence, in these equations, four unknowns have to be evaluated: 𝐾!, 𝐾!, 𝑅! and 𝐼!!. They can be obtained by the knowledge of some specific information given in the datasheet of the considered PV installation (the short-circuit current, the open circuit voltage and the current and voltage at the MPP)[2].
PV conversion chain and MPPT algorithm The conversion unit associated to the PV array is then simulated using MatLab/Simulink (Figure 3).
Figure 3: Complete chain of a photovoltaic unit
The complete photovoltaic conversion chain is composed
of the photovoltaic array, the buck-boost converter, the DC/AC converter, the LCL filter and the electrical network assimilated to an ideal 230 𝑉 voltage source. Moreover, in order to generate the maximum power from the photovoltaic panel, a MPPT algorithm is implemented in MatLab/Simulink. Hence, if the power variation between time 𝑡 − 1 and time 𝑡 is negative and the voltage variation is negative, the voltage reference is increased and vice versa. In the same way, if the power variation is positive and the voltage variation is positive, the voltage reference is decreased and vice versa. The components values used for the simulations are given in Table 1 ([3],[4]). Component Value Component Value
𝑓!"#$ 50 𝐻𝑧 𝐿!, 𝐿!, 𝐿! 500 𝜇𝐻 𝑓!"/!"#$%& 15 𝑘𝐻𝑧 𝐿!, 𝐿!, 𝐿! 130 𝜇𝐻
𝑅! 1 Ω 𝑅!, 𝑅!!, 𝑅!! 0.3 Ω 𝐿 100 𝑚𝐻 𝑅!!, 𝑅!!, 𝑅!! 0.1 Ω 𝐶! 500 𝜇𝐹 𝐶!!, 𝐶!!, 𝐶!! 99 𝜇𝐹 𝐶 10 𝑚𝐹 𝑉!"#$%_!"#$%&' 230 𝑉 𝑅 500 Ω
Table 1: Components values of the PV conversion unit
Control-command procedure The control-command structure of the three-phase DC/AC converter using IGBT switches is given in Figure 4.
Figure 4: Control-command of the three-phase DC/AC converter
The control system is composed of two control loops: an external control loop that regulates the DC link voltage and an internal loop that regulates active and reactive current components (Id and Iq). The internal loop has been arbitrary designed in order to be 500 times faster than the external loop. DC link voltage control loop Figure 5 shows a schematic of the external control loop used for the regulation of the DC link voltage [5].

24th International Conference on Electricity Distribution Glasgow, 12-15 June 2017
Paper 0078
CIRED 2017 3/5
Figure 5: Scheme of the regulation of the DC link
voltage The open loop transfer function is given by [5]:
𝐺!"# =𝑉!"𝑉!"#$%
=𝑘!. 𝑘! 𝐾
𝑠! + 𝑘! 𝐾 . 𝑠 + 𝑘!. 𝑘! 𝐾
(2)
where 𝐾 =!.!.!!"#$%
!.!!"#$%_!"#$%&'. The relationship between 𝑉!"
and 𝑉!"#$% is thus a second order function and can also be written as follows:
𝑉!"𝑉!"#$%
=𝜔!!
𝑠! + 2. 𝜉.𝜔!. 𝑠 + 𝜔!!
(3)
The coefficients 𝑘! and 𝑘! can then be identified by:
𝑘! =
𝜔!2. 𝜉
(4)
𝑘! = 2. 𝜉.𝜔!.𝐾 (5) If 𝑉!"#$% = 600 𝑉, 𝜉 = 0.707 and 𝜔! = 100 are imposed in the system, 𝑘! = 50 and 𝑘! = 0.4919 are obtained. Active and reactive current control loop The design of the active and reactive current control loop is similar. Consequently, the philosophy is only developed for the active current 𝐼!. The current control loop is represented in Figure 6.
Figure 6: Scheme of the regulation of current
The open loop transfer function is given by:
𝐺!" =𝐼!𝑉!=
1𝐿! . 𝑠 + 𝑅!
=1𝑅!
𝑇! . 𝑠 + 1 (6)
with 𝑇! =
!!!!
. The transfer function of the PI compensator is given by:
𝐺!"#$.𝐺!" = 𝐾!𝑇! . 𝑠 + 1𝑇! . 𝑠
.1𝑅!
𝑇! . 𝑠 + 1
(7)
By applying the method of pole compensation by zeros (in this case: 𝑇! = 𝑇!), the transfer function becomes:
𝐺!"#$.𝐺!" =𝐾!
𝑅!𝑇! . 𝑠
(8)
The knowledge of this function allows to determine the closed loop transfer function 𝐹:
𝐹 =
𝐾!𝑅!
𝑇! . 𝑠𝐾!
𝑅!𝑇! . 𝑠
+ 1
=𝐾!
𝑅!𝑇! . 𝑠 +
𝐾!𝑅!
(9)
For a closed loop time constant 𝑇!"# 500 times shorter than the open loop one and by considering that 𝑅! = 𝑅!, 𝑅!!, 𝑅!! and 𝐿! = 𝐿!, 𝐿!, 𝐿!, it can be calculated:
𝑇!"# =𝑇! .𝑅!𝐾!
=𝑇!500
=500𝑒!! 0.3
500= 3.3 𝜇𝑠
and the parameters of the PI controller are given by:
𝐾!"# = 𝐾! = 500.𝑅! = 150
𝐾!!" =𝐾!𝑇!= 90000
SIMULATION RESULTS
Validation of the PV array modelling In order to attest the efficiency of the photovoltaic array modelling based on the single diode model, a comparison between simulations and measurement is realized for an installation composed of four PV arrays (from DROBen Energy company [6]) connected in series. The measurement setup that is used is given in Figure 7.
Figure 7: Measurement setup used for the validation of
the PV array modeling
Hence, the PV arrays charge a variable load and the current and voltage at the load position are measured by use of a multimeter (Agilent 34401A). The evolutions of current, power and impedance versus voltage are then obtained by varying the load value. During the measurement session, an irradiance of 750 𝑊/𝑚! and a temperature of around 40 °𝐶 were measured via a probe. Figure 8 𝑎, 𝑏 and 𝑐 show a very good agreement between the simulations and measurements in the case of the evolution of respectively current, power and impedance

24th International Conference on Electricity Distribution Glasgow, 12-15 June 2017
Paper 0078
CIRED 2017 4/5
versus voltage. The single diode model can thus be validated and used in order to simulate the photovoltaic unit behavior in the complete chain developed into MatLab/Simulink.
Figure 8: Comparison between the simulated
performance of the PV unit and the measurement
The installation provides a power around 360 𝑊 at the MPPT. This point corresponds to a PV unit voltage and current of about 61 𝑉 and 5.9 𝐴 respectively.
Simulation results for the PV conversion unit The PV conversion unit has been simulated using MatLab/Simulink (Figure 3). By imposing the parameters values given in Table 1 and the PI compensation calculated in the previous section, the evolution of the impedance between two phases (e.g. a and c) at the output of the LCL filter can be simulated. These are given in Figure 9 (without and with control-command procedure, respectively) in the Narrowband PLC frequency range. These results have been obtained by imposing a ramp of irradiance between 0 𝑊/𝑚! and 500 𝑊/𝑚! during the range of time of [0 - 1] 𝑠.
(a) (b) Figure 9: Evolution of the impedance at the output of the LCL filter without (a) and with (b) the control-command
procedure
It can be seen that there are some variations in the shape
of the impedance in both cases. However, in the case of the presence of a control-command procedure, these variations are more important in terms of amplitude but less recurrent from a temporal point of view than in the other case. Application to an existing 230 V Belgian topology In the context of data transmission using Power Line Communication, the ability to estimate the behavior of the channel is one of the key points. Hence, in this section, the modelling, in terms of transfer function, of an existing 230 𝑉 Belgian electrical network is proposed based on the transmission line theory [7]. This takes place in order to evaluate the possibility of using a concentrator before the MV/LV transformer to command all smart meters in the LV network. Moreover, renewable sources induce variations in the temporal evolution of the electrical network transfer function and it is thus necessary to address a particular interest to this kind of topology. Figure 10 shows an existing ORES 230 𝑉 Belgian topology characterized by a high density of photovoltaic arrays (30%).
Figure 10: Existing 230 𝑉 Belgian topology
characterized by a high density of photovoltaic arrays In this example, the focus is only set on the study of phase B because of the higher number of photovoltaic arrays (8) on this phase. The characteristics of this network are given in Table 2. Sending
node Receiving
node Line Length
(m) r
(Ω/𝑚) x
(Ω/𝑚) 1 2 65 0.31 0.243 2 3 260 0.31 0.243 3 5 96 0.31 0.243 5 7 155 0.31 0.243 7 17 118 0.31 0.243 17 18 50 0.31 0.243 18 19 60 0.31 0.243 7 9 32 0.31 0.243 9 12 110 0.31 0.243 12 14 45 0.31 0.243
Table 2: Characteristics of the simulated network
0 10 20 30 40 50 60 70 800
1
2
3
4
5
6
7I−V Curves
Voltage (V)
Mod
ule
Cur
rent
(A)
0 10 20 30 40 50 60 70 800
50
100
150
200
250
300
350
400
450
500R−V Curves
Voltage (V)
Mod
ule
Res
ista
nce
(Ohm
s)
0 10 20 30 40 50 60 70 800
50
100
150
200
250
300
350
400P−V Curves
Voltage (V)
Mod
ule
Pow
er (W
)
a b
Meas.Sim.
c
0 0.5 1 1.5 2 2.5 30
100
200
300
400
500
600
700
800
900
1000
Time (s)
|Z|
(Oh
ms)
Evolution of the impedance at the output of the LCL filter(between phase a and c) without the control−command procedure
0 0.5 1 1.5 2 2.5 30
100
200
300
400
500
600
700
800
900
1000
Time (s)
|Z|
(Oh
ms)
Evolution of the impedance at the output of the LCL filter(between phase a and c) with the control−command procedure
= PV conversion unit load
24th International Conference on Electricity Distribution Glasgow, 12-15 June 2017
Paper 0078
CIRED 2017 5/5
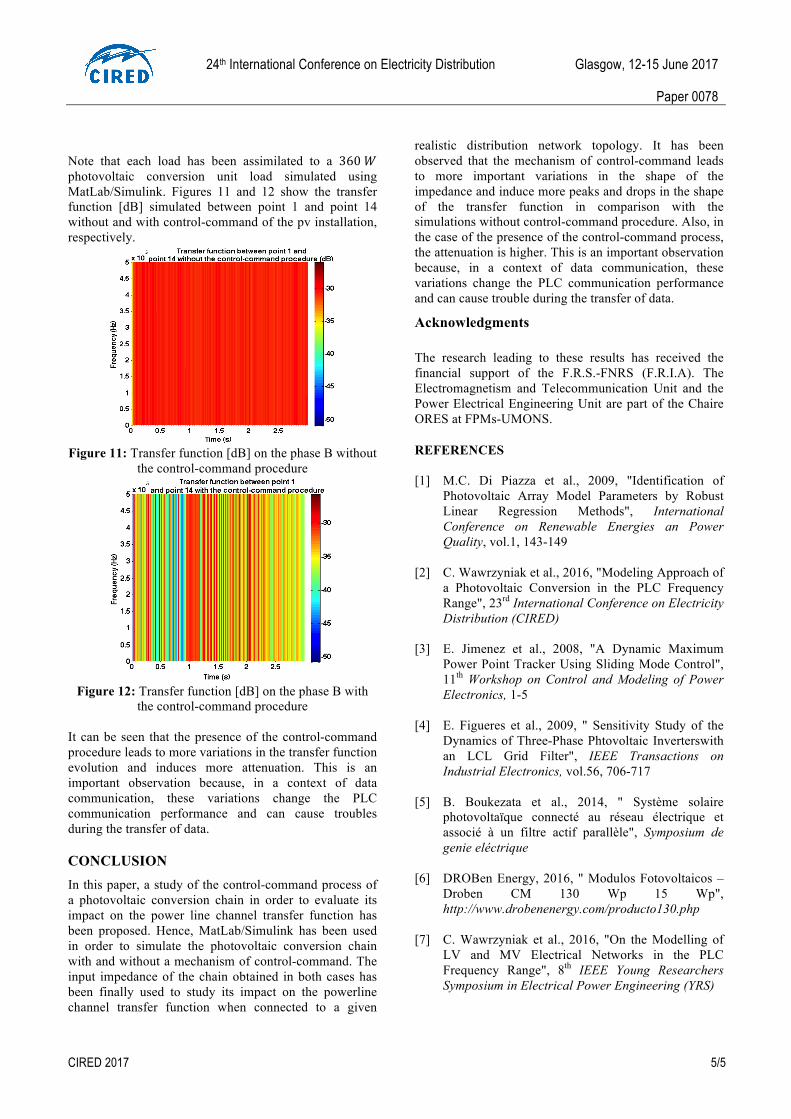
Note that each load has been assimilated to a 360 𝑊 photovoltaic conversion unit load simulated using MatLab/Simulink. Figures 11 and 12 show the transfer function [dB] simulated between point 1 and point 14 without and with control-command of the pv installation, respectively.
Figure 11: Transfer function [dB] on the phase B without
the control-command procedure
Figure 12: Transfer function [dB] on the phase B with
the control-command procedure
It can be seen that the presence of the control-command procedure leads to more variations in the transfer function evolution and induces more attenuation. This is an important observation because, in a context of data communication, these variations change the PLC communication performance and can cause troubles during the transfer of data.
CONCLUSION In this paper, a study of the control-command process of a photovoltaic conversion chain in order to evaluate its impact on the power line channel transfer function has been proposed. Hence, MatLab/Simulink has been used in order to simulate the photovoltaic conversion chain with and without a mechanism of control-command. The input impedance of the chain obtained in both cases has been finally used to study its impact on the powerline channel transfer function when connected to a given
realistic distribution network topology. It has been observed that the mechanism of control-command leads to more important variations in the shape of the impedance and induce more peaks and drops in the shape of the transfer function in comparison with the simulations without control-command procedure. Also, in the case of the presence of the control-command process, the attenuation is higher. This is an important observation because, in a context of data communication, these variations change the PLC communication performance and can cause trouble during the transfer of data.
Acknowledgments The research leading to these results has received the financial support of the F.R.S.-FNRS (F.R.I.A). The Electromagnetism and Telecommunication Unit and the Power Electrical Engineering Unit are part of the Chaire ORES at FPMs-UMONS.
REFERENCES [1] M.C. Di Piazza et al., 2009, "Identification of
Photovoltaic Array Model Parameters by Robust Linear Regression Methods", International Conference on Renewable Energies an Power Quality, vol.1, 143-149
[2] C. Wawrzyniak et al., 2016, "Modeling Approach of
a Photovoltaic Conversion in the PLC Frequency Range", 23rd International Conference on Electricity Distribution (CIRED)
[3] E. Jimenez et al., 2008, "A Dynamic Maximum
Power Point Tracker Using Sliding Mode Control", 11th Workshop on Control and Modeling of Power Electronics, 1-5
[4] E. Figueres et al., 2009, " Sensitivity Study of the
Dynamics of Three-Phase Phtovoltaic Inverterswith an LCL Grid Filter", IEEE Transactions on Industrial Electronics, vol.56, 706-717
[5] B. Boukezata et al., 2014, " Système solaire
photovoltaïque connecté au réseau électrique et associé à un filtre actif parallèle", Symposium de genie eléctrique
[6] DROBen Energy, 2016, " Modulos Fotovoltaicos –
Droben CM 130 Wp 15 Wp", http://www.drobenenergy.com/producto130.php
[7] C. Wawrzyniak et al., 2016, "On the Modelling of
LV and MV Electrical Networks in the PLC Frequency Range", 8th IEEE Young Researchers Symposium in Electrical Power Engineering (YRS)