Embed Size (px)
Citation preview

Page 13rd WMO Workshop on the Impact of Various Observing Systems in NWP 9-12 Mar 2004
Impact of Research Satellite Observations in a Data Assimilation System for the Troposphere-Stratosphere
Author: W.A. Lahoz and A. O’Neill
Data Assimilation Research Centre, University of Reading RG6 6BB, UK
!Why use research satellite observations?
!How to use research satellite observations (evolution to coupled dynamics/chemistry systems)
!Impact studies (OSEs, OSSEs)
!Conclusions/Future

Page 23rd WMO Workshop on the Impact of Various Observing Systems in NWP 9-12 Mar 2004
! Ozone:stratosphere/radiative transfer/UV forecasts/wind information
! Limb geometry: higher vertical resolution (e.g. UTLS)
! Nadir geometry: deep weighting functions
! Global coverage: troposphere & pollution
! Information on chemical species:chemical weather/pollution/UV forecasts
! Importance of stratosphere: more focus by research satellite data
Why use research satellite observations?

Page 33rd WMO Workshop on the Impact of Various Observing Systems in NWP 9-12 Mar 2004
Relatively good horizontal resolutionRelatively poor vertical resolution
Relatively poor horizontal resolution Relatively good vertical resolution
Can we combine the advantages of these geometries? -> synergy
•MLS/GOME•MIPAS/SCIAMACHY from Envisat•Research/operational satellites
Used by the met agencies
Used by researchgroups
Courtesy NATO ASI 2003
Limb/nadir geometries

Page 43rd WMO Workshop on the Impact of Various Observing Systems in NWP 9-12 Mar 2004
Data assimilation using:! CTMs (e.g. off-line data + research satellites):
- total column ozone forecasts from KNMI (GOME) & BIRA-IASB (MIPAS)- stratospheric ozone forecasts from BIRA-IASB (MIPAS)- tropospheric ozone forecasts by U. Köln (surface, sondes)
! GCMs (e.g. operational + research satellites):- ozone forecasts from ECMWF (MIPAS)- ozone/total column ozone analyses from DARC/Met Office (MLS/GOME, MIPAS)
! Coupled GCM/CTM: Météo-France
How to use research satellite observations:

Page 53rd WMO Workshop on the Impact of Various Observing Systems in NWP 9-12 Mar 2004
Recent progress in data assimilation:
! GCM/CTM:
(1) inclusion of novel species (ozone – GCM; CFCs – CTM)
(2) extension of simple photochemical parametrizations (Cariolle in GCM)
(3) better heterogeneous chemistry & inclusion of aerosols (CTM)
(4) inclusion of new geometries – limb (GCM/CTM)
(5) better characterization of model errors (GCM/CTM)
(6) radiance assimilation (GCM/CTM)
Recent progress in data assimilation using GCMs & CTMs helpsdevelop coupled dynamics/chemistry data assimilation

Page 63rd WMO Workshop on the Impact of Various Observing Systems in NWP 9-12 Mar 2004
! OSEs: adding novel data types (e.g. nadir/limb synergy; impact of novel geophysical parameters such as ozone, stratospheric H2O)
! OSSEs (mainly used by space agencies): evaluating proposed observation types from expensive EO missions (e.g. SWIFT stratospheric winds) - note use of “information content” at NWP centres
Impact studies:

Page 73rd WMO Workshop on the Impact of Various Observing Systems in NWP 9-12 Mar 2004
! MLS limb / GOME nadir synergy (Struthers et al. JGR 2002)
-> better analyses
-> partition information between stratosphere & troposphere
-> feed into NWP development (background error covariances for ozone, B; H2O in EU-funded ASSET project: http://darc.nerc.ac.uk/asset)
-> apply to Envisat (MIPAS/SCIAMACHY)
OSEs:

Page 83rd WMO Workshop on the Impact of Various Observing Systems in NWP 9-12 Mar 2004
RMS (O-A) -> BLUE: rms(0-A) must less than or equal than 1-σ (MLS ozone) −> “FIT THE OBSERVATIONS”*- -*: 1-σ observation error (MLS ozone) -: rms(O-A)Talagrand (2003), Struthers et al. JGR 2002
*
*
*
*
*
*
MLS GOME MLS+GOME
UARS MLS (limb) & GOME (nadir)
3 week average April 1997

Page 93rd WMO Workshop on the Impact of Various Observing Systems in NWP 9-12 Mar 2004
RMS (O-A) -> BLUErms(0-A) must be less than or equal than 1-σ (GOMEColumn ozone)
Other tests, e.g., comparison with independent data, support these conclusions
**
**
**
MLS
GOME
MLS+GOME
Benefits of combiningnadir/limb geometries-> several applications

Page 103rd WMO Workshop on the Impact of Various Observing Systems in NWP 9-12 Mar 2004
! Envisat MIPAS ozone & H2O (also temperature) (troposphere-stratosphere 3d-var: Swinbank et al. 2002)
-> analyses of key species
-> Envisat cal-val
-> strategy for assimilation of Envisat data / EO strategy (ASSET: http://darc.nerc.ac.uk/asset) : compare different approaches, e.g., representation of photochemistry, radiances vs retrievals
-> studies of ozone distribution (ASSET):different models & robustness
OSEs:

Page 113rd WMO Workshop on the Impact of Various Observing Systems in NWP 9-12 Mar 2004
DA fills in the gaps – the SH polar vortex split of Sep 2002
MIPAS ozone
DARC analyses
Blue: low ozone; Red: high ozone; 10 hPaCourtesyAlan Geer

Page 123rd WMO Workshop on the Impact of Various Observing Systems in NWP 9-12 Mar 2004
Statistics are a global mean at 10hPa
Ozone monitoring statistics at 10hPa in DARC assimilation
Analysis
O-B Residuals
Number of accepted observations
Observations
Background
Cal-val: MIPAS

Page 133rd WMO Workshop on the Impact of Various Observing Systems in NWP 9-12 Mar 2004
Total column ozone, 24th Sep 2002
Dob
son
units
TOMS
GOME
Analysis
Bias (overestimate)in MIPAS analyses

Page 143rd WMO Workshop on the Impact of Various Observing Systems in NWP 9-12 Mar 2004
Ozone evaluation - summary! MIPAS NRT ozone retrievals show large bias before 18th Sep 2002.
To be corrected in future assimilation runs.! MIPAS/model errors consistent with Gaussian statistics (not shown)! Analysed ozone generally consistent with independent data (sonde,
HALOE, GOME & TOMS total columns), but:" At 2hPa, model underestimates ozone (not shown)" Lower to mid stratosphere shows 0.3-0.7 ppmv too much ozone
(not shown) ⇒ a combination of MIPAS bias and Cariolle scheme bias?
" In the polar vortex, lower stratospheric ozone amount appears too high ⇒ GOME bias, MIPAS bias (cloud contamination?), chemistry scheme bias, excessive mixing with high ozone air?
-> evaluation of contributions from observations (MIPAS), advection scheme, Cariolle scheme & DA scheme to O3 analyses

Page 153rd WMO Workshop on the Impact of Various Observing Systems in NWP 9-12 Mar 2004
S E
S
E
ATOVSimpact
TROPOSPHERE(ATOVS)
MIPASimpact
MIPAS H2O dataESA© 2002
ppmm
ECMWF H2O data
850 K
Large variability in H2O

Page 163rd WMO Workshop on the Impact of Various Observing Systems in NWP 9-12 Mar 2004
Issues:• Large variability of water vapour (troposphere->stratosphere): what
control variable?• Ill-conditioned vertical transform of B matrix (currently weighted by
mass and standard deviation - max in boundary layer).• Excessive increments in lower stratosphere (e.g. 50 hPa), suspect due
to spurious correlations with lower levels.
-> Need to revisit calculation of B matrix! control variable
normalised RH – Hólm et al, ECMWF; pseudo RH – Dee, GMAO! treatment of tropopause
MO investigating performance of stratospheric H2O in “New Dynamics”
Stratospheric H2O

Page 173rd WMO Workshop on the Impact of Various Observing Systems in NWP 9-12 Mar 2004
! SWIFT winds and ozone
-> Quantify impact and test significance
-> Need to evaluate (quantitatively) future expensive observing systems
Troposphere-stratosphere 3d-var: Lahoz et al. QJ 2004
OSSEs:

Page 183rd WMO Workshop on the Impact of Various Observing Systems in NWP 9-12 Mar 2004
Note shortcomings of an OSSE:
! Expensive (cost ~ assimilation system) -> alleviate problem: “reduced OSSE” (e.g. profiles instead of radiances)Note: “reduced OSSE” generally only useful when observation of interest has relatively high impact (e.g. stratospheric winds)
! Difficult interpretation (model dependence) -> alleviate problem: conservative errors, several methods to investigate impact
! Incest -> alleviate problem: different models to construct “truth” & perform assimilation
Despite shortcomings, high cost of EO missions meansthat OSSEs often make sense to space agencies

Page 193rd WMO Workshop on the Impact of Various Observing Systems in NWP 9-12 Mar 2004
http://swift.yorku.ca! Based on UARS WINDII principle (Doppler effect)! 2 wind components using 2 measurements at ~90o
! Thermal emission (mid-IR) of ozone (1133 cm-1)! Global measurements of wind & ozone profiles (~20-40 km)! N- & S–look (87°N-53°S, 53°N-87°S): non sun-synchronous orbit! Errors: conservative; random; representativeness (assumed small impact)
OSSE for proposed SWIFT instrument
SWIFT wind component error
0
10
20
30
40
50
60
0 5 10 15 20 25
error (m/s)
heig
ht (k
m)
SWIFT ozone error
10
20
30
40
50
0 5 10 15 20
error (as a percentage of the observation)
heig
ht (k
m)

Page 203rd WMO Workshop on the Impact of Various Observing Systems in NWP 9-12 Mar 2004
1. Current observing system:
No operational observations of winds for levels above those of radiosondes (~10 hPa)
Note: indirect information on winds can be obtained from nadir soundings of temperature (thermal wind; but this breaks down in the tropics)
2. Science:
! Climatologies of tropical winds
! Transport studies (e.g. ozone fluxes)
! Use assimilation to obtain 4-d quality-controlled datasets for scientific studies (e.g. climate change and its attribution)
Why SWIFT?

Page 213rd WMO Workshop on the Impact of Various Observing Systems in NWP 9-12 Mar 2004
! Establish basis for assimilating SWIFT observations (u, v; ozone)! Investigate scientific merits of SWIFT observations
Models used:! “Truth” (ECMWF directly, or forcing a CTM) : T! Assimilation system (Met Office) (cf. incest)
Simulated observations:Operational: Control, C {MetOP, MSG, sondes, balloons, aircraft, surface}
Temperature, winds, humidity, ozoneSWIFT; C+SWIFT = Perturbation, P
Ozone, winds (stratosphere, conservative errors)
Several assimilation experiments; analyses evaluated.Qualitative & quantitative tests
Design of SWIFT OSSE

Page 223rd WMO Workshop on the Impact of Various Observing Systems in NWP 9-12 Mar 2004
Several tests -> robustness (cf. interpretation of the OSSE)
! Qualitative (histograms, monthly means)
! Quantitative (RMS statistics, significance tests)
Assumption: We can discount the bias between the ECMWF and Met Office because it is removed when comparing P-T and C-T
Evaluation of SWIFT impact

Page 233rd WMO Workshop on the Impact of Various Observing Systems in NWP 9-12 Mar 2004
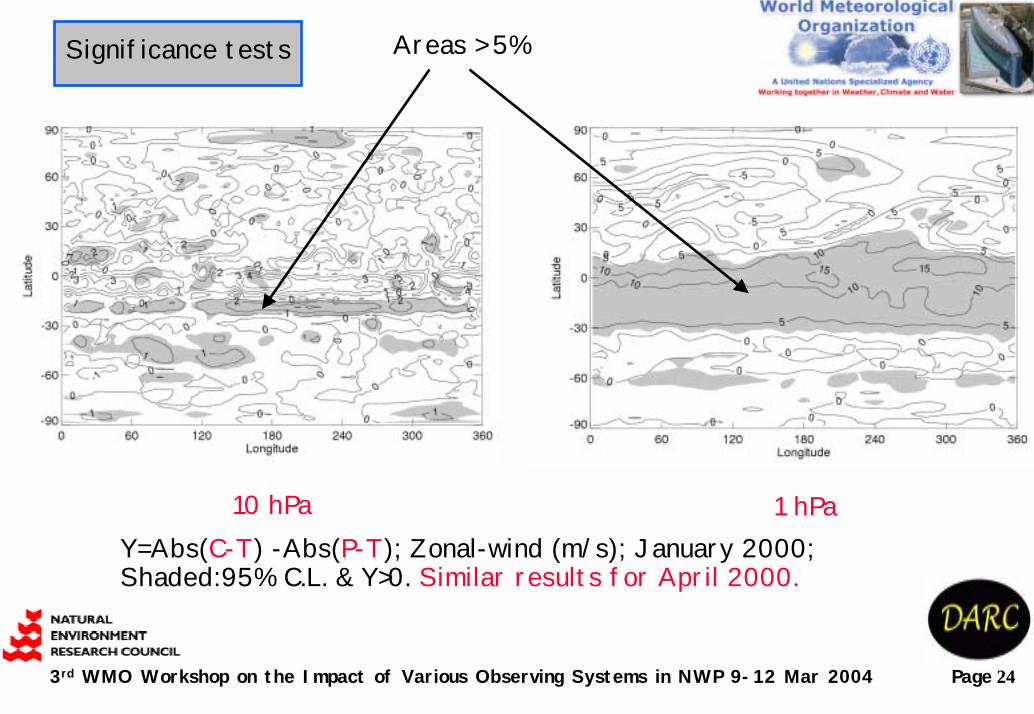
Quantitative test. Consider “Null hypothesis”:
“The calculated monthly means {P-T; C-T} are equal given the standard deviations 1-σ of the two datasets”
“2-sided” test at the 0.95 confidence level
1. Members of each dataset {P-T; C-T} are independent, & datasets are independent
2. Include effects of persistence & correlation between the datasets -> equivalent to reducing the degrees of freedom or increasing the variance of the datasets
Page 243rd WMO Workshop on the Impact of Various Observing Systems in NWP 9-12 Mar 2004
Y=Abs(C-T) -Abs(P-T); Zonal-wind (m/s); January 2000; Shaded:95% C.L. & Y>0. Similar results for April 2000.
10 hPa 1 hPa
Significance tests Areas > 5%

Page 253rd WMO Workshop on the Impact of Various Observing Systems in NWP 9-12 Mar 2004
SWIFT winds
! Significant impact in tropical stratosphere (except lowermost levels)! Can have significant impact in extra-tropics when:
! SWIFT observations available! Flow regime is variable (relatively fast changing)
! Have scientific merit in that they improve:! Information on tropical winds ! Wintertime variability
! Useful for forecasting & producing analyses to help study climate change & its attribution:better models, better initial conditions, model evaluation
SWIFT ozone
! Significant impact at 100 hPa & 10 hPa (regions of relatively high vertical gradient)
Conclusions

Page 263rd WMO Workshop on the Impact of Various Observing Systems in NWP 9-12 Mar 2004
“Reduced OSSE”: Radiances used for AMSU-A, IASI at time of SWIFT launch:
1. Expectation is that impact in tropics will not change2. Impact in the extra-tropics may remain unchanged
(impact in flow regimes which change relatively fast)
Thermal wind relationship does not hold for 1, and is not accurate in 2
Higher horizontal resolution -> Less thinning of satellite data (AMSU-A,IASI)
! Would impact stratospheric wind analyses in the extra-tropics
! Conclusions in tropics should be robust
! Conclusions for ozone analyses (100 & 10 hPa) should not change
Caveats

Page 273rd WMO Workshop on the Impact of Various Observing Systems in NWP 9-12 Mar 2004
! Increasing importance of research satellite data: route to coupled GCM-CTM assimilation/chemical weather/pollution forecasting
! Strategies for assimilation of EO data: synergies; OSEs
! Future use of EO data & EO strategies: Space agency policies
! NWP developments: error covariances; use of research satellites; keep up with evolution of Global Observing System
! Importance of evaluating future (expensive) observing systems: OSSEs one way
Future/conclusions:

Page 283rd WMO Workshop on the Impact of Various Observing Systems in NWP 9-12 Mar 2004
Extra slides

Page 293rd WMO Workshop on the Impact of Various Observing Systems in NWP 9-12 Mar 2004
MOCAGE
Data from ENVISATData from GOME…
ARPEGE
Conventional dataOzone from Envisat
Chem. analyses3D ozone
Analyses met.U,V,T,q,surface
Chemical data : L2, later L1
Coupled dynamics/chemistry system

Page 303rd WMO Workshop on the Impact of Various Observing Systems in NWP 9-12 Mar 2004
Example of limb/nadir synergy:
UARS MLS
ERS-2 GOME
Courtesy UARS MLS web-site & ESA web-site

Page 313rd WMO Workshop on the Impact of Various Observing Systems in NWP 9-12 Mar 2004
Global map of ozone column amount 21 April 1997 12 GMTMLS ozone profile + GOME column ozone
(Dobson units: red high, blue low)

Page 323rd WMO Workshop on the Impact of Various Observing Systems in NWP 9-12 Mar 2004
Comparisons with HALOE ozoneHALOE - analysis
Coverage: approximately 50°S to 70°N
HALOE available
HALOE - UM matches
Bias (overestimate) in MIPAS analyses

Page 333rd WMO Workshop on the Impact of Various Observing Systems in NWP 9-12 Mar 2004
Comparisons v ozone sondes
Sonde - analysis: global
1000
100
10
1
Pressure/ hPa
1000
100
10
1
Pressure/ hPa
-2 -1 0 1 2 -2 -1 0 1 2
latitude bands
ppmv ppmv
South pole
Bias in MIPASanalyses

Page 343rd WMO Workshop on the Impact of Various Observing Systems in NWP 9-12 Mar 2004
Monitoring of GOMOS data
! Comparison area is30-60°N & 30-60°S
! GOMOS shows little bias compared to HALOE or sonde
GOMOS cal-val:

Page 353rd WMO Workshop on the Impact of Various Observing Systems in NWP 9-12 Mar 2004
MIPAS ozone – sonde
MIPAS shows only a small bias (max ~0.3ppmv) in the lower stratosphere when compared with sonde ozone.
Coincidence criteria are 400km, 6 hours, for data through September 2002

Page 363rd WMO Workshop on the Impact of Various Observing Systems in NWP 9-12 Mar 2004
September mean O-B for MIPAS ozone

Page 373rd WMO Workshop on the Impact of Various Observing Systems in NWP 9-12 Mar 2004
! The space agencies (ESA, NASA, NASDA and CSA) invest a lot of money on missions (e.g. ESA’s Envisat has cost ~ 1BEuros)! It is important to evaluate beforehand the possible benefits
of future missions, especially those involving satellites
Techniques for evaluating future missions:
! A technique often used by the space agencies is the “Observing System Simulation Experiment” (OSSE)
! Information content (e.g. Prunet et al. QJ 98, IASI)! OSSEs tend not be used as much by the met agencies
! This is due to the shortcomings of OSSEs, that make them less attractive to the met agencies
Future EO missions

Page 383rd WMO Workshop on the Impact of Various Observing Systems in NWP 9-12 Mar 2004
OSSE goal: evaluate if the difference P-T (measured objectively)is significantly smaller than the difference C-T
! Simulated atmosphere (“truth”; T) (using a model)! Simulated observations of instruments appropriate to the study,
including errors (using T)! Assimilation system (using a model)! Control experiment C (all observations except those under study)! Perturbation experiment P (all observations)
Structure of an OSSE

Page 393rd WMO Workshop on the Impact of Various Observing Systems in NWP 9-12 Mar 2004
Several aspects investigated (robustness):
•Tropical winds (focus on zonal-winds) SHOW RESULTS
•Wintertime variability (focus on winds)
•Brewer-Dobson circulation
SWIFT & science:

Page 403rd WMO Workshop on the Impact of Various Observing Systems in NWP 9-12 Mar 2004
Time series
Zonal-wind
10 hPa
Jan 2000
{P-T, C-T} <0
Shaded
Similar results
For April 2000
P-T
C-T
Impact of SWIFT winds
P-T smallerthan C-T

Page 413rd WMO Workshop on the Impact of Various Observing Systems in NWP 9-12 Mar 2004
Impact of SWIFT winds on zonal-windTropics:Significant (0.95 C.L.) (50 hPa -> 1 hPa) (cf thermal wind)
Extra-tropics:Possible (50 hPa -> 1 hPa)Impact larger when SWIFT observations availableImpact larger for regimes of variable flow (autumn, winter, spring)(Indirect information from the nadir temperature sounders, direct
information from sondes, is not sufficient to describe the winds in these cases)
Little or no impact at 100 hPa (SWIFT errors relatively high; other sources of information)

Page 423rd WMO Workshop on the Impact of Various Observing Systems in NWP 9-12 Mar 2004
850 KM
35 800 KmSUBSATELLITE POINT
GOMS (Russian Federation)
76E
MSG
(EUMETSAT) 63 E
MTSAT (Japan)
140E
FY-2 (China)
105E
GOES-E (USA) 75W
NPOESS (USA)
GOES-W (USA) 135W
GEOS
TATI
ONARY ORBIT
Global Earth Observing for the period 2008-2010