Embed Size (px)
Citation preview

Z S SEMU- RESEARCH REPORT
Impact of reducing loan by Ethiopian banks on their own performance
RESEARCH REPORT
Presented to the
Graduate School of Business Leadership
University of South Africa
In partial fulfillment of the requirements for the
MASTERS DEGREE IN BUSINESS LEADERSHIP
UNIVERSITY OF SOUTH AFRICA
By
ZEWDU SEYOUM SEMU
Student No 43091458
December 15, 2010

Z S SEMU- RESEARCH REPORT

Z S SEMU- RESEARCH REPORT
ABSTRACT
This study intends to assess the impact of reducing or restricting loan disbursement
on the performance of banks in Ethiopia. It also attempts to examine the possible
factors that compel the banks to reduce or restrict lending. Quantitative method
particularly survey design approach was adopted for the study. The survey was
conducted with individuals working in both private and state owned banks in Ethiopia
(assuming different positions) using self administered questionnaire. In addition, the
study used structured review of documents and/or records held by banks.
The findings of the study show that deposit and capital have statistically significant
relationship with banks’ performance measured in terms of return on equity (ROE).
New loan and liquidity have relationship with banks’ performance measured in terms
of both return on asset (ROA) and ROE. However, the relationship is found to be
statistically insignificant. Deposit and capital have no statistically significant
relationship with banks’ performance in terms of ROA.
The study suggests that when banks face lending constraints, they have to use their
funds like by purchasing treasury bills and bonds. Moreover, banks must develop
non-interest generating services. Excess cash maintained by banks should be used
by diversifying credit options and to avoid inefficiencies.
I

Z S SEMU- RESEARCH REPORT
ACKNOWLEDGEMENTS
A research report requires not only substantial commitment and personal sacrifice of
the researcher but also it depends on support and encouragement of many others
including family, colleagues and associates. I would like to express my appreciation
to the following persons for their suggestion, support and contribution.
First, I would like to thank my supervisor Dr. Wollela Abehodie for her assistance,
suggestion and guidance.
Then my heartfelt gratitude goes to my wife, Haymanot Tekola for her continuous
encouragement and my sons’ Dawit and Yonas for creating conducive environment
where I can focus on my study.
I also would like to thank to the staff and management of all the eleven banks in
Ethiopia for completing the research survey questionnaire and providing financial
data.
Last but not least I would like to thank Ms Almaz Asnake for her Secretarial service,
Mr. Naoed Mekonnen to his assistance in statistical works, Mr. Fikru Wakjira for her
editorial assistance and my company Ethiopia plastic share company for financial
sponsorship for MBL program.
ii

Z S SEMU- RESEARCH REPORT
TABLE OF CONTENTS Abstract ................................................................................................ i
Acknowledgments ...................................................................................... ii
Table of Contents ....................................................................................... iii
List of tables ............................................................................................... vi
List of figures .............................................................................................. vii
List of Acronyms/Abbreviations .................................................................. viii
CHAPTER 1: ORIENTATION .................................................................... 1
1.1. Problem statement .................................................................. 3
1.2. Objectives of the Study ........................................................... 4
1.3. Research questions /hypotheses/ ........................................... 4
1.4. Scope of the study ................................................................... 5
1.5. Limitation of the study ............................................................. 6
1.6. Importance of the study ........................................................... 6
1.7. Definitions ……………………………………………………………….7
1.8. Outline of the research report………………………………………… 7
CHAPTER 2: THEORETICAL FOUNDATION OF THE STUDY AND
BANKING IN ETHIOPIA…………………………………………… 9
2.1 Ethiopian banking industry ...................................................... 9
2.2 Theoretical review of banking ................................................... 13
2.2.1 Bank lending ................................................................. 13
2.2.2 Types of lending ........................................................... 17
2.2.3 Factor affecting bank lending…………………………… 19
iii
2.2.4 Performance measures in banks ................................... 21

Z S SEMU- RESEARCH REPORT
2.3 Summary ................................................................................. 23
CHAPTER 3: LITERATURE REVIEW ...................................................... 24
3.1 Bank lending ........................................................................... 24
3.2 Benefits of loan management .................................................. 26
3.3 Factors that limit lending ......................................................... 27
3.4 Impacts of reducing bank loans ............................................... 32
3.5 Performance measures in banking industry ............................ 33
3.6 Relation between lending and bank performance ................... 37
3.7 Previous related studies in Ethiopia ........................................ 37
3.8 Summary ................................................................................. 39
CHAPTER 4: RESEARCH DESIGN AND METHODS .......................... 41
4.1 Research problem, broad objective, research questions and
hypotheses ……………………………………………………… 41
4.2 Research approaches ................................................................ 42
4.2.1 Quantitative research approach ..................................... 43
4.2.2 Qualitative research approach ....................................... 43
4.2.3 Mixed research approach .............................................. 44
4.3 Method adopted ...................................................................... 45
4.3.1 Survey design ............................................................... 45
4.3.1.1 Sample design ............................................... 45
4.3.1.2 Instrument design and data collection method 47
4.3.1.3 Data analysis method ..................................... 48
4.3.2 Validity, reliability and Ethical issues............................. 49
4.3.2.1 Validity ........................................................... 49
iv
4.3.2.2 Reliability ........................................................ 50

Z S SEMU- RESEARCH REPORT
4.3.2.3 Ethical issues ................................................. 50
4.4 Summary and linkage between RQs, HPs and data source… 50
CHAPTER 5: RESEARCH RESULTS ....................................................... 53
5.1 Survey results ........................................................................... 53
5.1.1 Respondents profile ..................................................... 54
5.1.2 Factors that affect bank lending………………………… 56
5.1.3 Most important factor that affect lending ....................... 61
5.1.4 Impact of reducing or limiting lending on bank’s
Performance ............................................................. 62
5.1.5 Performance measurement in banking industry ........... 67
5.2 Documentary analysis ................................................................ 69
5.2.1 Impact on bank performance ....................................... 70
5.2.2 Comparison of state and private owned banks ............. 72
5.3 Summary of results .................................................................... 75
CHAPTER 6: DISCUISION, CONCLUSIONS AND RECOMMENDATION … 77
6.1 Discussion of research findings ................................................ 77
6.2 Conclusions .............................................................................. 82
6.3 Recommendations ................................................................... 83
REFERENCES……………………………………………………………. 85
APPENDEXES
Bank employees survey instrument (Appendix-1) …………… ………… 92
Banks financial data (Appendix-2)…………………………………… … 100
v
LIST OF TABLES

Z S SEMU- RESEARCH REPORT
Table 3.1 - Comparison of performance measures in banking loan
studies………………………………………….. ............... 36
Table 4.1 - Linkage between research questions, hypotheses
and data source……………………………………………… 51
Table 5.1 _ Survey response rate…………………………………….… 54
Table 5.2 _ Employment of respondents .......................................... 54
Table 5.3 – Working position of the respondents .............................. 55
Table 5.4 – Banking experience of the respondents ......................... 55
Table 5.5 – Bank lending experience of the respondents ................. 56
Table 5.6 – Factors that affect lending .............................................. 57
Table 5.7 – Respondents perception of factors that affect lending .. 60
Table 5.8 – Most important factor that affect lending ....................... 61
Table 5.9 – Impact that has the highest influence on banks perf. 62
Table 5.10– Impact on bank performance when they reduce lending 64
Table 5.11 - Respondents perception of impacts on banks perf. 66
Table 5.12- Descriptive statistics on banks financial data ................. 69
Table 5.13- Liquidity position of banks………………………………….. 70
Table 5.14- Regression of deposit, capital. . .ROA ......................... 71
Table 5.15- Regression of deposit, capital. . . ROE ........................ 71
Table 5.16- Comparison of mean between private and state owned
banks ............................................................................. 73
Table 5.17- Significance test on ownership of banks ........................ 74
Table 5.18 – Summary of regression analysis .................................. 76
vi

Z S SEMU- RESEARCH REPORT
LIST OF FIGURES
Figure 2.1 - The pool of funds model for asset management .......... 15
Figure 2.2- Asset allocation model for asset management……….. 16
Figure 5.1- Frequency distribution - Bank performance measurement 67
Figure 5.2- Frequency distribution - Lending performance measurement 68
vii

Z S SEMU- RESEARCH REPORT
LIST OF ACRONYMS/ABBREVATIONS
NBE National Bank of Ethiopia
SSA Sub-Saharan African
RQ Research Questions
ETB Ethiopian Birr
L/C Letter of Credit
ATM Automatic Tailor Machines
ROA Return on Asset
ROE Return on Equity
EVA Economic Value Added
CDs Certificate of Deposits
OLS Ordinary Least Square
K-S Kashyap and Stein
SME Small and Medium Enterprise
KSW Kashayap, Stein and Wilcox
NPL Non-Performance Loans
ROI Return on Investment
DEA Data Envelopment Analysis
CBE Commercial Bank of Ethiopia
HP Hypotheses
GDP Gross Domestic Product
AEBP Ability and Experience of Bank Personnel
CNAS Credit Need of Area Served
BOLS Bank overall Liability structure
NI Net Income
VAR Value at risk
viii

Z S SEMU- RESEARCH REPORT
1
CHAPTER ONE
ORIENTATION
Banks play an important function in the economy of any country. They are the
main intermediaries between those with excess money (depositors) and those
individuals and businesses with viable projects but requiring money for their
investment (creditors). Banks have at least the following functions: lending
money, depositing others’ money, transferring money locally or globally and
working as paying agent.
Today’s banks seek to earn income by lending money out at a higher interest
rate than they pay depositors for use of their money. Banks usually make loans
up to the point where they can no longer do so because of the reserve
requirement restriction. The banks required amount of reserves is equal to the
required reserve ratio times the total deposits in the bank (Case and Fair, 2007).
The banking industry considers lending as their most important function for
utilization of funds. Since the major portion of gross profit of the industry is
earned from loans; the administration of loan portfolios seriously affects the
profitability of banks (Wei-shong and Kuo-chung, 2006). Loan is equally
important for borrowers (the private sector in particular) as it remains to be the
most important external financing source. Hence the availability or constraint as
well as restriction on free access to loan affect both banks and borrowers.
Banks, insurance companies and micro-finance institutions are the major
financial institutions in Ethiopia. The sector is closed for non-Ethiopian citizens.
Proclamation No.592/2008 does not allow foreigners to own and operate banks
in Ethiopia. Hence presently there are no foreign banks operating in the country.
There have been conducive environment for the banking industry and other
financial institutions in Ethiopia. The number of banks operating in the country in
the fiscal year 2007/08 was eleven, of which eight were private and the
Z S SEMU- RESEARCH REPORT
2
remaining three state-owned (National bank of Ethiopia (NBE), 2007/08). During
the 2008/09 fiscal year banks operating in the country had a total of 636
branches which was an increase from 562 branches in the preceding fiscal year.
One branch of a bank on the average is estimated to serve 126,258 people in
Ethiopia. However, the high people to bank branch ratio indicated that Ethiopia
still remains as one of the under banked economies even by Sub -Saharan
African (SSA) countries standards. Despite Ethiopia is under banked economy
banks operating in the country have continued to show significant profits, to
widen their capital base, enhance resource mobilization and loan disbursement
efforts as well as reduce the level of non-performing loans (NBE- 2008/2009).
Banks restrict or limit their loan rendering because of many reasons. These
create problem to investors and business people in accomplishing their business
plans. On the other hand, from the banks side, loan is one of the principal
sources of income. If banks give limited or reduced loans to their customers,
their income will be reduced and the overall performance may be negatively
affected. Theoretically, there are many reasons why banks reduce or limit
lending. Some of these include liquidity problem, capital position, government
fiscal and monetary policies, and bank health (non performing loans).
This study attempts to look into the impact of reducing or limiting lending by
banks on their performance. The remaining part of this chapter is organized into
six sections. Section 1.1 presents problem statement, while sections 1.2 and 1.3
show the broad objectives of the study, research questions and hypotheses
respectively. The scope and limitations of the study are highlighted in sections
1.4 and 1.5 respectively. Importance of the study and definitions are discussed in
sections 1.6 and 1.7 respectively. Finally, the outline of the research is presented
in section 1.8.

Z S SEMU- RESEARCH REPORT
3
1.1 Problem statement
According to NBE (2007/08) the Ethiopian economy is growing rapidly. During
the fiscal year 2007/08 real gross domestic product (GDP) grew by 11.6 percent.
This high growth rate was achieved for the fifth time, which places Ethiopia
among the top performing economies in the SSA countries. The contribution of
the banking industry in this regard is expected to be significant by way of
enhancing investment through lending money to investors and the business
community.
However since 2007/2008 fiscal year, banks have reduced their loan
disbursement for different reasons. As a result of which investors and the
business community as a whole could not have adequate access to loan. Owner
managers of private business and executives of public enterprises complain
about constraint of loan facilities for investment in construction of factory and
business buildings, purchasing machineries, meeting working capital
requirements and expansion of their businesses. In addition, restrictions on bank
lending may have impact on banks performance which in turn would have its
own bearing on the growth of banks and their contribution to the poverty
reduction efforts of the Ethiopian government.
The restriction had significant impact on the overall performances of the banks.
Lending is the most important function of commercial banks. Its contribution to
asset and income portfolio is very high in the banking industry. Therefore, any
problem in lending like restricting or reducing loan is likely to have great impact
on the performance of banks. According to MacDonald and Koch (2006) lending
represents the heart of the banking industry. Loans are the dominant asset and
represent 50-75 percent of the total amount at most banks assets. Loans also
generate the largest share of operating income.
According to NBE, 2008/09 the share of banking sector (financial intermediary)
to the economy (GDP) of Ethiopia is about 2.7 percent in the fiscal year 2008/09.
The lack of stock market to raise finance makes business community dependent
on bank lending. Therefore, bank loan appears to be the most important source

Z S SEMU- RESEARCH REPORT
4
of finance for the business community and major revenue or operating income
generating asset of banks. Hence, reduction of loan by banks affects not only
their clients’ performance but also their own performance. Impacts on their
performance, in turn, imply that the problem is restraining their growth and
potential for helping the government’s efforts in poverty alleviation strategy.
These problems call for extensive research that aims at assessing the impacts of
restricting lending on banks’ performance.
1.2 Objective of the study
Since banks are the most important sources of external financing for private
business companies, bank lending has important contribution for the economic
growth of the country. Availability of bank lending is likely to create better
performance to banks as well as borrowers. On the contrary, restricting bank
loans may distress or negatively affect the operating performances of both.
The objective of this research is to identify factors that caused reduction of
lending and assess its impact on the performance of the banks.
1.3 Research Questions /Hypotheses/
To achieve the objective stated above, the researcher developed two
hypotheses (HP) and five research questions (RQ)
The principal profit making activity of commercial banks is making loans to its
customers (Reed and Gill, 1989). There is a relation between bank lending and
bank performance. By extending more loan banks can earn better profit or
record better performance. On the other hand, limiting lending may have a
negative impact on banks and borrowers performance.
Operating performance is positively related to loan quality and the asset size or
the banks market share and negatively related to liquidity, the loan ratio and the
banks age (Stalkouras, Mamatzakis and Filppaki, 2007).

Z S SEMU- RESEARCH REPORT
5
Considering the above co-relation, the following research hypotheses were
developed:
HP1 - There is relationship between liquidity, capital position (size), deposit, new
bank lending and bank performance (ROA).
HP2 - There is relationship between liquidity, capital position (size), deposit, new
bank lending and bank performance (ROE)
In addition, the following research questions were developed:
RQ1 – What type of impact banks face during loan reduction/limitation?
RQ2 – How do the Ethiopian banks prioritize the factors that affect lending?
RQ3 – How is the Ethiopian bank lending performance measured?
RQ4 – How banks relate their lending activity with their performance?
RQ5 – Is there a difference between private and state owned banks in terms of
lending and performance?
1.4 Scope of the study
The study covered all banks registered by the NBE and established before the
fiscal year 2007/2008. It also included all government and private banks
specifically all head offices and some systematically selected bank branches that
are located in Addis Ababa. This study focused on all types and amount of
lending.

Z S SEMU- RESEARCH REPORT
6
1.5 Limitation of the Study
Due to the confidential policy of banks, access to customer and banks
information except officially disclosed financial information, was not possible.
The study was limited to bank employees’ and officials’ personal perception and
officially disclosed financial data of banks.
The study focused on the impacts of reducing or limiting bank lending (for
various reasons) on banks’ performance. Because of resource constraint, the
study did not assess the impacts of limiting or restricting bank lending on
borrowers and other stakeholders’ performance.
1.6 Importance of the study
Banks are one of the contributors of a country’s growth through lending money to
investors and the business community. Most business people need bank loan
for various reasons such as investing on construction of factory and business
building, purchase of machineries, working capital and expansion of their
business. Limitation of bank lending created problems on business community to
accomplish their business plan.
Lending also has important function for commercial banks. Its contribution to
asset and income portfolio is very high in banking industry. Therefore, reducing
or restricting lending by banks has negative impact on both banks and borrowers
in particular and on the growth of the country’s economy in general.
Identifying what factors limit lending on banking industry and assessing what are
the most likely impacts that would occur when bank limit or restrict lending lead
to the finding of solutions for the problem. It is also necessary that bank
supervisory agency should always assess its policies and economic conditions
that impede the lending process and take corrective measures to stabilize the
economy. On the other hand, management of banks also make themselves
aware about the factors that affect lending and impacts on their performances
when lending reduction occurs for different reasons.

Z S SEMU- RESEARCH REPORT
7
The study also helps for further research in the area that is not covered in this
research i.e. factors like economic condition and monetary and fiscal policies. In
addition the study has significance to policy makers to take corrective measures
to tap the problem.
1.7 Definitions
National Bank of Ethiopia (NBE):- It is the reserve or central bank of Ethiopia.
According to proclamation No 591/2008 NBE establishment proclamation article
4 the purpose of the NBE is to maintain stable rate of price and exchange, to
foster a healthy financial system and undertake other relative activities that are
conducive to rapid economic development of Ethiopia. Its duties and
responsibilities include giving license and supervise banks, insurers and other
financial institutions.
Loan: - It is a type of debt. Like all debt instruments, a loan entails the
redistribution of financial assets over time between lender and the borrower.
Borrower: - is the one who borrows money from the lender (Bank).
Lending:- the provision of resources (granting loan) by one party to another
party where the second party doesn’t reimburse the first party immediately there
by generating a debt, and instead arranges either to repay or return those
resources a later date.
External financing: - is the phrase used to describe funds that firms obtain from
outside of the firm mainly for investment or working capital purposes.
Reserve requirements: - Regulation that sets the minimum reserves each bank
must hold to customer’s deposits and notes. The reserve ratio is sometimes
used as a tool in the monetary policy.

Z S SEMU- RESEARCH REPORT
8
1.8 Outline of the research report
The outline of the research report included the following chapters. Chapter one
discussed orientation of the study which included a brief overview of banking
industry in Ethiopia. The chapter also discussed Research questions, objectives,
limitation, scope and definition of the study. In chapter two theoretical foundation
of the study presented. This chapter included important issues related to the
study like banking as a whole, Ethiopian banking system, banking regulation in
Ethiopia, types of loan, factors that limit lending, relation between bank lending
and performances. Chapter three showed an exhaustive literature review
conducted on relevant studies. The review included previous research, surveys
and studies. Chapter four included research design, target population and
sample, data collection techniques, data analysis methods and measuring
instrument used. Chapter five presented research results. The last chapter
discussed summary of the research results and based on the results conclusions
and recommendations were given.

Z S SEMU- RESEARCH REPORT
9
CHAPTER TWO
THEORETICAL FOUNDATION OF THE STUDY AND
BANKING IN ETHIOPIA
Background information in respect of the research problem, broad objectives and
scope of the study were discussed in chapter one. This chapter presents the
theoretical foundation of the study and banking in Ethiopia. It is organized into
three sections. The first section 2.1 deals with the Ethiopian Banking industry.
This is followed by a discussion of theoretical review of banking in section 2.2.
This section includes subsections on bank lending, types of lending, factors
affecting bank lending, and performance measures in banks. Section 2.3
summarized the chapter.
2.1 Ethiopian banking industry
According to NBE (2008) the agreement that was reached in the year 1905
between Emperor Minilik of Ethiopia and Mr. Gillivray, representative of British
owned National Bank of Egypt, marked the establishment of The Bank of
Abyssinia, the first modern bank in Ethiopia. By the year 1931 the Bank of
Abyssina was legally replaced by Bank of Ethiopia shortly after Emperor Haile
Sellasie1 came to power. The new bank, Bank of Ethiopia, was a purely
Ethiopian institution and was the first indigenous bank in Africa (NBE, 2008).
After the Italian invasion in 1943 The State Bank of Ethiopia was established and
acted as the central bank of Ethiopia. The State Bank of Ethiopia was engaged
in both commercial and central banking activities. Then, later the Ethiopian
monetary and banking law that came into force in the year 1963 separated the
functions of commercial and central banking creating the National Bank of
Ethiopia and Commercial Bank of Ethiopia. The first private commercial Bank,
Addis Ababa Bank was established by Ethiopians and started its operation in the
year 1964 with a capital of Ethiopian Birr (ETB) 2 million in association with
1 Emperor Haile Sellasie regime was during the period 1931-1974.
Z S SEMU- RESEARCH REPORT
10
National and Grindlay Bank, London which had 40 percent of the total share
(NBE, 2008).
Further, as per the NBE (2008), following the declaration of command economy
by Dergue regime2 in 1974 the government extended its control and nationalized
all the three3 previously established private banks and merged into one bank.
After nationalization the Dergue regime also re-established Agricultural and
Industrial Development Bank. After the demise of the Dergue regime in 1991 that
ruled the country for 17 years under the rules of command economy, the new
government declared a free market economy. In line with this, monetary and
banking proclamation No 83/1994 and the licensing and supervision of banking
business No 84/1994 laid down the legal basis for investment in the banking
industry in the country (NBE, 2008).
Following the enactment of the banking legislations in the country in the 1990s, a
fairly good number of private banks have been established. For example, in the
2009/10 fiscal year the total number of banks already operational in the country
reached fourteen. Of these banks, eleven were private and the other three were
government owned. There is also a sign of interest in establishing other new
banks by different individuals and groups. Accordingly, at present, there are at
least four banks under the process of establishment. Currently commercial
banks work for profit and the NBE controls and gives license for commercial
banks.
Looking at the banking sector in Ethiopia further reveals that in the fiscal year
2007/2008 state owned banks absorbed about 47 percent of the market share
and 66.2 percent of the total capital in the industry. And the total number of bank
branches and their capital increased. The number of branches increased by 67
or 13.5 percent and total capital of the banking industry increased by ETB 1.1
billion or 12.2 percent (NBE, 2007/2008).
2 Dergue regime in Ethiopia was during the period 1974 to 1991
3 The three private banks were Addis Ababa bank, Banco di Roma and Banco di Napoli.

Z S SEMU- RESEARCH REPORT
11
Although the banking industry in Ethiopia has about hundred years of
experience, the sector is not yet developed and is still in its infancy or growing
stage. Currently, Ethiopian banks offer different types of services that include:
• Credit facility (lending) – some of the credit line offered by banks are
term loan (short and medium), letter of credit (L/C) facility, merchandise
loan, personal loan and overdraft,
• Deposit Service – Including saving deposit, fixed time deposit, demand
deposit and youth saving deposits,
• International banking services- Like opening L/C for importers, handling
incoming L/C for exporters, receiving and transferring foreign currency
payment by swift and handling incoming and outgoing international letter
of guarantee,
• Fund transfer – domestic and international money transfer and
• Other Services – few banks give services like Visa and Master card, and
automatic tailor machine (ATM) and safe box.
Banking is a highly regulated industry for a number of reasons. Some of the
reasons include protecting depositors’ fund, ensuring safety and stability of the
banking system, protecting safety of banks that means to limit credit to a single
borrower, and limiting or encouraging a particular kind of lending because of
expected impact on the economy. For these and other reasons, the Ethiopian
government issued the following Bank proclamations.
The first Banking proclamation is for the re-establishment of NBE (proclamation
No 591/2008). The proclamation sets out the purpose, powers and duties of the
national bank. According to Federal Democratic Republic of Ethiopia (FDRE,
2008) proclamation No 591/2008 the functions of NBE include:
• License and regulate banks, insurance companies and other financial
institutions in accordance with the relevant laws of Ethiopia,

Z S SEMU- RESEARCH REPORT
12
• Determine on the basis of assessing the received deposit, the amount of
assets to be held by banks. (reserve requirement),
• Issue directive governing credit transactions of banks and other financial
institutions, and
• Determine the rate of interest.
The Second proclamation is banking business proclamation (FDRE 2008)
proclamation No 592/2008.The proclamation sets the following banking business
issues:
• Requirement for obtaining license for banking business in Ethiopia,
• Prohibit foreign nationals or organizations fully or partially owned by
foreign national may not be allowed to open banks or branch offices,
Subsidiaries of foreign bank in Ethiopia or acquire the shares of
Ethiopian banks,
• Limitation of the acquisition of shares,
• Appointment of bank directors and officers
• Maintenance of required capital, legal reserve and adequate liquidity
and reserve balance,
• Limitations on certain transaction (investment),
• Inspection of banks, and
• Revocation of license.
Since the banking sector is highly regulated business and has great influence on
country’s economic development, the Ethiopian government issued new bank
regulations by considering current local and global business environment. The
government of Ethiopia with its financial controlling body (NBE) has changed
capital, minimum interest rate and reserve requirements. The purpose was to
establish a ground for the rapid economic development of the county, to stabilize
the price inflation and create healthy financial system in the country.
Z S SEMU- RESEARCH REPORT
13
According to the new banking regulations, the minimum paid up capital
requirement is ETB 75 million while the reserve requirement and the minimum
interest rate on saving and time deposits are respectively 15 percent and 4
percent (NBE, 1999; NBE, 2008; NBE, 2007).
2.2 Theoretical review of banking
This section discusses the theory of banking focusing on the lending component.
First, it presents bank lending focusing on its definition, source of lending and
asset management models. Secondly, types of bank lending along with bank
performance are presented.
2.2.1 Bank lending
Lending is the provision of resources (granting loan) by one party to another.
The second party doesn’t reimburse the first party immediately there by
generating a debt, and instead arranges either to repay or return those
resources at a later date. Banks function as financial intermediaries, collecting
funds from savers in the form of deposit and then supplying to borrowers as
loans. Those functions benefit both the banks and the borrowers.
One of the major functions of any commercial bank is providing loan to the
business society. Banks collect money from those who have excess money and
lend it to others who need money for different purpose. Therefore, banks
intermediary function play vital role in the economic activity. Athavale et al.
(undated) in their study in the U.S using firm growth model classified different
theories related to banks roles. The first theory assigns banks a unique role in
the resolution of information asymmetry means banks help financial market to
overcome asymmetric information by screening, contracting with and monitoring
borrowers. The second theory, monetary theory, assigns banks a unique role in
money creation and the transmission of monetary policy. In addition, they

Z S SEMU- RESEARCH REPORT
14
showed banks willingness and ability to lend. According to Athavale et al.
(undated) banks willingness depends on the project’s payoffs and a moral
rectitude of borrowers, while bank ability to lend depends on the adequacy of
banks capital and monetary policy.
Banks accept customer deposits and use those funds to give loans to other
customers or invest in other assets that will yield a return higher than the amount
bank pays the depositor (McCarthy et al., 2010). It follows that customers’
deposit is the primary source of bank loan and hence, increasing or
guaranteeing deposits directly has a positive effect on lending.
The principal profit- making activity of commercial banks is making loans to its
customers. In the allocation of funds to earn the loan portfolio, the primary
objective of bank management is to earn income while serving the credit needs
of its community (Reed and Gill, 1989). Lending represents the heart of the
industry. Loans are the dominant asset and represent 50-75 percent to total
amount at most banks, generate the largest share of operating income and
represent the banks greater risk exposure (Mac Donald and Koch, 2006).
Banks collect funds for lending and other purposes from different sources. These
funds need to be allocated to different banks’ assets. According to Reed and Gill
(1989) there are several approaches to allocate funds to banks assets:-
Z S SEMU- RESEARCH REPORT
15
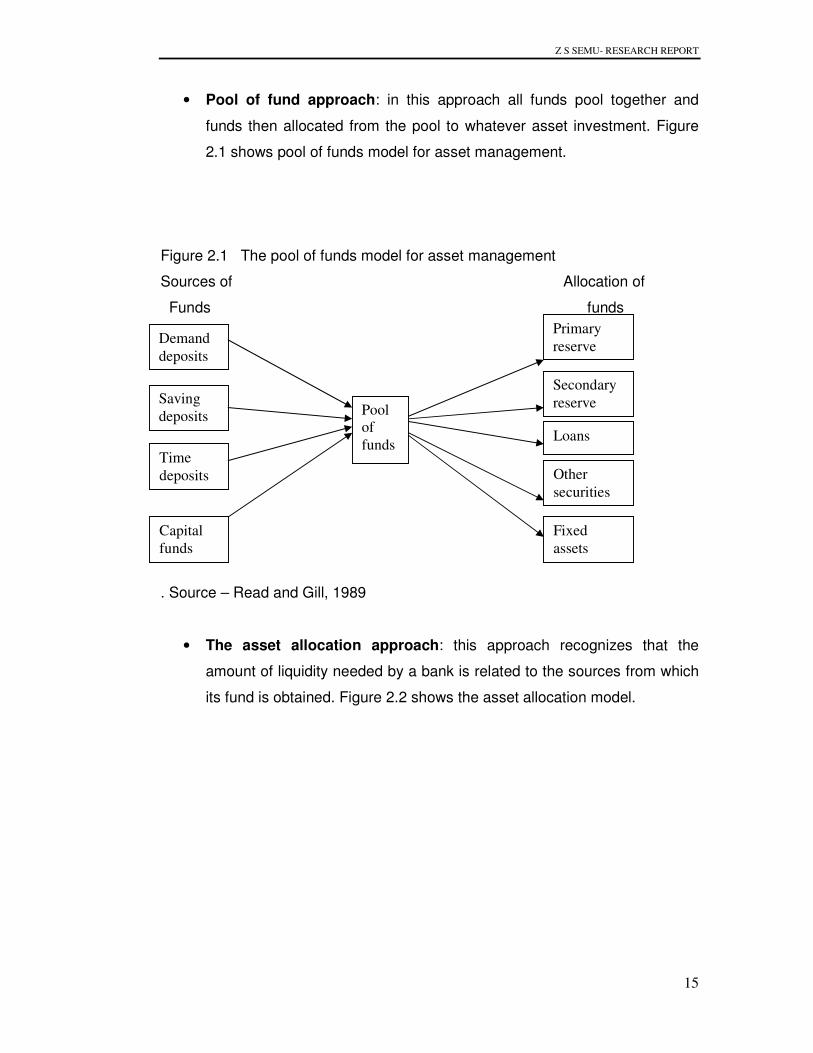
• Pool of fund approach: in this approach all funds pool together and
funds then allocated from the pool to whatever asset investment. Figure
2.1 shows pool of funds model for asset management.
Figure 2.1 The pool of funds model for asset management
Sources of Allocation of
Funds funds
. Source – Read and Gill, 1989
• The asset allocation approach: this approach recognizes that the
amount of liquidity needed by a bank is related to the sources from which
its fund is obtained. Figure 2.2 shows the asset allocation model.
Saving
deposits
Time
deposits
Capital
funds
Primary
reserve
Secondary
reserve
Loans
Other
securities
Fixed
assets
Pool
of
funds
Demand
deposits

Z S SEMU- RESEARCH REPORT
16
Figure 2.2 the asset allocation model for asset management.
Sources of funds from uses of fund allocated
Liquidity- profits center by liquidity – profits centre
Primary Reserves
Secondary Reserves
Loans
Other securities
Fixed asset
Source – Read and Gill, 1989
• The linear programming model: it combines the asset management
problem with the liability management problem and can incorporate both
profitability and liquidity constraints. The linear programming model
requires an explicit statement of an objective to be optimized.
Optimization, for example, may consist of maximization of profit or
minimization of costs.
Demand
deposits
Saving
deposits
Time
Deposits
Capital
fund

Z S SEMU- RESEARCH REPORT
17
• Asset-liability management model: it is the approach to the overall
balance sheet management. The model considered an approach
designed to control interest rate risk, but more precisely it is a method of
designing the makeup of assets and liabilities to ensure that their
composition provides the risk-return tradeoff deemed appropriate by
management.
2.2.2 Types of lending
As indicated in figure 2.1, commercial banks collect money from different
sources and allocate the money in different ways such as reserve, securities and
lending. Borrowers request banks for granting of loan for different purposes.
According to Read and Gill (1989) bank loans can be classified in a variety of
ways, including:-
• Purpose- use of the borrowing funds such as real estate, agriculture,
industry, and individual,
• Type of Security- secured loans involve the pledge of specific collateral
such as plant and equipment, real estate and warehouses,
• Maturity- classified according to the maturity of the loan such as short,
medium and long periods,
• Method of repayment- loans may be repaid in one go on lump sum basis
or on installments, and
• Origin - loan portfolios of commercial banks are derived principally from
sources such as directly from borrowers, purchase of notes from dealers
of consumer goods, loans originated by other banks and purchasing notes
from commercial paper dealers.

Z S SEMU- RESEARCH REPORT
18
Banking industry classifies loans according to purpose or use of proceeds. Some
authors who wrote in banking such as Mac Donald and Koch (2006), Campbell
et al. (1988) and Black and Daniel (1981) grouped loans into the following
categories based on the use of proceeds.
• Real estate loans: are loans secured by the real estate sector and
generally consist either of property loans secured by first mortgages or
interim construction loans.
• Commercial loans: consist of commercial and industrial loans, loans to
financial institutions, and obligations (other than securities) to states
and political sub-divisions. Commercial loans appear in many forms
but typically finance firms’ working capital needs, equipment
purchases and plant expansions.
• Individual loans: include those negotiated directly with individuals for
household, family and other personal expenditures, and those
obtained indirectly through the purchase of retail paper.
• Agricultural loans: appear in many forms but typically finance
agricultural production and include other loans to farmers.
• Other loans in domestic offices: include all other loans and all lease –
financing receivables in domestic offices.
• International loans: are essentially business loans and lease
receivables made to foreign enterprises or loans guaranteed by
foreign governments.
• State and political subdivisions: loans given to state and political
divisions for budget deficit and projects.
• Foreign banks: include individuals and business firms located abroad
and borrowed just like in local borrowers.
• Security loans: many firms hold substantial amount of securities that
can be pledged to secure business loans. The amount that bank will
loan on securities also depends largely on credit risk and marketability.
• Farmer’s loan: Loan for current expenses include loans made by
commercial banks for financing recurring seasonal expenses of crop
and feeder livestock production, such as seed, fertilizer, labor and fuel.

Z S SEMU- RESEARCH REPORT
19
The purpose of farmer intermediate term loan is to purchase asset that
will last several years such as livestock, machinery and property
improvement.
2.2.3 Factors affecting bank lending
The sources of fund for lending are reserve, deposits and capital. All these
sources may be affected by different factors and would have direct influence on
lending. Since lending is the principal function of banking industry, the
management of banks should give due attention, analyze and take the
necessary measures on time on internal and external factors that affect or limit
lending. Without lending banks’ incomes especially interest income would highly
deteriorate and affect the overall performance of banks.
According to Reed and Gill (1989) there are seven factors that influence banks’
loan policies, which in turn may have impact on the profitability of banks.
• Capital position - The capital of banks serves as a custom for protection of
depositors’ funds. The size of capital in relation to deposits influences the
amount of risk that a bank can afford. Relatively large capital structure
can make loans of longer maturities and greater credit risk.
• Risk and profitability of varies types of loans – Some banks may
emphasize earning more than others. Banks with greater need of earning
might adapt more aggressive lending policies. An aggressive policy might
call consumer loans, which normally are made at higher rates of interest
than short-term loans.
• Stability of deposits- The fluctuation and type of deposit must be
considered. After adequate provisions have been made for the primary
and secondary reserves, bank can then engage in lending. Even though,
these two reserves designed to take care of predictable deposit
fluctuations and loan demands, unpredictable demand force banks to give
consideration to the stability of deposits in formulating loan policy.

Z S SEMU- RESEARCH REPORT
20
• Economic conditions- Stable economy is more conducive to a liberal loan
policy than the one that is subject to seasonal and cyclical movements.
Deposit of famine economies fluctuate more violently than deposit in an
economy noted for its stability. Consideration must be given to the
national economy. Factors adversely affect the nation as a whole may, if
they are of serious magnitude, eventually affect local conditions.
• Influence of monetary and fiscal policies - If monetary and fiscal policies
are expansive and additional, reserves are made available to the
commercial banking system, the lending ability of banks is increased.
Under these policies banks can have a more liberal loan policy than
opposite situation exists.
• Ability and experience of bank personnel – The expertise of lending
personnel is not insignificant in the establishment of bank loan policy. One
of the probable reasons that banks were slow in entering the consumer
lending field was the lack of skilled personnel.
• Credit needs of the area served- banks specialized experience on
different types of loans e.g. Mortgage real-estate. The major reasons
banks are chartered is to serve the credit needs of their communities.
Banks are morally bound to extend credit to borrowers who present
logical and economically sound loan requests.
According to Black and Daniel (1989) there are also other factors that affect
bank lending and investing activities. These factors include:
• The interest rate or returns available from the various alternative lending
and investing activities. Fundamental problem of bank management is
achieving the proper balance between return and risk.
• The risk of loss associated with the various potential lending and investing
activities and the willingness of bank management to take risks. Interest
rate risk occurs because of the inverse relation between interest rate and
the market price of marketable securities.

Z S SEMU- RESEARCH REPORT
21
• The liquidity of fund tied up in varies lending and investing activities. To
maintain adequate liquidity, bank must constantly guard against excessive
losses from lending and investing activities. If bank made too many bad
loans, the value of its asset could fall below the amount of its liabilities. A
situation known as insolvency.
• Legal constraints regarding what are acceptable loans and investments.
State and federal banking laws also influence bank loan and investment
activities. Most of regulations are designated to ensure that banks do not
take undue risks in the use of their depositors’ funds.
• Characteristics of the banks overall liability structure -in this case, the
greater the proportion of a banks’ deposits that is made up of demand
deposits, the more volatile and uncertain will be the banks’ need for cash
to meet deposits withdrawals.
Theoretically, factors that limit bank lending can be classified into internal and
external factors. Based on the categories identified in Reed and Gill (1989) and
Black and Daniel (1989) the internal factors may include ability and experience
of bank personnel, liquidity and characteristics of liability structure while the rest
may be considered as external factors.
All the above factors that limit or affect bank lending may have their own impact
on bank performance. The discussion in the subsequent section focuses on
bank performance measurement.
2.2.4 Performance measures in banks
There are different methods used in assessing the performance of commercial
banks. Most widely used performance assessment method is financial
performance. However, today’s business environment needs additional type of
performance measurements.

Z S SEMU- RESEARCH REPORT
22
According to Popa et al. (2009) popular measures of bank performances are
return on assets (ROA), return on equity (ROE), net banking income and the
efficiency ratio. Apart from these popular measures which do not consider the
cost of equity capital employed, economic value added (EVA) is a modern
financial measurement tool that determines if the business is earning more than
its true cost of capital (Popa et al., 2009).
Financial performance measurements alone are insufficient. Financial indicators
are indeed important measures of strategic and tactical success. They can help
track bank wide and line of business performance. However, non-financial
measures can be equally important and are missing from most banks reporting
frameworks. Head count, new sales calls, time to market, loan processing time
and benchmarking are some examples of non-financial performance
measurements. Non-financial performance measures can help to identify
causes, rather than simply report effects (Karr, 2005)
According to Mac Donald and Koch (2006) a high performing bank is the one
that gives an exceptional return to share holders while maintaining an acceptable
level of risk. And aggregate bank profitability is measured and compared in
terms of ROE and ROA.

Z S SEMU- RESEARCH REPORT
23
2.3 Summary
This chapter presented the theoretical foundation on bank loan and the banking
industry in Ethiopia. The Ethiopian current banking system is dominated by
public banks and the private banks are entering to the industry in recent years.
Different types of services including lending are given by Ethiopian banks. To
regulate the banking industry the government issued two banking proclamations
in the year 2008.
The other issues discussed in this chapter include theory of bank lending,
sources and allocations of funds in the banking industry. Loans can be
categorized based on purpose, type of security, maturity, method of payment
and origin. Further, factors that limit lending like capital position, risk and
profitability of loans, stability of deposits, economic condition, monetary and
fiscal policies were discussed in detail. Banking performance measurements
were also discussed.

Z S SEMU- RESEARCH REPORT
24
CHAPTER THREE
LITERATURE REVIEW
The focus of chapter two was to give theoretical and conceptual foundation of
the study. This chapter presents the literature review focusing on the empirical
evidence on bank lending and performance. Accordingly, the first subsection, 3.1
presents the past and current issues on bank lending. The second subsection
3.2 discusses benefits of loan management. The next subsection 3.3 shows
factors that limit lending. Then subsection 3.4 discusses the impacts of reducing
or restricting bank lending. Subsection 3.5 presents performance measures in
banking industry and subsection 3.6 discusses the relation between lending and
bank performance. Finally, subsection 3.7 presents review of previous related
studies in Ethiopia.
3.1 Bank Lending
Cicfa and Hincu (2009) after analyzing different performance evaluation methods
and risks in Romania presented the usefulness of commercial banks. Bank
represents the core of the credit for any national economy. In turn, the credit
was found to be the engine that put in motion the financial flows that determine
growth and economic development of a nation. As a result, any efficiency in the
activities of commercial banks has special implication on the entire economy of
any country.
Loan is the most important asset of commercial banks. McCarthy et al. (2010)
described that for most of the 10 largest U.S banks in 2007 and 2008, loans
were the largest asset followed by investments. Their analysis focused primarily
on magnitudes and percentages of investments and loans of 10 largest banks.
They also showed that bank bailout and credit crunch could change the results
of the year 2009 recession.

Z S SEMU- RESEARCH REPORT
25
Webb (2000) in studying impacts of liquidity constraints on U.S banks indicated
that in a financial system where firms are primarily financed by bank debt, banks
are primarily financed by demand deposits. There can be a knock-on effect
where by depositors’ liquidity demand means that a bank faced with a shortage
of funds that the bank cannot lend to their corporate borrowers. In this study,
Webb (2000) indicated that bank liquidity problem temporarily solved by rationing
or insurance guarantee on deposit. However, the study did not consider role of
deposit insurance as a solution.
To create sustainability on deposits and alternative sources of loans, banks
created different solutions. The first method is using insurance guarantee for
deposits and second method is selling securities. Opiela (2008) showed that
banks with partial guarantees have a stronger loan response to monetary policy
than banks with full guarantees. Furthermore, the weak response of the fully
guaranteed banks attributed to their ability to raise low-reserve, uninsured time
deposits relative to partially covered banks in Poland. Keeton (1993) indicated
that the willingness of banks to fund loans by selling securities or issuing large
certificate of deposits (CDs) insulates bank lending from changes in deposits.
According to Van Zyl et al. (2009) in the year 2006 total net interest income
made up 56 percent of South African banks income while net non-interest
income accounted for 43 percent of their income. This appears to be in line with
other countries. For example commercial banks in the U.S shows that 41 percent
of banks total earnings come from non-interest sources in the year 2006 (Van
Zyl et al., 2009).
Rapid technological change and deregulation have caused banks to refocus their
activities dramatically with competition depressing margin in lending. The share
of non – interest income of commercial banks has more than tripled from less
than 10 percent of the total income in 1980 to over 25 percent in 1994 (Rajan,
1996). The study made in Germany showed that commercial banks understood
that traditional credit (lending) business has faced high competitive pressure. As
a result, credit profit margin was decreasing and profitability of lending became

Z S SEMU- RESEARCH REPORT
26
problematic. Therefore, banks saw lending as door opener for other transactions
or relationship, which banks believed, may be more advantageous (Ewert et al.,
2000).
Rajan (1996) and Ewaert et al. (2000) showed that recent trend in lending had
been shifted from traditional function of banks (lending) which produced less
margin to the new theory of commercial banking i.e. relationships banking.
Ahtiala (2005) noted that both banks and customers can utilize scope of
economies with relationship involving both liquidity provision and services.
Ownership of banks may have contribution in lending. Spaienza (2004) related
the effects of government ownership and bank lending. According to Spaienza
(2004), in the U.S.A, state owned banks charged lower interest rates than did
privately owned banks to similar or identical firms, even if, firms were able to
borrow more from privately owned banks. State owned banks mostly favored
large firms and firms located in depressed areas (Spaienza, 2004).
3.2 Benefits of loan management
Loan is a major asset, income source for banks, and risky area of the industry.
Moreover, its contribution to the growth of any country is very clear. Therefore,
managing loan in a proper way not only has positive effect on the banks
performance but also on the borrower firms and a country as a whole.
Any successful business must meet its customer needs and make a profit.
Likewise, successful financial institutions must meet the desperate needs of
depositors and borrowers. Depositors look for high rates, short terms and no
risk, while borrowers seek low rates and long terms. Financial institutions are
therefore, in the risk intermediation business. To be successful, financial
institutions, banks in particular, must properly underwrite risk, manage and
monitor the risk assumed (Barrickman, 1990).

Z S SEMU- RESEARCH REPORT
27
Sector wise lending should be considered by banks on giving priorities from firms
who request loan. Tang (2003) investigated the effect of sector-wise commercial
bank lending on Malaysian economic development using the Engle-Granger
approach to estimate a co-integrating regression by ordinary least square(OLS)
method and found that bank financing on general trading, manufacturing and
housing significantly promote the economic activity of the country. However
financing on agriculture and real- estate yields negative effect. Therefore, Tang
(2003) suggested that commercial banks should act as an efficient financial
intermediary which allocates the limited resources to the most productive uses in
Malaysian development.
The heart of any successful commercial lending function is credit discipline
written in loan policy, structured loan approval process and strong loan
administration function (Barrickman, 1990). In this regard, Waweru and Kalini
(2009) studied commercial banks crises in Kenya using statistical analysis.
Waweru and Kalini (2009) found the internal factors affecting non-performing
loans, which should be taken into consideration by bank management. These
factors include the procedures used in banks for credit risk assessment
particularly lack of proper skill amongst loan officials, speedy process of
evaluating loans mainly due to external pressure, high interest rate charged,
insider lending and owner concentration (Waweru and Kalini, 2009).
3.3 Factors affecting bank lending
As indicated in section 2.2.3, factors affecting bank lending may be classified
into internal and external factors. External factors include monetary policy, macro
environment and interest rates. Internal factors, on the other hand, include bank
size and capital, liquidity, bank healthy and management style of the banks.
Both internal and external factors studied by different scholars are reviewed in
the following paragraphs.

Z S SEMU- RESEARCH REPORT
28
Monetary contraction and interest rate increase reduce spending directly; both
also reduce spending indirectly by shrinking bank loan supply (Bernanke and
Blinder, 1988). Kashyap and Stein’s (2000) study in U.S.A noted that if
contraction monetary policy reduces loan supply, it would reduce more at banks
with less liquid balance sheet. The more liquid banks can protect their loan
portfolios by drawing down their buffer stock of cash and securities. To illustrate
this argument the study made in Turkey by Sengonol and Thorbecke (2005)
showed that contraction policy did reduce the supply of bank loan in Turkey.
Both Kashyap and Stein (2000) in the U.S.A and Senngnol and Thorbecke
(2005) in Turkey used kashyap - Stein (K-S) a two-step approach to test
monetary policy effects on loan supply. Keeton (1993) found that monetary
policy not only affect bank lending directly, by changing deposits, but also
indirectly, by changing the return on securities and the cost of CDs.
Baran and Smiljanic (2008) using survey design studied the effects of monetary
tightening and bank financing towards small and medium enterprise (SME) and
large companies in Croatia. This study showed that monetary tightening had
significantly influenced credit policies of commercial banks toward SME and
large companies. As per the study, the influence on SME was more significant
than on the large companies. One can understand from the above study that
monetary policy which is inclined to contraction policy affects more banks which
are less liquid. Reduce loan supply indirectly affect the return on securities and
influence both small, medium and with less significance on large companies.
Cadet (2008) also examined the linkage between monetary policy and banking
failure in developing countries using banking sector profit maximizing model.
Cadet (2008) found that despite treasury bills was one of the alternative source
of profit in developing countries, a tight monetary policy aggravated chances of
banks failure. Increase interest rate directly increased asymmetric information.
Therefore, an efficient bank should decrease its loan portfolio to overcome this
information. Based on this, Cadet (2009) recommended to policy makers at the
central banks that they should be highly concerned with adverse effects of
tightening monitory policy (banks failure). Monetary policy implemented to

Z S SEMU- RESEARCH REPORT
29
stabilize the price level may destabilize the banking sector if the increment of
interest rate is not moderate (Cadet, 2009).
When monetary policy becomes restrictive, banks have to reduce or stop new
lending because of decreasing reserve and hence deposits. Mostly, the source
of loans is depositors’ fund. When deposit decreased, it is not fully substitutable
by other financing possibilities like issuing bond, equity sales and CDs due to
credit market frictions on the depositors’ side (Stein, 1998).
There are opposite views that explain contraction of monitory policy does not
have impact on reserve and hence loan. The study made in the U.S.A by Oliner
and Rudebusch (1996) using Kashyap, Stein and Wilcox (KSW) (1993) style of
analysis revealed that monetary contractions did not constrict the supply of bank
loan relative to the supply of non-bank credit. Finally, they concluded that direct
link between a policy impacted reduction of bank reserves and bank lending had
very weak relation over the years 1974-1991.
To over-come liquidity problem, banks use other sources such as securities,
equity and CDs. Matz (2010) explained that the holding of highly marketable
securities as means of buffer that can be used when liquidity problems occur
until other standby sources of liquidity accessed. All the point raised in the
above paragraphs is from the lender (banker) point of view. If one sees the issue
from the borrowers’ side, firms should prepare themselves when restrictive
monetary policy implemented in the country. Valverde and Del Peso (2009)
analyzed the financing behavior of Spanish firms during 1992-2003 using KSW
model. Valverde and Del Peso (2009) found that firms having high liquid asset
might have an alternative means and could replace loan financing in case of tight
monetary policy conditions. Further, according to the study, higher liquidity
allowed firms to make investment in viable business or alternatives during such
periods.
Z S SEMU- RESEARCH REPORT
30
The other external factor limiting lending is macroeconomic environment.
Quagliariello (2009) used the portfolio model proposed by Baum et al. (2005)
and reported that macroeconomic in Italy was important determinant of banks
lending decisions and also was the cause of high disturbance in allocation of
financial resources. On the contrary to Quagliariello(2009), a study made in
Germany using value at risk (VAR) model showed that the response of loans to
aggregate supply, demand and monitory policy shock was rather weak and in
most cases insignificant ( Eickmeier et al., 2009).
Interest rate changes also have impact on lending. If central bank reduces the
rate, banks become reluctant to provide loan to firms. McKinnon (2009) noted
that by the end of the year 2008 the interest rate in U.S.A derived to zero and
interbank market became paralyzed. This led U.S.A banks to create huge
excess reserves and did not stimulate new lending to household and non bank
firms because of near to zero interest rates.
Despite banks are not profitable to give lending during interest rate declines,
firms and households on the other hand increased their demand to get credit.
The Economist Intelligence unit (1999) reported that in the U.S.A one of the
factors that increased the demand of credit in September to November 1998 was
interest rate cut by U.S.A Federal Reserve.
Capital requirement is also one of the external factors that affect lending.
According to Furlong (1992) in the 1990s bank regulation in general and capital
regulation in particular were widely perceived as having become stiffer. In New
England bank loan growth rates were positively related to capital to asset ratios.
Therefore, capital regulation had got big effect on bank lending (Furlong, 1992).
Z S SEMU- RESEARCH REPORT
31
Cumming and Nel (2005) using trend analysis studied about lending behavior-
preliminary finding on expected impact of Basel II4 in South Africa. This study
showed that the implementation of the 1988 Basel Accord raised the capital
adequacy ratio means raising additional capital which address the new accord
implementation that would decrease bank lending and bring economic
contraction. Kishan and Opilela (2000) tested bank loan supply shifts by
segregating bank according to asset size and capital coverage ratio in U.S A
using model of banks. Kishan and Opilela (2000) argued that bank asset size
and bank capital affect the ability of banks to raise funds and maintain loan
growth during contraction policy.
Internal factors that affect lending as stated previously are bank size, healthy
(distressed banks) and management style. Studies conducted on this issue are
shown in the next part of this sub section.
A study conducted in Austria on the effects of changes in monetary policy on
bank lending using modeling showed that smallest average bank size reveals
the strongest lending reaction when interest rate changes (Schnatter and
Kaufmann, 2006). Another study by Kishan and Opiela (2000) carried out in the
U.S.A on bank loan supply shifts revealed that small banks are most sensitive to
monetary policy. Large time deposits of small banks are unresponsive to policy.
This supported their hypothesis that small banks were not able to raise different
options of funds to finance loans during contraction policy (Kishan and Opiela,
2000).
Bank health is measured by capital adequacy and non- performing loans (NPLs).
Therefore, banks which have capital adequacy problem and high rate of NPLs
4 Basel II is the second of the Basel Accords, which are recommendation on banking laws and regulations
issued by the Basel committee on banking supervision. The purpose of Basel II is to create international
standard that banking regulators can use when creating regulations about how much capital banks need to
put aside to guard against the type of financial and operational risks banks face.

Z S SEMU- RESEARCH REPORT
32
decrease lending. Fukuda et al. (2006) investigated what impacts weakened
financial condition of banks in Japan and showed that regulatory capital
adequacy and ratio of non-performing loan had opposite impact on lending.
Banks credit culture and management also have impacts on lending. Henry
(1985) revealed that a bank credit culture binds together all related matter to
credit. The main credit cultures are policy, process and audit. Henry (1985) also
added other factors such as management tone, attention to fundamentals and
loan officer involvement.
To summarize, this section has reviewed the various studies on the factors
affecting bank lending i.e. Monetary policy, interest rate, Liquidity, macro
economy environment, capital requirement, size of the bank, non-performing
loans, credit culture, management and loan officer’s involvement.
3.4 Impacts of reducing bank loans
When contraction monetary policy implemented, banks use their excess reserve
to overcome or protect loan rendering. Kashyap and Stein (2000) argued that
banks utilize their buffer stocks of cash and securities to protect their loan
portfolio. Quagliariello (2009) pointed out that at a time banks operating in a
risky environment they can invest deposits in loan and bonds i.e. investment on
bonds is risk free.
Webb (2001) revealed that when there is liquidity constraint; banks are forced to
ration loans to better borrowers. Webb (2001) further noted that banks even
may not able to render new loans to borrowers if withdrawals by depositors are
too high. From Kashyape and Stean (2000), Quaglliariello (2009) and Webb
(2001), it can be noted that reducing loan impacted on banks in the area of
utilizing buffer stock of cash, invest limited deposits on bonds rather than on
loans and ration loans to better borrowers only.

Z S SEMU- RESEARCH REPORT
33
Cadet’s (2009) studied that tightening monetary policy created increase in
interest rate in developing countries, this impacted that loan portfolio should be
null and created banking crisis. Cadet (2009) added that despite treasury bills
was one of the optional source of profit in developing countries, a tightening
monetary policy increased the chance of banks failure.
3.5 Performance measures in the banking industry
Shong and Chung (2006) conducted research to solve problem on overdue
loans and bad debt as well as establish international performance measure of
banks using value added approach. Shong and Chung (2006) showed that
traditionally banks used operating efficiency to measure their banks profitability.
These profitability measures are return on equity (ROE), return on asset (ROA)
and return on investment (ROI). Also banks used operational measurement
such as monetary output per staff number and operating expenses per unit of
output (Shong and Chung, 2006). Popa et al. (2009) studied introduction and
implementation of EVA to Rumanian banks. This study compared with other
performance indicators and showed that popular measures of bank performance
are ROA, ROE, net banking income and the efficiency ratios.
To show weaknesses of traditional performance measures such as (ROE), Karr
(2005) revealed that going beyond ROE provides more insight into performance.
Therefore, the complete measurement should show the drivers of ROE and net
income after capital cost performance. Grasing (2002) described the efforts of
the Nolan Company to develop benchmarks for commercial banks involving
many of the top performing banks. The purpose of establishing the
benchmarked banks was to establish drivers of high performance.
Benchmarked performance measures used by commercial banks are cost per
each completed loan, the cost per thousand dollars of loans, the non-interest

Z S SEMU- RESEARCH REPORT
34
revenue from each loan per each thousand dollars, the total number of loans per
employee and the dollar amount of loan per employee (Grasing, 2002).
Performance measures such as ROA and ROE are financial performance
measures and traditional. Some studies describe the need of non-financial and
modern measures. Karr (2005) described that financial measures alone are
insufficient; they are indeed important performance measure for strategic and
tactical success. They also help to track bank wide and line of business
performance. However, non-financial measures can be equally important and
are not included in the reports of most banks. Karr (2005) argued that non-
financial measures can also help to identify causes rather than simply report
effects.
In 1990, banks widely adopted data envelopment analysis (DEA) as the principal
way of evaluating banks’ efficiency (Shong and Chung, 2006). DEA is a linear-
programming method initially developed by Charnes et al. (1978) to measure the
comparative performance of homogeneous organizations. Another recently
developed financial measurement is EVA which determines if a business is
earning more than its true cost of capital. EVA considers the cost of equity
capital employed, whereas other traditional measurements do not (Popa et al.
2009).
Stalkoura et al. (2007) examined the operating performance of South Eastern
European banking industry using different dependent and explanatory variables.
The dependent variable was total operating expense divided by total assets to
form a per unit cost measure. The explanatory variables included ratio of loans
to total assets, the ratio of loan reserves to gross loans, the ratio of loans to total
assets, the ratio of loan loss reserves to gross loans, the ratio of cash due from
banks to total assets, the ratio of equity to total assets, the ratio of bank deposits
to customer and short-term funding, a variable capturing bank age, and total
asset to counts for size effects or alternatively a bank’s market share to capture
market power. Furthermore, these authors indicated that accounting ratios were
highly correlated with efficiency.

Z S SEMU- RESEARCH REPORT
35
As indicated earlier in this section most authors such as Shong and Chung
(2006), Grasing (2002), Karr (2005) and Stalkoura et al. (2007) described
financial and similar performance measures even though the depth differs. DEA
and EVA on the other hand are recently utilized performance measures by
banks. Table 3.1 shows performance measures proposed by different scholars.
Their performance measures are compared with the characteristics based on
final versus internal measures, monetary versus non-monetary measures and
the degree of aggregate.

Z S SEMU- RESEARCH REPORT
36
Table 3.1 Comparison of performance measures in banking loan studies Characteristic of performance measures Authors Performance measures Final vs. internal
measure Monetary vs. non-monetary measure
Degree of aggregate
Sherman and Gold (1985) Ferrier and Lovell (1990) Berg et al (1993) Thanassoulis (1999) Zenios et al (1999) Golany and Storbeck (1999)
Efficiency ratios (percent) Final Non-monetary Highest
Kantor and Maital (1999) Efficiency ratios (percent) Final Non-monetary Highest Grasing (2002) the Nolan Employees to commercial banking Final Non-monetary Low Company Employees Non-monetary The number of loans per employee Monetary The cost per loan in thousands Monetary The non-interest revenue per loan in Monetary Thousands Monetary Loans in millions per employee Monetary Total expense to total commercial
banking expense
Boucher (1996) Quarterly loan sales Final Monetary Low Perro and Ruoff (1997) Operating fees Final Monetary Low Interest income Interest expense Operating expense Loss revenue Unexpected losses Source: Shong and Chung, 2006.

Z S SEMU- RESEARCH REPORT
37
3.6 Relation between lending and bank performance
Lending is the major source of income of banks and covers a lion’s share of their assets.
Its performance would have a direct effect on banks profit and survival in the
competition. Staikouras et al. (2007) studied that operating performance is positively
related to loan quality and negatively related to liquidity, which is the source of fund for
most commercial loans.
Because of external and internal reasons some loans given to customers may not be
collected on time and sometimes borrowers default to pay the full amount of the loan.
The non-performing loans decrease performance and finally lead to crisis or failure to
banks (Waweru and Kalani 2009).
The theories and the previous research describe lending (traditional income source of
banks) is the major source of income to the banking industry. However, opposing
arguments by Rajan (1996) showed that competition decreases profit margin of lending.
This study revealed that non-interest income of commercial banks has increased by
more than triple from less than 10 percent of total income in 1980 to over 25 percent in
1994. This idea is supported by Round table (1996) and it is noted that bank managers
expected the share of non-interest (non-traditional) business to increase to 50 percent
by the turn of the millennium.
3.7 Previous related studies in Ethiopia
Some related studies were conducted by different researchers in Ethiopia. Specifically,
Worku (2006) argued that liquidity has an impact on the performance of commercial
banks in Ethiopia and there is an inverse relation between deposit/net loan and ROE.
And the coefficient of liquid asset to total asset is positive and directly related with ROE.
Worku (2006) also studied capital adequacy and found that the capital adequacy of all
banks in Ethiopia were above threshold, means there is sufficient capital that can cover

Z S SEMU- RESEARCH REPORT
38
the risk-weighted assets. Depositors who deposit their money in all banks are safe
because all the studied banks fulfilled NBE requirement (Worku, 2006). Worku used
different ratios when analyzing liquidity effect on banks performance and these ratios
were liquid asset/net profit, liquid asset/total assets, net loans/net deposits, interest
income/net deposit and interest income/interest expense (Worku, 2006).
Performance measures used to evaluate the performance of banks in Ethiopia are
similar to those studies conducted in other countries. Hazen (2005) studied performance
of banks in Ethiopia using ROE, ROA and asset utilization ratios and found that all
commercial banks in Ethiopia were making profit. It was encouraging for the banking
businesses. Seyoum (2005) revealed that private banks performance in terms of
managerial earning and operating efficiency was an average and less than that of the
biggest government bank i.e. Commercial Bank of Ethiopia (CBE). Seyoum(2005) also
noted that in Ethiopia the banking sector was still dominated by state owned banks
especially CBE, no stiff competition and compared performance of banks using
managerial earning and operating efficiency. Berhanu (2004) studied financial
performance of Ethiopian commercial banks and found the following results. The
banking system in general increased their assets position, private banks increased their
market share, and liquidity condition of commercial banks was reliable. Finally
commercial banks were operating at profit. Berhanu (2004) used profitability ratios and
liquidity ratios to evaluate financial performance of commercial banks in Ethiopia.
Ayalew (2005) used ratio analysis with the help of DEA model and the ratios were
capital ratio, liquidity ratio and loan loss provision to total assets when studied the
financial performance of private banks in Ethiopia. The study revealed that banks were
becoming leveraged, the growth of deposits from depositors increased, efficiency was
also increased from year to year. Generally, Ayalew (2005) concluded that the growth
rate was positively related to efficiency scores.

Z S SEMU- RESEARCH REPORT
39
3.8 Summary
This chapter reviewed literatures relevant to bank lending, benefits of loan management,
factors that limit lending, impact of reducing bank loan, performance measures in
banking industry and relation between lending, bank performance and previous
researches in Ethiopia.
A good number of studies were conducted on factors that limit lending, banks
performance and lending, and performance measures of banks. These past studies
showed that monetary contraction, interest rate, macro environment, bank size, capital
requirement, liquidity, bank health and management have impacts on lending.
Research also showed that banks lending performance was measured in traditional and
modern ways. Traditional ways were ROE, ROA, ROI, net banking income, efficiency
ratios, benchmarking, cost per each completed loan, cost per thousand dollar of loans,
total number of loans per employees. The modern performance measures were DEA
and EVA. Impacts of reducing or restricting loans were also studied and these impacts
were utilizing buffer stock of cash and securities, rationing loans, reduced loan from
asset portfolio and create banking crisis or failure.
Most of the literature reviewed in this study focused on the developed countries’ banking
sector. Although such types of research were done in developing countries limited
literatures were available for this research.
Previous study directly related to this research i.e. impact of loan reduction on banks
performance in Ethiopia, to the knowledge of the researcher, is not found. There were
researches made in Ethiopia related to bank, however most of the studies were only
evaluating performance of commercial banks except Worku (2006) who tried to show
liquidity effect on performance of commercial banks in the country.

Z S SEMU- RESEARCH REPORT
40
Researches made in Ethiopia had their own limitation. Most researches focused on
evaluation of bank performance, instead of ``emphasizing on cause and effect
relationships .i.e. what caused good or bad bank performance. The analyses were also
made using comparison of banks’ performance one another. Therefore, this researcher
tried to fill-in the gap by examining the factors that affect lending in Ethiopia.
The next chapter presents the research methodology used to meet the objective of this
research project.

Z S SEMU- RESEARCH REPORT
41
CHAPTER FOUR
RESEARCH DESIGN AND METHODS
The preceding chapter presented the review of the existing evidence on factors affecting
the financial performance of banks and identified the knowledge gap. This chapter
discusses the research design. The chapter is organized in four sections. The first
subsection 4.1 presents the research problem along with the broad research objective
and research hypotheses and questions. Subsection 4.2 discusses the research
approaches while subsection 4.3 presents the method adopted in the study. Finally,
conclusions and the link between research questions and hypotheses, and the different
data sources are presented in subsection 4.4.
4.1. Research problem, broad objective, research questions and hypotheses
Banks are one of the contributors of the growth through lending money for business,
investors and households. Restricting or limiting bank lending may cause problem or
difficulty to those who need loan to accomplish their plans. Therefore, reducing or
restricting lending by banks may have negative impact on both banks and borrowers in
particular as well as growth of the country in general. As already shown in the first
chapter, the broad objective of this research was to identify factors that limit lending and
assess the impacts of reducing or limiting loan by banks on their own performance.

Z S SEMU- RESEARCH REPORT
42
The researcher developed the following research hypotheses:
HP1 - There is a relationship between liquidity, capital position (size), deposit,
new bank lending and bank performance (ROA).
HP2 - There Is a relationship between liquidity, capital position (size), deposit,
new bank lending and bank performance (ROE)
In addition, the following research questions were developed:
RQ1 – What type of impacts banks face during loan reduction/limitation?
RQ2 – How do the Ethiopian banks prioritize the factors that affect lending?
RQ3 – How is the Ethiopian bank lending performance measured?
RQ4 – How banks relate their lending activity with their performance?
RQ5 – Is there a difference between private and state owned banks in terms of
lending and performance?
4.2 Research approaches
According to Leedy and Ormrod (2005) research methodology is a means to extract the
meaning of data. Data and methodology are highly interdependent. Therefore, the
methodology to be used for a particular research problem must always take into
consideration about the nature of data that will be collected to resolve the research
problem.

Z S SEMU- RESEARCH REPORT
43
There are three types of research approaches namely, quantitative, qualitative and
mixed methods approach (Leedy and Ormrod, 2005).The following discussions briefly
presents the basic features of these research approaches.
4.2.1 Quantitative research approach
This approach is used to answer question about relationships among measured
variables with the purpose of explaining, predicting and controlling phenomenon.
Quantitative studies represent the mainstream approach to research and structured
guidelines exist. Variables, hypotheses and methods of measurement tend to be defined
before the study begins and remain the same throughout. In this approach the
researcher identifies one or few variables that they intend to study and collect data
related to those variables.
Quantitative research approach has two strategies of inquiry. The first is survey design
which provides a quantitative or numeric description of trends, attitude or opinion of a
population by studying a sample of that population. From the sample the researcher
generalizes about the population. The second type of design is experimental design
used to test the effect of intervention on an outcome, controlling all other factors which
may influence that outcome. In experiment design researcher may also identify a sample
and generalize to a population (Cresweell, 2009).The analysis is made based on
deductive reasoning, beginning with certain theory or hypotheses and drawing logical
conclusions from it. Formal, impersonal and scientific type of reporting is common. The
weakness of this approach is, if the study is made in laboratory, the difficulty to
generalize in the real world.
4.2.2 Qualitative research approach
According to Leedy Ormrod (2005) this approach is used to answer questions about the
complex nature of phenomena and its purpose is describing and understanding the
phenomena. The qualitative research process is more holistic with specific focus on;
design measuring instruments and interpretation developing possibly change along the

Z S SEMU- RESEARCH REPORT
44
way. The approach operates under assumption that reality is not easily divided into
discrete and measurable variables.
Qualitative research approach has five common strategies of inquiry. The strategies
include case study, ethnography, phenomenological study, grounded theory and content
analysis (Leedy and Ormrod, 2005). The approach makes considerable use of inductive
reasoning. Under this approach, many specific observations will be made to draw
inferences about larger and general phenomenon while personal and literary style
language will be used when reporting the findings. The major weakness of this approach
is that findings may be so specific to particular context that they cannot be generalized
to other context.
4.2.3 Mixed research approach
The mixed methods research approach is used when the researcher combines elements
of both quantitative and qualitative approaches. Quantitative and qualitative research
design (Mixed) is appropriate for answering different kinds of questions. When we use
mixed approach we learn more about the research problem.
During mixed research approach both quantitative and qualitative data are collected to
answer a single research question. Historical research strategy is largely qualitative
endeavor although historical researchers often make use of quantitative data as well
(Leedy and Ormorod, 2005).
Considering the research problem and objective shown in the first subsection along with
the philosophy of the different research approaches, quantitative research approach was
found to be appropriate for this study. The following section hence presents the method
adopted in the study.

Z S SEMU- RESEARCH REPORT
45
4.3 Methods adopted
The purpose of this study is to identify impact of loan reduction on bank performance
and assess why commercial bank reduce lending. As it can be seen from the research
problem it is more explanatory type and tries to answer the relationship between loan
and performance of banks. Therefore, categorizing this research in quantitative research
design is more appropriate. According to Leedy and Ormord (2005) survey research is a
common method used in business. Therefore, from quantitative research strategies the
researcher used survey research method.
4.3.1 Survey design
” Survey research involves acquiring information about one or more group of people-
perhaps about their characteristics, opinions, attitudes, or previous experiences-by
asking them questions and tabulating their answers. The ultimate goal is to learn about
a large population by surveying a sample of that population.” (Leedy and Ormord, 2005
p.183).
The purpose of survey research is to generalize from the sample to the population so
that inferences can be made about some characteristic, attitude or behavior of the
population (Creswell.2009). The researcher selects survey design because of budget
and time constraint i.e. economy of the design. The data collection included self-
administered questionnaires and structured record reviews (documentary analysis) to
collect financial information
4.3.1.1 Sample design
The target population would be all banks registered by NBE and under operation during
2007/2008 fiscal year.
Sample size is determined by time and budget of the researcher. Because of time and
budget constraint, the sample was restricted to head offices, and bank branches
residing in Addis Ababa. According to NBE (2008) 38 percent of bank branches and all
head offices of banks which operate in Ethiopia found in Addis Ababa. The sample size

Z S SEMU- RESEARCH REPORT
46
for self-administered questionnaires was 150 employees of banks and delivered
physically to all targeted categories. Financial information of all banks collected from
head offices of each bank and the NBE.
Although it is difficult to generalize from project to project because of resource
availability in terms of time, money and personnel availability, as the rule of thumb the
sample should be large enough so that there are 100 or more units in each category of
major breakdown and a minimum of 20-50 in minor breakdown (Diamantopoulost and
Schlegelmich, 2000). According to Fowler (1986) the appropriateness of any sample
design feature can be evaluated only in the context of the overall survey objectives. The
important point for the researcher is to be aware of the potential costs and benefits of
the options and weigh them in terms of the main purpose of the study.
The most appropriate type of sampling design for this research would be a non-
probability purposive sampling method. Purposive sampling where the researcher
selects the sample on his particular purpose for instance the researcher may choose
people who represent diverse perspective and knowledge on the issue (Leedy and
Ormrod, 2005). According to Diamantopoulost and Schlegelmilch( 2000) purposive
sampling is used when sample members are chosen with specific purpose or objective
in mind. In this study purposive sampling method was adopted because bank lending
process practiced by few employees but not all bank employees and officials.
The sample selection based on the following process – first NBE supervision directorate,
all banks head office credit departments and bank branches in Addis Ababa were
targeted. Bank branches were then proportionally selected according to the number of
branches found in Addis Ababa (the bank which had more branches got more chances
to be surveyed). Then, three employees from each branch who are involved in lending
such as experts, customer relation managers, branch managers, deputy managers and
loan officers were selected and covered by the survey.
Z S SEMU- RESEARCH REPORT
47
4.3.1.2 Instrument design and data collection method
Both primary and secondary data used in the study to perform statistical analysis and
reach to some conclusions. This researcher collected data using self-administered
survey questionnaire method (see appendix 1). The questionnaires (paper- pencil
format) distributed physically in person to the survey participants and follow-up calls
were made to provide feedback, clarification and remainder.
UNISA –SBL Ethiopia regional office wrote a letter of cooperation to all concerned
parties to gain acceptance and positively assist the researcher (appendix-1). Then
covering letter which described the purpose of the research, prepared and attached with
questionnaire. The self- administered questionnaire was classified into three parts. The
first part of the questions 1-5 designed to collect participants’ profile.
The second part which included questions 6-20 in the questionnaire was related to
factors that limit bank lending. The first question 6 designed to show the most important
factor that affect lending compared with other five factors. Questions 7-20 show a rating
(a five- point scale) in each factor that affect lending. A rating 1 indicated a highly
important, 2 important, 3 Neutral (don’t know), 4 slightly important and 5 not important
factor.
The third part of questionnaire which includes questions 21-26 was related to the impact
of reducing or limiting bank lending. Question 21 designed to show the impacts that
have highest influence on bank performance when they reduce or limit bank lending
compared with other 4 impacts. The other questions 22-26 designed to show a rating
on five point scale on each type of impacts on bank performance. A rating 1 indicated a
very high impact, 2 moderate impact, 3 neutral (don’t know), 4 low impact and 5 no
impact. The last part of the questionnaire 27-31 designed to show bank performance
measurement and related questions.

Z S SEMU- RESEARCH REPORT
48
In addition, to make financial performance analysis the researcher needed financial
information from each bank. The data collection form was structured review format.
Financial information of all banks (secondary data) that help to analyze performance of
banks needed. This data was annual financial audit report. The financial data collected/
obtained from each bank and NBE.
4.3.1.3 Data analysis method
There are different types of inferential statistical techniques or procedures used in
quantitative research approach and their usage varies based on purpose and
appropriateness for each research situation.
This study has variables such as ROA, ROE, liquidity, and capital. These variables are
ratio scale and expected to fall in normal distributions. Therefore, parametric statistics is
more appropriate. From parametric statistical techniques multiple regressions is again
suitable to this research. Because this research problem was to examine how effectively
one or more independent variables such as liquidity, capital and deposit allow the
researcher to predict the value of another dependent variable such as ROA and ROE
( Leedey and ormord,2005).
The regression analysis used the following equation:
ROA = α +β (LQ) +β (CP) +β (DP) + β (NL)
ROE = α +β (LQ) +β (CP) +β (DP) + β (NL)
Where:
ROA – Return on Asset
ROE - Return on Equity
LQ – Liquidity
CP – Capital
DP – Deposit

Z S SEMU- RESEARCH REPORT
49
NL - New Loan
α - Error term
β - Slope of Coefficient
The study used Microsoft Excel for analyzing questionnaire survey results. And
statistical package for the social sciences (SPSS) and STATA were used for
documentary analysis.
4.3.2 Validity, reliability and ethical issues
Validity and reliability of the research measurement instruments influence, first the
extent that you can learn from the phenomena of the study. Second the probability that
one will obtain statistical significance in data analysis and third the extent to which one
can bring meaningful conclusion from the collected data. Most ethical issues in research
fall into one of the four categories: protection from harm, informal consent, right to
privacy and honesty with professional colleagues (Leedy and Ormrod, 2005).
4.3.2.1 Validity
Diamantopoulos and Schlegelmilch (2000, p33-35) wrote on different types of validity
and what it measure: “Validity indicates the extent to which a particular measures is free
from both systematic and random error. From the different types of validity measure face
validity which depend on the judgment of the researcher and content validity which relies
on the content of the study i.e. how accurate the measuring instrument (questionnaire)
bring the data which require to effectively finish the study will be given special
consideration’’.
To ensure face validity the researcher performed multi method approach i.e. two or more
different characteristics measured using two or more different approaches. To ensure
content validity the target groups included in sample represented the one who know
better about the issue being investigated.

Z S SEMU- RESEARCH REPORT
50
4.3.2.2 Reliability
According to Leedy and Ormrod (2005) reliability of a measurement instrument is the
extent to which it yields consistent results when the characteristic being measured has
not been changed. To ensure the reliability of measurement instrument the researcher
performed first standardize the instrument from one person or situation to another.
Second specific criteria established to reduce subjective judgments.
4.3.2.3 Ethical Issues
Due consideration was given to obtain consent from each participant about their
participation in the study. It was strictly voluntary. The researcher respected participant
right and privacy. The findings of the research were presented without any deviation of
the reality. The researcher has given full acknowledgements to all the reference
materials used for the study. Covering letter (appendix 1) also prepared and attached
with questionnaires. This assured the confidentiality of the responses and the
participation of the respondents was voluntary.
4.4 Summary and link between RQs, HPs and data sources
Linkage between research questions, hypotheses and variables on the one hand and
different data sources on the other hand presented in table 4.1. Self-administered
questionnaires and structured review format were used as a tool for data collection.
Financial information collected from each bank was used for testing the hypotheses.
Problem statement and hypotheses were discussed in this chapter. Quantitative
approach more specifically survey research design was adopted in this study. The
sample size was 150 and the participants were bank employees in Addis Ababa.
Quantitative analysis and descriptive and inferential statistics would be used in data
interpretation.
Links between research questions/hypotheses and variables on the one hand and
different data sources on the other hand are presented in table 4.1 below.

Z S SEMU- RESEARCH REPORT
51
Table 4.1 Link between research questions, hypotheses, variables and the different data sources
Research Questions Variable Name Data Sources
What type of impacts bank
face during loan reduction/
limitation -RQ1
Impacts on bank
performance
Survey questions
21-26
How do the Ethiopian banks
prioritize the factors that affect
lend -RQ2
Factor that limit lending
Survey questions
from 6-20
How is the Ethiopia bank
lending performance
measured-RQ3
Variables-ROA,ROE Survey questions
from 30-31
How banks relate their lending
activity with their performance
RQ4
Dependent variable:-
ROA&ROE
Independent Variable
- Liquidity
- Capital
- Deposit
- New loan
disbursement
Data from
Financial
Statements of
banks
Is there difference between
private and state owned banks
in terms of lending and
performance-RQ5
Variable
- Liquidity
- ROA
- ROE
- New loan
disbursement
Data from
Financial
Statements of
banks
There is relationship between
liquidity, capital, deposit, new
loan and Bank performance
(ROA)- HP1
Dependent variable-ROA
Independent Variable
- Liquidity
- Capital
- Deposit
Data from
Financial
Statements of
banks

Z S SEMU- RESEARCH REPORT
52
-New loan disbursement
There is relationship between
liquidity, capital, deposit, new
loan and Bank performance
(ROE)- HP2
Dependent variable-ROE
Independent Variable
- Liquidity
- Capital
- Deposit
- New loan
disbursement
Data from
Financial
Statements of
banks

Z S SEMU- RESEARCH REPORT
53
CHAPTER FIVE
RESEARCH RESULTS
The previous chapters presented the orientation of the study, theoretical foundations,
literature review and the research methods adopted in the study. This chapter presents
the results. As discussed in the preceding chapter this study aimed at examining the
impacts of reducing or restricting loans by banks on their own performances and also
assessing the factors limiting bank lending
This chapter tries to present the results of the survey. The chapter is organized into
three sections. The first section 5.1 discusses survey results and the second section 5.2
presents documentary analysis. The last section 5.3 summarizes the results.
5.1 Survey results
The questionnaire was distributed to NBE, banking supervision directorate and nine
private and state owned banks headquarters. With respect to branches, 37 bank
branches of the eleven banks covered in the study were included.
The questionnaire was physically distributed to 150 employees (whose positions related
to bank lending) of all banks in Ethiopia registered before 2007/08. Out of 150
questionnaires 86 were completed and collected. As the result the response rate was
57.3 percent. According to Fowler (1986) researcher or survey organization differ
considerably in the extent to which they devote time and money to improve response
rate. Thus, there is no agreed-upon standard for a minimum acceptable response rate.

Z S SEMU- RESEARCH REPORT
54
Table 5.1 Survey response rate
Sample size
150
Completed and returned questionnaires 86
Response rate 57.3%
Source: Survey outcome and own computation
5.1.1 Respondents’ profile
In respect to employment, 70 percent of survey respondents were employed in private
banks. The rest 30 percent were employed in government owned banks
Table 5.2 Employment of respondents.
Employment
Frequency Relative frequency
(%)
Cumulative frequency
Cumulative frequency
(%) Private banks 60 70 60 70
State owned banks 26 30 86 100
Source: Survey outcome and own computation
When we see the positions in banking sector the large group or 35 percent of
respondents were bank loan officers. The second largest numbers about 20 percent of
respondents were analysts. About 2 percent of the respondents were deputy branch
managers (Table 5.3).

Z S SEMU- RESEARCH REPORT
55
Table 5.3 Working position of the respondents
Working positions
Frequency Relative frequency
(%)
Cumulative frequency
Cumulative frequency
(%)
Expert 11 13 11 13
Analyst 17 20 28 33
Customer relation manager 10 12 38 45
Loan officer 30 35 68 80
Branch manager 8 9 76 89
Deputy branch Manager 2 2 78 91
Others 8 9 86 100
Source: Survey outcome and own computation
In respect to experience, 43 percent of survey respondents indicated that they had 6-10
years of banking experience. The second larger number of respondents, 34 percent,
had banking experience from 1-5 years. About 9 percent of respondents indicated that
they had greater than 15 years of banking experience (Table 5.4).
Table 5.4 Banking experience of the respondents
Banking experience
Frequency Relative frequency
(%)
Cumulative frequency
Cumulative frequency
(%)
1-5 years 29 34 29 34
6-10 years 37 43 66 77
11-15 years 12 14 78 91
>15 years 8 9 86 100
Source: Survey outcome and own computation
Similarly, in terms of lending experience about 61 percent of respondents had 1-5 years
of experience in bank lending while 30 percent had 6-10 years. Only 3 percent of the
respondents had greater than 15 years of bank lending experience.

Z S SEMU- RESEARCH REPORT
56
Table 5.5 Bank lending experience of the respondents
Bank lending experience
Frequency Relative frequency
(%)
Cumulative frequency
Cumulative frequency
(%)
1-5 years 48 61 48 61
6-10 years 24 30 72 91
11-15 years 5 6 77 97
>15 years 2 3 79 100
Source: Survey outcome and own computation
5.1.2 Factors that affect bank lending
Table 5.6 shows descriptive statistics in respect to the factors that affect bank lending.
The mean, that measure the central tendency of data, showed that 10 out of 13 factors
were from 1.66 - 2.52. This shows the respondents perception that, more or less the
listed factors were the most likely factors that affect bank lending in Ethiopia. The factor
that recorded the highest mean was interest rate while the lowest was liquidity.
The variability of factors measured in terms of standard deviation also showed that 9 out
of 13 factors standard deviations fallen between 0.68-0.99 which showed similar
variability between the factors that affect bank lending. The most variable factor was
interest rate and the least variable factor was economic condition.
Table 5.6 also shows Kurtosis which explains about the flatness or peakness of
distribution of factors. The result showed that leptokurtic (more peaked) distribution of
factors. Skewness which reflects the symmetry in distribution showed that the
distributions of factors that affect bank lending were positively skewed.
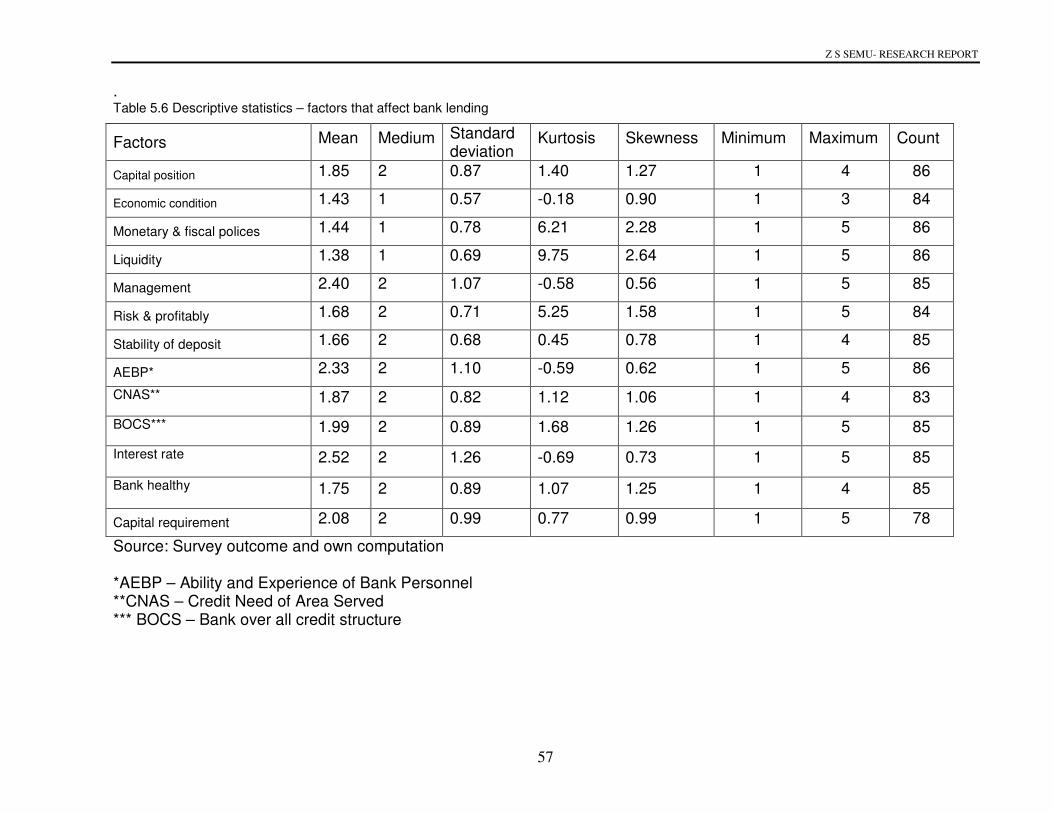
Z S SEMU- RESEARCH REPORT
57
. Table 5.6 Descriptive statistics – factors that affect bank lending
Factors Mean Medium Standard deviation
Kurtosis Skewness Minimum Maximum Count
Capital position 1.85 2 0.87 1.40 1.27 1 4 86
Economic condition 1.43 1 0.57 -0.18 0.90 1 3 84
Monetary & fiscal polices 1.44 1 0.78 6.21 2.28 1 5 86
Liquidity 1.38 1 0.69 9.75 2.64 1 5 86
Management 2.40 2 1.07 -0.58 0.56 1 5 85
Risk & profitably 1.68 2 0.71 5.25 1.58 1 5 84
Stability of deposit 1.66 2 0.68 0.45 0.78 1 4 85
AEBP* 2.33 2 1.10 -0.59 0.62 1 5 86
CNAS**
1.87 2 0.82 1.12 1.06 1 4 83
BOCS***
1.99 2 0.89 1.68 1.26 1 5 85
Interest rate
2.52 2 1.26 -0.69 0.73 1 5 85
Bank healthy
1.75 2 0.89 1.07 1.25 1 4 85
Capital requirement 2.08 2 0.99 0.77 0.99 1 5 78
Source: Survey outcome and own computation *AEBP – Ability and Experience of Bank Personnel **CNAS – Credit Need of Area Served *** BOCS – Bank over all credit structure
Z S SEMU- RESEARCH REPORT
58
The following discussions reveal the results in respect to factors affecting bank
lending. The descriptive statistics on the various factors and the perception of
respondents on the importance of each factor are summarized and presented in
tables 5.6 and 5.7.
• Capital position- This factor’s average (mean) rating of 1.85 is moderate
compared to that of other factors. The standard deviation 0.87 and range 3
showed that there was moderate variability of rating scores. The highest rating
on the factor indicated by the respondents’ was important.
• Economic condition- This factor average rating was 1.43 it is the second
lowest of all average rating of factors that affect lending. The standard
deviation 0.57 and range of 2 showed low variability in rating scores. The
highest rating on the factor indicated by the respondents’ was very important.
• Monetary and fiscal policies- This factor mean was 1.44 and ranked the
third lowest average score. The standard deviation 0.78 showed low variability
of scores. The highest rating on the factor by the respondents’ was very
important.
• Liquidity of banks- The factor mean was 1.38 and ranked the lowest average
score. The standard deviation 0.69 indicated low variability in scores. The
highest rating on the factor by the respondents’ was very important.
• Management- This factor mean was 2.40 and ranked the second highest
score that affect bank lending. The standard deviation 1.07 indicated very high
variability in scores. The highest rating on the factor by the respondents’ was
important.
• Risk and profitability of loans- This factor mean was 1.68 and it was
moderate. The standard deviation of 0.71 indicated low variability on scores.
The highest rating on the factor by respondents’ was important.

Z S SEMU- RESEARCH REPORT
59
• Stability of deposits- This factor mean was1.66 and it was moderate. The
standard deviation 0.68 and range of 3 showed low variability in rating scores.
The highest rating on the factor indicated by the respondents’ was important.
• Ability and experience of bank personnel- This factor mean was 2.33 and
ranked the third highest score that affect bank lending. The standard deviation
1.10 and range 4 indicated very high variability in scores. The highest rating
on the factor by the respondents’ was important.
.
• Credit need of the area served- This factor mean was 1.87 and it was
moderate. The standard deviation 0.82 and range of 3 showed moderate
variability in rating scores. The highest rating on the factor indicated by the
respondents’ was important.
• Bank overall liability structure- This factor mean was 1.99 and it was
moderate. The standard deviation 0.89 showed moderate variability in rating
scores. The highest rating on the factor indicated by the respondents’ was
important.
• Interest rate- This factor mean was 2.52 and ranked the first highest score
that affect bank lending. The standard deviation 1.26 and range 4 indicated
very high variability in scores. The highest rating on the factor by the
respondents’ was important.
.
• Bank healthy- This factor mean was 1.75 and it was moderate. The standard
deviation 0.89 and range 3 showed moderate variability in rating scores. The
highest rating on the factor indicated by the respondents’ was very important.
• Capital requirement- This factor mean was 2.08 and ranked the fourth
highest score that affect bank lending. The standard deviation 0.99 indicated
moderate variability in scores. The highest rating on the factor by the
respondents’ was important.

Z S SEMU- RESEARCH REPORT
60
Table 5.7 shows respondents perception on each factor that affects bank lending.
Each factor rated on five-point scale. The result showed that all the thirteen factors
were considered by the respondents’ very important and important for bank lending.
Table 5.7- Respondents perception of factors that affect lending
Factors that affect lending
Very important
%
Important %
Neutral (don’t) know
%
Slightly important
%
Not important
%
Average perception
Ranking (1-13)
Capital position 36 53 0 11 0 Important 7
Economic Condition 61 36 3 0 0 Very
Important
3
Monetary and fiscal policies
67 26 4 2 1 Very Important
2
Liquidity of banks 69 28 1 1 1 Very Important
1
Management 19 46 14 19 2 Important 12 Risk and profitability of loans
42 52 4 1 1 Important 6
Stability of deposits 45 46 8 1 0 Important 5
Ability and experience of bank personnel
23 44 12 19 2 Important 11
Credit need of the area served
34
53 6 7 0 Important 8
Bank over all liability structure
27
59 4 9 1 Important 10
Interest rates 19 47 8 15 11 Important 12 Bank healthy 46 41 5 8 0 Very
Important 4
Capital requirement 29 46 14 8 3 Important 9
Source: Survey outcome and own computation
From the results above, all the factors that affect lending have relevance in Ethiopian
banks. On average, none of the factor had been considered not important, slightly
important or neutral. Four of thirteen factors received an average perception by
respondents as very important while the remaining nine factors received an average
perception of respondents as being important.

Z S SEMU- RESEARCH REPORT
61
Therefore, as per the perception of the respondents factors that affect bank lending
in the Ethiopian banking sector considered as very important were the following:
• Liquidity of banks
• Monetary and fiscal policies
• Economic conditions and
• Bank healthy (Non-performing loans)
5.1.3 Most important factors that affect bank lending
About 39 percent of respondents in the survey gave priority for monetary and fiscal
policies as the most important factor that affect bank lending. The second most
important factor, about 30 percent, was liquidity of banks. The least most important
about 1 percent, was management. Table 5.8 depicted the distribution of
respondents in terms of the most important factor that affect bank lending.
Table 5.8 Most important factor that affect bank lending
Factors Frequency Relative frequency
(%)
Cumulative frequency
Cumulative frequency
(%) Capital position 9 11 9 11
Economic condition 16 19 25 30
Liquidity of banks 25 30 50 60
Monetary and fiscal policies 33 39 83 99
Management 1 1 84 100
Source: Survey outcomes and own computation

Z S SEMU- RESEARCH REPORT
62
5.1.4 Impacts of reducing or limiting loans on banks’ performance
About 35 percent of survey respondents gave priority for decrease profit or increase
losses as the most likely impact on bank performance when banks reduce or limit
lending. The second, about 33 percent, most likely impact on bank performance was
increase a chance of bank failure. Table 5.9 summarizes the respondents’ views
about the most likely impact that had highest influence on bank performance.
Table 5.9 Impacts that have the highest influence on bank performance
Impacts Frequency Relative frequency (%)
Cumulative frequency
Cumulative frequency (%)
Bank uses their excess
reserve, stock and
securities to protect their
loan portfolio
8
10
8
10
Ration loan to better
borrowers Increase a
chance of bank failure
26 33 34 43
Invest deposits on
treasury bills, bonds or
securities rather than
loan.
8
10
42
53
Decrease profit or
increase losses
27 35 69 88
Increase a chance of
bank failure
9 12 78 100
Source: Survey outcomes and own computation
Table 5.10 shows descriptive statistics for impacts on bank performance when they
reduce or limit lending. The mean of all impacts was from 1.78-2.53. Respondents
reflected that all impacts were either very highly or moderately affected bank
performance. This was supported by mode results i.e. all the five impacts were very
high and moderate.

Z S SEMU- RESEARCH REPORT
63
The variability of all impacts falling between 0.95-1.26 that implies there was similar
variability between the impacts that affect bank performances. The most important
impacts considered by the respondents were banks use their excess reserve, stock
and securities to protect their loan portfolio and increase a chance of bank failure.
And the least impact was investing deposits on treasury bills, bonds or securities
rather than loan. Table 5.10 also showed that the distribution of impacts was
platykurtic (less peaked) and negatively skewed.

Z S SEMU- RESEARCH REPORT
64
Table 5.10 Descriptive statistics - Impacts on banks performance when they reduce or limit lending
Impacts Mean Mode Median Standard
deviation Kurtosis Skewness Range Minimum Maximum Count
Bank uses their excess reserve, stock and securities
to protect their loan portfolio 2.53 2 2 1.26 -0.93 0.49 4 1 5 81
Ration loan to better borrower 1.83 1 1.5 1.09 1.43 1.45 4 1 5 80
Invest deposits on treasury bills, bonds or securities
rather than loan 2.31 2 2 0.95 -0.74 0.33 3 1 4 80
Decrease profit or increase losses 1.78 1 2 0.98 1.97 1.46 4 1 5 80
Increase a chance of bank failure 2.53 2 2 1.26 0.92 0.44 4 1 5 79
Source: Survey outcome and own computation

Z S SEMU- RESEARCH REPORT
65
The following brief discussion presents the results in relation to impact of reducing
lending on bank performance.The statstical results and the perception of
respondents with regard to the level (very high to no impact) of the impacts are
summerized and presented in tables 5.10 and 5.11 respectively.
• Banks uses their excess reserve, stock of cash and securities to protect
their loan portfolio- This impact average (mean) rating was 2.53 and the first
highest mean compared with other factors. The standard deviation of 1.26 and
range of 4 showed that there was very high variability of rating scores. The
highest rating on the impact indicated by the respondents was moderate.
• Ration loan to better borrowers- This impact mean was 1.83 and ranked the
second lowest score. The standard deviation 1.09 indicated high variability in
scores. The highest rating on the impact by the respondents was very high.
• Invest deposits on treasury bills, bonds or securities rather that loan.
The average rating 2.31 is second highest of all average rating of impact on
bank performance. The standard deviation of 0.95 indicated very low
variability in scores. The highest rating on the impact by the respondents was
very high.
• Decrease profit or increase losses- This impact mean was 1.78 and
ranked the lowest average score. The standard deviation 0.98 indicated low
variability in scores. The highest rating on the impact by the respondents was
very high.
• Increase a chance of bank failure- This impact mean was 2.53 and another
first highest mean compared with other factors. The standard deviation 1.26
and range 4 showed that there was very high variability of rating scores. The
highest rating on the impact indicated by the respondents was moderate.
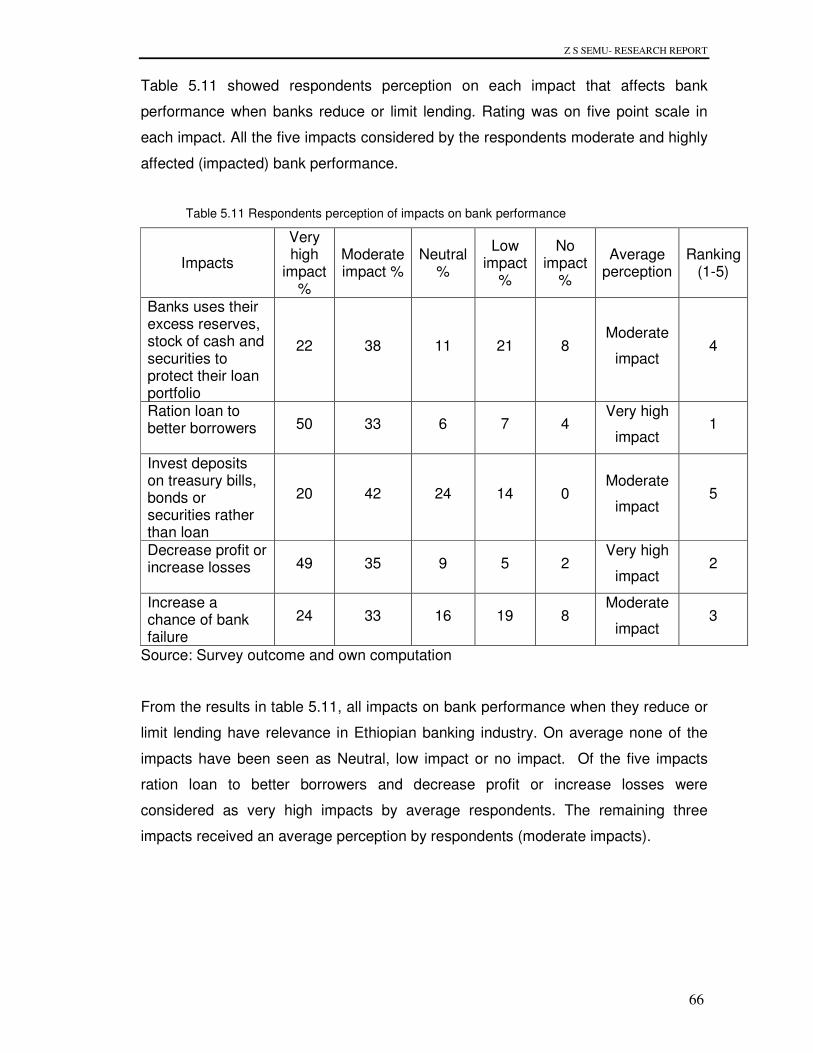
Z S SEMU- RESEARCH REPORT
66
Table 5.11 showed respondents perception on each impact that affects bank
performance when banks reduce or limit lending. Rating was on five point scale in
each impact. All the five impacts considered by the respondents moderate and highly
affected (impacted) bank performance.
Table 5.11 Respondents perception of impacts on bank performance
Impacts
Very high
impact %
Moderate impact %
Neutral %
Low impact
%
No impact
%
Average perception
Ranking (1-5)
Banks uses their excess reserves, stock of cash and securities to protect their loan portfolio
22 38 11 21 8 Moderate
impact 4
Ration loan to better borrowers 50 33 6 7 4
Very high
impact 1
Invest deposits on treasury bills, bonds or securities rather than loan
20 42 24 14 0 Moderate
impact 5
Decrease profit or increase losses 49 35 9 5 2
Very high
impact 2
Increase a chance of bank failure
24 33 16 19 8 Moderate
impact 3
Source: Survey outcome and own computation
From the results in table 5.11, all impacts on bank performance when they reduce or
limit lending have relevance in Ethiopian banking industry. On average none of the
impacts have been seen as Neutral, low impact or no impact. Of the five impacts
ration loan to better borrowers and decrease profit or increase losses were
considered as very high impacts by average respondents. The remaining three
impacts received an average perception by respondents (moderate impacts).

Z S SEMU- RESEARCH REPORT
67
Therefore, as per the perception of respondents, impact of reducing or limiting
lending on banks’ performance that were considered as very high include:
• Ration loan to better borrowers, and
• Decrease profit or increase losses.
5.1.5 Performance measurement in banking industry.
In respect to performance measurement in the banking industry, about 55 percent of
respondents indicated that return on asset (ROA) was the most applicable
performance measurement in the Ethiopian banking industry. Return on equity (ROE)
and net income (NI) which scored 14 percent each equally perceived as the second
performance measurement. Data envelopment analysis (DEA) was the least
performance measurement in the banking sector. See figure 5.1 below about
distribution of bank performance measurements.
Figure 5.1 Frequency distribution: Bank performance measurement
Source: survey outcome and own computation
ROA
55%
ROE
14%
ROI
12%
NI
14%
DEA
1%EVA
4%

Z S SEMU- RESEARCH REPORT
68
Loans to Total Asset Ratio
73%
Ratio of Loan Reserve to
Gross Loan
6%
Cost per Loan
0%
Non-Interest Revenu per
Loan
0%
Loan in Million Birr per
Employee
0%
Number of Loan per
Employee
0%
Interest Income
5%
NPL
16%
Survey results revealed that loans to total assets ratio which scored 73 percent was
the most applicable measurement of bank lending in Ethiopia. The ratio of loan
reserve to gross loans (6 percent) and interest income (5 percent) were respectively
the third and fourth applicable lending measurements. None of the respondents
selected the cost per loan, the non interest revenue per loan, loans in million ETB per
employee and the number of loan per employee as applicable lending
measurements. On the other hand, 16 percent of respondents noted that non-
performing loans (NPL) was the second performance measurement of bank lending
in the Ethiopian banking sector. See figure 5.2 below about distribution of bank
lending performance measurements.
Figure 5.2 Frequency distribution: lending performance measurement
Source: Survey outcome and own computation
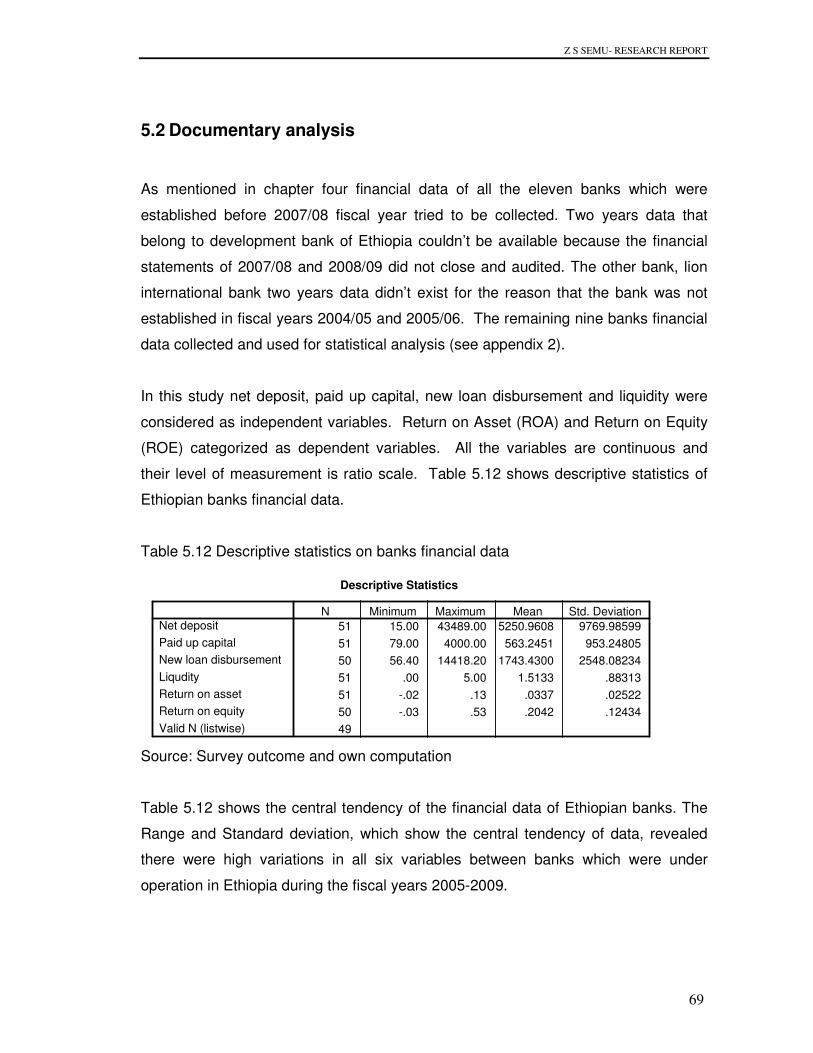
Z S SEMU- RESEARCH REPORT
69
5.2 Documentary analysis
As mentioned in chapter four financial data of all the eleven banks which were
established before 2007/08 fiscal year tried to be collected. Two years data that
belong to development bank of Ethiopia couldn’t be available because the financial
statements of 2007/08 and 2008/09 did not close and audited. The other bank, lion
international bank two years data didn’t exist for the reason that the bank was not
established in fiscal years 2004/05 and 2005/06. The remaining nine banks financial
data collected and used for statistical analysis (see appendix 2).
In this study net deposit, paid up capital, new loan disbursement and liquidity were
considered as independent variables. Return on Asset (ROA) and Return on Equity
(ROE) categorized as dependent variables. All the variables are continuous and
their level of measurement is ratio scale. Table 5.12 shows descriptive statistics of
Ethiopian banks financial data.
Table 5.12 Descriptive statistics on banks financial data
Source: Survey outcome and own computation
Table 5.12 shows the central tendency of the financial data of Ethiopian banks. The
Range and Standard deviation, which show the central tendency of data, revealed
there were high variations in all six variables between banks which were under
operation in Ethiopia during the fiscal years 2005-2009.
Descriptive Statistics
51 15.00 43489.00 5250.9608 9769.98599
51 79.00 4000.00 563.2451 953.24805
50 56.40 14418.20 1743.4300 2548.08234
51 .00 5.00 1.5133 .88313
51 -.02 .13 .0337 .02522
50 -.03 .53 .2042 .12434
49
Net deposit
Paid up capital
New loan disbursement
Liqudity
Return on asset
Return on equity
Valid N (listwise)
N Minimum Maximum Mean Std. Deviation
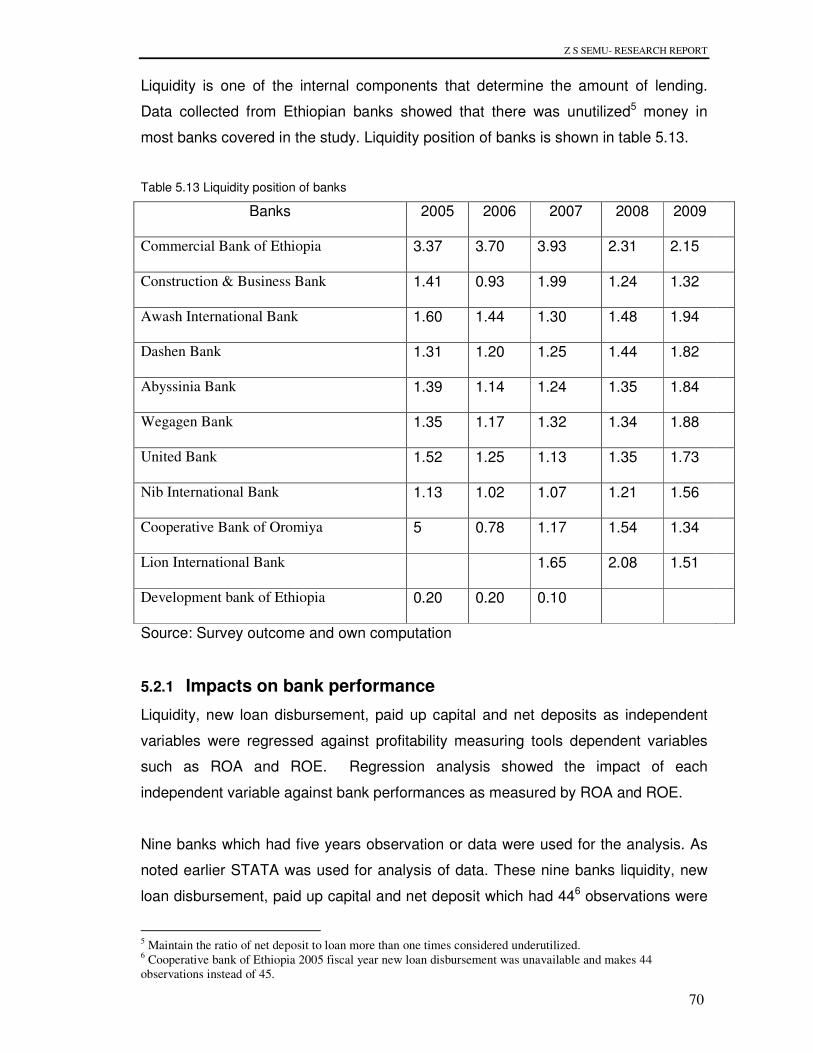
Z S SEMU- RESEARCH REPORT
70
Liquidity is one of the internal components that determine the amount of lending.
Data collected from Ethiopian banks showed that there was unutilized5 money in
most banks covered in the study. Liquidity position of banks is shown in table 5.13.
Table 5.13 Liquidity position of banks
Banks 2005 2006 2007 2008 2009
Commercial Bank of Ethiopia 3.37 3.70 3.93 2.31 2.15
Construction & Business Bank 1.41 0.93 1.99 1.24 1.32
Awash International Bank 1.60 1.44 1.30 1.48 1.94
Dashen Bank 1.31 1.20 1.25 1.44 1.82
Abyssinia Bank 1.39 1.14 1.24 1.35 1.84
Wegagen Bank 1.35 1.17 1.32 1.34 1.88
United Bank 1.52 1.25 1.13 1.35 1.73
Nib International Bank 1.13 1.02 1.07 1.21 1.56
Cooperative Bank of Oromiya 5 0.78 1.17 1.54 1.34
Lion International Bank 1.65 2.08 1.51
Development bank of Ethiopia 0.20 0.20 0.10
Source: Survey outcome and own computation
5.2.1 Impacts on bank performance
Liquidity, new loan disbursement, paid up capital and net deposits as independent
variables were regressed against profitability measuring tools dependent variables
such as ROA and ROE. Regression analysis showed the impact of each
independent variable against bank performances as measured by ROA and ROE.
Nine banks which had five years observation or data were used for the analysis. As
noted earlier STATA was used for analysis of data. These nine banks liquidity, new
loan disbursement, paid up capital and net deposit which had 446 observations were
5 Maintain the ratio of net deposit to loan more than one times considered underutilized. 6 Cooperative bank of Ethiopia 2005 fiscal year new loan disbursement was unavailable and makes 44
observations instead of 45.

Z S SEMU- RESEARCH REPORT
71
regressed against ROE and ROA and the results are shown in tables 5.14 and 5.15
respectively.
Table 5.14 Regression of deposit, capital, new loan and liquidity against ROA.
ROA Coefficient Std. deviation
t-stat P-value 95% conf. interval
Deposit -1.50 1.29 -1.16 0.251 -4.10 1.10
Capital 4.35 8.95 0.00 0.996 -.00 .000
New loan 5.15 3.63 0.42 0.164 -2.19 .000
Liquidity 0.004 0.01 0.36 0.718 -.16 .024
Constant 0.33 0.14 2.38 0.022 .005 .061
Source: Survey outcome and own computation
The results in table 5.14 shows the coefficient of deposit against ROA was negative.
This denotes that there was an inverse relationship between net deposit and ROA.
The higher the net deposit, the lower ROA. In this case, if the other three variables
i.e. new loan, capital and liquidity held constant, a one unit increase in deposit would
result on average, 1.5 unit drop in ROA. For each additional deposit, with other
factor constant, there was a decrease in ROA.
Table 5.14 shows that the coefficient of capital, new loan and liquidity against ROA
were positive. This revealed that there was direct relationship between the above
three independent variables and ROA. In this case ,if the other three variables held
constant, a one unit increase in capital, new loan and liquidity would result, on
average, an increase in 4.35, 5.15 and 0.004 respectively units in ROA. For each
additional capital, new loan and liquidity with other variables held constant, there was
an increase in ROA.
Table 5.15 Regression of deposit capital, new loan and liquidity against ROE
ROE Coefficient Std. deviation
t-stat P-value 95% conf. interval
Deposit 0.00002 4.58 3.54 0.001 6.95 .00
Capital -0.00011 0.00 -3.57 0.001 -.00 -.00
New loan -1.00 0.00 -0.08 0.939 -.00 .00
Liquidity -0.04 0.04 -1.00 0.322 -.10 .04
Constant 0.24 0.05 4.90 0.000 .14 .34
Source: Survey outcome and own computation
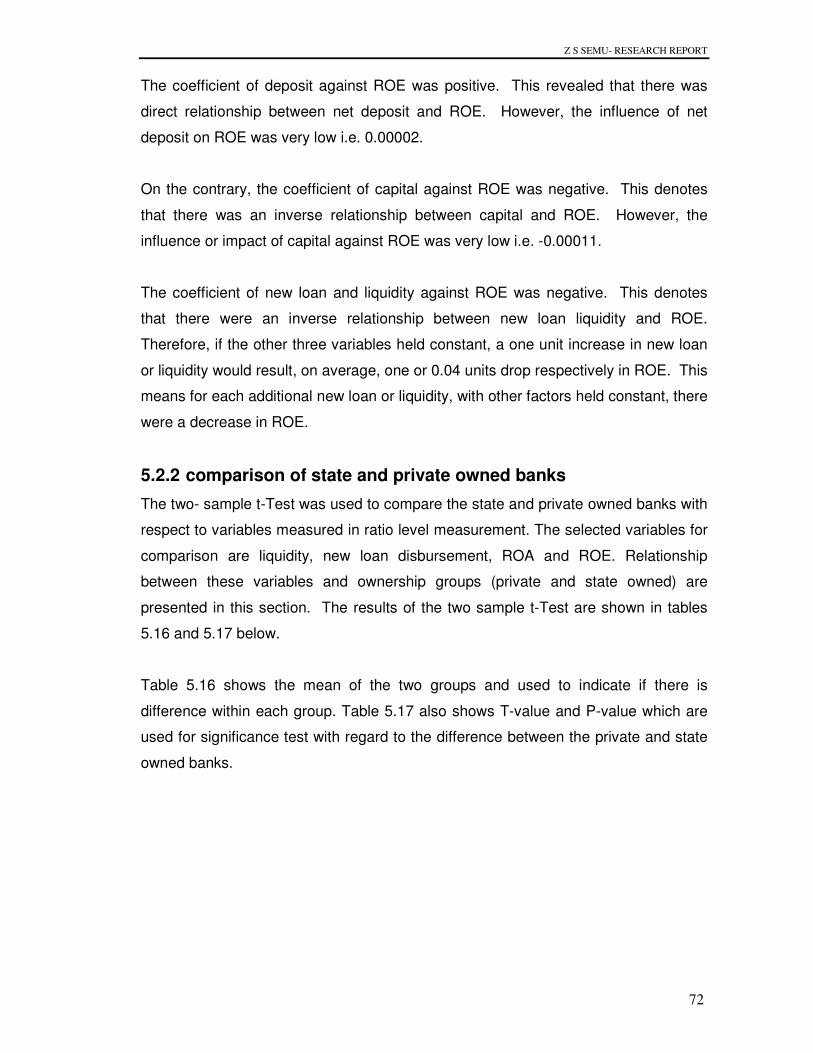
Z S SEMU- RESEARCH REPORT
72
The coefficient of deposit against ROE was positive. This revealed that there was
direct relationship between net deposit and ROE. However, the influence of net
deposit on ROE was very low i.e. 0.00002.
On the contrary, the coefficient of capital against ROE was negative. This denotes
that there was an inverse relationship between capital and ROE. However, the
influence or impact of capital against ROE was very low i.e. -0.00011.
The coefficient of new loan and liquidity against ROE was negative. This denotes
that there were an inverse relationship between new loan liquidity and ROE.
Therefore, if the other three variables held constant, a one unit increase in new loan
or liquidity would result, on average, one or 0.04 units drop respectively in ROE. This
means for each additional new loan or liquidity, with other factors held constant, there
were a decrease in ROE.
5.2.2 comparison of state and private owned banks
The two- sample t-Test was used to compare the state and private owned banks with
respect to variables measured in ratio level measurement. The selected variables for
comparison are liquidity, new loan disbursement, ROA and ROE. Relationship
between these variables and ownership groups (private and state owned) are
presented in this section. The results of the two sample t-Test are shown in tables
5.16 and 5.17 below.
Table 5.16 shows the mean of the two groups and used to indicate if there is
difference within each group. Table 5.17 also shows T-value and P-value which are
used for significance test with regard to the difference between the private and state
owned banks.

Z S SEMU- RESEARCH REPORT
73
Table 5.16. Comparison of mean between private and state owned banks
Source; survey outcome and own computation
Source: Survey outcome and own computation
Z S SEMU- RESEARCH REPORT
74
Table 5.17 Significance test on ownership of banks
Source: Survey outcome and own computation

Z S SEMU- RESEARCH REPORT
75
5.3 Summary of results
The study conducted survey of banks’ employees (using self administered
questionnaires) and structured survey of documents. Seventy percent of these study
respondents were private banks’ employees and the remaining were state owned
banks’ employees. Thirty five percent of respondents were loan officers and twenty
percent were analysts. Most respondents had below ten years of experience in
banking and lending.
All factors that affect lending have relevance in the Ethiopian banking industry.
Factors that affect lending perceived by respondents very important were liquidity,
monetary and fiscal policies, economic condition and bank healthy. The highest
impacts on bank performance when they reduce lending according to the
respondents perception were ration loan to better borrowers and decrease profit or
increase losses.
In respect of performance measures of banking industry fifty five percent of
respondents indicated that ROA was the most applicable measurement of bank
performance. Modern performance measures such as DEA and EVA scored one and
four percent respectively. Performance measures in relation to bank lending was
loan to total asset ratio scored seventy three percent and selected by respondents of
the study as most applicable measurement of bank lending.
From financial data of banks, relationship of independent variable such as liquidity,
capital, deposit and new loan disbursement and dependent variable like ROA and
ROE tested. The result showed that at 0.05 level of significant, there were no
statistically significant relationship between all independent variables and ROA. On
the other hand at the same level of significant there were statistically significant
relationship between deposit, capital and ROE. The remaining independent
variables new loan and liquidity concerned, there were no significant relationship
between them and ROE.

Z S SEMU- RESEARCH REPORT
76
Regression analysis results summary are shown in table 5.18 below:
Table 5.18 summary of regression analysis
Independent variable
Dependent variable
Relationship Estimated impact (1 unit increase in
independent Variable)
Significance test
Net deposit ROA Negative 1.5 unit decrease
ROA
Not statistically
significant
Capital ROA Positive 4.35 unit increase
ROA
Not statistically significant
New loan ROA Positive 5.15 unit increase
ROA
Not statistically significant
Liquidity ROA Positive 0.004 unit increase
ROA
Not statistically significant
Net deposit ROE Positive Insignificant Number
-0.00002
Statistically significant
Capital ROE Negative Insignificant number
-0.001
Statistically significant
New loan ROE Negative 1.00 unit decrease
ROE
Not statistically significant
Liquidity ROE Negative 0.04 unit decrease
ROE
Not statistically significant
Source: Survey outcome and own computation
The study also tried to see if there were differences between private and state owned
banks. The result showed that in terms of liquidity, new loan disbursement, ROA and
ROE, there was no statistically significant difference between private and state
owned banks. Therefore, ownership of banks would not be the differentiating factor in
terms of liquidity, new loan, ROA and ROE.

Z S SEMU- RESEARCH REPORT
77
CHAPTER SIX
DISCUSSION, CONCLUSIONS AND RECOMMENDATIONS
The previous chapter presented the results while this chapter attempts to show the
discussions, conclusions and recommendations. Accordingly, section 6.1 shows the
discussion in the context of literature while sections 6.2 and 6.3 try to present
conclusions and recommendations respectively.
6.1 Discussion of the research findings
As stated in chapter one the broad objective of this study was to identify the factors
that limit bank lending and then assess the impacts of reducing or restricting loans by
banks on their own performances.
Further, as noted previously, in order to achieve this broad objective the study
developed the following hypotheses and research questions.
HP1 - There is relationship between liquidity, capital position (size), deposit,
new bank lending and bank performance (ROA).
HP2 - There is relationship between liquidity, capital position (size), deposit,
new bank lending and bank performance (ROE).
Research questions (RQs) are:
RQ1 – What type of impact banks face during loan reduction/limitation?
RQ2 – How do the Ethiopian banks prioritize the factors that affect lending?
RQ3 – How is the Ethiopian bank lending performance measured?

Z S SEMU- RESEARCH REPORT
78
RQ4 – How banks relate their lending activity with their performance?
RQ5 – Is there a difference between private and state owned banks in terms
lending and performance?
The study analyzed each factor that has impact on bank lending. Reed and Gill
(1989) and Black and Daniel (1989) listed factors that affect bank lending. These
factors are capital position, economic condition, monetary and fiscal policies, liquidity,
management, risk and profitability of loans deposits, bank personnel, credit need of
area served, liability structure, interest rates, bank healthy and capital requirement
Survey results in table 5.7 showed that all the factors listed above have relevance in
the Ethiopian banks. Average perception by respondents showed that, all factors
have got either very important or important impact on bank lending. However, factors
that affect lending in Ethiopia banking sector considered as very important were
liquidity, monetary and fiscal policies, economic condition and banks healthy (NPL).
In respect of impacts on bank performance, the results from the survey showed that,
decrease profit or increase losses and loan rationing to better borrowers have been
the most likely impact when Ethiopian banks reduced lending compared with other
impacts. Webb (2001) in studying liquidity constraint also arrived at similar results.
This study further assessed each likely occurring impact when banks reduce lending.
In this regard, the survey results in table 5.11 showed that loan rationing to better
borrower and decrease profit or increase loss were considered the most likely
impacts in Ethiopia banking industry. Literature revealed that impacts on bank
lending were banks use their excess reserve (buffer stock of cash and security) to
overcome and protect loan rendering, rationing loan to better borrowers and creation
of bank crisis and failure Quagliariello (2009), Webb,(2001) and cadet (2009).

Z S SEMU- RESEARCH REPORT
79
The results of the survey as shown in figure 5.11, all impact on bank performance
when bank reduce or limit lending have relevance in Ethiopia banking industry.
Average respondents perception indicated that, all factors have gotten either a very
high or moderate impact.
With respect to performance measurement of banks the result of the survey, as
shown in figure 5.1, revealed that traditional bank performance measurements such
as ROA and ROE predominantly used by Ethiopian banks. This result supported by
previous research discussed in literature review (Shong and Chung, 2006 and
Hazen, 2005). This study also showed modern performance measurement received
lower scores in Ethiopian context.
In addition, this study tried to reveal performance measurement in lending activities.
The result from the survey (figure 5.2) showed that loans to total asset ratio was the
most i.e. 73 percent applicable performance measurement in bank lending activity in
the Ethiopia banking industry. Cost per loan, non-interest revenue per loan, loans in
million ETB per employee and the number of loan per employee were not applicable
lending performance measurement. Rather non-performing loan (NPL) was
considered the second best i.e. 16 percent lending performance measurement by
respondents. Further, the study indicated that modern performance measurement
such as DEA and EVA and different lending performance measures were utilized in
Ethiopia at very small rate. The reason for this may be under development of the
banking industry in the country.
To address the hypotheses that assert there is relationship between factors that
affect lending such as deposit, capital, new loan and liquidity against performance
measures like ROA and ROE, the researcher used regression analysis.
As per the regression analysis capital, liquidity and new loan disbursement had
positive relationship with ROA. This means increase in these variables would result
in an increase in ROA. This finding was consistent with the theoretically expected
relationship between ROA the factors stated above (see for example Reed and Gill
(1989) and Black and Daniel, (1989) for the theory. In addition, these results were in
line with what previous studies including Furlong, 1992 and Valverde and Del peso

Z S SEMU- RESEARCH REPORT
80
2009) revealed. On the other hand, the result shows that deposit had inverse
relationship with ROA. This means increase in deposit would result decrease in
ROA. The reason for this may be Ethiopian banks as can be seen from bank
financial data table 5.13 had high liquidity. They had not lending according to their
customers’ increase or decrease of deposits.
In respect to hypothesis testing, at 0.05 significant levels, there were no statistically
significant relationship between deposit, new loan, capital, liquidity and ROA.
Therefore, the hypothesis that states, there is relationship between deposit, new
loan, capital, liquidity and ROA may be rejected or data did not support the
hypothesis.
When we see the regression analysis of the three independent variables i.e. capital,
new loan and liquidity against ROE, the results were not as expected. The results
showed negative relationship between capital, new loan and liquidity and ROE. This
result failed to support theories and existing literatures. The reasons for this may be
there was inefficiency in Ethiopia banking industry. In this case the dependent
variable ROE didn’t explain the independent variables.
In respect to hypotheses testing, at 0.05 level of significant there were statistically
significance relationship between deposit, capital and ROE. Thus the hypothesis that
states there is relationship between deposit, capital and ROE supported or data
supported the hypothesis.
On the other hand, in respect to hypothesis testing, at 0.05 level of significant there
were no statistically significant relationship between new loan, liquidity and ROE.
Thus the hypothesis that states there is relationship between new loan, liquidity and
ROE may be rejected or data did not support the hypothesis.
The mean of the two groups (private and state owned banks) in terms of liquidity,
new loan, ROA and ROE showed variance. This is an indication that there were
differences between mean of the two groups in all four variables. Table 5.16 showed
that state owned banks were more variable group than private banks in terms of
liquidity, new loan disbursement and ROE. On the other hand, private banks were
more variable group in respect to ROA than state owned banks.

Z S SEMU- RESEARCH REPORT
81
As shown in table 5.17, at 0.05 level of significant, the two groups were found to have
no statistically significant difference in respect of the variables considered. Therefore,
the research question that says is there a difference between private and state
owned banks in terms of lending (measured by new loan and liquidity) and
performance (measured by ROA and ROE) could have an answer no i.e. there was
no difference between the two groups. Ownership of banks would not be the
differentiating factor in terms of liquidity, new loan disbursement, ROA and ROE in
the Ethiopian banking industry.
Most Ethiopian banks except Construction and Business Bank (CBB) for the year
2006 and Development Bank of Ethiopia (DBE) maintain more than one times of net
deposit to loan ratio (table 5.13). This shows they had excess liquid asset. However
they had not used this excess liquid asset for loan purpose. CBE especially held
more than two times deposit to loan ratio, this shows it had huge amount or excess
cash that was idle and had no return. All banks can maximize a better return by
granting loan to governments and private employees’, those entrepreneurs who have
viable projects but needs money and associate themselves with micro finance
institutions to utilize their excess money.
There were no differences between banks that had long years experience and strong
assets or capital such as CBE and newly established and not financially strong banks
in terms of ROA and ROE. All banks were in similar positions (appendix-2). This
may show that, there is inefficiency in the oldest and biggest bank. The theory Reed
and Gill (1989) and literature review Kishan and Opiela (2000) showed that strong
capital, better experience of bank personnel and good infrastructure (facility) give
advantages to be better off compared to other banks.

Z S SEMU- RESEARCH REPORT
82
6.2 Conclusions
The broad objective of this research was to identify factors that limit lending and
assess the impacts of reducing or limiting loan by banks on their own performance.
Based on this broad objective a number of specific research questions and
hypotheses were developed.
To achieve this broad objective, the study used quantitative research approach. More
specifically, the study used survey of employees of banks and structured survey of
documents held by banks. The results showed that, based on the respondents’
perception it is evident that most likely factors that affect bank lending in Ethiopia are
liquidity of banks, monetary and fiscal policies, and economic conditions and bank
healthy (NPL).
Also as per the respondents’ perception, for some reasons if banks reduce or limit
lending, loan rationing to better borrowers and decrease profit or increases losses
were major impacts in Ethiopia banking industry. Bank management should address
the problem and look up other uses of fund like purchasing securities or treasury
bills.
With regard to bank performance measurement, it is evident that bank measured
their performance in a traditional way. DEA and EVA hold additional dimensions.
Also utilization of lending activities measurement is limited with loans to total asset
ratio and NPL.
Capital, liquidity and new loan disbursement had positive relationship with ROA.
These results support the theories and existing literature in the area. Deposit on the
other hand had negative or inverse relationship. Regression results show ROE did
not explain the independent variables.
There were no differences observed between private and state owned banks in this
study with regard to ROA, ROE, liquidity and new loan disbursement. These
revealed that ownership of banks would not be the differentiating factor in Ethiopia
banking industry.

Z S SEMU- RESEARCH REPORT
83
In the Ethiopian banking industry, there was excess liquidity. Most banks had more
than one times deposit to loan ratio. This shows they underutilized their resource or
there was idle money. This was exaggerated in government owned big bank, CBE.
There is not much difference between big and long years of service and newly
established banks in terms of lending and performance. This show there might be
inefficiencies in big and long established banks.
6.3 Recommendations
The following recommendations were made:
• When banks face constraint to make loan for different factors listed in this
research paper, they have to use their funds to purchase bond, securities and
treasury bills. In addition, banks should develop non-interest generating
services to compensate lending return.
• Most likely factors that affect bank lending in Ethiopia are liquidity of banks,
monetary and fiscal policies, and economic conditions and bank healthy
(NPL). Therefore bank management and supervising authorities such as NBE
should give due attention on these factors.
• Management and supervising agency should implement modern and widely
used performance measurement to evaluate both bank over all and lending
performance. Benefits of applying modern performance measurement are
establish drivers of high performance, track bank wide and line of business
performance and identify causes rather than effects of performance up and
downs. Therefore, the supervising agencies and management of banks should
utilize modern performance measurement tools such as DEA and EVA- which
holds additional dimensions. Also utilization of lending activities measurement
was limited with loans to total asset ratio and NPL. Management should pay
attention to use other type of loan activities performance measurements.
• Further study in the future needs on the factors such as monitory and fiscal
policy and Economic conditions that affect on bank performance.

Z S SEMU- RESEARCH REPORT
84
• Bigger capital, long years experience and well established banks such as
Commercial Bank of Ethiopia is not different from those which established in
the last ten years in terms of ROA and ROE. The reason for this might be
inefficiency or other; therefore, the owner (Ethiopian government) should
evaluate its performance against modern banking requirements.
• Within the limit of lending set by NBE, all banks should revise their credit
policy to extend more credit and maximize their profit.
• Excess cash (liquidity) maintained by most banks should be used for lending
to entrepreneurs who have viable project and need money, issuing long period
credit to both private and public employees’ and extend credit to micro
finance institutions with mass base. If banks apply the recommendations
made above, positive impacts would be visible in poverty alleviation programs
of the country.

Z S SEMU- RESEARCH REPORT
85
REFERENCES
Ahtiala, P. 2005, ' The new theory of commercial banking and bank lending behavior’.
Scottish Journal of political economy, 52 (5). November, 769 - 792.
Athavale, M, Bland, E and Trimm, R. undated, ' Are firms Constrained by their bank? a
pilot study, The Journal of applied business Research', 18(2): No page
Ayalew, T. 2005. ' A study on financial performance of private sector banks in Ethiopia'.
MBA project paper, Addis Ababa University.
Baran, D. and Smiljanic, R. 2008, 'Monetary tightening and bank financing of SME and
Large Companies in Croatia,' The business Review, 10 (2), summer 2008: 275 - 289.
Barrickman, J.R. 1990, ' Successful Commercial lending from the ground up'. Bottom
line, 7(2): 12-14.
Baum,C, Caglayan,M and Ozkan,N (2005)’The second moments matter: the response
of bank lending behavior to macro environment uncertainty’, Boston college, Working
paper,No521.
Berhanu, H. 2004. Financial performance of Ethiopia Commercial banks. MBA project
paper, Addis Ababa University.
Bernanke, B. and Blinder, A. 1988, 'Credit, money' and aggregate demand, .American
Economic review. 78: 435-439.
Black, T. and Daniel, D. 1081, Money and Banking, first edition , U.S.A: Business
publication Inc.
Cadet, R.L. 2009, ' A theory of linkage between monetary policy and banking failure in
developing countries'. Journal of financial Economic policy 1 (2), 2009: 143-154.

Z S SEMU- RESEARCH REPORT
86
Campbell, C.D, Campbell, R.G and Dolan, E.G 1988, Money, Banking and monetary
policy, first edition, New York: The Dryden press.
Case, K.E' and Fair, R.G. 2007, principles of economics, eight editions, New Jersey:
Pearson - Prentice Hall.
Charnes, A., Cooper, W.W. and Rhodes, E. 1978, 'Measuring the efficiency of decision
making units', European Journal of operational research, 2 (6): 429-444.
Cicfa, C and Hincu, D. 2009, 'performance evaluation methods in commercial banks
and associated risks for managing assets and liabilities', communication of the IBIMA
Journal, 7(2009) 97-101
Creswell, J.W. 2009, Research design: Qualitative, Quantitative and Mixed Method
approach, third edition, U.S: SAGE publication, inc.
Cumming, S. and Nel, H. 2005, 'Capital controls and the lending behavior of South
Africans banks! Preliminary findings on the expected impact of Basel II. South African
Journal of Economics, 73(4): 641 - 656.
Dimantopoulos,A and Schlegelmilch, B.B,2000,Taking the fear out of data analysis,
first edition, London, Southwestern, Cengaga learning, EMEA.
Eickmeier, S., Hofmann, B.., and Worms, a. 2009. 'Macroeconomic fluctuations and
bank lending: evidence for Germany and the Euro Area’, German Economic review, 10
(2): 193 - 223.
Ewert, R., Schenk, G. and Szczesny, A. 2000, 'Determinants of bank lending
performance in Germany'. Schmalenbach business Review, 52(4) October: 344-362.
Federal Democratic Republic of Ethiopia(FDRE), The house of people representative,
Proclamation No 591/2008, 2008 'The National bank of Ethiopia Establishment', Addis
Ababa.'

Z S SEMU- RESEARCH REPORT
87
Federal Democratic Republic of Ethiopia (FDRE), The house of people representative
Proclamation No 592/2008, 2008 'Banking business in Ethiopia' Addis Ababa.
Fowler, F.J, 1986, Survey research methods, third edition, U.S.A, SAGE publication
Inc.
Fukuda, S., Kasuya, M. and Nakajima, J. 2006, 'Deteriorating bank health and lending
in Japan: Evidence from unlisted companies under financial distress. Journal of the
Asia Pacific Economy, 11 (4): 482 - 501.
Furlong, F.T. 1992. 'Capital regulation and bank lending'. Economic review-Federal
Reserve bank of San Francisco, 1992 (3): 23-33.
Grasing, R.2002, 'Measuring operational efficiency: a guide for commercial bankers'.
Commercial lending review, 17 (1): 45-52.
Hazen, M. 2005, ' The financial performance of Ethiopia commercial banks: A
comparative analysis. M.Sc project paper, Addis Ababa University.
Henry, M.P. 1985, ' Factors Influencing contemporary bank lending''. The Journal of
commercial bank lending, 68(3): 2,6.
Karr, J .2005, 'Performance Measurement in banking: Beyond ROE', Journal of
performance management (No volume. and number) - Accessed by
Kashyap, A: and Stein, J. 2000, 'what do a million observations on banks say about the
transmission of monetary policy? '. American Economic review, 90:407-428.

Z S SEMU- RESEARCH REPORT
88
Kashyan, A.K, Stiein J.C. and Wilcox, D.W.1993’ Monetary policy and credit conditions:
Evidence from the composition of external finance.’ American economic review,83 (1)
78-98.
Keeton, W.R. 1993, 'The impact of monetary policy on bank lending: the role of
securities and large CDs'. Economic Review, 78 (2): 35-47.
Kishan, R.P. and Oprela, T.P. 2000, 'Bank Size, bank capital, and the bank lending
channal'. Journal of Money, credit and banking, 32 (1): 121-141.
Leedy, P.D. and Ormrod, J.E. practical research: planning and Design. Eight editions.
New Jersey: Pearson Education, inc.
Mac Donald, S.S. and Koch, T.W. 2006, Management of Banking, Six Edition, U.S.A:
Thomson - South Western.
Matz, L. 2010, 'Liquidity Risk Management: Connecting the prices'. Bank, accounting
and finance Journal February - March 2010:39 - 52.
Mc Kinnon, R. 2009, 'Why banks aren't Lending'. International Economy, the magazine
of international economic policy, fall 2009: 20-23
McCarthy M.G; Schneider, D.K. and Tibb, S.L. 2010, 'In, vestments and loans reported
by the 10 largest U.S banks,' Journal of Bank accounting and Finance Dec 2009- Jan
2010: P19-24.
NBE, 2007/08, Annual report 2007/2008, Addis Ababa, Ethiopia
NBE, 2008/09, Annual report 2008/2009, Addis Ababa, Ethiopia
NBE, 1999, 'Minimum paid up capital to be maintained by banks' Directive No
SBB/24/99, Addis Ababa, Ethiopia.

Z S SEMU- RESEARCH REPORT
89
NBE, 2008, Reserve requirements, Directive No SBB/45/2008, 2OO8, Addis Ababa,
Ethiopia.
NBE, Minimum interest rate on saving and time deposits Directive No
NBE/INT/10/2007, 2007, Addis Ababa, Ethiopia.
NBE, History of banking, Available at< http://www. nbe. gov.et [Accessed
28/04/2010].
Oliner, S. D. and Rude busch, G. D. 1996, "Monetary policy and credit conditions:
evidence from the composition of external finance: comment'. The American Economic
review, 86(1): 300-309.
Opiela, T.P. 2008, 'Differential deposits guarantees and the effect of monetary policy
on bank lending', Economic Inquiry 46(4) October 610 - 620,
Popa, G, Mihallescu, Land Caragea, C 2009, 'EVA - Advanced method for
performance evaluation in banks', Economia Seria management Journal, 12(1): 268-
173.
Quagliariello, M. 2009,. 'Macroeconomic uncertainty and banks' lending decisions: the
case of Italy'. Applied Economics, 2009, 41:323-336.
Rajan. R.G 1996, 'Why banks have a future: toward a new theory of commercial
banking'. Journal of applied corporate finance: 9 (2) summer, 114 – 128.
Read, E.W. and Gill, E.K. 1989, Commercial banking, Forth edition, New Jersey: Engle
wood cliffs.
Round table, 1996, 'Current issues in commercial banking; Strategic planning,
performance measurement and incentive compensation. Round table discussion,
Journal of applied corporate finance, 9(2) Summers: 24-51.

Z S SEMU- RESEARCH REPORT
90
Saplenza, P. 2004, 'The effect of government ownership on bank lending. Journal of
financial Economics, 72(2); 357 or (Abstract).
Schnatter, S. and Kaufmann, S. 2006. 'How do changes in monetary policy affect bank
lending? An analysis of Austrian bank data'. Journal of applied Econometrics, 21
(2006): 275 - 305.
Sengonul, A. and Thorbecke, W. 2005, 'The effect of monetary policy on bank lending
in Turkey'. Applied financial Economics, 15: 931-934.
Seyoum, B. 2006, 'A Comparative Study on the performance of private banks in
Ethiopia - problems, challenges and prospects". MBA project paper, Addis Ababa
University.
Shong, L.P. and Chung, M.A 2006, ' The internal performance measures of bank
lending: a value added approach'. Bench marking: an International journal, 17(3): 272
– 289
Staikouras, C, Mamatzakis, E. and Filippaki, A.K.., 2007, 'Operating performance of the
banking industry: An empirical investigation of the South eastern European Region'.
South - Eastern Europe Journal of Economics, 2 (2007): 245-266.
Stein, J.C. 1998, 'An adverse - selection model of bank asset and liability management
with implications for the transmission of monetary policy'. RAND Journal of Economics
29: 466-486.
Tang, T.C. 2003, ‘Directions of banks lending and Malaysian Economic Development:
An empirical study'. International Journal of management, 20(3): 342-345.
The Economist Intelligent unit, 1999 'Increased bank lending to business'. EIV country
Report, 1st quarter 1999:26.

Z S SEMU- RESEARCH REPORT
91
Valverde, S.C. and del paso, R.L. 2009, 'Bank lending channel and non-financial firms:
evidence for spain'. Span Econ Rev (2009), 11:125-140.
Van Zyl, C, Skerritt, P, Botha, Z and Goodspeed, I 2009, understanding South African
financial markets, third edition, Pretoria; Van Schaik publishers.
Waweru, N.M. and Kalani, V. M. 2009, 'Commercial banking crises in Kenya: causes
and remedies', African Journal of Accounting, Economic Economics, Finance and
banking research, 4(4): 12-32
Webb, D.C- 2000, 'The impact of liquidity constraints on bank lending policy'. The
economic Journal: 110 (January): 69-91
Worku, G.2006, 'liquidity and its impact on performance of commercial banks in
Ethiopia'. M.Sc project paper, Addis Ababa university.

Z S SEMU- RESEARCH REPORT
APPENDIX -1
Z S SEMU- RESEARCH REPORT
93
QUESTIONNAIRE
Questionnaire My name is Zewdu Seyoum and I am currently working with the research component
of the Master’s Degree in Business Leadership (MBL) at the University of South
Africa’s School of Business Leadership (SBL).
The purpose of my study is to identify the impacts of reducing or restricting loans by
banks on their own performances. The study also tries to assess the reasons why
commercial banks reduce or restricts lending money and assess what factors limit
banks lending. To this end, the study intends to gather information from selected
managers, analysts, loan officers, experts etc. through a self administered
questionnaire. The participation is fully voluntary and responses will be confidential.
The results will be also reported without showing the identity of respondents.
The questionnaire takes about 15-20 minutes to complete. I would appreciate your
positive consideration in completing the enclosed questionnaire and assisting me in
my research efforts. If you have any questions please call 0911659485 or email
Thank you in advance
Zewdu Seyoum

Z S SEMU- RESEARCH REPORT
94
QUESTIONNAIRE
(Please tick appropriate boxes)
SECTION ONE – BACKGROUND INFORMATION
1. In what position you are working in the banking industry?
Expert Analyst customer relation Manager Loan Officer Branch Deputy Branch
Manager manager
Other please specify _____________________________
2. Indicate owner ship of the bank you are working
Private State owned
3. Indicate the number of years working experience in the banking sector
1 – 5 years 6-10 years 11-15 years 3 >15 years
4. Indicate number of years experience in the bank lending
1 – 5 years 1 6-10 years 2 11-15 years 3 >15 years
5. Impact of reducing lending is easily understandable
Agree Neutral Disagree

Z S SEMU- RESEARCH REPORT
95
SECTION TWO – FACTOR THAT LIMIT (REDUCE) LENDING
6. Ranking the factors that limit (restrict) lending
N.B. Rank the factors from 1 – 6 according to the importance or effect on
reducing
Lending.
E.g. The factor that has high importance compared to other factors will be
ranked 1 (first) and least important will be ranked 6.
Factors Ranks
Capital Position ( size of capital)
Economic condition
Liquidity of the bank
Monetary and fiscal policies
Management
Other please specify ________________________
_________________________________________
Please rate the factors listed in the following table (7-20) in terms of your
perception on how each item is important in limiting or restricting bank
lending.
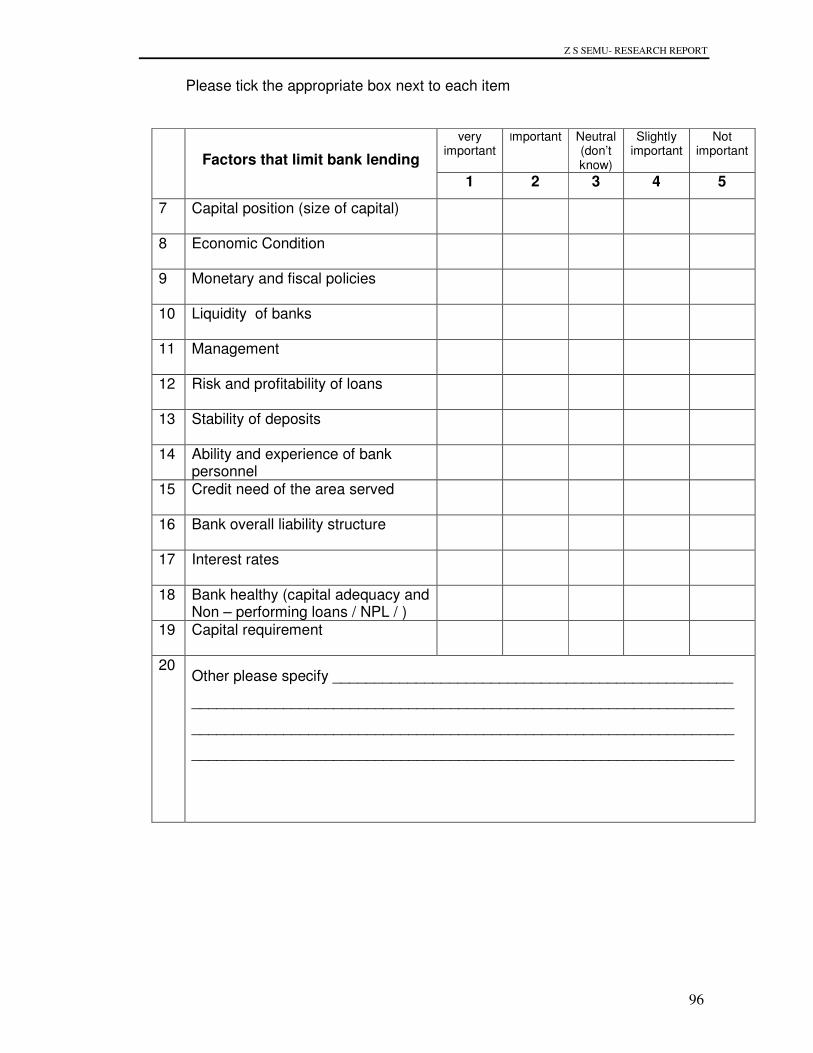
Z S SEMU- RESEARCH REPORT
96
Please tick the appropriate box next to each item
Factors that limit bank lending
very
important Important Neutral
(don’t know)
Slightly important
Not important
1 2 3 4 5
7 Capital position (size of capital)
8 Economic Condition
9 Monetary and fiscal policies
10 Liquidity of banks
11 Management
12 Risk and profitability of loans
13 Stability of deposits
14 Ability and experience of bank personnel
15 Credit need of the area served
16 Bank overall liability structure
17 Interest rates
18 Bank healthy (capital adequacy and Non – performing loans / NPL / )
19 Capital requirement
20
Other please specify ________________________________________________
_________________________________________________________________
_________________________________________________________________
_________________________________________________________________
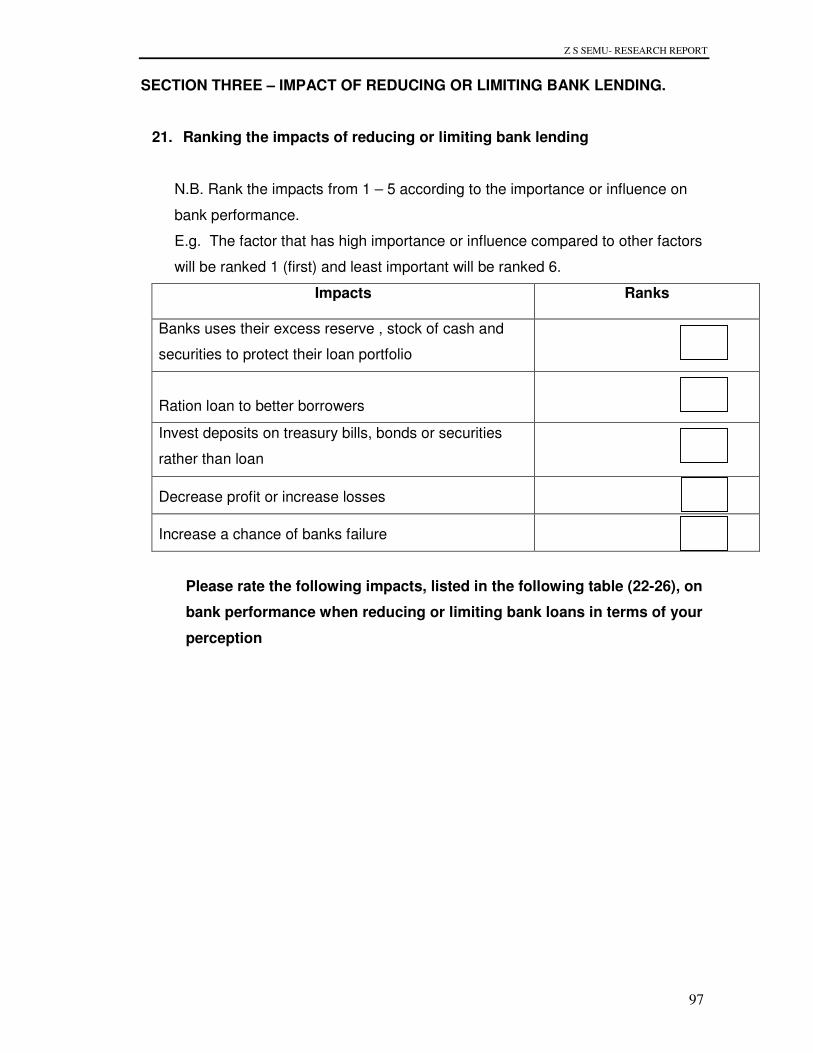
Z S SEMU- RESEARCH REPORT
97
SECTION THREE – IMPACT OF REDUCING OR LIMITING BANK LENDING.
21. Ranking the impacts of reducing or limiting bank lending
N.B. Rank the impacts from 1 – 5 according to the importance or influence on
bank performance.
E.g. The factor that has high importance or influence compared to other factors
will be ranked 1 (first) and least important will be ranked 6.
Impacts
Ranks
Banks uses their excess reserve , stock of cash and
securities to protect their loan portfolio
Ration loan to better borrowers
Invest deposits on treasury bills, bonds or securities
rather than loan
Decrease profit or increase losses
Increase a chance of banks failure
Please rate the following impacts, listed in the following table (22-26), on
bank performance when reducing or limiting bank loans in terms of your
perception

Z S SEMU- RESEARCH REPORT
98
Please tick the appropriate box next to each item
Impacts of limit bank lending
Very high
impact
Moderate Impact
Neutral (don’t know)
low Impact
No impact
1 2 3 4 5
22 Banks uses their excess reserve, stock of cash and securities to protect their loan portfolio
23 Ration loan to better borrowers
24 Invest deposits on treasury bills, bonds or securities rather than loan
25 Decrease profit or increase losses
26 Increase a chance of bank failure
Please tick the appropriate box next to each item
Strongly agree
Agree Neutral Disagree Strongly disagree
1 2 3 4 5
27 Lending activities in banking
industry is transparent and clear to
both borrowers and bank
employees
28 There is a relation between lending
and bank performance
29 Reducing loan has negative impact
on bank performance

Z S SEMU- RESEARCH REPORT
99
30. In your banking practice which performance measurement are suitable
to measure bank performance
Return on Asset (ROA) Return on Equity (ROE)
Return on Investment Net banking Income (NI) (ROI)
Data Envelopment Economic value Added Analyses (DEA) (EVA)
Other please specify ___________________________
31. In your banking experience which performance measurement are used to
measure lending performance of banks. Please note that it is possible to
have multiple answers
Loans to total asset ratio
The ratio of loan reserve to gross loans
The cost per loan
The non – interest revenue per loan
Loans in million birr per employee
The number of loan per employee
Interest income
Other please specify ____________________
Thank you for your cooperation!

Z S SEMU- RESEARCH REPORT
100
APPENDIX-2
Financial data of Commercial Banks
Bank -COMMERCIAL BANK OF ETHIOPIA . (in millions ETB)
Particular 2005 2006 2007 2008 2009
Net deposit 25367 28286 32873 37633 43489
Net loan 7533 7653 8370 16275 20257
Paid up capital 620 620 4000 4000 4000
Equity 1429 1506 4220 4560 5041
Total Asset 33169 35849 43456 50416 59411
Net income before tax 789 1120 1170 1868 2716
Net income after tax 572 802 864 1361 1921
New loan disbursement 3972.2 4115.9 5755.2 14418.2 11098.9
Liquidity(deposit/loan) 3.37 3.70 3.93 2.31 2.15
ROA 0.02 0.03 0.03 0.04 0.05
ROE 0.40 0.53 0.20 0.30 0.38
Bank - CONSTRUCTION AND BUSINESS BANK .
(in millions ETB)
Particular 2005 2006 2007 2008 2009
Net deposit 1056 973 1136 1489 1834
Net loan 747 1046 1142 1205 1391
Paid up capital 79 79 79 79 79
Equity 106 157 212 259 269
Total Asset 1832 1797 1889 2392 2592
Net income before tax 26 79 81 115 106
Net income after tax 17 56 56 84 74
New loan disbursement 583 430.5 288.5 795.5 1297.8
Liquidity (deposit/loan) 1.41 0.93 0.99 1.24 1.32
ROA 0.01 0.04 0.04 0.05 0.04
ROE 0.16 0.36 0.26 0.32 0.28

Z S SEMU- RESEARCH REPORT
101
Bank - DASHEN BANK . (in millions ETB)
Particular 2005 2006 2007 2008 2009
Net deposit 2833 3692 4861 6152 7925
Net loan 2160 3080 3889 4280 4349
Paid up capital 100 156 282 454 529
Equity 243 386 545 731 909
Total Asset 3420 4546 6041 7829 9733
Net income before tax 97 185 258 333 352
Net income after tax 71 133 187 239 250
New loan disbursement 1181.2 1676.4 1284.6 2145.7 2293.6
Liquidity(deposit/loan) 1.31 1.20 1.25 1.44 1.82
ROA 0.03 0.04 0.04 0.04 0.04
ROE 0.29 0.34 0.34 0.33 0.28
Bank - AWASH INTERNATIONAL BANK . (in millions ETB)
Particular 2005 2006 2007 2008 2009
Net deposit 1940 2567 3112 3870 4962
Net loan 1210 1780 2403 2611 2564
Paid up capital 155 188 252.5 368 445
Equity 228 304 434 597 750
Total Asset 2226 2954 3830 4820 6423
Net income before tax 55 111 204 204 202
Net income after tax 38 78 143 143 143
New loan disbursement 1050.4 1409.5 1191.5 1547 2845.6
Liquidity(deposit/loan) 1.60 1.44 1.30 1.48 1.94
ROA 0.02 0.04 0.05 0.04 0.03
ROE 0.17 0.26 0.33 0.24 0.19

Z S SEMU- RESEARCH REPORT
102
Bank -BANK OF ABYSSINIA . (in millions ETB)
Particular 2005 2006 2007 2008 2009
Net deposit 1627 2177 2721 3478 4494
Net loan 1173 1902 2197 2567 2443
Paid up capital 166 265 265 315 318
Equity 254 402 403 420 519
Total Asset 2057 2834 3396 4270 5477
Net income before tax 82 122 95 22 145
Net income after tax 61 85 67 15 100
New loan disbursement 424.2 885.9 794.9 1934.3 1367.2
Liquidity(deposit/loan) 1.39 1.14 1.24 1.35 1.84
ROA 0.04 0.04 0.03 0.01 0.03
ROE 0.24 0.21 0.17 0.04 0.19
Bank - WEGAGEN BANK . (in millions ETB
Particular 2005 2006 2007 2008 2009
Net deposit 1288 1778 2724 2966 3728
Net loan 951 1516 2060 2208 1984
Paid up capital 113 151 338 381 532
Equity 180 255 403 605 836
Total Asset 1616 2259 3480 4125 5118
Net income before tax 63 94 153 190 256
Net income after tax 48 71 112 139 181
New loan disbursement 1284.6 1997.3 2019.1 2754.1 2153.2
Liquidity(deposit/loan) 1.35 1.17 1.32 1.34 1.88
ROA 0.07 0.06 0.07 0.09 0.13
ROE 0.27 0.28 0.28 0.23 0.22

Z S SEMU- RESEARCH REPORT
103
Bank - UNITED BANK . (in millions ETB)
Particular 2005 2006 2007 2008 2009
Net deposit 865 1220 1541 2443 3616
Net loan 570 975 1368 1810 2086
Paid up capital 88 132 268 335 362
Equity 125 191 360 468 520
Total Asset 1073 1599 2183 3250 4652
Net income before tax 43 60 87 126 134
Net income after tax 31 44 64 91 94
New loan disbursement 342.5 629.7 359.9 746.8 1452.9
Liquidity(deposit/loan) 1.52 1.25 1.13 1.35 1.73
ROA 0.04 0.04 0.04 0.04 0.03
ROE 0.25 0.23 0.18 0.19 0.18
Bank - COPERATIVE BANK OF OROMIA . (in millions ETB)
Particular 2005 2006 2007 2008 2009
Net deposit 15 98 277 490 789
Net loan 3 126 236 318 588
Paid up capital 113 121 127 133 146
Equity 112 122 130 148 156
Total Asset 129 224 424 678 1023
Net income before tax -1.1 -4.19 2.4 15 3.6
Net income after tax -1.1 -4.19 2.4 12 2.4
New loan disbursement 214.9 470.4 1337.6 581.5
Liquidity(deposit/loan) 5 0.78 1.17 1.54 1.34
ROA -0.01 -0.02 0.01 0.02 0.00
ROE -0.01 -0.03 0.02 0.08 0.02
Bank - NIB INTERNATIONAL BANK . (in millions ETB)
Particular 2005 2006 2007 2008 2009
Net deposit 1223 1452 1879 2470 3296
Net loan 1086 1418 1755 2034 2118
Paid up capital 160 200 307 426 488
Equity 224 285 425 598 729
Total Asset 1732 2027 2607 3650 4807
Net income before tax 66 81 106 159 219

Z S SEMU- RESEARCH REPORT
104
Net income after tax 46 58 76 113 154
New loan disbursement 375 469.7 540 1144.1 1234.3
Liquidity(deposit/loan) 1.13 1.02 1.07 1.21 1.56
ROA 0.04 0.04 0.04 0.04 0.05
ROE 0.21 0.20 0.18 0.19 0.21
Bank - LION INTERNATIONAL BANK . (in millions ETB)
Particular 2005 2006 2007 2008 2009
Net deposit 122 375 704
Net loan 74 180 465
Paid up capital 140 177 194
Equity 135 171 192
Total Asset 266 574 952
Net income before tax -5 -1 4
Net income after tax -5 -1 3
New loan disbursement 56.4 197.3 452.2
Liquidity(deposit/loan) 1.65 2.08 1.51
ROA -0.02 0.00 0.00
ROE -0.04 -0.01 0.02
Bank -DEVELOPMENT BANK OF ETHIOPIA . (in millions ETB)
Particular 2005 2006 2007 2008 2009
Net deposit 682 636 575
Net loan 3410 3562 3867
Paid up capital 1800 1800 1800
Equity 1850 1875 1870
Total Asset 4546 4958 5559
Net income before tax 56 34 44
Net income after tax 46 25 32
New loan disbursement 219.9 572.0 779.0
Liquidity(deposit/loan) 0.20 0.20 0.10
ROA 0.01 0.01 0.01
ROE 0.02 0.01 0.02