Embed Size (px)
Citation preview

CASE STUDY AND APPLICATION
Impact of real-time crowding information: a Stockholmmetro pilot study
Yizhou Zhang1 • Erik Jenelius1 • Karl Kottenhoff1
Accepted: 24 November 2016 / Published online: 8 December 2016
� The Author(s) 2016. This article is published with open access at Springerlink.com
Abstract The paper evaluates the impact of real-time crowding information (RTCI)
provision based on a pilot study at a Stockholm metro station. During a 6-day test
period, RTCI for each car in the next arriving train was provided through a visual
display and speakers. The impact is evaluated in three dimensions: (1) passenger
attention is analyzed using video analysis; (2) passenger valuation is evaluated with
traveler surveys; (3) passenger action is analyzed with in-vehicle passenger load
data. It is estimated that around 25% of the passengers noticed, understood and
considered the provided information useful for their travel decisions. Further, RTCI
had a statistically significant positive impact on the boarding distribution between
cars and, as a result, on the downstream in-vehicle crowding in the trains. RTCI
reduced the share of passengers boarding the first, most crowded car by 4.3% points
for trains that were crowded on arrival, and increased the share of passengers
boarding the second, less crowded car by 4.1% points. The findings also suggest that
many passengers may value the provided crowding information positively even
though it does not change their travel decisions. The results indicate that RTCI may
be a useful technology for public transport operators and agencies for increasing the
utilization of available train capacity and reducing crowding.
Keywords Crowding � Real-time information � RTCI � Metro � Pilot study
& Erik Jenelius
Yizhou Zhang
Karl Kottenhoff
1 Department of Transport Science, KTH Royal Institute of Technology, Teknikringen 10,
100 44 Stockholm, Sweden
123
Public Transp (2017) 9:483–499
DOI 10.1007/s12469-016-0150-y
1 Introduction
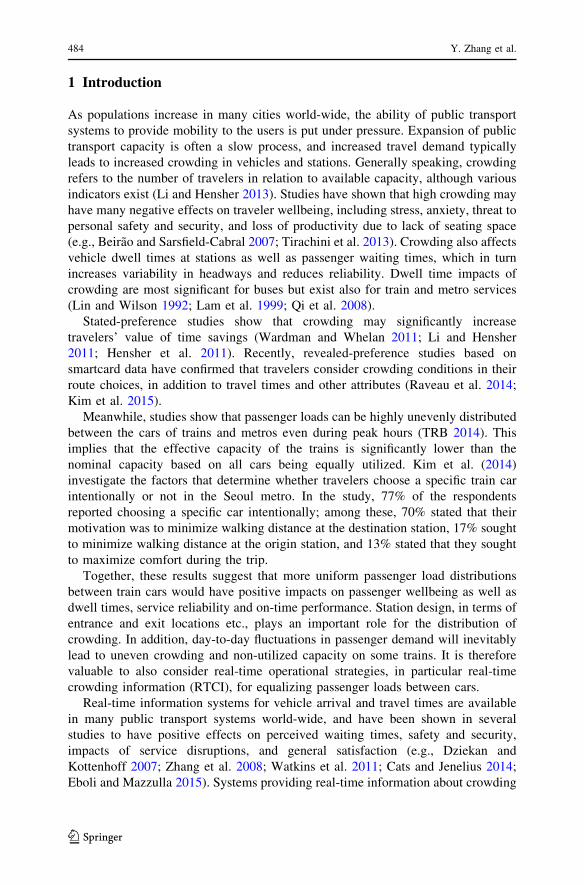
As populations increase in many cities world-wide, the ability of public transport
systems to provide mobility to the users is put under pressure. Expansion of public
transport capacity is often a slow process, and increased travel demand typically
leads to increased crowding in vehicles and stations. Generally speaking, crowding
refers to the number of travelers in relation to available capacity, although various
indicators exist (Li and Hensher 2013). Studies have shown that high crowding may
have many negative effects on traveler wellbeing, including stress, anxiety, threat to
personal safety and security, and loss of productivity due to lack of seating space
(e.g., Beirao and Sarsfield-Cabral 2007; Tirachini et al. 2013). Crowding also affects
vehicle dwell times at stations as well as passenger waiting times, which in turn
increases variability in headways and reduces reliability. Dwell time impacts of
crowding are most significant for buses but exist also for train and metro services
(Lin and Wilson 1992; Lam et al. 1999; Qi et al. 2008).
Stated-preference studies show that crowding may significantly increase
travelers’ value of time savings (Wardman and Whelan 2011; Li and Hensher
2011; Hensher et al. 2011). Recently, revealed-preference studies based on
smartcard data have confirmed that travelers consider crowding conditions in their
route choices, in addition to travel times and other attributes (Raveau et al. 2014;
Kim et al. 2015).
Meanwhile, studies show that passenger loads can be highly unevenly distributed
between the cars of trains and metros even during peak hours (TRB 2014). This
implies that the effective capacity of the trains is significantly lower than the
nominal capacity based on all cars being equally utilized. Kim et al. (2014)
investigate the factors that determine whether travelers choose a specific train car
intentionally or not in the Seoul metro. In the study, 77% of the respondents
reported choosing a specific car intentionally; among these, 70% stated that their
motivation was to minimize walking distance at the destination station, 17% sought
to minimize walking distance at the origin station, and 13% stated that they sought
to maximize comfort during the trip.
Together, these results suggest that more uniform passenger load distributions
between train cars would have positive impacts on passenger wellbeing as well as
dwell times, service reliability and on-time performance. Station design, in terms of
entrance and exit locations etc., plays an important role for the distribution of
crowding. In addition, day-to-day fluctuations in passenger demand will inevitably
lead to uneven crowding and non-utilized capacity on some trains. It is therefore
valuable to also consider real-time operational strategies, in particular real-time
crowding information (RTCI), for equalizing passenger loads between cars.
Real-time information systems for vehicle arrival and travel times are available
in many public transport systems world-wide, and have been shown in several
studies to have positive effects on perceived waiting times, safety and security,
impacts of service disruptions, and general satisfaction (e.g., Dziekan and
Kottenhoff 2007; Zhang et al. 2008; Watkins et al. 2011; Cats and Jenelius 2014;
Eboli and Mazzulla 2015). Systems providing real-time information about crowding
484 Y. Zhang et al.
123

in arriving vehicles, however, are less common in practice. In theory, RTCI
provision allows travelers to make better informed decisions about whether to board
a vehicle or not, and which car of the vehicle to board, based on their preferences for
crowding, walking distance, total travel time etc. Thus, RTCI could increase
passenger satisfaction and service quality, which would be attractive for public
transport authorities and operators. On the other hand, new technology is associated
with costs for installation, operations and maintenance, and there may be concerns
that it could lead to information overload and confusion for travelers. Thus, there is
a strong need for studies that evaluate the effectiveness of RTCI provision for
influencing traveler satisfaction, behavior and passenger load distribution. As far as
we are aware, however, the impacts of RTCI have not been reported previously in
the scientific literature.
This paper investigates the impact of real-time crowding information provision
based on a pilot study in the Stockholm metro network. During two weeks in May
2015, an experiment was carried out in which a prototype RTCI system was
implemented at Tekniska Hogskolan station. RTCI about the next arriving train was
communicated to waiting travelers through visual displays and speakers. In this
paper, the effectiveness of the system is evaluated with three complementary
methods: video analysis of travelers’ responses and reactions to the information,
surveys among waiting travelers, and passenger load measurements in train cars.
The distribution of boarding passengers between cars during the experiment is
compared against a control period from the previous year, and the impact of RTCI is
statistically evaluated.
The paper is organized as follows. Section 2 describes the Stockholm metro
RTCI case study. Section 3 describes the methodology used to evaluate the impact
of the RTCI system. Results are given in Sects. 4, and 5 concludes the paper.
2 RTCI pilot study
2.1 Case study setting
The number of passengers in the Stockholm metro is steadily increasing; in 2014,
the annual average daily number of boarding passengers was 1,205,000, an increase
of 19% since 2004 (SL 2015). Several segments of the metro network are subject to
significant crowding during the morning and afternoon peaks. The practical capacity
(used by the Stockholm public transport authority) of a standard 3-car metro train is
650 passengers, while the technical capacity (obtained from the train manufacturer)
is 1200 passengers. On some segments passenger loads during peak hours are
consistently close to or even exceeding the practical capacity. However, passenger
loads are often unevenly distributed among cars, so that available capacity is not
fully utilized even during rush hours. In the afternoon peak, only between 55% and
90% of available seats on different metro lines are occupied on average (SL 2015).
Public transport operators in Stockholm are evaluated based on a set of quality-
of-service standards defined by the regional public transport authority (SL). In-
vehicle crowding is one of the quality aspects, where three levels of quality are
Impact of real-time crowding information 485
123
defined based on the utilization of available standee areas as shown in Table 1,
second column. These definitions are common for trains, metro and buses. For the
purposes of this study, the quality-of-service levels are expressed in terms of the
total number of passengers in a standard metro car, based on typical distributions
between sitting and standing passengers in the metro (Table 1, third column).
Considering the crowding quality-of-service assessments, there are clear
incentives for the metro operator to invest in measures that reduce the inequality
of passenger loads between train cars. Towards this goal, a pilot study of the
effectiveness of real-time crowding information provision was carried out in May
2015. A screening of potential deployment locations where RTCI provision could be
accurate, effective and technically feasible was first conducted (see further Zhang
2015). The platform for southbound trains at Tekniska Hogskolan station was
selected for the study. The station is located close to the main campus of KTH Royal
Institute of Technology and has entrances at both ends of the platform. In the
afternoon peak, the distribution of waiting passengers on the platform tends to be
heavily skewed with the centre of mass towards the south end (Fig. 1). There are
several reasons for the skewness of the distribution. First, during the afternoon peak
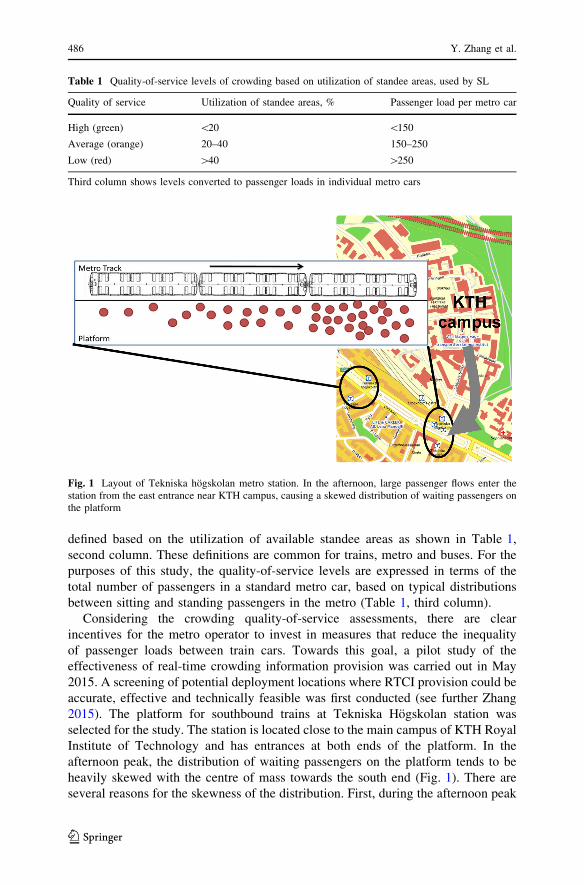
Table 1 Quality-of-service levels of crowding based on utilization of standee areas, used by SL
Quality of service Utilization of standee areas, % Passenger load per metro car
High (green) \20 \150
Average (orange) 20–40 150–250
Low (red) [40 [250
Third column shows levels converted to passenger loads in individual metro cars
Fig. 1 Layout of Tekniska hogskolan metro station. In the afternoon, large passenger flows enter thestation from the east entrance near KTH campus, causing a skewed distribution of waiting passengers onthe platform
486 Y. Zhang et al.
123
hours large passenger flows enter the quite narrow platform from the south entrance
near the campus, while few passengers arrive from the north entrance (Fig. 1).
Second, several downstream stations, including the central hub T-Centralen, have
popular exits located at the south end of the platforms, which means that boarding
the first car is attractive for minimizing walking distance and door-to-door travel
time.
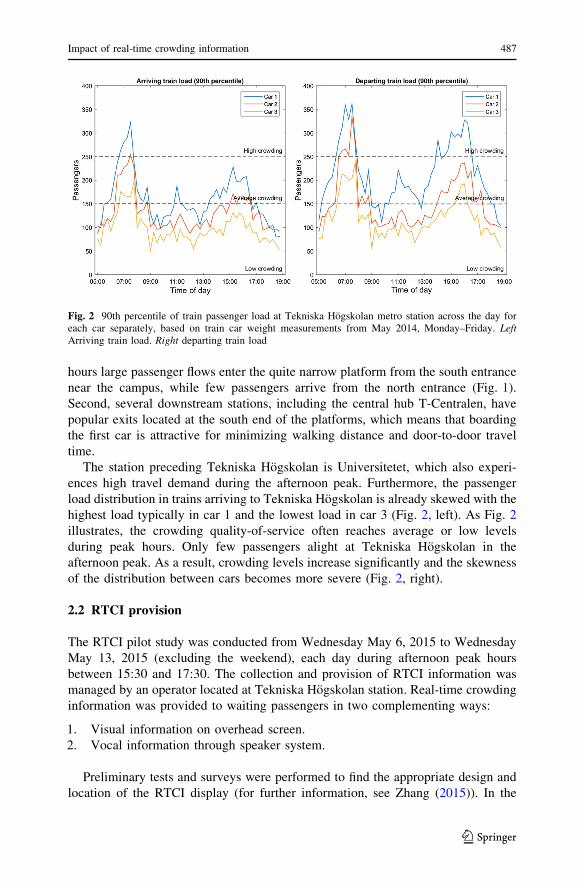
The station preceding Tekniska Hogskolan is Universitetet, which also experi-
ences high travel demand during the afternoon peak. Furthermore, the passenger
load distribution in trains arriving to Tekniska Hogskolan is already skewed with the
highest load typically in car 1 and the lowest load in car 3 (Fig. 2, left). As Fig. 2
illustrates, the crowding quality-of-service often reaches average or low levels
during peak hours. Only few passengers alight at Tekniska Hogskolan in the
afternoon peak. As a result, crowding levels increase significantly and the skewness
of the distribution between cars becomes more severe (Fig. 2, right).
2.2 RTCI provision
The RTCI pilot study was conducted from Wednesday May 6, 2015 to Wednesday
May 13, 2015 (excluding the weekend), each day during afternoon peak hours
between 15:30 and 17:30. The collection and provision of RTCI information was
managed by an operator located at Tekniska Hogskolan station. Real-time crowding
information was provided to waiting passengers in two complementing ways:
1. Visual information on overhead screen.
2. Vocal information through speaker system.
Preliminary tests and surveys were performed to find the appropriate design and
location of the RTCI display (for further information, see Zhang (2015)). In the
Fig. 2 90th percentile of train passenger load at Tekniska Hogskolan metro station across the day foreach car separately, based on train car weight measurements from May 2014, Monday–Friday. LeftArriving train load. Right departing train load
Impact of real-time crowding information 487
123

evaluation it was emphasized that the information should be easily noticed and
understood by passengers. The final design and location are shown in Fig. 3. The
RTCI was displayed near the south end of the platform where most passengers enter,
next to the permanent display of real-time arrival time information. The information
was projected onto a screen using an LED projector mounted in the ceiling and
connected to a laptop computer. Considering the large share of international
travelers from KTH campus, the display included information in both Swedish and
English. Each car in the train was shown in color based on the crowding level in the
next arriving train. The colors correspond to the three levels of crowding quality-of-
service (Table 1). Thus, green color means low crowding (less than 150
passengers), orange color means average crowding (between 150 and 250
passengers), and red color means high crowding (more than 250 passengers). The
arrow indicates the driving direction of the train.
The audio-based information system was employed as a complement to the visual
display during parts of each test day. The same information as displayed on the
screen was communicated in both Swedish and English spoken language.
Depending on the crowding levels of the next train, the message transmitted in
English was
1. ‘‘Welcome to Tekniska Hogskolan. Here is real-time crowding information for
the next metro:’’
2. ‘‘The first train unit is almost full, it is overcrowded/half full, with some
standing areas/less crowded, it might have seats left.’’
Fig. 3 Design and location of the RTCI display
488 Y. Zhang et al.
123

3. ‘‘The second train unit is almost full, it is overcrowded/half full, with some
standing areas/less crowded, it might have seats left.’’
4. ‘‘The last train unit is almost full, it is overcrowded/half full, with some
standing areas/less crowded, it might have seats left.’’
5. ‘‘We wish you a pleasant journey in Stockholm.’’
The message in Swedish was similar. The vocal information was transmitted
through a floor-mounted speaker installed close to the RTCI screen and controlled
from the same laptop computer.
2.3 RTCI collection
For the pilot study, automated collection of crowding information was not available
in real-time. A simple technical method was used for collecting the crowding
information and transmitting it to the operator. An officer stationed at Universitetet
station observed the level of crowding quality-of-service in each car (low, average
or high according to the standard in Table 1) as the train departed, and reported the
information to the operator at Tekniska Hogskolan via a handheld transceiver.
The planned headway of the metro line is 5 min, and the normal travel time from
Universitetet to Tekniska Hogskolan station is 2 min and 20 s. In order to provide
crowding prediction at all times, historical crowding data was combined with the
real-time observations. When the next train had not yet departed from the preceding
station, the system used historical average crowding levels for the relevant time
interval. The historical crowding information was projected on the screen only.
When the next train had departed from the preceding station, the information was
updated according to the transmitted report, and the speaker (during the periods it
was deployed) was also used to spread the information.
The passenger load data used to compute historical crowding levels were
obtained from weight measurements in the air suspension system of every train car.
The number of passengers in each car was estimated based on an average weight of
78 kg per passenger including luggage.
3 Evaluation methodology
In order to be effective, real-time crowding information should be provided in a way
that is noticed and understood by the travelers. In this study, the impact of the RTCI
provision during the pilot test is evaluated in three aspects: First, the extent to which
passengers noticed the provided information (attention). This is evaluated using
video recordings of the passengers waiting on the platform. Second, the extent to
which passengers found the provided information comprehensible and useful
(valuation). This is evaluated based on surveys conducted with waiting passengers
on the platform. Third, the extent to which passengers changed their choice of which
train car to board (action). This is evaluated based on passenger load data collected
during the test period (collected by USB memory sticks but not available in real-
time) and data collected during a reference period the previous year. The evaluation
Impact of real-time crowding information 489
123

methodology is summarized in Table 2, and each aspect is described in more detail
below.
3.1 Video analysis
During three of the six test days (May 7, 8 and 11, 2015), a video camera was used
for recording passengers’ behavior as they passed below the RTCI screen. If
passengers showed any clear reaction such as looking up or pointing to the sign,
they are considered to have noticed the sign, otherwise not. The impact of the RTCI
provision on passenger attention is evaluated based on the share of passengers
noticing the displayed information. The speaker system is evaluated by comparing
the share of people noticing the information with the speaker system turned on and
off, respectively.
3.2 Passenger surveys
To evaluate passengers’ attention of the provided RTCI, interviews were conducted
with passengers waiting on the platform regarding the projection system and the
speaker system. For each system, respondents were asked whether they could
understand the conveyed information (yes or no), and to what extent they found the
information useful (on a scale from 1 to 5, 1 meaning not useful and 5 meaning very
useful). They also had the opportunity to give general comments and feedback about
the system. Information about the gender and age of the respondent was also
collected.
3.3 Train car load data
The extent to which passengers altered their choice of which train car to board is
evaluated using passenger load data from the same source as was used to provide
historical RTCI information during the test. Information about the passenger load in
each car is available for every train departing Universitetet as well as Tekniska
Hogskolan during the test period. The number of passengers boarding each car at
Tekniska Hogskolan is not directly observed and needs to be estimated. Considering
that very few passengers alight at Tekniska Hogskolan during the afternoon peak,
the number of passengers Nij boarding car j ¼ 1; 2; 3 in train i is estimated by the
difference in passenger load after departing from Universitetet, VUNTij , and after
departing from Tekniska Hogskolan, VTEHij ,
Table 2 RTCI impact evaluation methodology
RTCI impact Evaluation method
Attention: passengers notice information Video analysis
Valuation: passengers consider information useful Passenger surveys
Action: passengers change car boarding choice Train car load data
490 Y. Zhang et al.
123
Nij ¼ VTEHij � VUNT
ij ; j ¼ 1; 2; 3 ð1Þ
The share of passengers pij boarding each car is thus
pij ¼Nij
P3j0¼1 Nij0
; j ¼ 1; 2; 3: ð2Þ
The impact of RTCI on passengers’ choices is assessed by comparing the shares
of boarding passengers during the test period with a reference period when the RTCI
was not in place. As reference period the same days the previous year are used, i.e.,
from Wednesday May 7, 2014 to Wednesday May 14, 2014 (excluding the
weekend). It is hypothesized that there were no significant changes in passenger
behavior between the two periods apart from the introduction of RTCI.
4 Results
4.1 Traveler attention: video analysis
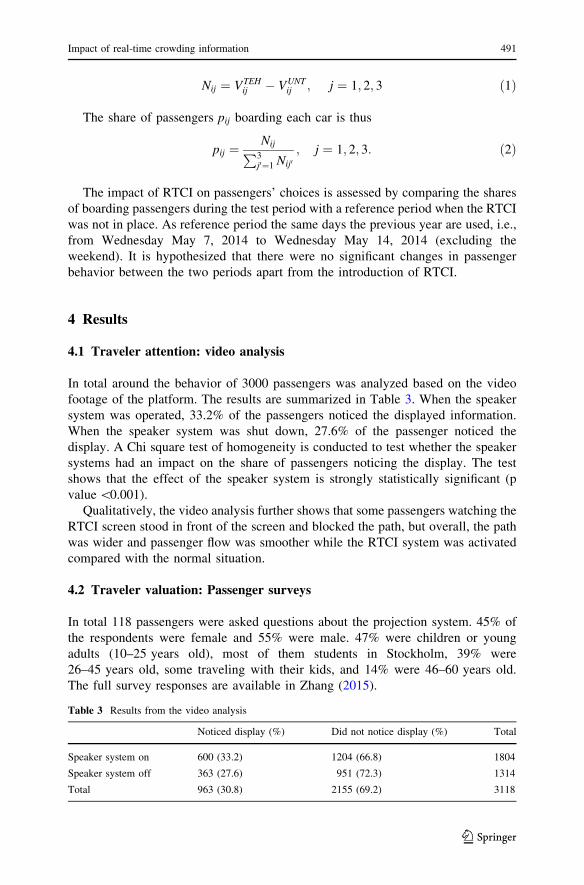
In total around the behavior of 3000 passengers was analyzed based on the video
footage of the platform. The results are summarized in Table 3. When the speaker
system was operated, 33.2% of the passengers noticed the displayed information.
When the speaker system was shut down, 27.6% of the passenger noticed the
display. A Chi square test of homogeneity is conducted to test whether the speaker
systems had an impact on the share of passengers noticing the display. The test
shows that the effect of the speaker system is strongly statistically significant (p
value\0.001).
Qualitatively, the video analysis further shows that some passengers watching the
RTCI screen stood in front of the screen and blocked the path, but overall, the path
was wider and passenger flow was smoother while the RTCI system was activated
compared with the normal situation.
4.2 Traveler valuation: Passenger surveys
In total 118 passengers were asked questions about the projection system. 45% of
the respondents were female and 55% were male. 47% were children or young
adults (10–25 years old), most of them students in Stockholm, 39% were
26–45 years old, some traveling with their kids, and 14% were 46–60 years old.
The full survey responses are available in Zhang (2015).
Table 3 Results from the video analysis
Noticed display (%) Did not notice display (%) Total
Speaker system on 600 (33.2) 1204 (66.8) 1804
Speaker system off 363 (27.6) 951 (72.3) 1314
Total 963 (30.8) 2155 (69.2) 3118
Impact of real-time crowding information 491
123

According to the interview results, 97% of all respondents could understand the
displayed information on the screen. As shown in Table 4, 46% thought that the
information was very useful for making travel decisions. 4% of the respondents
thought it was little useful and no one thought it was not useful. According to the
questionnaire results, most of these respondents were frequent travelers who have
short travel distances. To assess whether the perceptions differ among the age
groups, a Chi square test of homogeneity is conducted. The test shows that the
differences between age groups are not statistically significant (p value = 0.138).
113 passengers were asked questions regarding the speaker system. Of the
respondents, 45% were female and 55% were male, the same distribution as in the
survey on the projection system. 49%were 10–25 years old, 39%were 26–45 years old,
and12%weremore than46 yearsold.Only8%of the respondents considered the speaker
system to be very useful, while around half (46%) thought the system was not useful or
little useful for them (Table 5). Note, however, that the video analysis showed that the
speaker system increased the number of passengers that noticed the visual display.
A Chi square test of homogeneity is conducted to assess whether the perceptions
differ among the age groups. The test shows that the differences between age groups
are statistically significant at the 10% significance level but not at the 5% level
(p value = 0.0753). It is mainly the oldest age group that differs somewhat from the
two other age groups, with larger shares of respondents in both the negative and the
positive ends of the scale.
4.3 Traveler action: train car boarding distribution
Passenger load data are available for 57 trains during the test period and 72 trains
during the reference period of the previous year, in total 129 observations. One
additional observation from the reference period is removed from the data set since
the estimated number of boarding passengers in one car is negative. The
distributions of the passenger load on arriving trains at Tekniska Hogskolan are
Table 4 Interview responses regarding visual RTCI display
Age 1 (not useful) 2 (little useful) 3 (average) 4 (useful) 5 (very useful) Total
10–25 0 2 7 17 29 55 (47%)
26–45 0 1 5 18 22 46 (39%)
46–60 0 1 4 10 2 17 (14%)
Total 0 4 (3.5%) 16 (14%) 45 (39%) 53 (46%) 118
Table 5 Interview responses regarding audio RTCI through speakers
Age 1 (not useful) 2 (little useful) 3 (average) 4 (useful) 5 (very useful) Total
10–25 7 17 18 9 4 55 (49%)
26–45 7 17 6 10 5 45 (40%)
46–60 2 2 2 7 0 13 (12%)
Total 16 (14%) 4 (32%) 16 (23%) 45 (23%) 53 (8.0%) 113
492 Y. Zhang et al.
123
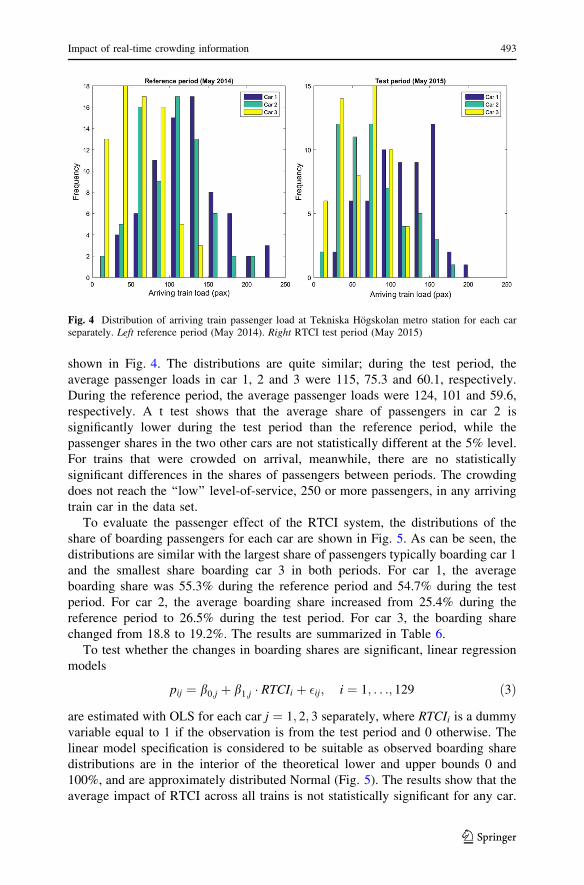
shown in Fig. 4. The distributions are quite similar; during the test period, the
average passenger loads in car 1, 2 and 3 were 115, 75.3 and 60.1, respectively.
During the reference period, the average passenger loads were 124, 101 and 59.6,
respectively. A t test shows that the average share of passengers in car 2 is
significantly lower during the test period than the reference period, while the
passenger shares in the two other cars are not statistically different at the 5% level.
For trains that were crowded on arrival, meanwhile, there are no statistically
significant differences in the shares of passengers between periods. The crowding
does not reach the ‘‘low’’ level-of-service, 250 or more passengers, in any arriving
train car in the data set.
To evaluate the passenger effect of the RTCI system, the distributions of the
share of boarding passengers for each car are shown in Fig. 5. As can be seen, the
distributions are similar with the largest share of passengers typically boarding car 1
and the smallest share boarding car 3 in both periods. For car 1, the average
boarding share was 55.3% during the reference period and 54.7% during the test
period. For car 2, the average boarding share increased from 25.4% during the
reference period to 26.5% during the test period. For car 3, the boarding share
changed from 18.8 to 19.2%. The results are summarized in Table 6.
To test whether the changes in boarding shares are significant, linear regression
models
pij ¼ b0;j þ b1;j � RTCIi þ �ij; i ¼ 1; . . .; 129 ð3Þ
are estimated with OLS for each car j ¼ 1; 2; 3 separately, where RTCIi is a dummy
variable equal to 1 if the observation is from the test period and 0 otherwise. The
linear model specification is considered to be suitable as observed boarding share
distributions are in the interior of the theoretical lower and upper bounds 0 and
100%, and are approximately distributed Normal (Fig. 5). The results show that the
average impact of RTCI across all trains is not statistically significant for any car.
Fig. 4 Distribution of arriving train passenger load at Tekniska Hogskolan metro station for each carseparately. Left reference period (May 2014). Right RTCI test period (May 2015)
Impact of real-time crowding information 493
123

A hypothesis is that RTCI provision has a larger impact on passengers’ car
boarding choices when the arriving train is crowded than when it is not crowded.
For crowded trains, RTCI should stimulate passengers to board the less crowded
cars. For uncrowded trains, the effect of RTCI should be smaller and may even be in
the reversed direction, signaling that choosing a less attractive car is not necessary
for avoiding crowding.
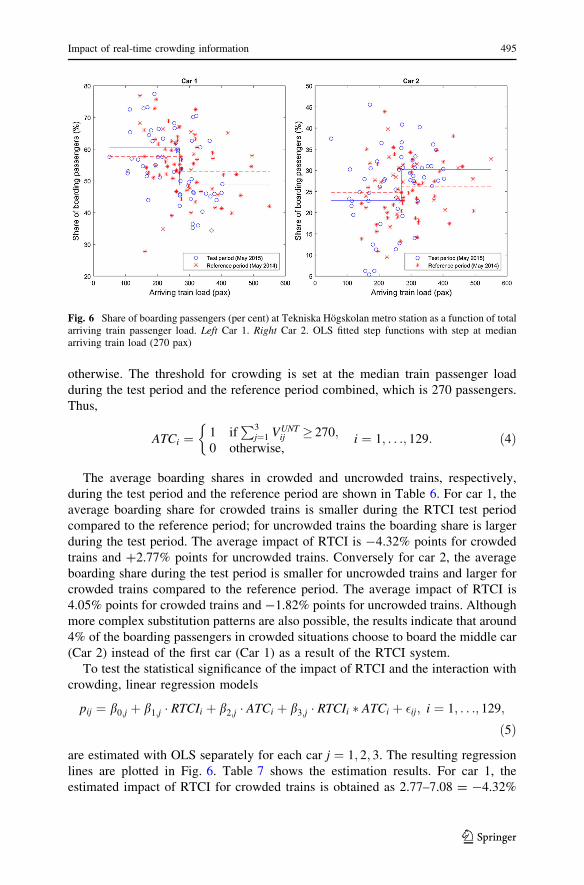
Figure 6 shows the share of boarding passengers during the test period and the
reference period as functions of the total arriving train passenger load for car 1 and
car 2, respectively. For car 1, the boarding share seems to decrease with the arriving
train load during both periods; for car 2, the trend is the opposite. To analyze the
impact of crowding on boarding shares, an indicator variable ATCi (‘‘arriving train
crowded’’) is introduced, taking value 1 if train i is crowded on arrival and 0
Fig. 5 Distribution of share of boarding passengers at Tekniska Hogskolan metro station for each carseparately. Left reference period (May 2014). Right RTCI test period (May 2015)
Table 6 Average share of
passengers boarding each car
during the test period and the
reference period
Top: Total across all trains.
Middle: Trains with passenger
load\270. Bottom: Trains with
passenger load C270
Car 1 Car 2 Car 3
Total
Test period 54.7% 26.5% 18.8%
Reference period 55.3% 25.4% 19.2%
Difference -0.607 pp 1.036 pp -0.429 pp
Arriving train uncrowded (load\270)
RTCI test period 60.5% 22.9% 16.6%
Reference period 57.7% 24.7% 17.6%
Difference 2.77 pp -1.82 pp -0.950 pp
Arriving train crowded (load C270)
RTCI test period 48.7% 30.2% 21.1%
Reference period 53.0% 26.1% 20.8%
Difference -4.32 pp 4.05 pp 0.262 pp
494 Y. Zhang et al.
123
otherwise. The threshold for crowding is set at the median train passenger load
during the test period and the reference period combined, which is 270 passengers.
Thus,
ATCi ¼ 1 ifP3
j¼1 VUNTij � 270;
0 otherwise,i ¼ 1; . . .; 129
�
: ð4Þ
The average boarding shares in crowded and uncrowded trains, respectively,
during the test period and the reference period are shown in Table 6. For car 1, the
average boarding share for crowded trains is smaller during the RTCI test period
compared to the reference period; for uncrowded trains the boarding share is larger
during the test period. The average impact of RTCI is -4.32% points for crowded
trains and ?2.77% points for uncrowded trains. Conversely for car 2, the average
boarding share during the test period is smaller for uncrowded trains and larger for
crowded trains compared to the reference period. The average impact of RTCI is
4.05% points for crowded trains and -1.82% points for uncrowded trains. Although
more complex substitution patterns are also possible, the results indicate that around
4% of the boarding passengers in crowded situations choose to board the middle car
(Car 2) instead of the first car (Car 1) as a result of the RTCI system.
To test the statistical significance of the impact of RTCI and the interaction with
crowding, linear regression models
pij ¼ b0;j þ b1;j � RTCIi þ b2;j � ATCi þ b3;j � RTCIi � ATCi þ �ij; i ¼ 1; . . .; 129;
ð5Þ
are estimated with OLS separately for each car j ¼ 1; 2; 3. The resulting regression
lines are plotted in Fig. 6. Table 7 shows the estimation results. For car 1, the
estimated impact of RTCI for crowded trains is obtained as 2.77–7.08 = -4.32%
Fig. 6 Share of boarding passengers (per cent) at Tekniska Hogskolan metro station as a function of totalarriving train passenger load. Left Car 1. Right Car 2. OLS fitted step functions with step at medianarriving train load (270 pax)
Impact of real-time crowding information 495
123
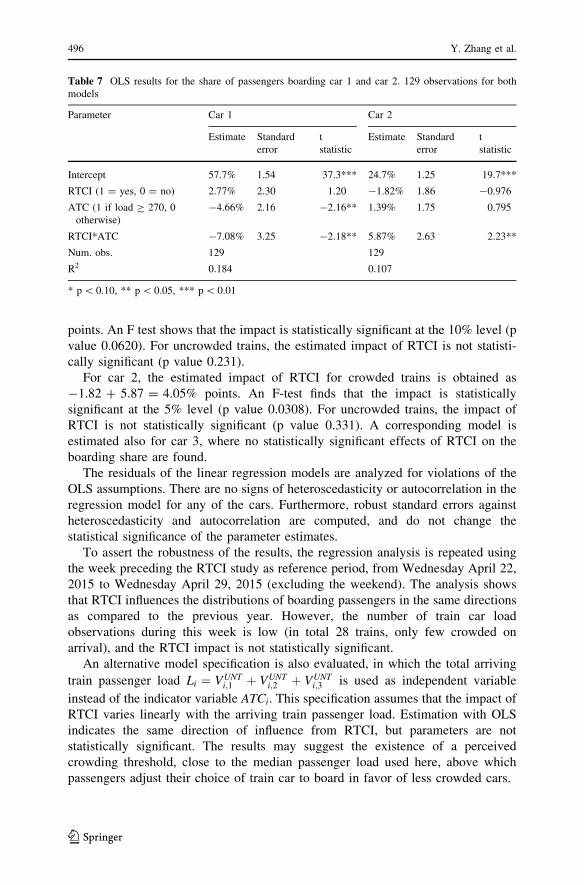
points. An F test shows that the impact is statistically significant at the 10% level (p
value 0.0620). For uncrowded trains, the estimated impact of RTCI is not statisti-
cally significant (p value 0.231).
For car 2, the estimated impact of RTCI for crowded trains is obtained as
-1.82 ? 5.87 = 4.05% points. An F-test finds that the impact is statistically
significant at the 5% level (p value 0.0308). For uncrowded trains, the impact of
RTCI is not statistically significant (p value 0.331). A corresponding model is
estimated also for car 3, where no statistically significant effects of RTCI on the
boarding share are found.
The residuals of the linear regression models are analyzed for violations of the
OLS assumptions. There are no signs of heteroscedasticity or autocorrelation in the
regression model for any of the cars. Furthermore, robust standard errors against
heteroscedasticity and autocorrelation are computed, and do not change the
statistical significance of the parameter estimates.
To assert the robustness of the results, the regression analysis is repeated using
the week preceding the RTCI study as reference period, from Wednesday April 22,
2015 to Wednesday April 29, 2015 (excluding the weekend). The analysis shows
that RTCI influences the distributions of boarding passengers in the same directions
as compared to the previous year. However, the number of train car load
observations during this week is low (in total 28 trains, only few crowded on
arrival), and the RTCI impact is not statistically significant.
An alternative model specification is also evaluated, in which the total arriving
train passenger load Li ¼ VUNTi;1 þ VUNT
i;2 þ VUNTi;3 is used as independent variable
instead of the indicator variable ATCi. This specification assumes that the impact of
RTCI varies linearly with the arriving train passenger load. Estimation with OLS
indicates the same direction of influence from RTCI, but parameters are not
statistically significant. The results may suggest the existence of a perceived
crowding threshold, close to the median passenger load used here, above which
passengers adjust their choice of train car to board in favor of less crowded cars.
Table 7 OLS results for the share of passengers boarding car 1 and car 2. 129 observations for both
models
Parameter Car 1 Car 2
Estimate Standard
error
t
statistic
Estimate Standard
error
t
statistic
Intercept 57.7% 1.54 37.3*** 24.7% 1.25 19.7***
RTCI (1 = yes, 0 = no) 2.77% 2.30 1.20 -1.82% 1.86 -0.976
ATC (1 if load C 270, 0
otherwise)
-4.66% 2.16 -2.16** 1.39% 1.75 0.795
RTCI*ATC -7.08% 3.25 -2.18** 5.87% 2.63 2.23**
Num. obs. 129 129
R2 0.184 0.107
* p\ 0.10, ** p\ 0.05, *** p\ 0.01
496 Y. Zhang et al.
123
5 Discussion and conclusion
The paper evaluated the effects of real-time crowding information provision based
on a pilot study in the Stockholm metro. During a 6-day test period, information
about the crowding level-of-service in each car of the next arriving train was
provided through a visual display and speakers to passengers at Tekniska Hogskolan
metro station. The impacts were evaluated in three dimensions: (1) passenger
attention was analyzed using video analysis; (2) passenger valuation was evaluated
with traveler surveys; (3) passenger action was analyzed with in-vehicle passenger
load data.
Analysis of video recordings shows that around 31% of passengers arriving to the
platform noticed the information display. The speaker system had a statistically
significant positive impact on the share of passengers noticing the display. Based on
the passenger surveys, 97% of the respondents were able to understand the provided
information. 85% of the respondents found the visual information useful or very
useful for their travel decisions, while only 31% found the vocal information useful
or very useful. No major differences between different age groups were found.
Considering the results together, it can be estimated that around
31%�97%�85% = 25% of the passengers noticed, understood and considered the
provided information useful for their travel decisions.
Furthermore, analysis of train passenger load data shows statistically significant
evidence that RTCI reduced the share of passengers boarding the first, most
crowded car by 4.3% points on trains that were crowded on arrival. Meanwhile, the
share of passengers boarding the second, less crowded car increased by 4.1% points.
For trains not crowded on arrival, RTCI worked in the opposite direction and
increased the boarding share of car 1 by 2.8% points and reduced the boarding share
of car 2 by 1.8% points, although these changes are not statistically significant.
RTCI did not significantly influence the boarding share of the last, generally least
crowded car.
The passenger load analysis shows that RTCI had a measureable, positive impact
on the boarding distribution between cars and, as a result, on the downstream in-
vehicle crowding in the trains. The observed change in boarding distribution is
smaller than the share of passengers who noticed, understood and considered the
RTCI useful according to the video and interview analysis. The findings suggest that
many passengers may value the provided crowding information positively even
though it does not change their travel decisions. This is in line with previous studies
regarding the value of information provision in public transport and passengers’
valuations of different trip attributes. For many passengers, minimizing walking
distance and door-to-door travel time may be stronger incentives than crowding for
choosing a particular train car. Other factors such as on-platform crowding and time
constraints may also have limited the extent to which passengers were able to adjust
their car boarding choice.
The pilot study suggests that RTCI may be a useful technology for public
transport operators and agencies for increasing the utilization of available train
capacity and reducing crowding. To generalize the results, further studies should be
Impact of real-time crowding information 497
123

carried out in other locations with varying characteristics of in-vehicle crowding,
distribution of waiting passengers on the platform, design of the RTCI system etc.
For permanent implementations of RTCI systems, research on technologies for
collecting, processing and transmitting crowding information in real-time is an
important area. Another direction for further research is short-term prediction of
crowding conditions for earlier and possibly more effective RTCI provision.
Acknowledgements The authors would like to thank MTR Nordic and Stockholm County Council
Transport Administration for the participation and support of the pilot study and evaluation. The authors
also wish to thank two anonymous reviewers for helpful comments on an earlier version of the paper. The
evaluation work was financially supported by MTR Nordic and TRENoP Strategic Research Area.
Open Access This article is distributed under the terms of the Creative Commons Attribution 4.0
International License (http://creativecommons.org/licenses/by/4.0/), which permits unrestricted use, dis-
tribution, and reproduction in any medium, provided you give appropriate credit to the original
author(s) and the source, provide a link to the Creative Commons license, and indicate if changes were
made.
References
Beirao G, Sarsfield-Cabral JA (2007) Understanding attitudes towards public transport and private car: a
qualitative study. Transp Policy 14(6):478–489
Cats O, Jenelius E (2014) Dynamic vulnerability analysis of public transport networks: mitigation effects
of real-time information. Netw Spat Econ 14(3–4):435–463
Dziekan K, Kottenhoff K (2007) Dynamic at-stop real-time information displays for public transport:
effects on customers. Transp Res Part A 41:489–501
Eboli L, Mazzulla G (2015) Relationships between rail passengers’ satisfaction and service quality: a
framework for identifying key service factors. Public Transp 7:185–201
Hensher DA, Rose JM, Collins AT (2011) Identifying commuter preferences for existing modes and a
proposed Metro in Sydney, Australia with special reference to crowding. Public Transp 3:109–147
Kim KM, Hong S-P, Ko S-J, Kim D (2015) Does crowding affect the path choice of metro passengers?
Transp Res Part A 77:292–304
Kim H, Kwon S, Wu SK, Sohn K (2014) Why do passengers choose a specific car of a metro train during
the morning peak hours? Transp Res Part A 61:249–258
Lam WHK, Cheung C-Y, Lam CF (1999) A study of crowding effects at the Hong Kong light rail transit
stations. Transp Res Part A 33:401–415
Li Z, Hensher DA (2011) Crowding and public transport: a review of willingness to pay evidence and its
relevance in project appraisal. Transp Policy 18:880–887
Li Z, Hensher DA (2013) Crowding in public transport: a review of objective and subjective measures.
J Public Transp 16(2):107–134
Lin T, Wilson NHM (1992) Dwell time relationships for light rail systems. Transp Res Rec 1361:287–295
Qi Z, Baoming H, Dewei L (2008) Modeling and simulation of passenger alighting and boarding
movement in Beijing metro stations. Transp Res Part C 16:635–649
Raveau S, Guo Z, Munoz JC, Wilson NHM (2014) A behavioural comparison or route choice on metro
networks: time, transfers, crowding, topology and socio-demographics. Transp Res Part A
66:185–195
SL (2015) Fakta om SL och lanet 2014. Stockholm City Council, report SL 2015–1293. In: Swedish.
http://www.sll.se/Global/Verksamhet/Kollektivtrafik/Fakta%20om%20SL%20och%20l%C3%
A4net/Fakta%20om%20SL%20och%20l%C3%A4net%202014.pdf. Accessed 29 Nov 2016
Tirachini A, Hensher DA, Rose JM (2013) Crowding in public transport systems: effects on users,
operation and implications for the estimation of demand. Transp Res Part A 53:36–52
498 Y. Zhang et al.
123
TRB (2014) Transit Capacity and Quality of Service Manual, 3rd edn. Transit Cooperative Highway
Research Program (TCRP) Report 165, Transportation Research Board
Wardman M, Whelan GA (2011) Twenty years of rail crowding valuation studies: evidence and lessons
from British experience. Transp Rev 31(3):379–398
Watkins KE, Ferris B, Borning A, Rutherford GS, Layton D (2011) Where Is My Bus? Impact of mobile
real-time information on the perceived and actual wait time of transit riders. Transp Res Part A
45:839–848
Zhang Y (2015) Real-Time Crowding Information (RTCI) Provision: Impacts and Proposed Technical
Solution. M.Sc. Thesis, KTH Royal Institute of Technology, Sweden
Zhang F, Shen Q, Clifton KJ (2008) Examination of traveler responses to real-time information about bus
arrivals using panel data. Transp Res Rec 2082:107–115
Impact of real-time crowding information 499
123