Embed Size (px)
Citation preview

International Journal of Educational Planning & Administration. ISSN 2249-3093 Volume 2, Number 1 (2012), pp. 1-24 © Research India Publications http://www.ripublication.com/ijepa.htm
Impact of Public Interventions on Child School Enrollment Rates in India
Dr. J. Regi Manimagala
Associate Professor Department of Economics Stella Maris College (Autonomous)
17 Cathedral Road Chennai 600 086, India Email id: [email protected]
Abstract
In this paper an effort is made to anlayse the impact of public programmes in the determinants of school net enrollment rates of children aged 5 to 14 years in India within the household production framework. The empirical results based on the econometric analysis of aggregate district level data for 16 major Indian states lead to several key findings. Public programme variables such as, textbooks and uniforms freely distributed to primary school boys exert a positive and significant influence on the enrollment rates of children aged 5 to 9 years. The enrollment rate of children in the 5 to 9 age groups are significantly increased in schools that are provided with school development and teaching-learning material grants. The attendance of children in schools is significantly increased with increase in the distribution of textbooks, uniforms and attendance scholarships to upper primary school girls. Completed educational levels of adult male and females seem to be much important in improving children’s participation in schooling. The empirical results also suggest that the economic variable namely the per capita net domestic product of the states is a much more important determinant of child schooling. In districts where the percentage of rural and muslim population is substantial, child enrollment is significantly reduced.
Introduction India’s challenging task of ensuring universal elementary education (UEE) by 2010 has led the government to make substantial investments to achieve this goal. Programme of Action (POA) for UEE in 1990 includes schemes such as Operation Blackboard, District Primary Education Programmes (DPEP), Sarva Shiksha Abhiyan (SSA), Mid-day meal schemes or National Programme for Nutritional Support to
2 Dr. J. Regi Manimagala
Primary Education, Kasturba Gandhi Balika Vidhalaya (KGBV) and Janshala programmes, Teacher Education programmes etc. As a result of these government interventions, education infrastructure such as provision of adequate drinking water and toilet facilities including separate toilets for girls in schools, adequate class rooms, black boards, computers, book bank etc has increased diversely and also growth in terms of number of schools has lead to increased gross primary and upper primary enrollment rates, impressive gains in the overall gender parity enrollment index, etc. All these developments over the years have made significant impact, raising the hope that universal education could be a reality within the stipulated time period. Although the government has made several of these efforts both at the national and state levels to achieve the goal of universal elementary education, several challenges still remain: about 3.5 crores of children have never enrolled in schools, significant percentage of primary and upper primary children drop out of schools, gender parity index is lower for upper primary education and marginally improved for primary education, exclusion of specific social groups from education is endemic, the quality of education provided remains unsatisfactory etc. Thus the task is still far from complete. This raises several questions such as whether these public provisioning help improve child school enrollment? Previous studies examine the impact of public programmes on child school enrollment rates. For instance, Rosenzweig and Wolpin (1982) on governmental interventions and household behaviour in a developing country, King and Lillard (1987) on educational policy and schooling attainment in Malaysia and Phillippines, Hossain (1989) on effects of public programmes on family size, child education and health for Bangladesh, Rosenzweig, Duraisamy and Malathy (1990) on impact of public programmes on fertility and gender specific investment in human capital of children in rural India, Duraisamy (2001) on effectiveness of incentives on school enrollment and attainment in Tamil Nadu etc. A study using the data for recent years will enable us to understand the effectiveness of few government incentives in improving child school enrollment. School quality and learning outcomes can play a role in both supply and demand of education. If parents in poor rural households perceive the quality of their children schooling to be poor, they may be reluctant to send their children (White 2004). Moreover, if they find that children who attend school learn no more than those who do not attend schools as have been demonstrated in some studies in Africa (Glewwe 2002), then families may decide that benefits do not justify the costs. Demand factors often include assessment on the part of the families about the returns to schooling in terms of knowledge and skills developed compared to school costs in terms of both direct and indirect costs. Harbison and Hanushek (1992) reviewed the literature on the link between public spending (mostly in the health and education sectors) and its outcome in those sectors, examined several studies on developing countries that look at the association between public education spending and educational outcomes. Most of these studies report a statistical significant positive relation between the two, while other studies have found no evidence of any measurable impact of spending on outcomes. Hanushek (1950),
Impact Of Public Interventions On Child School 3
Mingat & Tan (1992, 1998) and Wolfe (2004) also find that there is little if any relation between public spending and educational outcomes. World Bank’s Primary Education Policy Paper (1990) identified 5 principal contributors to primary education effectiveness such as curriculum, learning materials, instructional time, class room teaching and student’s learning capacity. A comprehensive review of how the researches since 1990 has addressed the importance of these as well as other factors (such as school facilities, teacher training and management) has been assessed. Pritchett & Filmer (1999) present compelling evidence that there could be significant efficiency and productivity gains by re-allocating the shares of public expenditures to areas of high marginal productivity, such as learning materials (like text books and other types of instructional materials) especially in low income and middle income countries where availability of instructional materials and quality of school facilities is at a lower level. A minimum basic quality of school facilities matters significant for achievement outcomes. A basic standard of school facilities would include enough class rooms to accommodate about 40 students per classroom, sufficient desks in preference to using floor mats, chalk boards etc. In addition to this, adequate sanitation in terms of water and toilets is also an important aspect of school facilities for increasing the willingness of parents to enroll their children especially girls. In most cases, parents prefer separate toilets for boys and girls. Also, the average distance girls walk to get to school is a factor that becomes important as girls enter the upper grades of schooling. Studies show large gains in improved text book provision. There is also evidence that increased instructional time would improve learning achievement. Multi-grade teaching (due to lack of class rooms) has negative effects especially when it is related to lack of appropriate training for teachers in multi-grade pedagogy. This article is presented in the following manner. Section 1.2 describes the data source for the public programme variables used in the study and also present a descriptive analysis of the same. Section 1.3 outlines the extension of the theoretical framework to include the policy variables. In Section 1.4, the empirical model and the empirical measurement of public programme variables are discussed. Section 1.5 provides the empirical analysis of the linear combinations of basic determinants, other factors and public programme variables determining the enrollment rates of children aged 5 to 9, 10 to 14 and 5 to 14 years. In Section 1.6 the principal findings of the empirical research is summarized and tabulated. Data Base The data required for the analysis is compiled from several secondary sources such as Indian Population Census 2001, Central Statistical Organization (CSO) and District Information System for Education (D.I.S.E) data. The study is confined to 16 major Indian states covering 448 districts. They include: Andhra Pradesh , Assam , Bihar, Harayana , Gujarat , Himachal Pradesh , Karnataka , Kerala, Madhya Pradesh , Maharashtra , Orissa , Rajasthan , Tamil Nadu , Uttar Pradesh , Uttaranchal and West Bengal.

4 Dr. J. Regi Manimagala
Data on the total population attending educational institutions by age, sex and types of educational institution is obtained from C-series of the Social and Cultural tables (C-10) Census of India published by the Registrar General of India for the year 2001. Information on completed levels of education by age and sex of the population age 7 and above is taken from the census table: C-8 of the Social and Cultural tables. The data on per capita net state domestic product for 2000-01 produced on a regular basis by the Central Statistical Organisation (CSO), Government of India. Number of muslim population, scheduled caste and scheduled tribe population is obtained from the Primary Census Abstracts, 2001. Similar source also provides data on the number of population residing in rural areas. The data available for these states on government subsidies and schooling incentives are compiled from District Elementary Education Report Cards: 2003-04 (based on DISE data) and merged with the district-level data to study the impact of public programmes on school enrollment rates of the two age-group of children across the 448 districts. The information with respect to (I) number of beneficiaries (primary and upper primary school boys and girls) provided with incentives in the previous academic year: Text books, Uniforms, Attendance scholarships and Stationary and (II) Percentage of schools received Teaching-Learning Material (TLM) Grant and School Development Grants (SDG) in the previous year given in ‘primary only’ category and ‘upper primary only’ category were obtained from the report cards. Using the above data, a descriptive analysis is presented using tables and figures. This is followed by the specification of the theoretical framework underlying the empirical model and then discussion of the empirical results. Figure 1 presents the distribution of school development grants to primary and upper primary schools in the sample districts. The distribution shows that development grants received by primary schools are on an average higher than the grants received by upper primary schools. The percentage of primary schools that receive development grants is above 70 percent in large number of the districts (256 districts). The scenario is diverse for upper primary schools. In 107 districts, the percentage of upper primary schools having received school development grant is as low as 10 percent. In other words, in less than one-fourth of the districts (about 106 districts), above 70 percentages of upper primary schools in theses districts have obtained the development grant.
35
107
9
3428
41
22
46
24
3830
3844
38
57
3344
15
52
17
51
10
52
31
0
20
40
60
80
100
120
Dis
t rits
(No.
)
< 10
%
10 to
20
%
20 to
30
%
30 to
40
%
40 to
50
%
50 to
60
%
60 to
70
%
70 to
80
%
80 to
85
%
85 to
90
%
90 to
95
%
> 95
%
School Development Grants (%)
SDG:Primary level SDG:Upper Primary level

Impact Of Public Interventions On Child School 5
Figure 1: School development grants (%): Primary & Upper Primary schools. Source: Computed by the author from District Elementary Report Cards, 2003-04
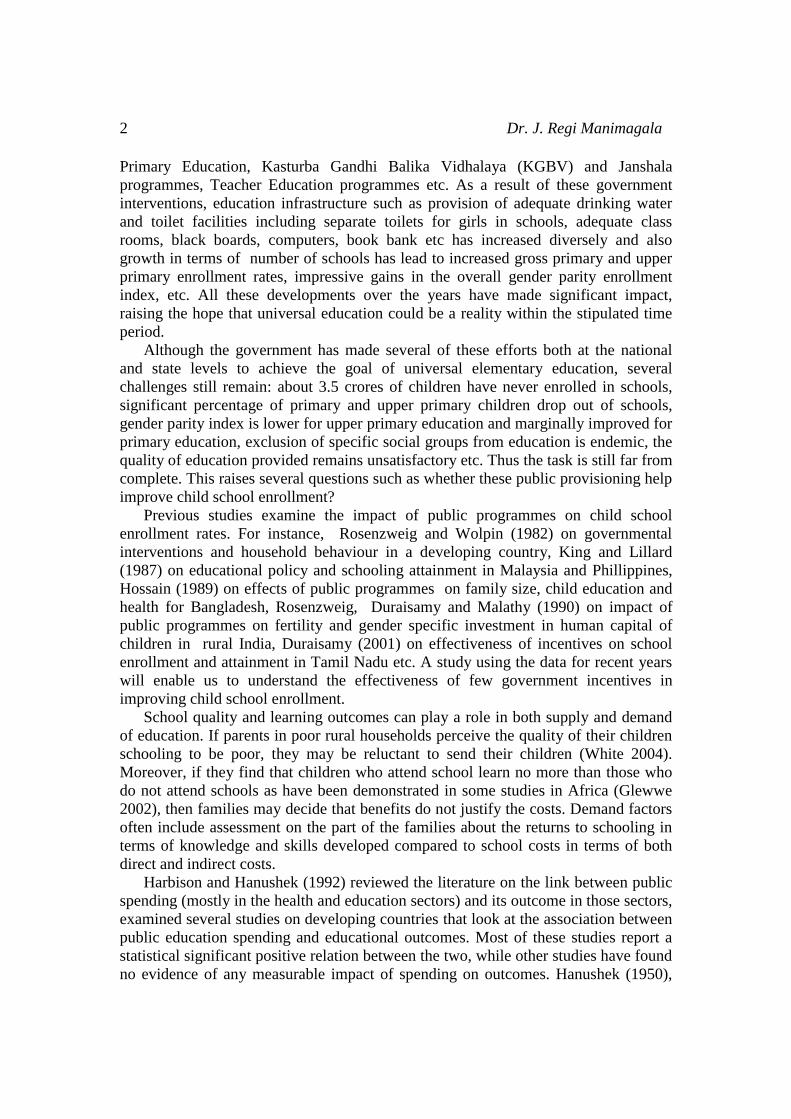
Figure 2 clearly shows that the percentage of teaching-learning material grants received by primary schools is again higher when compared to upper primary schools. While only less than 5 percent of the grant was received by upper primary schools located in 161 districts, above 80 percent of the grant was obtained by primary schools in the same number of districts.
Figure 2: Teaching-learning Material grants (%): Primary & Upper primary schools Source: Computed from District Elementary Report Cards, 2003-04
35
107
9
3428
41
22
46
24
3830
3844
38
57
3344
15
52
17
51
10
52
31
0
20
40
60
80
100
120
Dis
trits
( No .
)
< 10
%
10 to
20
%
20 to
30
%
30 to
40
%
40 to
50
%
50 to
60
%
60 to
70
%
70 to
80
%
80 to
85
%
85 to
90
%
90 to
95
%
> 95
%
School Development Grants (%)
SDG:Primary level SDG:Upper Primary level
0
161
0
45 55
0
42 42 32 28 30 31 343621
14
39
14
3422
83
21
78
34
020
406080
100120
140160180
Dis
trict
s (N
o.)
< 5
%
5 to
10
%
< 10
%
10 to
20
%
20 to
30
%
30 to
40
%
40 to
50
%
50 to
60
%
60 to
70
%
70 to
80
%
80 to
90
%
> 9
0 %
Teaching Learning Material (%)
TLM:Primary level TLM:Upper Primary level
0
161
0
45 55
0
42 42 32 28 3031 343621
14
39
14
3422
83
21
78
34
02040
6080
100120
140160
180
Dist
ricts
(No.
)
< 5
%
5 to
10
%
< 10
%10
to 2
0 %
20 to
30
%30
to 4
0 %
40 to
50
%50
to 6
0 %
60 to
70
%70
to 8
0 %
80 to
90
%
> 9
0 %
Teaching Learning Material (%)
TLM:Primary level TLM:Upper Primary level

6 Dr. J. Regi Manimagala
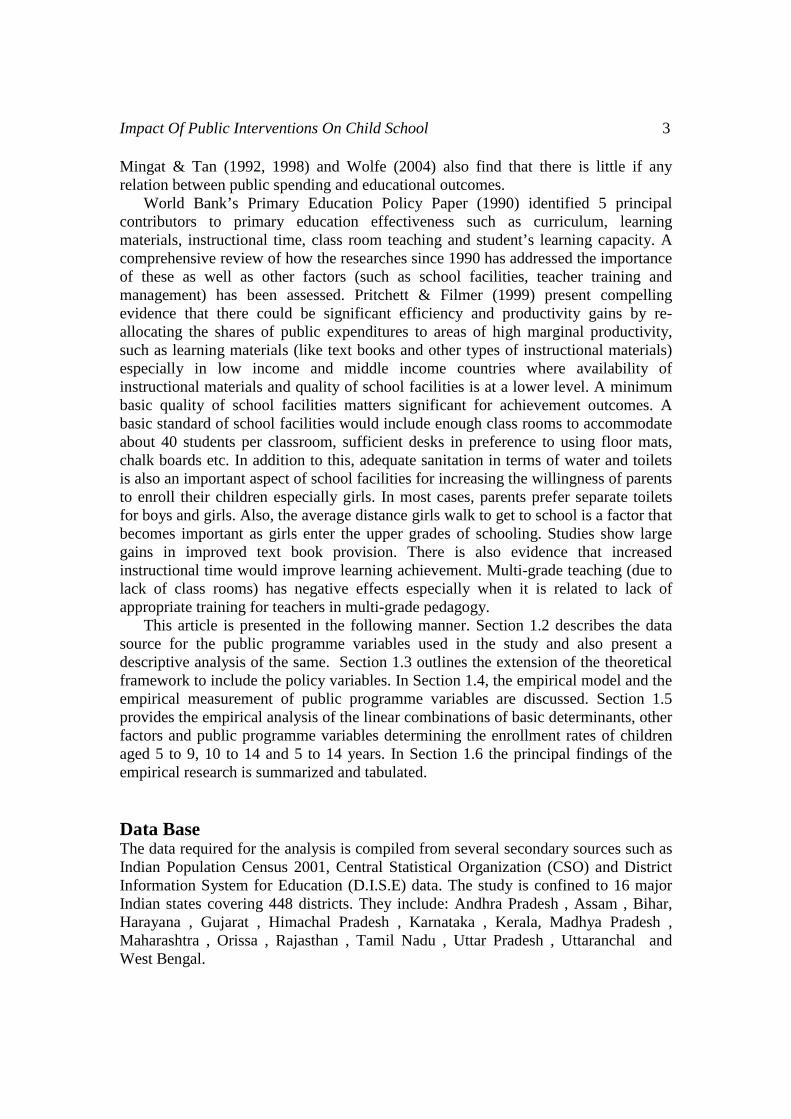
Figure 3 clearly shows that in almost more than half of the sample districts, only less than 5 percent of primary class children had received free uniforms, stationery and attendance scholarships in the previous academic year as schooling incentives by the government. On the other hand, the students who benefited from this scheme were more than 90 percent in very less number of districts.
Figure 3: Types of incentives received by Primary school Boys and Girls Figure 4 clearly demonstrates that very few upper primary school boys and girls in comparatively less number of districts had received different types of incentives. Further, the percentage of girls who had received these incentives is even less compared to boys in the same districts.
Figure 4: Types of incentives received by Upper Primary school Boys and Girls Source: Computed from District Elementary Report Cards, 2003-04
311
248
294
222259
242
39 27 38 26 25 26
0
50
100
150
200
250
300
350
Uniform (Boys) Uniform (Girls) Attendance (Boys)
Attendance (Girls)
Stationary(Boys) Stationary (Girls)
Dis
tric
ts (N
o.)
Types of Schooling Incentives < 5 % > 95 %
342 326259 237
304 294
38 371 1 1 00
50100150200250300350400
Uni
form
(B
oys)
Uni
form
(G
irls)
Atte
ndan
ce
(Boy
s)
Atte
ndan
ce
(Girl
s)
Sta
tiona
ry(B
oys)
Sta
tiona
ry
(Girl
s)% o
f stu
dent
s in
the
dist
ricts
< 5 %

Impact Of Public Interventions On Child School 7
Table 1 demonstrates that relatively a large number of students were beneficiaries of textbooks.
Table 1: Percentage distribution of incentives among students
% Students
Textbooks (Pri. Boys) Textbooks (Pri. Girls)
Textbooks (Upp.Pri. Boys)
Textbooks (Upp.Pri. Girls)
< 5 55 38 122 55 5 to 10 76 75 92 76 10 to 15 66 75 41 66 15 to 20 60 61 27 60 20 to 25 42 40 17 42 25 to 30 23 40 26 23 30 to 35 35 33 28 35 35 to 40 25 21 15 25 40 to 45 11 25 10 12 45 to 50 19 15 17 19
> 50 36 25 53 36 Source: Computed from District Elementary Report Cards, 2003-04
Theoretical Formulation Of The Model The methodology employed for this study assumes that the government programs alter the household behaviour with respect to investment decisions in the human capital of children. Provision of subsidies and free incentives is expected to increase the investment in the human capital thereby increasing school enrollment. Hence, a more accurate approach to evaluate the impact of public programs on schooling outcomes is done by examining its influence on household family behaviour based on a more comprehensive theoretical household production framework developed in Rosezweig and Wolpin (1982, 1986); Behrman (1988); Duraisamy & Malathy (1990). These conventional models have integrated program variables into the model of household choice. Thus the household production model has been extended to include the public programs as factors determining child school enrollment rates. The household Utility function comprises of schooling of children (S) and a composite consumption good (Z). Thus the household utility function can be written as: (1) U = U ( S, Z) Public programs include schooling subsidies and free schooling incentives that reduce the input cost related to schooling of children. The budget constraint after integrating the public programmes can be stated as follows: (2) F = (PS – A S ) S + P Z Z where PS and P Z are prices of child schooling and other consumption goods respectively, A S is the schooling subsidy.

8 Dr. J. Regi Manimagala
Maximising the Utility function (1) subject to the budget constraint (2), the demand function can be specified as follows: (3) S = S (P S, PZ, A S, Y) where PS is price of child schooling, PZ is cost of composite goods, AS is school subsidy and Y is the income. The derivation of the model is given in Duraisamy (1983, 1993). Empirical model and description of public programme variables Corresponding to the theoretical demand model for child schooling derived in the previous section, the estimating equation of the demand for child schooling can be written as follows: Si = a0 + a1 P1i + a2 Y2i + a3 E3i + a 4 A 4i +Ui ; i = 1,2……n, number of districts Si is the age-specific net enrollment rates, P is a set of variables measuring the educational attainment of adult population measured by percentage of adult males and females completed primary and above secondary levels of education, a proxy variable for parental education; Y is the per capita net state domestic product, a proxy for income variable; E is a set of other determinants which include percentage of muslim, scheduled caste and tribes and rural population; A is the vector of public program variables which include percentage of primary and upper primary student beneficiaries who have received free text books, uniforms, attendance scholarships and free stationary and percentage of primary and upper primary schools having obtained school development grants and teaching-learning materials grant, Ui is the random disturbance term and a’s are a set of parameters to be estimated. The impact of public programmes and other factors on age-specific enrollment rates forms the basis of analysis. A set of exogenous variables such as: educational attainment of adult males and females The empirical measurements of these factors are discussed below. Dependant variable: Net Enrollment Rate (NER): In this study, the demand for child schooling is measured by the Net Enrollment Ratio (NER). NER is the number of children of official school-age group who are enrolled in schools to the total population in that official age group. NER measures the percentage of children currently attending the age-appropriate level of schooling. The enrollment rate is examined for two age groups of children, 5 to 9 and 10 to 14 years. Age-specific net enrollment rates of children is obtained on the basis of the number of children in the age group of 5 to 9 or 10 to 14 years enrolled in schools as a percentage of the total children in the relevant age group. A large number of children aged 5 to 9 are in the primary level and those aged between 10 and 14 years are in the upper primary schooling levels. Hence these age groups are also considered for the corresponding schooling levels. The net enrollment rates of school children in the 5 to 9 and 10 to 14 age groups are estimated separately using Ordinary Least Squares [OLS] method.

Impact Of Public Interventions On Child School 9
The empirical demand for child schooling is a function of price or costs of schooling, income and a set of control factors which vary systematically across the districts. The empirical measurement of these variables and the signs of their effects are discussed below. Explanatory Variables: Level of Education of Adult Males and Females The educational attainment of adult male and female population is taken as a proxy for parental education and indirect cost (price) of child schooling for the study. Educational attainment of adult males and females is measured as the percent of males and females aged 15 and above who have completed primary and above secondary levels of education. Improvements in the educational levels of the adult population are expected to significantly increase the net enrollment rates of school children. The studies on child schooling show that the parental educational attainment levels exert a positive and statistically significant effect in all measures of child schooling (Rosenzweig & Evenson 1977; Duraisamy 1993; Duraisamy & Malthy, 1990). Education of parents is included to reflect income effect, price effect, information effects and also unobserved family background effects (Anderson 1983; Duraisamy 2001, 2004). Improvements in the educational attainments of adult population lead to an increase in their income earning capacity or increase in their income levels. Thus education is taken to indicate the income levels of adult population (income effect). This means better educational attainments among the adult population will facilitate them to invest more in the human capital of the children and thereby enhance the school participation rates of the children. The price effect of education includes the opportunity cost of time. The more educated have a higher opportunity cost of time. If time is an effective input in the production of child schooling, then the price effect exerts a negative impact on the school enrollment rates (Duraisamy & Malthy, 1990). Per capita Net State Domestic Product Information on income at the district-level is not available. Therefore, an alternative measure namely Per capita Net State Domestic Product (PCNSDP) is used. The per capita net domestic product of the states is taken to represent the incomes of its respective districts. This measure enables to capture the income effect on the demand for school enrollment rates. Income is expected to have a positive influence on child schooling measures. It is hypothesized that child schooling increases with increase in the measure of income or wealth (Resenzweig & Evenson, 1977; Schultz, 1988, Duraisamy, 1988).

10 Dr. J. Regi Manimagala
Other Determinants A set of control factors, namely percent of scheduled caste and scheduled tribe population and muslim population is included to capture the influence of socio-cultural and institutional factors on the demand for child school enrollment (Duraisamy & Malathy, 1990). The percentage of population living in the rural areas of the sample districts is also included in the set of control factors. To calculate these variables, the corresponding number of muslims, scheduled caste and scheduled tribes and rural population is expressed as a percentage of the total population in the districts. Several studies point out that school distance and percentage of population living in the rural areas as significant determinants of school enrollment especially in rural areas of developing countries (King & Lillard, 1987; Duarisamy & Malathy, 1990). The rurality of a district may negatively influence rural school enrollment to the extent that the returns to schooling are higher in non-agricultural jobs and the probability of obtaining these jobs is negatively correlated with proximity to urban areas; similarly, the more rural the districts the more likely children are to be employed in agriculture (Rosenzweig & Evenson, 1977). Public Program Variables In order to study the impact of public programs on the age-specific demand for child schooling; the following information was obtained both at ‘Primary’ and ‘Upper Primary’ levels which approximately corresponds to 5 to 9 and 10 to 14 years age group: percentage of schools that had received School Development Grants [SDG] and Teaching – Learning Material Grants [TLM], percentage of primary and upper primary school children distributed with free text books, free uniforms, free stationary and attendance scholarships. The school-related indicators under two categories, that is, ‘Primary only’ and ‘Upper Primary only’ alone were considered for analysis purpose. Accordingly the number of primary school boys who had received text books/uniforms/attendance scholarships/stationery to the total number of boys in the 5 to 9 age group enrolled in schools measured the percentage of boys in primary schools who had received types of incentives in the previous academic year. In a similar manner, the percentage of primary school girls who received the different types of incentives was computed. To obtain the percentage of upper primary boys (girls) who received types of incentives, the number of upper primary school boys who had received textbooks/uniforms/attendance scholarships/stationery as a ratio of the total number of boys (girls) in the 10-14 age groups enrolled in schools. Provision has been made both under the DPEP and SSA program to provide a grant of Rs. 2000 per annum on account of school development to all schools that impart elementary education. Similarly, a provision of Rs.500 per teacher per annum is also made on account of TLM grant. The percentage of only primary schools and only upper primary schools who had received TLM and SDG grants in the previous year was obtained directly from the district report cards. These variables were included to capture the impact of schooling incentives indirectly on the costs of primary and

Impact Of Public Interventions On Child School 11
upper primary levels of schooling. In general, it is held that more the increase in schooling incentives and subsidies, the higher will be the demand for child schooling. In accordance to the existing literature, the provision of such grants and incentives is expected to alter the cost of child schooling faced by households by reducing the monetary (direct) costs and the opportunity (indirect) costs. The costs of schooling consist of direct and indirect costs. The direct costs include expenditure on school fees, uniform, text book or study materials, travel expenses etc. The indirect cost is the opportunity cost of attending school. This cost is reflected through the opportunities available for child labour. The important tasks performed by children in rural areas are: nurture younger siblings, taking care of livestock, assist parents in farm work as well as domestic chores such as collecting water, fire woods etc. The costs of schooling will be much reduced due to the provision of educational services at every level of schooling. These public provisions may affect the demand for child schooling in the following ways. First the direct costs of schooling are reduced. For example, school subsidies such as provision of grants and scholarships, uniforms, text books, stationary etc., reduces the direct cost of schooling. Secondly, indirect costs of schooling are also reduced with the provision of increased number of schools thereby helping to reduce the distance involved in traveling long distances; provision of proper infrastructural facilities like class rooms, black boards, female teachers, separate toilet facilities etc., and quality education. The lower costs and higher public provisions may be important reasons for high enrollment. This is expected to drastically increase the population of children enrolling in school. Table 2 reports the summary statistics of the variables used for the study. A descriptive overview of specific indicators of public variables affecting child schooling is presented in table 3:
Table 2: Variable description, Means and Standard Deviation
Variable Description N Mean
Standard Deviation
Dependant variables: Net Enrollment Ratio of children aged 5 to 9 years 4
48
58.54
14.05
Net Enrollment Ratio of children aged 10 to14 years 448
75.61
13.06
Explanatory Variables: Adult Educational attainment levels: % of male adults aged 15 and above completed ‘Primary and Middle’ levels of education
448
30.76
6.01
% of female adults aged 15 and above completed ‘Primary and Middle’ levels of education
448
20.43
7.04

12 Dr. J. Regi Manimagala
% of male adults aged 15 and above completed ‘Secondary and above’ levels of education
448
28.44
8.96
% of female adults aged 15 and above completed ‘Secondary and above’ levels of education
448
14.67
8.35
Per capita net state domestic product 448
14772
5248.12
Other determinants: Percent of Muslim population 4
48
11.72
11.97
Percent of rural population 448
77.63
17.08
Percent of SC and ST population 448
25.73
14.66
Number of districts (n) 448
Source: Computed by the author Table 3: Variable description, Means and Standard Deviation of public programme variables used in the study
Variable Description N Mean Standard deviation
Percentage of primary schools having received School Development Grant
448
66.24621
28.68770027
Percentage of upper primary schools having received School Development Grant
448
42.23304
32.22573801
Percentage of primary schools having received Teaching Learning Material
448
55.4125
32.73696
Percentage of upper primary schools having received Teaching Learning Material
448
33.07924
32.4796311
Number of primary school boys having received free text books
448
114389.5
103034.95
Number of primary school girls having received free text books
448
135253.9
113788.86
Number of primary school boys having received free uniforms
448
1142.16
24487.65

Impact Of Public Interventions On Child School 13
Number of primary school girls having received free uniforms
448
24089.34
60594.47
Number of primary school boys having received free attendance scholarships
448
14219.36
30769.34
Number of primary school girls having received free attendance scholarships
448
18884.33
31591.16
Number of primary school boys having received free stationary
448
5892.62
12190.10
Number of primary school girls having received free stationery
448
6378.75
13456.36
Number of upper primary school boys having received free text books
448
22822.32
28739.74
Number of upper primary school girls having received free text books
448
28934.25
30076.94
Number of upper primary school boys having received free uniforms
448
7501.98
22629.11
Number of upper primary school girls having received free uniforms
448
8801.40
27270.09
Number of upper primary school boys having received free attendance scholarships
448
5655.86
12926.80
Number of upper primary school girls having received free attendance scholarships
448
5179.89
9040.41
Number of upper primary school boys having received free stationery
448
2464.84
15867.78
Number of upper primary school girls having received free stationery
448
2353.71
5284.37
Number of sample district 448
Source: Computed by the author Notes: Data provided for school category: Primary only, Upper Primary only Empirical analysis of the impact of Public Programs on School Enrollment Rates The empirical model is estimated using Ordinary Least Squares regression methods for children aged 5 to 9, 10 to 14 and 5 to 14 years. Equation 1 of table 4 examines the impact of pure public programme variables on the enrollment rates of school children in the two specific age groups. In equation 2, the most important determinants of the child school enrollment rates namely per capita net state domestic product and percentage of adults completed primary and above secondary levels of education are integrated together with the policy variables. The impact of the linear combinations of social and cultural factors as well as rurality of the districts along with public programmes variables is observed in equation 3. The combined effects of all these determinants along with the public programmes variables are examined

14 Dr. J. Regi Manimagala
simultaneously to identify possible variables and public programmes that might alter the demand for enrollment of school children in the age group of 5 to 9, 10 to 14 and 5 to 14 years. In all, four alternative equations are estimated separately for these age groups of children. The empirical results based on the four specifications are discussed below.
Table 4: OLS Estimation of NER of school children (5-9) age groups
Dependant variable: Net enrollment rate (5 to 9 years) Variable Names Equation
1 Equation
2 Equation
3 Equation
4
Constant 42.701(20.357)
-158.775(15.553)
69.739 (22.520)
-147.422(15.111)
Adult educational attainment levels Primary educational levels of adult persons
0.847(13.864)
0.856(15.031)
Above Secondary levels of education of adult persons
0.229(5.402)
0.162(3.148)
Per Capita Net State Domestic Product
1.080(16.579)
1.107(17.688)
Other determinants
% Muslim population -0.357 (7.689)
-0.213(8.102)
% Rural population -0.257 (8.069)
-0.607(2.624)
% SC/ST population -0.111 (2.869)
0.046(1.797)
Public program variables: (Primary only)
% SDG: Primary schools 2.690(5.992)
0.442(1.764)
3.171 (8.000)
0.645(2.689)
% TLM: Primary schools 1.221(2.803)
0.374(1.611)
0.771 (2.006)
0.201(0.948)
Text books: % of primary school boys 16.924(2.026)
14.192(3.182)
8.947 (1.226)
6.110(1.445)
Text books: % of primary school girls -13.417(2.741)
-0.397(0.083)
-3.976 (0.493)
11.215(2.444)
Uniforms: % of primary school boys 9.417(6.781)
5.901(7.831)
5.580 (4.402)
5.252(7.264)
Uniform: % of primary school girls -2.460(1.576)
-6.475(7.706)
-1.006 (0.723)
-6.173(7.874)
Attendance scholarships: %of primary school boys
-7.732(3.315)
-0.288(0.223)
-6.055 (2.953)
0.172(0.146)

Impact Of Public Interventions On Child School 15
Attendance scholarships: % of primary school girls
4.219(1.450)
-4.660(2.905)
2.599 (1.016)
-5.061(3.467)
Stationary: % of primary school boys 4.539(0.892)
-7.031(2.570)
1.737 (0.389)
-7.272(2.922)
Stationary: % of primary school girls -2.690(0.518)
7.110(2.624)
-1.937 (0.437)
6.203(2.515)
R square .31 .81 .47 .84F 20.829 144.017 31.444 147.518No. of districts 448 448 448 448
Source: Computed by the author, Absolute t values in brackets
Development grants provided to the primary schools has a positive and statistical significance (thereafter, at the 5 percent level) in improving the enrollment rates of the children in these schools. This result implies that a one percent increase in primary schools that had obtained development grant will on an average increase the school participation rates of children aged 5 to 9 years by 2.69 percent. Thus, it is significant and appears to positively determine the percentage of children enrolled in primary schools provided with development grants. Provision of teaching-learning materials grant to the primary schools in the districts is also positive and statistically significant at 5 percent level (except equation 4). If there is a one a one percent increase in the schools that obtain teaching-learning grant, then the school participation rates of school children will on an average increase by 1.22 percent. Though the magnitude of this estimate differs in the equations, it appears to statistically and significantly determine the enrollment rates of children in these schools. A significantly large percentage of primary school boys attend schools when they are distributed with free textbooks. For instance, in equations 2, 3 and 4; the percentage of boys enrolled in schools is 14, 9 and 6 respectively, following a 1 percent increase in the distribution of textbooks to these boys. The enrollment of primary schools girls provided with free textbooks by the government is significantly reduced at the 5 percent level as indicated by this estimate in equation 1. In contrast, this estimate is positive and highly significant (at the 5 percent level) in determining the enrollment rates of these children in equation 4. This means that if there is an increase in the percentage of primary school girls distributed with free textbooks; then the enrollment of these girls is reduced nearly by 13 percent, while this estimate in equation 4 increases the average enrollment rates of the primary school girls by 11 percent and is statistically significant at 5 percent level. The ratio of primary school boys distributed with free school uniforms has a positive and highly statistical influence on enrollment rates in all equations. Less than 6 percentages of children aged 5 to 9 years attend schools following a 1 percent increase in the distribution of uniforms to primary school boys. At the other end, the fraction of school girls distributed with uniforms has a negative influence on the enrollment rates in all equations and is statistically significant at the 5 percent level in equations 2 and 4.

16 Dr. J. Regi Manimagala
Enrollment rates of children are significantly reduced by about 8 and 6 percent levels, following an increased percentage of primary school boys who obtain free scholarships for attending schools regularly. However, there is no significant difference in the enrollment rates of girls who are provided with attendance scholarships for attending schools regularly. When the percentage of primary school boys distributed with stationery items increase by a percentage point; the school enrollment rates on an average decrease around by 7 percent in both equations. The parameter estimates of the primary and above secondary educational levels of adult persons have a positive and significant impact on enrollment rates of school children in the 5 to 9 age groups. If the percentage of adults persons having primary and above secondary educational levels increase by a percentage point, the enrollment rates increase significantly by approximately by 0.85 percent and 0.23 percent respectively. In particular, the percentage of adult persons with primary levels of education is seen to exert a large impact on school enrollment rates of the children in this age group. Net domestic product of a state reflects the economic well-being of the government. The government is able to increase its expenditure on various programmes directed towards enhancing the school participation rates of children. This will directly reduce the cost of primary schooling and enable more children to enroll in schools. The coefficient estimate with respect to per capita net state domestic product is positive and highly significant at 5 percent level. The impact of other determinants on school enrollment rates is also estimated along with the public programme variables in equation 3. The percentage of muslims, scheduled caste and tribes residing in the districts negatively determines the enrollment of children in schools and is highly significant at 5 percent level. Increase in the proportion of the muslims population, significantly reduces the percentage of children enrolled in schools in these districts by about 0.36 and 0.11 percent respectively. A significant proportion of scheduled caste and tribal children enrolled in schools is drastically and significantly reduced as revealed by this estimate in equation 3. For instance, an increase in the scheduled caste and tribal population in the districts will significantly reduce the enrollment rates of these children by about 0.11 percent. A significant proportion of population residing in the rural areas of the districts has a negative impact on the enrollment rates of children belonging to rural areas. On the whole, the results suggest that distribution of schooling incentives particularly free textbooks and school uniforms is seen to benefit primary school boys much more than girls in primary schools. While educational levels of adult persons (primary and above secondary educational levels) and per capita net state domestic product has a statistically positive influence on school enrollment rates, percentage of muslims, scheduled caste and tribal population and percentage of rural population has a significantly negative influence on enrollment rates of children in the 5 to 9 age group. The OLS coefficient estimates of the net enrollment rates of school children aged 10 to 14 years are reported in table 5. The parameter estimates of the variable namely

Impact Of Public Interventions On Child School 17
SDG suggests that the enrollment rates of school children is negatively associated with the development grants given to these schools. It emerges as a negative determinant of the enrollment rates of school children in all equations.
Table 5: OLS estimation of NER of children aged 10 to 14 years
Dependant variable: Child school enrollment ratio (Age group 10 to14) Variable Names Equation
1 Equation
2 Equation
3 Equation
4
Constant 67.691(47.200)
-89.393 (11.035)
87.573 (28.343)
-82.100(10.574)
Levels of education of Adult population:
Primary levels of education 1.602(19.491)
1.037(19.908)
Above Secondary levels of education 0.399(10.580)
0.422(9.806)
Per Capita Net State Domestic Product 0.944(14.819)
0.872(15.170)
Socio-cultural characteristics
% Muslim population -0.476 (10.703)
-0.218(9.471)
% Rural population -0.121 (3.717)
0.057(2.956)
% SC/ST population -0.150 (4.083)
-.034(3.779)
Public program variables (Upper Primary only)
% of upper primary schools received SDG -0.366(0.901)
-0.355(1.822)
-0.109 (0.305)
-0.221(1.267)
% of upper primary schools received TLM
1.363(3.306)
.007(0.036)
1.016 (2.789)
-0.135(0.747)
% of upper primary school boys received Text book
-16.976(3.008)
-3.720(1.708)
-16.248 (3.255)
-5.117(2.009)
% of upper primary school girls received Text book
38.068(7.261)
1.720(2.662)
39.556 (8.151)
4.862(1.899)
% of upper primary school boys received Uniform
-24.608(3.444)
-3.301(1.951)
-20.469 (3.259)
-3.317(1.069)
% of upper primary school girls received Uniform
16.504(3.428)
4.941(1.809)
13.289 (2.226)
3.816(1.301)
% of upper primary school boys received Attendance
1.276(0.880)
-0.448(0.702)
.0.614 (0.482)
-0.509(0.817)
% of upper primary school girls received Attendance
2.183(1.763)
.0297(0.322)
.0.049 (0.028)
-0.002(0.002)

18 Dr. J. Regi Manimagala
% of upper primary school boys received Stationary
-0.793(1.700)
-0.039(0.174)
-0.491 (1.198)
-0.004(0.020)
% of upper primary school girls received Stationary
10.645(5.890)
-0.193(0.209)
5.655 (3.347)
-0.159(0.186)
R square 0.23 0.82 0.41 0.86F 14.356 161.718 24.676 171.647No. of districts 448 448 448 448
Source: Computed by the author, Absolute t values in the brackets The provision of teaching-learning grants to the upper primary schools of the districts positively influences the enrollment rates of children and is significant at 5 percent level. It implies that the enrollment rates of children in upper primary schools increase on an average by 1.36 percent when there is a one percent increase in the upper primary schools supplied with TLM grant. Provision of free textbooks to boys studying in upper primary schools is seen to be associated with low levels of schooling of these children and is statistically significant at 5 percent levels. For instance, if the upper primary school boys distributed with textbooks goes up by say one percent, then the enrollment rates of these boys is significantly reduced roughly by 17 percent. The outcomes of distributing free textbooks to girls in upper primary classes facilitate to significantly improve the enrollment rates of these girls. The estimates of the variable namely, percentage of girls from upper primary classes who receive free textbooks from the government is positive and highly significant at 5 percent level. That is, the enrollment rates increase on an average by 38 percent, if there is an increase in percentage of upper primary school girls freely distributed with textbooks. It emerges as a positive and significant determinant in all equations. An incentive provided to upper primary school boys in the form of school uniforms significantly lowers the rate of schooling among these children. The magnitude of change in the enrollment rates of school children is not considerable as made known by the estimates of this variable in equation 2 and 4. In contrast, the percentage of children in the 10 to 14 age groups enrolled in schools is positively influenced by the distribution of free uniforms to girls studying in upper primary schools. It is statistically significant at the 5 percent level. It is also observed that the impact of TLM grants, school uniforms and textbooks distributed to boys and girls on child school enrollment appears implausibly large in equations 1 and 3, while the magnitude of these estimates on enrollment rates of girls and boys is drastically reduced in equations 2 and 4. Attendance scholarships awarded to boys and girls of upper primary class enhances the enrollment rates of these children. An increase in the percentage of boys and girls awarded with attendance scholarships will lead to an increase in the corresponding enrollment rates of these children by 1 percent and 2 percent approximately. As revealed in equation 1, the attendance scholarships provided to upper primary school girls contribute to a rise in the enrollment rates. That is, this estimate is statistically significant at 10 percent level.

Impact Of Public Interventions On Child School 19
Stationery for boys is negative and not significant at 5 percent level in any of the models. Alternatively, there is tremendous growth in the enrollment rates of children when there is an increase in the distribution of free stationery items to girls studying in upper primary classes. Percentage of adult population completed primary levels of education positively and significantly (5 percent levels) influences the enrollment rates of children in the districts as revealed by these estimates in equations 2 and 4. The enrollment rates significantly increase on an average by 1.60 percent (equation 2) and 1.04 percent (equation 4), if there is a 1 percent increase in the adult population who complete primary levels of education. The effects of percentage of adults completing above secondary educational levels on percentage of children enrolled in schools in the districts is positive and highly significant at 5 percent level. A percentage increase in the percentage of adult persons completing above secondary educational levels leads to a significant increase in the percentage of children enrolled in schools by around 0.4 percent. Per capita net state domestic product emerges as a positive determinant of school enrollment rates of children in this age group. It is highly significant at 5 percent level. From the estimates, it is clear that improvements in the economic welfare of the states will significantly raise the percentage of children attending schools. A percentage of increase in the muslim population will significantly reduce the enrollment rates of school children by 0.48 and 0.22 percentage on an average. However, among the social and cultural determinants, this variable seems to significantly reduce the school participation of children in both the equations. On the other hand, while the percentage of rural population in the districts significantly reduced the enrollment rates of school children in these districts as shown by this estimate in equation 2; it appears as a significant and positive determinant of enrollment rates in equation 4. The caste variable appears to negatively influence the school attendance rates. It is significant at the 5 percent statistical level. For instance, a percentage increase in the scheduled caste and tribal population in the districts will significantly reduce the enrollment rates by 0.15 and 0.03 percent respectively in equations 2 and 4. The results as a whole suggest the general importance of the variables like, educational levels of adult persons, per capita net state domestic product, percentage of muslims, scheduled caste and tribal population and percentage of rural population who reside in the districts have a statistical significance on enrollment rates of school children aged 10 to 14 years. Distribution of schooling incentives in the form of textbooks, school uniforms, attendance scholarships and stationery items provided to girls seem to benefit girls more than boys in this age group. The empirical analysis of the enrollment of children in the 5 to 14 age groups is examined in table 6.

20 Dr. J. Regi Manimagala
Table 6: OLS estimation NER of children aged 5 to 14 years
Dependant variable: Child school enrollment ratio (Age group 5 to14) Variable Names Equation 1 Equation 2 Equation 3 Equation 4
Constant 55.909 (37.967)
17.496 (13.027)
80.700 (29.472)
21.186 (8.158)
Levels of education of Adult population: Primary levels of education 1.098
(19.670) 1.070
(21.071) Above Secondary levels of education 0.280
(7.359) 0.253
(5.684) Per Capita Net State Domestic Product 1.027
(14.090) 0.995
(15.196) Socio-cultural characteristics
% Muslim population -0.408 (9.464)
-0.214 (8.990)
% Rural population -0.221 (7.489)
-0.017 (0.808)
% SC/ST population -0.106 (3.015)
0.033 (1.717)
Public program variables% of schools received SDG 0.023
(0.849) -0.043 (3.057)
0.029 (1.197)
-0.027 (2.027)
% of schools received TLM 0.208 (7.986)
0.040 (2.803)
0.161 (7.041)
0.026 (3.042)
% of school boys received Text book -0.165 (2.198)
0.176 (4.391)
-0.194 (2.944)
0.111 (3.029)
% of school girls received Text book 0.275 (3.773)
0.093 (2.403)
0.324 (4.825)
0.028 (0.748)
% of school boys received Uniforms 5.654 (2.497)
4.823 (4.212)
3.087 (1.543)
4.585 (4.357)
% of school girls received Uniforms -6.753 (2.504)
-7.455 (5.426)
-3.789 (1.603)
-7.070 (5.639)
% of school boys received Attendance 0.038 (1.655)
-0.023 (1.977)
0.029 (1.475)
-0.016 (1.519)
% of school girls received Attendance 0.043 (1.549)
-0.005 (0.332)
0.015 (0.624)
-0.019 (1.463)
% of school boys received Stationary 0.079 (0.093)
-0.155 (0.360)
0.284 (0.387)
-0.027 (0.069)
% of school girls received Stationary 3.940 (1.742)
-0.122 (0.103)
-0.376 (0.188)
-1.572 (1.457)
R square 0.31 0.83 0.49 0.86 F 21.28 163.06 33.97 172.03
No. of districts 448 448 448 448 Source: Computed by the author, Absolute t values in the brackets

Impact Of Public Interventions On Child School 21
The empirical results report a statistically significant positive relation between children’s educational attainment levels and teaching-learning material grants provided to primary and upper primary schools in all equations. Provision of school development grants to primary and upper primary schools significantly reduces the enrollment rates of children by about 0.004 percent in equation 2. However, development grants to schools do not significantly impact the net enrollment rates of children in other equations. This means that there are no significant differences between the enrollment rates in schools that are provided with these grants. Schooling attainment is significant among boys who are provided with free textbooks. At the other end, the enrollment rates of girls who are provided with textbooks increase by 0.28 percent and 0.32 percent approximately. The impact of free distribution of school uniforms to boys on their enrollment rates is positive. It is highly significant at the 5 percent level. A 1 percent increase in the distribution of uniforms to girls on an average reduces their enrollment rates by 7 percent. This estimate is statistically significant (at the 5 percent level) in determining the enrollment rates of girls in the 5 to 14 age groups. An increase in the percentage of school boys distributed with scholarships for attendance in schools, the enrollment rates of these boys is reduced nearly by 0.02 percent; while this estimate in equation 1 increases the average enrollment rates of the children by 0.04 percent and is statistically significant at the 10 percent level. Provision of free stationary items to school boys does not produce any significant differences in the enrollment rates of these children. On the other hand, this schooling incentive significantly improves the enrollment rates of girls by about 3.94 percent and is statistically significant at the 10 percent level (equation1). The primary educational levels of adult population positively impacts the enrollment rates of children aged 5 to 14 years. It is highly significant at the 5 percent level. On the other hand, the above secondary educational levels of the adult population also have a positive and significant influence on the enrollment rates of children. However, the proportion of children enrolled in schools is less. The percentage of children enrolled in districts with significant percentage of muslim population is significantly reduced by 0.41 and 0.21 percent respectively. An increased fraction of the population living in the rural areas of the districts significantly decreases the enrollment rates of the children living in these areas by 0.22 and 0.02 percent approximately. The enrollment rates of children belonging to scheduled caste and tribal community is also significantly reduced by about 0.11 and 0.03 percent respectively in the districts. In general, provisioning of free textbooks and uniforms help significantly improve school enrollment rates. However, the effect of these schooling incentives on boy’s enrollment rates is significant. The percentage of school girls and boys being distributed with attendance scholarships and free stationary items is very low when

22 Dr. J. Regi Manimagala
compared to other incentives. Thus there is no significant difference in the enrollment rates of theses children provided with attendance scholarships and free stationary items. The enrollment rates of girls and boys enrolled in schools funded with development grants and teaching-learning material grants are also significant. The primary educational levels of adult population seems to exert a much stronger influence on the enrollment rates of children than the above secondary educational levels of the population aged 15+. The impact of other determinants (muslim population, rural population, scheduled caste and scheduled tribe population) on the enrollment rates of children is significantly reduced at the 5 percent level. Conclusion This paper focuses on the impact of various forms of public spending on educational outcomes. Public programme variables such as, textbooks and uniforms freely distributed to primary school boys exert a positive and significant influence on the enrollment rates of children aged 5 to 9 years. At the other end, schooling incentives in the form of textbooks, uniforms and stationary items to girls of primary class levels seems to significantly improve their enrollment rates. The enrollment rate of children in the 5 to 9 age groups are significantly increased in schools that are provided with school development and teaching-learning material grants. The school participation rates of children aged 10 to 14 years seems to significantly reduce with an increased percentage of upper primary school boys distributed with textbooks and uniforms. The attendance of children in schools is significantly increased with increase in the distribution of textbooks, uniforms and attendance scholarships to upper primary school girls. In addition, levels of education of the adult population and per capita net state domestic products significantly improve the attendance rates of school children in both age groups. Enrollment rates of children in both the age groups are significantly reduced with increased percentage of rural population, muslim population and scheduled caste and tribal population in the districts. Source: Computed from District Elementary Report Cards, 2003-04
Table 2: Variable description, Means and Standard Deviation
Variable Description N Mean
Standard Deviation
Dependant variables: Net Enrollment Ratio of children aged 5 to 9 years 4
48
58.54
14.05
Net Enrollment Ratio of children aged 10 to14 years 448
75.61
13.06
Explanatory Variables: Adult Educational attainment levels:

Impact Of Public Interventions On Child School 23
% of male adults aged 15 and above completed ‘Primary and Middle’ levels of education
448
30.76
6.01
% of female adults aged 15 and above completed ‘Primary and Middle’ levels of education
448
20.43
7.04
% of male adults aged 15 and above completed ‘Secondary and above’ levels of education
448
28.44
8.96
% of female adults aged 15 and above completed ‘Secondary and above’ levels of education
448
14.67
8.35
Per capita net state domestic product 448
14772
5248.12
Other determinants: Percent of Muslim population 4
48
11.72
11.97
Percent of rural population 448
77.63
17.08
Percent of SC and ST population 448
25.73
14.66
Number of districts (n) 448
Source: Computed by the author References [1] Rosenzweig, Mark R. and K.I. Wolpin., (1982): “Governmental Interventions
and Household Behaviour in a Developing Country”, Journal of Development Economics, 10:209-226.
[2] King, Elizabeth M. and Lee, A Lillard., (1987): “Education Policy and Schooling Attainment in Malaysia and the Philippines”, Economics of Education Review, 6(2):167-181.
[3] Hossain, I. Shaik., (1989): “Effect of Public Programs on Family Size, Child Education and Health”, Journal of development Economics, 30: 145-158.
[4] Duraisamy, P and R. Malathy., (1990): “Impact of Public Programmes on Fertility and Gender Specific Investment in Human Capital of Children In Rural India: Cross Sectional and Time Series Analysis”, Research in Population Economics, 7: 157-172.

24 Dr. J. Regi Manimagala
[5] Duraisamy, P., (2001): “Effectiveness of Incentives on School Enrolment and Attainment”, Journal of Educational Planning and Administration, 15(2):155-177
[6] Filmer, Deon, and Pritchett, Lant., (1999): “Educational Enrolment and Attainment in India: Household wealth, Gender, Village and State Effects”, Journal of Educational Planning and Administration, 13(2): 135-163.
[7] Rosenzweig, Mark R. and K.I. Wolpin., (1986): “Evaluating the Effects of Optimally Distributed Public Programs”, American Economic Review, 76: 470- 487.
[8] Duraisamy, P., (1988): “An Econometric Analysis of Fertility, Child Schooling and Labour Force Participation of Women in Rural Indian Households,” Journal of Quantitative Economics , 4(2): 293-316
[9] Birdsall, Nancy., (1985): “Public Inputs and Child Schooling in Brazil,” Journal of Development Economics , 18:67-86.
[10] DeTray, Dennis., (1988): “Government Policy, Household Behaviour and the Distribution of Schooling: A Case Study of Malaysia”, Research in Population Economics, 6: 303-336.
[11] Drèze, Jean and G. Kingdon, Geeta., (2001): “School Participation in Rural India”, Review of Development Economics, 5 (1):1-33.
[12] Deininger, Klaus., (2003): “Does Cost of Schooling affect Enrollment by the Poor? Universal Primary Education in Uganda”, Economics of Education Review, 22 (3): 291–305.
[13] Mehrotra. Santhosh., (2006): “Reforming Elementary Education in India: A Menu of Options”, International Journal of Educational Development, 26: 261-277.
[14] Sunil, Andrew R. and Swaroop, Vinaya., (2008): “Public Spending and Outcomes: Does Governance Matter?”, Journal of Development Economics, 86:96-111.
[15] Lincove, Jane A., (2009): “Determinants of Schooling for Boys and Girls in Nigeria under a Policy of Free Primary Education”, Economics of Education Review, 28:474-484.
[16] Mukudi, Omwamia E. and K. Omwamib, Raymond., (2009): “Public Investment and the Goal of Providing Universal Access to Primary Education by 2015 in Kenya”, International Journal of Educational Development, XXX(Article in Press)


![Bal Balika Surksha Yojana - Government of Himachal … FORM XVI [Rule 35(3)] A.FOSTER CARER'S ASSESSMENT Assessment of applicant under Bal/Balika Suraksha Yojna Name of the Agency](https://img.dokumen.tips/doc/110x75/5afdd34e7f8b9a8b4d8e1d57/bal-balika-surksha-yojana-government-of-himachal-form-xvi-rule-353-afoster.jpg)