Embed Size (px)
Citation preview

The Impact of Plus-Sized Wheel/Tire Fitment on Vehicle Stability
John W. Daws, Ph.D., P.E.1
Sr. Managing Engineer Exponent, Inc.
23445 N. 19th Ave. Phoenix, AZ 85027
Robert E. Larson, P.E. Managing Engineer
Exponent Inc. 23445 N. 19th Ave. Phoenix, AZ 85027
Jeffery C. Brown
Sr. Engineer Exponent, Inc.
23445 N. 19th Ave. Phoenix, AZ 85027
Presented at the September 2005
Meeting of the Tire Society
1Presenter/Corresponding Author

J.W. Daws, R.E. Larson, J.C. Brown The Impact of Plus-Sized Wheel/Tire Fitment on Vehicle Stability REFERENCE: J.W. Daws, R.E. Larson, J.C. Brown, “The Impact of Plus-Sized Wheel/Tire Fitment on Vehicle Stability,” submitter for presentation at the 2005 Tire Society Meeting, and for consideration for publication in the journal Tire Science and Technology. ABSTRACT: Plus-sizing in the tire industry is the growing practice of replacing a vehicle’s original equipment wheel size with a larger diameter wheel and replacing the tire with a lower aspect ratio tire of the same diameter. This practice is normally associated with aftermarket sales, and there is a growing trend for vehicle dealerships to fit these larger wheels/tires to new cars. This paper discusses the general practice and its effect on some of the performance characteristics of vehicles. A vehicle taken from the NHTSA New Car Assessment Program’s rollover “Star” rating program is used to illustrate the impact of plus sizing on static stability. Some of the dynamic tire effects that could influence vehicle stability are discussed and preliminary testing data on the dynamic impact of plus sizing are presented. KEYWORDS: Plus-size tire fitment, vehicle stability, fishhook test, NHTSA Star rating The fastest-growing segment of the tire market today is what is called the “tuner” market.
Another rapidly growing segment is that of ultra-low profile tires for light trucks and
sport utility vehicles. The market for aftermarket wheels, tires, and suspensions
components in 2001 represented over $6 billion in sales. In these applications, the
consistent theme is to replace the original equipment wheel and tire with a larger
diameter wheel and a lower profile, usually wider tire. The overall diameter of the tire
wheel assembly is kept as close as possible to the diameter of the original equipment tire
and wheel system.
The driving force behind this market is the vehicle owner’s desire to personalize the
vehicle, while improving the performance and appearance. The term “plus-sizing” refers
to the number of inches increase in the wheel diameter. For example, if a 16-inch
diameter wheel is replace with an 18-inch diameter aftermarket wheel, the change is
considered a “Plus 2 fitment”. Obviously, the both the width and the offset of the wheel
may change as well. Wheel width ranges are established for given tire sizes by standards
organizations like the Tire & Rim Association (T&RA) in North America, but there will
be a range of wheel widths allowed for a given size. Wheel width is universally
published in sales literature for wheels. Wheel mounting offsets, on the other hand, are
2

only found randomly, and the consumer is often forced to trust the wheel offset selection
to the wheel vendor.
Selection Issues for Plus-sizing When selecting tires and wheels for an upgrade on a given vehicle, there are several
aspects that should be considered. First, the desired wheel diameter is selected based on
the availability of tires in that rim size that will have a similar outside diameter to the
original equipment fitment. Given that conventional wisdom usually suggests that any
difference in diameter should be within ± 3% of the original equipment tire, there are
usually a number of wheel diameters for which tires are available to achieve this . Since
customer choice is often based more on appearance and cost, rather than proper sizing, it
is not unusual to see tire fitments where the diameter of the replacement tire exceeds that
of the OE tire by a wider margin than is ideal. Tire selection appears to often be based on
maximizing the size of the tire that will fit in the wheel well of the vehicle without
interference. Load capacity is another factor that can influence customer to choose larger
overall diameter tires, since load capacity goes down with decreasing aspect ratio for a
given tire design. The issue of the load capacity of the tires has been discussed by
Edington [1] in some detail. Following Edington’s analysis, the replacement tires should
have a load rating equal to or larger than that of the original equipment tires.
In the 1970’s and 1980’s, plus sizing was typically done by increasing tire width by
10 mm for every inch increase in wheel diameter and decreasing the aspect ratio by 10 %.
Following this procedure usually works well for Plus 1 and Plus 2 sizes, but tends to
yield tires with insufficient diameter or load capacity, or produce tire dimensions that do
not exist, beyond that point. Also, that approach tends to produce fitments with declining
load capacities as the wheel diameter gets larger. With today’s market extending to Plus
7 sizes and beyond, fitments must be developed in consultation with standard load tables
developed by organizations like the Tire & Rim Association. Table 1 shows tires that
would be indicated for a 2002 Chevrolet Avalanche RWD. Of note is that there are not
tires currently in the list of standard dimensions for the Plus 3 and Plus 4 dimensions
listed in Table 1. With this method, as the plus size is increasing, the load capacity of the
tire, and its diameter are both decreasing. Contrast this result to that shown in Table 2,
3

where the tires are being selected based on diameter and load capacity. There is still no
tire suitable for the Plus 3 size, but all the other sizes meet or exceed the load capacity of
the original equipment tire. In the recent past however, tire manufacturers have
responded to this need with large, low profile tires with higher-pressure ratings in order
to meet the load requirement for large sport utility vehicles. Of course, higher-pressure
tires create other ride and durability issues for consumers. Also, if customers set their tire
pressures based on the vehicle placard, there may be an effective reduction in tire
capacity instead.
The last issue for plus-size selection is the choice of wheel offset. Wheel offset is the
measure of the distance from the wheel-mounting surface to the centerline of the wheel.
The vehicle manufacturer selected a certain amount of offset on the original equipment
wheel in order to place the center of the tire near the pivot axis of the steering arm,
thereby minimizing the moment load on the wheel spindle and maintaining relatively
small steering effort. Aftermarket wheels are available in a wide range of offset values.
For example, perusal of a large tire distributor’s web site for 20-inch wheels to fit a 2002
Ford F150 Supercrew truck yielded wheel offsets from 25 mm to –25 mm, all for a
vehicle with a 14 mm offset in the standard OE wheel. The reasons for this are
numerous. In some cases, wheels with offsets equal to that of the original equipment
wheel are available. Wheels with larger offsets can be used to move the tires inboard in
cases where fender clearance is important. Wheels with smaller, or even negative, offsets
are often used to move the tire out from the vehicle in order to provide room for wider
tires or to provide a “deep dish” look on vehicles like light trucks and sport utility
vehicles where outer fender clearance is not an issue. Moving the tires outboard
increases the vehicle track width at the expense of increased steering effort and increased
stresses on the spindles and other suspension components. For independent suspensions,
increasing the offset will also reduce the effective suspension stiffness.
A significant issue in offset selection is that the value for a particular wheel may not be
available to the purchaser, but rather the wheel is sold as being “appropriate” for a given
vehicle. The consumer is very likely to not know what changes, if any, have been made
4

to the track width of his or her vehicle. Even if the consumer knows that there is a
change in the wheel offset, he or she may have no idea what this change will do to the
vehicle’s handling or stability.
There are other issues surrounding the use of plus-sized tires and wheels on an existing
vehicle. General Motors Corporation stated in a recent publication [2] that wheels used
for their upgrade packages have the “same mass, same offset, same width, same
mounting flange, same tire pressure monitoring requirements, same brake clearance,
[and] same dimensional tolerances” as the original equipment wheels. Implicit in this
tight specification are the impacts of the plus-sized fitment on anti-lock brake systems,
stability systems, and so on. Unfortunately, as wheel diameter increases, the mass of the
tire and wheel generally increases, as does the inertia of the rotating system. The change
in unsprung weight can affect the response of the suspension system. The change in
rotational inertia can affect the response of systems like antilock braking and electronic
stability control. Tire pressure monitoring based on antilock brake sensors can also be
effected by changes in tire size and vertical stiffness.
Performance Changes with Plus Sizes It is generally agreed that fitting a vehicle with plus size tires and wheels will change
certain performance characteristics of the vehicle. Obviously, handling performance
parameters like response, precision, and grip typically improve. This is because the
lower aspect ratio tire will have increased lateral stiffness. As the plus size increases, it
would be expected that the lateral stiffness would continue to increase, so these
improvements would also increase. However, since the tire is typically getting wider, the
on-center tracking is very likely to degrade at the same time.
Another area that is of concern is the sensitivity of the vehicle to large bumps. Ride
harshness typically increases with reduction in the tire sidewall height, so the comfort of
the vehicle can be expected to be degraded. This is especially true if the tire inflation
pressure has dramatically increased in order to provide sufficient load capacity. In
addition, incidents of rim-pinch damage on the tire and rim impact damage on the wheel
5

are also likely to increase as the tire’s sidewall height is decreased. This sort of damage
is very dependant upon the condition of the road surface in a given region and the speed
limits in place on roads where potholes are prevalent.
The risk of hydroplaning with the wider tires used for plus sizing is also likely to
increase. Of course, tread compound selection and tread pattern design can be very
effective in mitigating this effect when the tires are relatively new. However, given the
cost of plus size tires and the tendency of consumers to try to get the last bit of use out of
any tire, wet traction performance is likely to be an area of increased risk over the life of
the tire.
Stability Issues The issue of vehicle stability has been the subject of extensive work by all the vehicle
manufacturers as well as the National Highway Transportation Safety Administration
(NHTSA) over the past several years. Most of this work has focused on the resistance of
a vehicle to rolling over when involved in an avoidance or loss of control situation.
NHTSA has recently implemented final rules for its star rating for stability as part of its
New Car Assessment Program (NCAP), in fulfillment of a requirement of the TREAD
Act of 2001. In this system, vehicles are awarded a star rating of from one to five stars
(more is better) based on the value of their Static Stability Factor (SSF) and whether or
not they tip up when run through a defined rollover resistance test. This testing maneuver
(called a “fishhook” test due to the path the vehicle follows) is designed to perform
repeatable aggressive steering reversal maneuvers, with the intent being to differentiate
between those vehicles that will and will not tip-up on pavement with a severe steering
reversal. The detailed specifications for the test are given in [3].
The SSF is simply defined as the track width (T) divided by twice the height of the center
of gravity (h) of the vehicle, SSF=T/(2h). This purely static characteristic is obtained by
measuring the track width and height of the center of gravity of vehicles as part of the
NCAP testing process. NHTSA has correlated the percentage of vehicles involved in
single vehicle accidents that rolled over, based on historical crash data, with their value of
6

SSF. The resulting curve fit of these data showed that, in general, the lower the value of
SSF, the higher the percentage of single vehicle accidents predicted to result in rollovers.
NHTSA’s star rating system begins by awarding more stars for vehicles with higher
values of SSF.
The dynamic portion of the assessment is the determination of whether or not the vehicle
will tip up in NHTSA’s pre-defined rollover resistance test procedure. NHTSA has
separately correlated SSF with rollover rate for vehicles that tip-up in the Fishhook
maneuver and again for the group of vehicles that didn’t. Vehicles that tip up are
penalized by being rated with a curve based only on vehicles that tipped-up in the
Fishhook maneuver. This more stringent rating may result in a vehicle receiving a lower
star rating than other vehicles with the same SSF that do not tip up.
The impact of plus sizing on vehicle stability begins with the relationship between the
section height of a tire and the working deflection expected on that tire. Normally, tires
are expected to operate, when fully loaded, at a maximum static deflection equal to
approximately 20% of the sidewall height. When installing plus size tires and wheels on
a vehicle, the outer diameter of the tire and wheel theoretically remains constant while
the sidewall height decreases. Since the sidewall height of the plus size tires is smaller
than those that were original equipment, the static deflection of the plus size tires will be
lower than what was present when the height of the center of gravity was measured in the
NCAP tests. In short, the axle height of the vehicle increases even though the unloaded
diameter of the tires is not necessarily different.
In order to illustrate this effect, data for the 2002 Chevrolet Avalanche 1500 were
selected from the 2002 NCAP study vehicles tested by NHTSA. The NCAP data
included the original tire type and size, as well as the track width and center of gravity
height for the vehicle. Plus size tire fitments available were found by consulting a
national tire outlet chain’s web site. The change in center of gravity height was
computed for each vehicle for each available plus size tire by computing the change in
deflection, assuming a static deflection of 20% of the section height for each tire. In
7

order to simplify the analysis, the track width was assumed to remain constant, i.e., the
wheel offsets would remain unchanged when moving to higher plus sizes.
Figure 1 shows the result of the analysis. Both the rear-wheel drive (RWD) and the all-
wheel drive (AWD) versions of the vehicle are included in Figure 1. The SSF value
(T/2h) is plotted for each plus size fitment on this graph. As expected, the SSF value for
each vehicle tends to decrease as the plus size fitment increases. (Plus 0 indicates the use
of a lower aspect ratio, wider tire on the original equipment wheel). The AWD version of
the vehicle has a higher center of gravity height and consequently a lower SSF value.
The AWD version also has a larger size OE wheel than the RWD version, so there is no
Plus 8 fitment for the AWD version even though the largest tire size is the same on both
vehicles.
Also indicated on Figure 1 are star rating limit values between two and three star ratings.
Essentially, a vehicle having a SSF value of greater than 1.070 would receive a three-star
rating if it does not tip up in the dynamic test. If the vehicle tips up in the dynamic test, a
SSF value greater than 1.110 is necessary to receive the same three-star rating. The result
of the dynamic influence on the star rating system can be seen in Figure 1. For the RWD
version of the vehicle, the vehicle would receive a three-star rating for any plus size tire
fitment if it does not tip up in the dynamic test. If it tips up, the Plus 6, Plus 7, and Plus 8
fitments would make the vehicle receive a two-star rating. For the AWD version of the
vehicle, the Plus 6 and Plus 7 fitments make give the vehicle a two-star rating regardless
of the results on the dynamic test. However, if the vehicle tips up in the dynamic testing,
then all the plus size fitments make the vehicle have a two-star rating as opposed to it’s
three-star rating with the original equipment tires.
The risk-of-rollover sensitivity curves employed by NHTSA were developed from
analyses of the percentage of single vehicle accidents involving rollover versus the SSF
of the particular vehicle. These curves indicate that the rate at which the risk of rollover
increases is larger at lower values of SFF. This means that incremental changes in the
SSF value of a sedan-type vehicle having relatively higher SSF values will result in
8

smaller changes in rollover risk according to NHTSA. Conversely, incremental changes
in SSF values for vehicles like SUVs with relatively lower SSF values will produce larger
changes in rollover risk.
The static analysis reported above has shown that the static stability characteristics of
vehicles may be influenced by the addition of plus size tires and wheels. Further, this
change may be sufficiently large to move the vehicle from one star rating value to a lower
one in the NHTSA NCAP rating program. The potential for change in track width
suggests that these impacts can be mitigated, but only with other potential costs in vehicle
behavior. Additionally, the information (wheel offset) to make such choices may not be
readily available to consumers, so wheels that are “appropriate” or “will fit” are what
consumers purchase. This suggests a need in the industry for better information on the
wheel offsets on OE vehicles and the offsets on aftermarket wheels.
Dynamic Testing
Description of Tests As described above, the NHTSA Fishhook test subjects a vehicle to a severe steering
reversal maneuver on pavement. The testing is performed with a vehicle equipped with
front and rear outriggers of moderate weight relative to the vehicle weight so as to have a
minimal effect on vehicle mass and inertia. NHTSA has designed titanium outriggers in
several sizes to accommodate a wide range of vehicle weights. Steering maneuvers are
made using a computer-driven steering controller to minimize driver variability. Data
collected includes the appropriate vehicle accelerations and roll rates, as well as sensors
to determine body roll angle and the extent of wheel lift when it occurs. A slowly-
increasing steer test at 50 mph (80 kph) is used to determine the steering wheel angle at
which the lateral acceleration of the vehicle is 0.3 g. This steering angle is then used to
scale the magnitude of steering input used in the Fishhook maneuver. The extreme of the
steering input used for the testing is then set at 6.5 times this steering wheel angle at
0.3g. At test initiation on each run, the steering controller drives the steering wheel angle
to the steering extreme angle in one direction at a rate of 720 deg/sec. When the vehicle
roll rate drops to between 1.5 deg/sec and –1.5 deg/sec (essentially the point where the
9

body roll is maximized), the steering controller drives the steering wheel to the steering
extreme angle in the opposite direction at the same 720 deg/sec rate. Testing begins at
35 mph. If the vehicle does not tip up, the speed is increased by 5 mph and the test is
repeated. Above 45 mph, the speed increment is lowered to 2.5 mph. If the vehicle does
not tip up at 50 mph, the test is repeated with a steering extreme angle equal to 5.5 times
the steering wheel angle determined in the slowly-increasing steer test. If the vehicle tips
up at any speed, the speed is reduced in 1 mph increments to determine the lowest speed
for tip-up. Vehicle tip-up is defined as wheel lift-off of at least 2 inches on both axles.
The procedure calls for testing with initial steering turns in both directions.
For the purposes of this study, a 1992 Isuzu Rodeo V-6 4WD was set up as the test
vehicle. The vehicle was fitted with NHTSA-specified outriggers and wheel-lift sensors.
The remaining sensors, along with the steering controller and the data collection
computer, were specified by Exponent for in-house testing. The test vehicle is shown in
Figure 2. The test vehicle was fitted with cameras on each tire to show the tire
deformation throughout the fishhook maneuver. This vehicle was originally available
with either P225/75R15 or an optional 31x10.50R15 tire fitment. The OE wheels had
offsets of zero for both the P225/75R15 tire and for the 31x10.50R15 tire. For the
purpose of this study, a Plus-5 fitment, 285/50R20, was selected to represent a plus-size
application. The aftermarket wheels available for this plus-size fitment had an 18 mm
(0.71 in) offset, resulting in a narrowing of the track width by 36 mm (1.42 in). In order
to examine the effect of wheel offset, 20 mm (0.79 in) spacers were used to be able to test
the plus-size tire fitment at an offset of -2 mm (0.08 in). Four test conditions were thus
defined from the tire and wheel combinations available with both OE sizes and the plus-
size fitment. The testing was done in a non-standard loading condition and does not
necessarily represent how this vehicle would perform in the NHTSA NCAP evaluation.
The present study involved running a simplified fishhook test procedure for the four tire
and wheel combinations shown in Table 3. The testing was done in only one direction to
reduce the number of runs for this demonstrative case. All tires were from the same
manufacturer and were part of the same tire line to focus on the tire size and wheel offset
issues alone and minimize effects of tread design or compound.
10

Dynamic Testing Results In order to compute the SSF for the various tire/wheel combinations used in this study,
the basic values of track width and center-of-gravity (CG) height were measured with the
20-inch tire fitment. The use of NHTSA NCAP data [4] would correspond to fully-
loaded configurations that would be slightly different from the set-up in these tests. The
measurements yielded a CG height of 26.6 in (676 mm) for the test vehicle when
equipped with the 285/50R20 tires. The track width was determined to be 57.5 in
(1460 mm) at the manufacturer’s wheel offset of zero. Table 4 shows a comparison of
the computed SSF values for the test configurations. The SSF value ranges from a high
of 1.1512 for the P225/70R15 tire fitment to a low of 1.0518 for the 285/50R20 tires on
the 18 mm offset wheel setup. Based on the vehicle tipping up below 50 mph in the
NHTSA dynamic fishhook testing, the vehicle would receive a 3-star rating with both OE
tires, but only a 2-star rating with the Plus5 tire regardless of wheel offset. These ratings
are based on the vehicle tipping up in the dynamic testing, which it did in all of the test
configurations.
Effect of Tire Size
A comparison of the vehicle response as a function of tire size alone, in the context of
this study, refers to the response of the vehicle with wheel offset at or near zero. Changes
in the tire size used will result in changes in the SSF value if the diameters of the tires are
different. In Table 4, the SSF values range from 1.1512 for the P225/75R15 tire to
1.0814 for the 285/50R20 tire, with the track width remaining essentially constant for all
three tire-wheel combinations.
Table 5 gives the results of the steer angles required to produce 0.3g lateral accelerations
in the slowly increasing steer tests. This angle ranges from 45.8 deg for the P225/75R15
tire to 40.0 deg for the 285/50R20 tire, consistent with the increasing cornering power
inherent in the wider, higher performance tires. The steering extreme angles for the
NHTSA fishhook test are defined to be 6.5 times greater than those angles. Recall that
the steering extreme angle represents the limit to which the steering controller drives the
11

steering wheel (at a rate of 720 deg/sec) in both directions in order to produce the vehicle
maneuver.
Figure 3 shows a comparison of the steering wheel angle versus time for the two OE tire
configurations along with the Plus-5 fitment with a –2 mm offset. Recall that the two OE
sizes had offsets of 0 mm, so this comparison represents essentially the effect of tire size
alone. Figure 4 shows the linear velocity of the vehicle for the test representing the
minimum tip-up speed for each of the three tire conditions in Figure 3. Note that the test
entry speed required to tip-up the vehicle with the P225/75R15 tires was higher than the
other fitments. This is expected since the SSF was the highest of the three fitments and
the smaller tires likely had a lower lateral stiffness and overall capacity to generate lateral
force. The speed data also shows a clear indication that the vehicle deceleration
decreased (i.e., the speed decreased more slowly) as the tire size increased. Interestingly,
the vehicle tip-up occurred in the range between 1 and 2 seconds for all tire-wheel
combinations. At the point of tip-up, the speed of the vehicle in each case was almost
identical. The NHTSA procedure takes the run speed as the velocity at the start of the
first steering maneuver (the test entry speed). From Figure 4, it is clear that the tip-up
speed of the vehicle was very close to the same value for each tire/wheel combination.
Figure 5 illustrates the sideslip angle for the three configurations. The sideslip angle
resulting from the steering reversal was inversely proportional to tire size, which would at
least partially explain why the smaller tire size scrubbed off speed most quickly.
Review of the tire deformation video and tire wear suggests that track width, which is
normally determined as the distance between tire centerlines on an axle, is effectively
increased slightly by wider tires. The T&RA Yearbook yields the maximum tread width
for the P225/75R15 tire as 187 mm (7.36 in), 210 mm (8.27 in) for the 31x10.50R15 LT,
and 276 mm (10.87 in) for the 285/50R20 tire. Visual examination of the test tires
showed that the P225/75R15 tires were heavily abraded from the tread edge down to the
equator of the sidewall. The 285/50R20 tires, by contrast, had abrasions only on the tread
shoulder, suggesting that there was a dramatic difference in the deformed shape of the
tires at the point of tip-up.
12

Figure 6 shows a front tire comparison between the P225/75R15 and the 31x10.50R15LT
tire at maximum wheel lift. Figure 7 shows the same comparison between the
P225/75R15 and the 285/50R20 tires, again at maximum wheel lift. In both Figure 6 and
Figure 7, there is a very clear distinction between the tire deformation on the two tires.
The P225/75R15 tire is heavily distorted in the cornering. In fact, pavement abrasions
from cornering were observed from the tire shoulder down to the equator of the sidewall.
Contrast this to the 285/50R20 tire in Figure 6, where the tread system of the tire
essentially retains its normal shape, even during this extreme cornering maneuver. All
the tires are being driven at slip angles in excess of 15 deg. These photographs support
the hypothesis that the larger and more rigid tires actually create an effective track width
that is wider than the actual track width, which, in this case, is offsetting the increase in
CG height as the tire size is increased.
Figure 8 shows the yaw rate of the vehicle for each of the three tests shown in Figure 3.
The yaw response to the steering reversal consistently resulted in 40 – 50 deg/sec yaw
rates.Figures 9 and 10 show the front and rear wheel slip angles, respectively, throughout
the maneuvers for each tire/wheel combination in Figure 3. The front axle slip angles
were larger than those encountered by the rear axle, with the steering inputs causing the
front tires to reach saturation both in the left and right steer directions. The roughly 2-hz
oscillations occurring after the steering reversal were related to the natural frequency of
the non-linear system encompassing the chassis roll and yaw response with the vehicle
suspension at the limits of travel. The oscillation can be seen in the roll, yaw and sideslip
response of the vehicle in both tip-up and non-tip-up runs. When tip-up occurred, it was
typically after 2 – 3 oscillations after the reversal. The behavior was influenced slightly
by the tires, but the responses appeared very similar among all the tests.
Effect of Wheel Offset
In order to look at the offset effect, the 285/50R20 tires and wheels with 18 mm offset
were run in both with and without 20 mm spacers installed. In this case, the CG height
was identical for each test, but the track width was 40 mm wider for the case with the
13
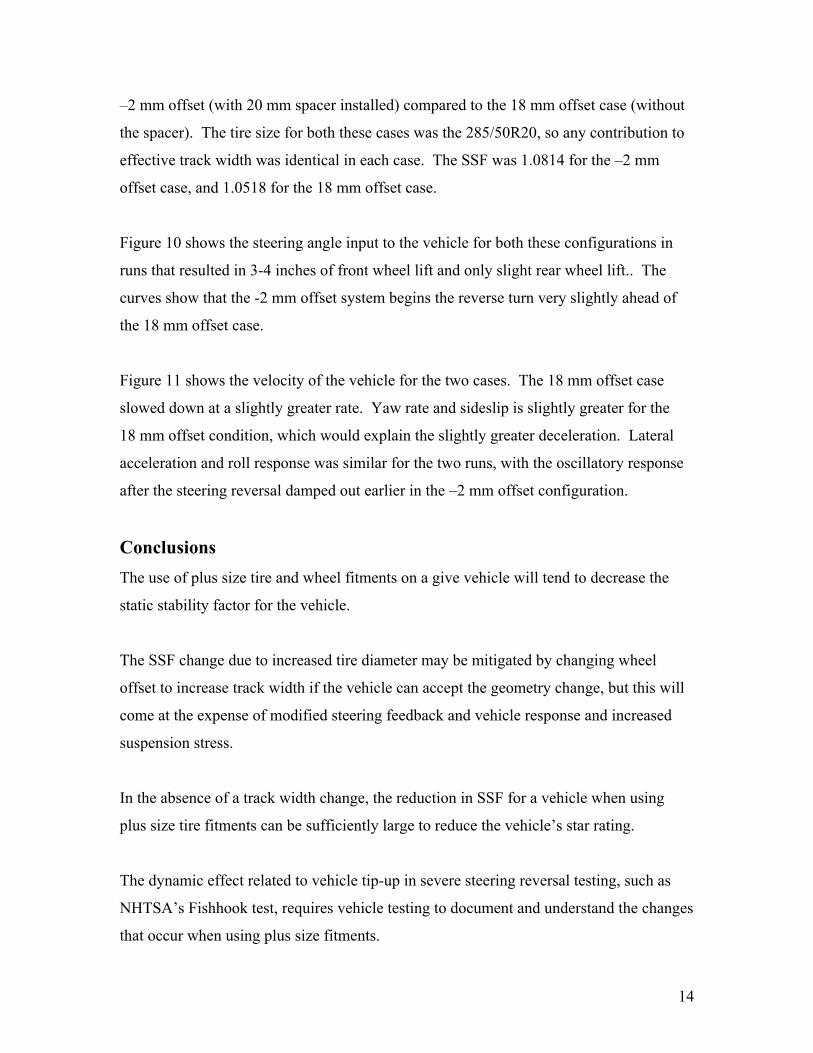
–2 mm offset (with 20 mm spacer installed) compared to the 18 mm offset case (without
the spacer). The tire size for both these cases was the 285/50R20, so any contribution to
effective track width was identical in each case. The SSF was 1.0814 for the –2 mm
offset case, and 1.0518 for the 18 mm offset case.
Figure 10 shows the steering angle input to the vehicle for both these configurations in
runs that resulted in 3-4 inches of front wheel lift and only slight rear wheel lift.. The
curves show that the -2 mm offset system begins the reverse turn very slightly ahead of
the 18 mm offset case.
Figure 11 shows the velocity of the vehicle for the two cases. The 18 mm offset case
slowed down at a slightly greater rate. Yaw rate and sideslip is slightly greater for the
18 mm offset condition, which would explain the slightly greater deceleration. Lateral
acceleration and roll response was similar for the two runs, with the oscillatory response
after the steering reversal damped out earlier in the –2 mm offset configuration.
Conclusions The use of plus size tire and wheel fitments on a give vehicle will tend to decrease the
static stability factor for the vehicle.
The SSF change due to increased tire diameter may be mitigated by changing wheel
offset to increase track width if the vehicle can accept the geometry change, but this will
come at the expense of modified steering feedback and vehicle response and increased
suspension stress.
In the absence of a track width change, the reduction in SSF for a vehicle when using
plus size tire fitments can be sufficiently large to reduce the vehicle’s star rating.
The dynamic effect related to vehicle tip-up in severe steering reversal testing, such as
NHTSA’s Fishhook test, requires vehicle testing to document and understand the changes
that occur when using plus size fitments.
14

In these tests, the larger, wider tires exhibit an increased “effective” track width that
compensates to some degree for the increase in CG height resulting from the use of the
larger tires.
15

References [1] Edington, G., “Plus Sizing – Where Does It End?”, Presented at the Tire Industry Conference, Hilton head, SC, Mar. 10-12, 2004. [2] “Plus-sized Problem?”, Tire Business, July 19, 2004. [3] Consumer Information; New Car Assessment Program; Rollover Resistance; Final Rule, 49 CFR Part 575, Oct. 14, 2003.
16

List of Tables TABLE 1 – Plus Sizing using Rule-of-Thumb Method TABLE 2 – Plus Sizing using Standards Tables TABLE 3 – Tire and Wheel Combinations used in Dynamic Testing TABLE 4 – SSF Values for Tested Configurations TABLE 5 – Steering Wheel Angles for SIS and Fishhook Testing
17

TABLE 1. Plus Sizing using Rule-of-Thumb Method Plus Size Tire Dimension Diameter (mm) Load (kg)
OE 265/70R16 778 1120 Plus 1 275/60R17 762 1060 Plus 2 285/50R18 743 1030 Plus 3 295/40R19 N/A N/A Plus 4 305/30R20 N/A N/A
TABLE 2. Plus Sizing using Standards Tables
Plus Size Tire Dimension Diameter (mm) Load (kg) OE 265/70R16 778 1120
Plus 1 285/65R17 762 1120 Plus 2 285/60R18 799 1250 Plus 3 N/A N/A N/A Plus 4 285/50R20 794 1120
TABLE 3. Tire and Wheel Combinations used in Dynamic Testing Tire1 Size Speed
Rating Tire OD
(mm) Wheel Size Wheel Offset
(mm) P225/75R15 102S M+S S 719 15x6.0 0
31x10.50R15LT 109Q M+S Q 775 15x7.0 0 285/50R20 116H M+S H 794 20x8.5 -2 285/50R20 116H M+S H 794 20x8.5 18
1 All tires are Goodyear Fortera HL
TABLE 4. SSF Values for Tested Configurations Tire Size Wheel Size/Offset Computed SSF / Star Rating
P225/75R15 102S M+S 15x6.0 / 0 1.1512 / 31x10.50R15LT 109Q M+S 15x7.0 / 0 1.1119 /
285/50R20 116H M+S 20x8.5 / -2 1.0814 / 285/50R20 116H M+S 20x8.5 / 18 1.0518 /
TABLE 5. Steering Wheel Angles for SIS and Fishhook Testing Tire Size Wheel
Size/Offset SIS Steering Angle (deg)
Steer Angle Extreme(deg)
P225/75R15 102S M+S 15x6.0 / 0 45.8 292.5 31x10.50R15LT 109Q M+S 15x7.0 / 0 41.7 271.1
285/50R20 116H M+S 20x8.5 / -2 40.0 260.0 285/50R20 116H M+S 20x8.5 / 18 40.0 260.0
18

19
List of Figure Captions FIGURE 1. Effect of Plus Size Fitment on Static Stability Factor. FIGURE 2. Test Vehicle with NHTSA-style outriggers and wheel lift sensors. The
steering controller and tire video equipment are specific to this test center.
FIGURE 3. Comparison of steering wheel angles during testing for tires-size
comparison. FIGURE 4. Linear velocity of vehicle CG at minimum tip-up speed for wheels at
near-zero offset. Note that the vehicle tip-up occurred at about 1.25 seconds for all tire configurations.
FIGURE 5. Vehicle side slip angles for wheels at near-zero offset. Note that the side
slip angle decreases with tire size. FIGURE 6. Comparison of front tire deformation of P225/75R15 (left) and
31x10.50R15LT (right) at maximum tip-up. Wheels are zero offset in both cases.
FIGURE 7. Comparison of front tire deformation of P225/75R15 (left) and
285/50R20 (right) at maximum tip-up. Wheels are zero offset on left and –2 mm offset on right.
FIGURE 8. Yaw rates for each of the three tire-wheel combinations having near-zero
wheel offset. FIGURE 9. Front wheel slip angles for the near-zero wheel offset tests. FIGURE 10. Rear wheel slip angles for the near-zero wheel offset tests. FIGURE 11. Steering wheel angles for 285/50R20 comparison on different wheel
offsets. FIGURE 12. Vehicle CG linear velocity at tip-up for 285/50R20 tires on different
wheel offsets. FIGURE 13. Vehicle yaw rates for 285/50R20 tires on different wheel offsets.

SSF Change for Chevrolet Avalanche with Oversize Tire Fitments w/o Tip Up, w/ Tip Up
1.050
1.060
1.070
1.080
1.090
1.100
1.110
1.120
1.130
1.140
1.150
OE Plus0 Plus1 Plus2 Plus3 Plus4 Plus5 Plus6 Plus7 Plus8
Tire Size Category
T/2h
RWD
4WD
FIGURE 1. Effect of Plus Size Fitment on Static Stability Factor.
20

FIGURE 2. Test Vehicle with NHTSA-style outriggers and wheel lift sensors. The steering controller and tire video equipment are
specific to this test center.
21

Steering Wheel AngleSteering Limits set by SIS Tests
-400
-300
-200
-100
0
100
200
300
400
0 1 2 3 4 5 6
Time(sec)
SWA
(deg
)
P225/75R15 31x10.50R15LT 285E/50R20
P225/75R15 31x10.50R15LT 285E/50R20
FIGURE 3. Comparison of steering wheel angles during testing for tires-size comparison.
22

CG Velocity X
0
5
10
15
20
25
30
35
40
0 1 2 3 4 5 6
Time(sec)
Spee
d (m
ph)
P225/75R15 31x10.50R15LT 285E/50R20P225/75R15 31x10.50R15LT 285E/50R20
FIGURE 4. Linear velocity of vehicle CG at minimum tip-up speed for wheels at near-zero offset. Note that the vehicle tip-up
occurred at about 1.25 seconds for all tire configurations.
23

Vehicle Side Slip
-12.0
-10.0
-8.0
-6.0
-4.0
-2.0
0.0
2.0
4.0
6.0
8.0
0 1 2 3 4 5 6
Time(sec)
(mph
)
P225/75R15 31x10.50R15LT 285E/50R20P225/75R15 31x10.50R15LT 285E/50R20
FIGURE 5. Vehicle side slip angles for wheels at near-zero offset. Note that the side slip angle decreases with tire size.
24
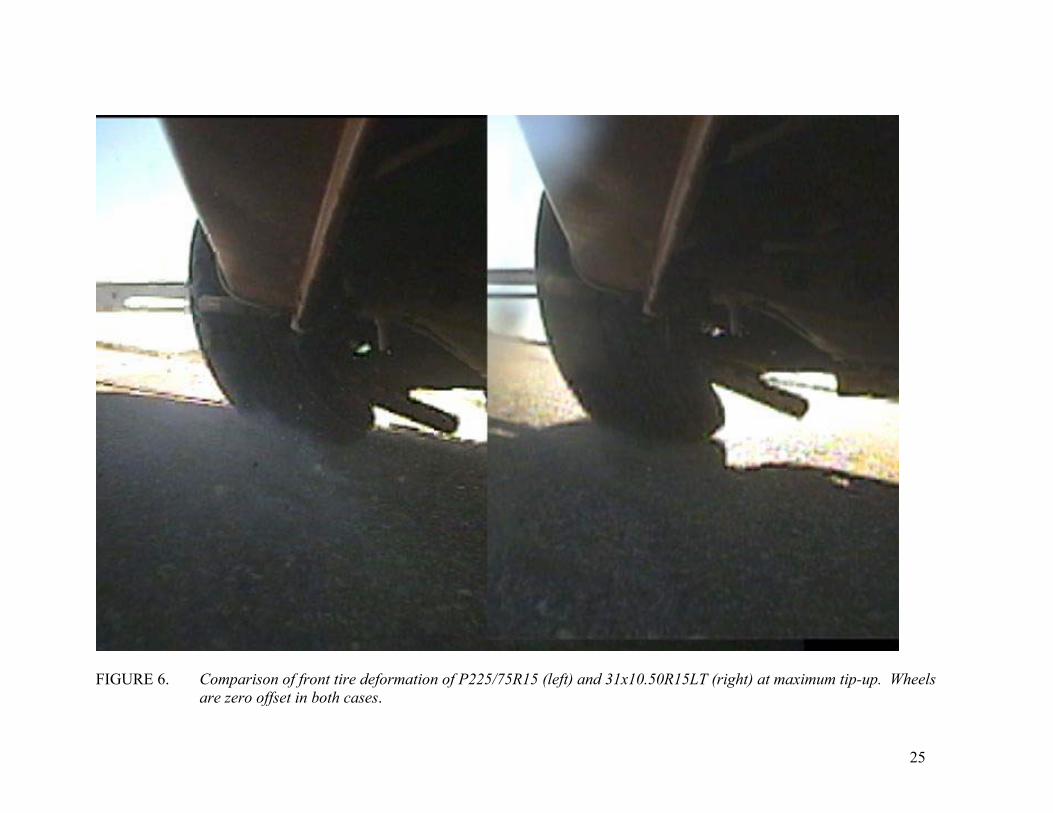
FIGURE 6. Comparison of front tire deformation of P225/75R15 (left) and 31x10.50R15LT (right) at maximum tip-up. Wheels
are zero offset in both cases.
25

FIGURE 7. Comparison of front tire deformation of P225/75R15 (left) and 285/50R20 (right) at maximum tip-up. Wheels are
zero offset on left and –2 mm offset on right.
26

Yaw Rate
-50.0
-40.0
-30.0
-20.0
-10.0
0.0
10.0
20.0
30.0
40.0
50.0
60.0
0 1 2 3 4 5 6
Time(sec)
(deg
/sec
)
P225/75R15 31x10.50R15LT 285E/50R20P225/75R15 31x10.50R15LT 285E/50R20
FIGURE 8. Yaw rates for each of the three tire-wheel combinations having near-zero wheel offset.
27

Front Wheel Slip Angle
-25.0
-20.0
-15.0
-10.0
-5.0
0.0
5.0
10.0
15.0
20.0
0 1 2 3 4 5 6
Time(sec)
degr
ees
P225/75R15 31x10.50R15LT 285E/50R20P225/75R15 31x10.50R15LT 285E/50R20
FIGURE 9. Front wheel slip angles for the near-zero wheel offset tests.
28

Rear Wheel Slip Angle
-20.0
-15.0
-10.0
-5.0
0.0
5.0
10.0
15.0
0 1 2 3 4 5 6
Time(sec)
degr
ees
P225/75R15 31x10.50R15LT 285E/50R20P225/75R15 31x10.50R15LT 285E/50R20
FIGURE 10. Rear wheel slip angles for the near-zero wheel offset tests.
29

Steering Wheel Angle for 285/50R20 TireSteering limits set by SIC Tests
-300
-200
-100
0
100
200
300
0 1 2 3 4 5 6
Time(sec)
SWA
(deg
)
18 mm Inset 2 mm Outset18 mm Inset 2 mm Outset
FIGURE 11. Steering wheel angles for 285/50R20 comparison on different wheel offsets.
30

CG Velocity X285/50R20 Tires
0
5
10
15
20
25
30
35
40
0 1 2 3 4 5 6
Time(sec)
Spee
d (m
ph)
18 mm Inset 2 mm Outset18 mm Inset 2 mm Outset
FIGURE 12. Vehicle CG linear velocity at tip-up for 285/50R20 tires on different wheel offsets.
31

Yaw Rate285/50R20 Tires
-50.0
-40.0
-30.0
-20.0
-10.0
0.0
10.0
20.0
30.0
40.0
50.0
0 1 2 3 4 5 6
Time(sec)
(deg
/sec
)
18 mm Inset 2 mm Outset18 mm Inset 2 mm Outset
32
FIGURE 13. Vehicle yaw rates for 285/50R20 tires on different wheel offsets.