Embed Size (px)
Citation preview

January
32 1Dept. of Agribusiness Management, Faculty of Agriculture & Plantation Management, Wayamba University of
Sri Lanka, Makandura, Gonawila (NWP), 60170, Sri Lanka
IMPACT OF ENVIRONMENTAL ALTRUISM ON ADOPTION OF
SOLID WASTE MANAGEMENT PRACTICES IN THE FIRM:
CASE OF AGRI-FOOD PROCESSING SECTOR IN SRI LANKA
J. M. M. Udugama1, U. K. Jayasinghe-Mudalige
1 and G. H. I. Anjali
1
ABSTRACT
This study examines empirically the potential relationship between the environmental
altruism of a firm’s decision maker on environmental quality and the level of adoption of
enhanced environmental controls by the firm using the special case of adoption of solid waste
management practices (SWMPs) recommended by the Ministry of Environment of Sri Lanka
to the agri-food processing firms in Sri Lanka. The data collected from 275 firms by means of
an in-depth interview with the environmental manager/owner were used to formulate a
Weighted Environmental Altruism Index (WEAI) to estimate the degree of altruism of the
manager. The Count Data Model was specified to assess the relationship between altruism
and levels of adoption of SWMPs. The results suggest that the degree of environmental
altruism of these mangers was relatively low (i.e. 0.25, on an average, of the WEAI ranges
from -1 to 1) and the level of adoption of SWMPs was very unsatisfactory (i.e. Mean 1.2 with
47% of non-adopters) showing no significant relationship between these two factors. This
implies the importance of augmenting the perspective of a firm’s management beyond the
profits through a collaborative action of the firm and other social institutions to make sure
that the businesses will not be liable for the environment it operates.
KEYWORDS: Agri-food processing sector, Altruism, Environmental controls, Waste
management
INTRODUCTION
The literature on environmental economics
and management points out two broad
ways to maintain environmental quality:
(1) the legal framework provided by the
government and judiciary [public], and (2)
the voluntary environmental protection,
which is to be carried out by a firm on its
own willingness [private] (Hettige et al.,
1996). A large number of conceptual
frameworks developed (see, for example
Kolstad et al., 1990; Rugman and Verbeke,
1998; Segerson and Miceli, 1998; Viscusi,
1989; Weersink et al., 1998) and empirical
analysis carried out (Henriques and
Sadorsky, 1996; Khanna 2001; Nakamura
et al., 2001) with respect to perspectives of
both the developed and developing
countries show the effect of the actions of
both these institutions (i.e. public and
private) in the past two decades. The
outcomes of many of these studies
generally place too much emphasis on the
shortcomings of the market to address the
issues related to environment, and at the
same time, have tended to over-estimate
the advantages that come from government
regulation.
Though the effect of government
regulatory framework and the market
forces for a firm operates in a particular
market, especially for a food processing
firm which is subjected to a relatively high
consumer concerns and sensitivity towards
The Journal of Agricultural Sciences, 2011, vol. 6, no1
33
food and environmental quality related
issues is more or less the same at a given
point of time (Segerson, 1999; 1986), there
exist significant differences with regard to
private action by individual firms on
environmental quality or the interplant
variations in responses towards the
adoption of enhanced environmental
management controls at the firm level.
From the social sciences point of view, the
economists and psychologists insist that
this may mainly be associated with the
degree of “altruism” of decision makers of
the firm. Altruism can be defined broadly
as the unselfish concerns for the welfare of
others, or in other words, as an action that
increases the welfare of others without
regard for one‟s self interest. This shows
that altruism is likely to play a particularly
important role in people‟s attitudes and
behaviour when the issue of concern is a
matter of collective interest, and
environmental issues can be considered as
prime examples in this domain. Altruistic
behavior of a firm can have a crucial
impact on its private action towards
maintenance of the quality of its products
and on the environment. Environmental
altruism is, thus, defined as making
decisions and taking actions by the
management of a firm with respect to
environment that will ultimately augment
the environment quality and its status
(Kolm and Ythier, 2006).
Under these circumstances it is of
paramount importance to examine extent
to which the environmental altruism of the
management of a firm has an impact on
management of environmental quality as
that knowledge can be used extensively to
formulate appropriate end-user friendly
environmental policies or to strengthen the
existing regulatory frameworks by
minimizing their vagueness. For the
purpose of this study, we use the special
case of adoption of enhanced
environmental controls, which was
formulated by the Ministry of
Environment (and Natural Resources then)
[MENR], by the firms operate in the agri-
food processing sector in Sri Lanka.
Being the largest manufacturing sector in
Sri Lanka with more than 80 percent of
firms operate in the provinces of very high
population density, for example more than
500 people per km2, the generation and
unhygienic accumulation of waste through
these agri-food processing firms has
become a growing problem in Sri Lanka.
As a solution to this problem, the MENR
has already formulated the “National
Strategy for Solid Waste Management”
and a number of specific procedures that
firms in the food processing sector should
adopt in order to manage the solid waste
generated in a firm are introduced. These
include: (1) “Sorting of waste based on 3R
System” – establishment of necessary
infrastructure facilities in appropriate
places and allocating labor for the purpose;
(2) “Composting” – the conversion of solid
waste materials into composts, in which
the heavy metal composition should be
maintained below the recommended
standards; (3) “Biogas technology” –
establishing units in accordance with the
guidelines provided by the MENR; (4)
“Biodegradable packaging materials” –
using material such as paper, glass, cloth,
etc. instead of polyethylene and other non-
biodegradable plastics; (5) “Sanitary land
filling” – the maintenance of a site for
which the firm should obtain clearance
based on the guidelines provided by the
Central Environmental Authority (CEA) in
Sri Lanka; (6) a set of “Good
Manufacturing Practices” (GMP); (7)
Regular “Waste Auditing” system; and (8)
ISO 14000 Environmental Management
System. An individual business can select
either one or a combination of these
practices or any other appropriate
mechanism that they deem to be effective
in rectifying the problems associated with
the generation of waste in their premises.
The specific objective of this study was,
therefore, to examine empirically the
potential relationship between the degree

J. M. M. Udugama, U. K. Jayasinghe-Mudalige and G. H. I. Anjali
34
of environmental altruism and the level of
adoption of those solid waste management
practices (SWMPs) by the firms operate in
the agri-food processing sector in Sri
Lanka and to assess how firms‟ altruistic
behavior varies according to the type and
the scale of operation. In turn, we
hypothesize that a firm‟s response to
environmental quality, which is reflected
by the number of SWMPs adopted by a
firm, has a positive relationship with the
degree of environmental altruism of
decision maker of the firm and the
characteristics of the firm (i.e. type and
size of the firm).
MATERIALS AND METHODS
Derivation of Index to Reflect
Environmental Altruism
The first step towards empirical analysis
was to assess the degree of environmental
altruism of firm‟s decision maker on
environmental quality. Altruism is,
however, a behavioral concept that is
directly unobservable, and in
consequently, an analysis on quantifying
its effect on a phenomenon such as
environmental quality management is
needed to be constructed as an indirect
measurement that has an ability to
approximate the true behavior of
environmental altruism at the level of firm.
Following Jayasinghe-Mudalige and
Henson (2006), we have resolved to derive
an index for this purpose, which reflects
the degree of altruism of the firm‟s
decision maker on environmental quality.
To derive this particular index – herein
referred to as “Environmental Altruism
Index” (EAI), a series of attitudinal
statements (n=12) were specified to reflect
diverse facets of environmental altruism
cited in literature (Table 1).
Table 01: Attitudinal Statements reflecting altruism
Attitudinal Statement
U1 Many top managers in my firm are personally and actively involved in developing
environment protection policies and monitoring their implementation.
U2 My Company has a written environmental policy that states goals for improving our
environmental performances.
U3 Clear and strong signal has been sent from our top managers that better environmental
management is a requirement in our firm, not a choice.
U4 My firm has a long term plan to lower our pollution control costs in order to be more
competitive in the market.
U5 Environmental protection is an integral part of my company‟s culture.
U6 Ideas on pollution management are shared freely among lower, middle, and upper levels
within my firm.
U7 Humans have the right to modify the natural environment to suit their needs.
U8 Advances in technology will eventually solve the problem of environmental degradation.
U9 My firm‟s contribution to environmental pollution is small and hardly makes a difference.
U10 Polluters should pay fully for the damage they cause, and be responsible for cleaning up their
pollution.
U11 A certain amount of environmental damage is tolerated if there is to be economic growth.
U12 I feel it is my personal responsibility to ensure that my organization improves its
environmental performance.

The Journal of Agricultural Sciences, 2011, vol. 6, no1
35
Following the good practices of
developing attitudinal statements to obtain
objective responses from respondents by
preventing response bias (Henson and
Trail, 2000), the meaning of some of the
statements were set to reflect techno-
centrism of a respondent purposely. A
multi-point likert-scale of which the points
range from -5 from one end to +5 on the
other (i.e. -5 to 0 if the respondent
“disagree” with the underline phenomenon
of the statement and 0 to 5 if “agree” to it)
was constructed to obtain scores for each
statement.
Having formulated the set of statements,
we need to make sure whether all
statements were condensed into a single
factor by eliminating the empirical issues
associated with quantifying attitudes and
perceptions of people, including the
endogeneity, mutual exclusivity,
subjectivity and unobservability through
the testing for their unidimensionality
(Buchanan, 1969; Hair et al., 2006;
Nakamura et al., 2001). The Principal
Component Analysis (PCA), which is an
interdependence technique stated under the
Multivariate Data Analysis techniques that
is used commonly to define the underlying
structure among a set of variables of an
analysis objectively, was employed to test
this condition (Hair et al., 2006). The PCA
technique helps particularly to find a way
to condense the information contained in
these 12 statements (i.e. original variables)
into “single variate (factor)” or if not into a
“smaller set of new composite dimensions
or variates” with a minimum loss of
information by taking into account of the
total variance amongst the original
variables (De Vellis, 1991).
In principle, the EAI was specified to meet
the characteristics of an Additive Index
(Powers and Xie, 1999) in the form of
equation (1) below:
n
iiSi UaEAI
1
The term a(Us)i in equation (1) denotes the
score given by a respondent (i) to a
statement (Us) [s = number of statements]
on the likert-scale. To derive EAI for a
given firm, the summation of scores of all
the statements (s=12) was divided by the
Maximum Potential Score [a (U s)] to
normalize the value of the index. For this
particular analysis, the value of [a (U s)]
was 60 (i.e. maximum score of +5 on the
likert-scale x 12 statements]. With the
normalization, the values of EAI for a
given firm, thus, ranges from -1 to 1,
where -1 reflects the “perfect non-
altruism” of the decision maker on
environment quality, and 1 on the other
extreme reflects the “perfect altruism”.
Extent to which a manager is perceived the
effect of each attitudinal statement on her
decision to adopt SWMPs in the firm was
of interest in the empirical analysis.
Logically, even under the circumstances
where the 12 attitudinal statements stated
originally were confined to a single variate
(i.e. unidimensionality), all the
respondents in the sample may not value
the underline phenomenon explained in a
given statement as equally important, for
them to be altruistic towards the
environment. If so, it is imperative to
incorporate this variation into the analysis.
To fulfill this condition the original EAI
was extended to a “weighted” EAI –
herein referred to as WEAI, as expressed
in equation (2) below:
n
iiSsi UaWWEAI
1
where, all parameters are equal to those
given in the EIA equation expressed
earlier and W represents the weight
assigned to each statement to characterize
the variation of responses of respondents.
Given that the condition of
unidimensionality was satisfied in this
study (see below), the following method
J. M. M. Udugama, U. K. Jayasinghe-Mudalige and G. H. I. Anjali
36
was employed to derive the weights. First,
the Summation of Scores (SSa) provided
by all respondents in the sample to a given
statement was taken and the weight to be
assigned to each statement was decided
upon the size of SSa accordingly. As a
result, a relatively large weight was
assigned to any statement that obtained a
large SSa (see, Table 3). Inclusion of
weights into the EAI, thus, helps to
identify the statements reflecting altruism
that the respondents “most valued” in
terms of their private action on
environmental quality, and in turn, to
assign them with high weights, which is
not the condition for unweighted index
(EAI) as it assigns equal weights to all
statements.
Count Data Models to Specify
Environmental Responsiveness
The MENR does not suggest any
recommended order in which to adopt the
above mentioned eight SWMPs in a food
processing firm. Further, none of these
practices is endowed with a higher value
over the others. In other words, each
practice has its own merits. For the
purpose of this analysis, we have
presumed that the number of SWMPs
adopted by a firm reflects its degree of
responsiveness towards environmental
quality. Under these circumstances, there
is a possibility that certain firms may
decide to adopt a single or a few (i.e., two
or three) practices at a time, whereas
others may even go beyond (i.e., four or
five) depending on the gains to the firm by
doing so. On the other hand, there may be
firms that do not adopt a single practice
out of the eight recommended. In such
case, an analyst may come up with a series
of zeros as he/she works on a scale of:
Adoption = 1; Non-adoption = 0 to report
the status of adoption of these practices in
the firm on an individual basis. At times,
he/she may therefore experience excess
zeros. In light of this, we use the total
number of technologies/practices adopted
by a firm as a measure of its „intensity of
adoption‟, which has been a common
practice in literature on economics, where
Count Data Regression models were
employed for estimation purposes
(Cameron and Trivedi, 1998).
Econometric Specification
The following econometric model was
specified to examine the relationship
between the levels of environmental
controls adopted by a firm and its
environmental altruism and firm
characteristics:
SWMPi = 0 + 1 * EIAi + 1 * FTi +
2 * FSi + I (3)
where: SWMPi denotes the dependent
variable (i.e. no. of SWMPs adopted by a
firm). The right-hand side variables
include: 0 = intercept, 1 = coefficients of
EAI, and k = coefficients of characteristics
of a firm such that FT is the firm type (on
the different sub sector to which the agri-
food processing firm belongs i.e. Coconut
products) and FS is the firm size (based on
annual returns i.e. very large to very
small).
Study Area and the Data The food processing firms belonging to
five sub-sectors based on the type of
product, including: (a) processed fruits and
vegetables (PFV)]; (b) coconut products
(COP); (c) essential oils (ESO); (d) non-
alcoholic beverages (NAB), and (e) other
processed products (OPP), located in four
provinces [i.e., Western (WP), North
Western (NW), Central (CP) and Southern
(SP)] were taken for the collection of data.
The final sample consists of 275 firms,
which was selected randomly from a
mailing lists of food processors that
operate at various locations by contacting
reputed institutions such as the Department
of Census & Statistics of Sri Lanka, the
main and regional offices of the Export
Development Board of Sri Lanka, the
Federation and Regional Chambers of
Industry and Commerce, Coconut

The Journal of Agricultural Sciences, 2011, vol. 6, no1
37
Research Institute of Sri Lanka, Fruit and
Vegetable Processors Association of Sri
Lanka, and Sri Lanka Standards
Institution, etc. Further, the firms were
classified into two groups to reflect its size
by taking into account of its value of
annual sales, namely: (a) “Small” (Rs.
100,000 – 500,000), and (b) “Large” (>Rs.
500,000).
A face-to-face interview supported by the
structured questionnaire was conducted
with the top-most executive who possess
executive powers to make decisions with
respect to environmental quality related
aspects of the firm (in certain cases,
especially in the small firms, it was the
owner) to collect data from April to
September 2009 followed by an inspection
of the site for the cases where permission
was granted. With regard to the statements
explaining altruism, each respondent was
asked, in particular, first to rate his/her
perception on each statement in relation to
the current performance of his/her firm on
a two-point Likert scale, i.e., (1) agree
(“yes”), or (2) disagree (“no”). Afterwards,
he/she was instructed to rate the same
statement on a five-point Likert-scale by
taking into account of the extent to which
he/she agrees (if they say “yes” in the 1st
rating) or disagrees (if they say “no” in the
1st rating) with this particular statement
(Oppenheim, 1992).
Having coded the data appropriately and
performed the standard tests for the
missing data in certain cases, the
“Statistical Package for Social Sciences”
(SPSS) [Version 13] was used to obtain
the results of the PCA and the STATA
[Version 8] was used to obtain the outputs
of the Count Data models.
RESULTS AND DISCUSSION
Descriptive Statistics of the Sample
The 275 firms in the sample comprised of
77 (28%) PFV, 64 (23%) NAB, 52 (19%)
ESO, 21 (8%) COP and 61 (22%) of OPP
in terms of type of the firm and 150 (55%)
Small and 125 (45%) Large, in terms of
the size of the firm. With regard to the
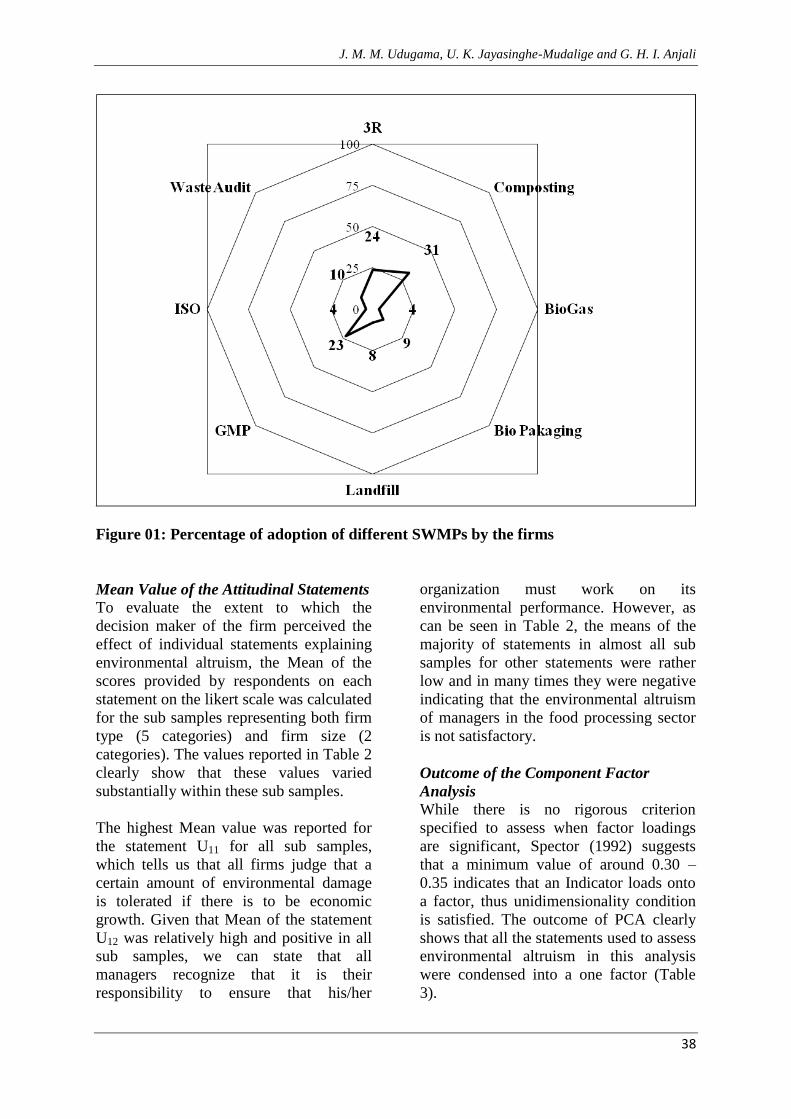
types of SWMPs adopted by firms, it was
observed that “Composting” (24%), “3R
system” (31%) and “Good Manufacturing
Practices” (23%) were popular amongst
the firms and only a small percentage of
firms adopt other recommended practices
(Figure 1).
Interestingly, almost 50 percent of firms in
the sample, i.e. 135 firms, did not adopt a
single SWMP suggested by the MENR.
Another 70 (25%), 24 (9%) and 18 (7%)
firms have adopted only 1, 2 or 3 out of
the 8 practices respectively (Figure 2). The
number of SWMPs adopted by a firm
varied to a great extent vis-à-vis the type
of the firm and its size. Firms that
produced non-alcoholic beverages (NAB)
and processed fruits and vegetables (PFV)
tend to adopt a higher number of SWMPs
in comparison with those that processed
essential oils (ESO) and coconut products
(COP). With regard to firm size, large
firms, not surprisingly, tended to adopt a
higher number of SWMPs. For example,
nearly 20 percent of large firms adopted
more than 4 such practices in the firm
compared to 67 percent of small firms who
did not adopt a single practice.
J. M. M. Udugama, U. K. Jayasinghe-Mudalige and G. H. I. Anjali
38
Figure 01: Percentage of adoption of different SWMPs by the firms
Mean Value of the Attitudinal Statements
To evaluate the extent to which the
decision maker of the firm perceived the
effect of individual statements explaining
environmental altruism, the Mean of the
scores provided by respondents on each
statement on the likert scale was calculated
for the sub samples representing both firm
type (5 categories) and firm size (2
categories). The values reported in Table 2
clearly show that these values varied
substantially within these sub samples.
The highest Mean value was reported for
the statement U11 for all sub samples,
which tells us that all firms judge that a
certain amount of environmental damage
is tolerated if there is to be economic
growth. Given that Mean of the statement
U12 was relatively high and positive in all
sub samples, we can state that all
managers recognize that it is their
responsibility to ensure that his/her
organization must work on its
environmental performance. However, as
can be seen in Table 2, the means of the
majority of statements in almost all sub
samples for other statements were rather
low and in many times they were negative
indicating that the environmental altruism
of managers in the food processing sector
is not satisfactory.
Outcome of the Component Factor
Analysis
While there is no rigorous criterion
specified to assess when factor loadings
are significant, Spector (1992) suggests
that a minimum value of around 0.30 –
0.35 indicates that an Indicator loads onto
a factor, thus unidimensionality condition
is satisfied. The outcome of PCA clearly
shows that all the statements used to assess
environmental altruism in this analysis
were condensed into a one factor (Table
3).

The Journal of Agricultural Sciences, 2011, vol. 6, no1
39
Table 02: Mean values of the attitudinal statements
AS Firm Type Firm Size
COP ESO NAB OPP PFV SML LRG
U1 0.95 -1.12 0.89 -1.28 1.13 -1.32 1.81
U2 0.00 -1.37 0.77 -1.44 0.83 -1.56 1.50
U3 2.00 -0.35 1.83 -0.31 1.80 -0.33 2.48
U4 2.29 0.87 2.22 0.78 2.16 0.75 2.69
U5 1.09 0.21 1.81 0.09 1.75 0.01 2.31
U6 0.90 -1.06 1.61 -0.26 1.48 -0.44 1.85
U7 0.00 -1.69 -0.31 -1.54 -0.15 -1.71 -0.34
U8 0.19 -0.02 1.71 0.09 0.97 0.01 1.46
U9 -1.61 -3.5 -2.19 -3.75 -2.67 -4.03 -1.88
U10 -1.47 -2.07 -1.34 -1.65 -1.48 -2.18 -0.90
U11 3.04 2.77 3.05 3.05 2.99 2.79 3.25
U12 2.81 2.21 2.24 2.24 2.71 2.03 3.29
Table 03: Rotated factor loading matrix
Altruism
Statement
Varimax-Rotated
Factor Loadings COM
Estimated
Weight (W)
U1 0.873 0.763 0.019
U2 0.892 0.796 -0.032
U3 0.847 0.718 0.185
U4 0.837 0.701 0.319
U5 0.864 0.746 0.206
U6 0.812 0.659 0.117
U7 0.780 0.608 -0.151
U8 0.579 0.336 0.113
U9 0.753 0.567 -0.561
U10 0.436 0.190 -0.311
U11 0.444 0.197 0.586
U12 0.749 0.561 0.508 Note: COM – Communalities

J. M. M. Udugama, U. K. Jayasinghe-Mudalige and G. H. I. Anjali
40
Derivation of EAI and WEAI
The values of both unweighted and
weighted index EAI and WEIA were
obtained for each and every firm in the
sample and Mean of EAI and WEIA are
illustrated in Figure 3 for sub samples
representing the firm types and the firm
size.
The results highlight that degree of
environmental altruism is comparatively
low as the values of both EAI and WEAI
are below 0.2 when food processing firms
taken as a whole. However, we can infer
that the degree of environmental altruism
of managers has a positive correlation with
firm size, because Mean EAI and WEAI of
the large firms is positive and greater than
any other sub sample and that of small
firms is negative suggesting that the larger
firms posses a higher tenacity to adopt
SWMPs in compared to their counterpart.
However, the type of firm does not show
any significant difference with regard to
the degree of environmental altruism. The
non-alcoholic beverage (NAB) processing
firms possess the highest positive value for
both EAI and WEAI followed by those
fruits and vegetables (PFV) and coconut
product (COP) processing firms, while the
mean values of other two types of firms
(i.e. ESO and OPP) were negative
indicating that the management of those
firms, on an average, did not show
altruistic behavior towards the
environmental quality.
876543210
Number of SWMPs
140
120
100
80
60
40
20
0
Nu
mb
er
of
Fir
ms
1
0
68
13
18
24
70
135
Mean = 1.12
Std. Dev. = 1.565
N = 275
Figure 02: Number of SWMPs adopted by the firms

The Journal of Agricultural Sciences, 2011, vol. 6, no1
41
Figure 03: Mean values of EAI and WEAI for different sub samples
Results Pertaining to the Count Data
Analysis
As can be seen from Figure 1, the number
of SWMPs adopted by firms in the sample
differs considerably. As a result, the
dependent variable would be in the form a
non negative integer-valued count and the
appropriate statistical model could be the
Poisson Regression model. However, in
most economic applications, the integer-
valued count data encompasses over-
dispersion meaning that the Conditional
Variance exceeds the Conditional Mean.
In such cases, Poisson model cannot be
used. In addition, a relatively higher
frequency of zero observations on the
dependent variable is another frequently
encountered issue in empirical studies.
Thus, with a large proportion of zero
observations and the potential presence of
over-dispersion, the Poisson Model is not
appropriate (Cameron and Trivedi, 1998).
Given that 135 out of 275 firms (49.1%) in
the sample did not adopt even a single
SWMP (i.e. non-adopters), the Zero-
Inflated Poisson (ZIP) and Zero-Inflated
Negative Binomial (ZNIB) models were
selected for the analysis.
The ZIP regression was performed
initially. The Vuong test of ZIP versus
standard Poisson (probability value =
0.000) proved that ZIP model is preferable
to the parent Poisson distribution. Next,
the ZINB regression analysis was
performed and insignificant dispersion
parameter alpha (α) with the probability of
0.862 proved that there is no unobservable
heterogeneity. As a result, the outcome
ZIP model was selected as the best fitted
model to explain the relationship specified
in the econometric model (Table 4).
-1
-0.8
-0.6
-0.4
-0.2
0
0.2
0.4
0.6
0.8
1
COPESO
NAB
OPP
PFVSm
all
Large
AA
I an
d W
AA
I
AAI WAAI

J. M. M. Udugama, U. K. Jayasinghe-Mudalige and G. H. I. Anjali
42
Table 04: Estimates of coefficients of ZIP model
Variable Estimate of Coefficient Probability
WAAI 3.271 0.981
ESO 1.937 0.998
NAB 2.412 0.995
OPP 1.321 1.000
PFV 1.832 0.999
LRG 2.489 0.981
Constant 2.347 0.996 *
Significant at 5% level
Voung test of ZIP vs. standard Poisson: p = 0.000
Note: COF – Coefficient; PRO – Probability
The outcome of analysis shows that there
is no significant relationship between the
firms‟ decision to adopt SWMPs with the
degree of environmental altruism of the
decision maker. Interestingly, none of the
other variables were significantly
associated with the adoption decision
either indicating that firm type or size does
not act as a significant factor in this
respect. It is evident that both the levels of
adoption of SWMPs at the firms and
degree of altruism of managers in this
sector were not up to considerable level to
impact the adoption; for example the Mean
level of adoption is almost 1.2 with a large
majority of non-adopters in the sector and
the value of environmental altruism index
is below 0.2 showing very low positive
altruism of managers.
CONCLUSIONS
The outcome of analysis proves that the
low levels of environmental
responsiveness of agri-food processing
firms, which is reflected by the small
number of SWMPs adopted by the firms,
is associated with relatively low degree of
environmental altruism of decision maker
of the firm. Therefore, it could be assumed
that the perceptions of managers who
make decisions with regard to
environmental quality in this particular
sector may be triggered by the
perspectives of diminish profit and/or
increased costs and other financial
implications associated with the adoption
of such controls rather than their unselfish
thoughts on the private and social benefits
of it in the long run.
The results, overall, suggest that the lack
of formalized environmental structures
and/or empowerment in the firm appear to
have established a context of moral
frustration for environmentally interested
managers who may feel obliged to
suppress their altruistic behavior and
prioritize economic interest of the firm. Or
it could also be due to the fact that external
institutional pressure to adopt these
environmental management controls in the
developing country context has submerged
the altruistic behavior of the managers. We
may infer that firms‟ voluntary action on
responding to the market-based incentives
such as reputation, minimizing commercial
pressure and increasing efficiency in
technology and human resources may also
not become a reality as the decision
makers lack propensity to act voluntarily
on such action.
In its process to respond to the current
regulation on environment, a firm has
several roles to play and out of which
augmentation of environmental altruism of

The Journal of Agricultural Sciences, 2011, vol. 6, no1
43
managers is not second to any. The
outcome of analysis insists that the
government, together with the other
sectors in the market (such as industry and
trade organizations) should assist the firms
to develop appropriate environmental
quality management programs coupled
with extensive training to enhanced their
awareness on the environment. Trade and
other industry organizations, as an integral
part of the market can play an extensive
role in this connection to make use of a
firm‟s resource base most effectively in
this respect, and for that purpose, it is
needed to reward the self-motivated
managers regularly for their altruistic
behavior on environmental quality.
ACKNOWLEDGEMENT
We acknowledge the financial assistance
provided by the South Asian Network for
Development and Environmental
Economics (SANDEE) to carry out this
study. The support extended by the
owners/managers of firms participated in
this study and those who supported in
contacting the firms are also much
appreciated.
REFERENCES
Buchanan, J. M. (1969). Cost and Choice: An Inquiry in Economic Theory, Markham.
Chicago.
Cameron, A. C. and P. Trivedi (1998). Regression Analysis of Count Data. Cambridge
University Press, Cambridge.
De Vellis, R. F. (1991). Scale Development: Theory and Applications, Sage Publications:
Newbury Park.
Hair, J. F., R. E. Anderson; R. L. Tatham; R. L. and W. C. Black (1998). Multivariate Data
Analysis. 5th ed. New Jersey, Prentice-Hall.
Henson, S. and B. Traill (2000). Measuring perceived performance of the food system and
consumer food-related welfare, Journal of Agricultural Economics 51(3), pp. 388 –
404.
Henriques, I. and P. Sadorsky (1996). The determinants of an environmental responsive firm:
an empirical approach, Journal of Environmental Economics and Management 30, pp.
381 -395.
Hettige, H., M. Huq, S. Pargal, and D. Wheeler (1996). Determinants of pollution abatement
in developing countries: evidence from South and Southeast Asia, World
Development 24, pp. 1891 - 1904.
Jayasinghe-Mudalige, U. K. and S. Henson (2006). Economic incentives for firms to
implement enhanced food safety controls: Case of the Canadian red meat and poultry
processing sector. Review of Agricultural Economics, 28(4), pp. 495 - 514.
Khanna, M. (2001). Economic analysis of non-mandatory approaches to environmental
Protection, Natural Resources, 4, pp. 42 - 46.
Kolm, S. and J. M. Johnson (2006). Handbook of the Economics of Giving, Altruism and
Reciprocity 1, North Holland.
Kolstad, C. D., T. S. Ulen and G. V. Johnson (1990). Ex Post liability of harm vs. ex ante
safety regulations: substitutes or complements? American Economic Review 80(4),
pp. 888 - 901.
Nakamura, M., T. Takahashi and I. Vertinsky (2001). Why Japanese firms choose to certify:
a study of managerial responses to environmental issues, Journal of Environmental
Economics and Management, 42, pp. 23 - 52.
J. M. M. Udugama, U. K. Jayasinghe-Mudalige and G. H. I. Anjali
44
Oppenheim, A. N. (1992). Questionnaire Design, Interviewing and Attitude Measurement,
London: Pinter Publishers.
Powers, D. A. and Y. Xie (1999). Statistical Methods for Categorical Data Analysis.
Academic Press Inc.
Rugman, A. M. and A. Verbeke (1998). Corporate strategies for environmental regulations.
Strategic Management Journal, 19(4), pp. 363 - 375.
Segerson, K. (1986). Uncertainty and incentives for non-point pollution control, Journal of
Environmental Economics and Management, 15, pp. 87 - 98.
Segerson, K. (1999). Mandatory versus voluntary approaches to food safety, Agribusiness,
15(1), pp. 53 - 70.
Segerson, K. and T. J. Miceli (1998). Voluntary environmental agreements: good or bad news
for environmental protection? Journal of Environmental Economics and Management,
36, pp. 109 - 130.
Spector, P. E. (1992). Summated rating scale construction. In: Basic Management. Lewis-
Beck, M. S. (Ed.). Sage Publications. Newbury Park.
Viscusi, W. K. (1989). Toward a diminished role for tort liability: social insurance,
government regulation, and contemporary risks to health and safety, Yale Journal of
Regulation, 6, pp. 65 - 107.
Weersink, A., J. Livernois, J. F. Shogren and J. S. Shortle (1998). Economic instruments and
environmental policy in agriculture, Canadian Public Policy, 24(3), pp. 309 - 327.