Embed Size (px)
DESCRIPTION
This report examines the impact of climate change on urban settlements and adaptation strategies and practices, and particularly low-income groups’ adaptation in Colombia.
Citation preview

UNITED NATIONS HUMAN SETTLEMENTS PROGRAMMEP.O.Box 30030,Nairobi 00100,Kenya;Tel: +254-20-7623120; Fax: +254-20-76234266/7 (Central office) [email protected] www.unhabitat.org/publications
This report examines the impact of climate change on urban settlements and adaptation strategies and practices, and particularly low-income groups’ adaptation in Colombia.
HS/110/12EISBN (Series): 978-92-1-132027-5ISBN (Volume): 978-92-1-132524-9
The Global Urban economic DialoGUe SerieS
climaTe chanGeThe impacT of
on Urban SeTTlemenTS in colombia

Sec1:i
United Nations Human Settlements ProgrammeNairobi 2012
The ImpacT of clImaTe change on Urban SeTTlemenTS iN Colombia

ii
The Global Urban Economic Dialogue Series The Impact of Climate Change on Urban Settlements in Colombia
First published in Nairobi in 2012 by UN-HABITAT. Copyright © United Nations Human Settlements Programme 2012
All rights reserved United Nations Human Settlements Programme (UN-HABITAT) P. O. Box 30030, 00100 Nairobi GPO KENYA Tel: 254-020-7623120 (Central Office) www.unhabitat.org
HS/110/12EISBN (Series): 978-92-1-132027-5ISBN (Volume): 978-92-1-132524-9
Disclaimer
The designations employed and the presentation of the material in this publication do not imply the expression of any opinion whatsoever on the part of the Secretariat of the United Nations concerning the legal status of any country, territory, city or area or of its authorities, or concerning the delimitation of its frontiers of boundaries.
Views expressed in this publication do not necessarily reflect those of the United Nations Human Settlements Programme, the United Nations, or its Member States.
Excerpts may be reproduced without authorization, on condition that the source is indicated.
Acknowledgements:
Director: Naison Mutizwa-Mangiza
Chief Editor and Manager: Xing Quan Zhang
Principal Authors: Andrea Lampis and Arabella Fraser
Contributor: Lingzhen Yao
English Editor: Eric Orina
Design and Layout: Victor Mgendi
Cover Photo: Cartagena, Colombia © Alberto Loyo/shutterstock
Assiatant: Joy Munene

iii
Ur b a n i z a t i o n is one of the most powerful, irreversible forces in the world. It is estimated that 93 percent of the future urban population growth will occur in the cities of Asia and
Africa, and to a lesser extent, Latin America and the Caribbean.
We live in a new urban era with most of humanity now living in towns and cities.
Global poverty is moving into cities, mostly in developing countries, in a process we call the urbanisation of poverty.
The world’s slums are growing and growing as are the global urban populations. Indeed, this is one of the greatest challenges we face in the new millennium.
The persistent problems of poverty and slums are in large part due to weak urban economies. Urban economic development is fundamental to UN-HABITAT’s mandate. Cities act as engines of national economic development. Strong urban economies are essential for poverty reduction and the provision of adequate housing, infrastructure, education, health, safety, and basic services.
The Global Urban Economic Dialogue series presented here is a platform for all sectors of the society to address urban economic development and particularly its contribution to addressing housing issues. This work carries many new ideas, solutions and innovative best practices from some of the world’s leading urban thinkers and practitioners from international organisations, national governments, local authorities, the private sector, and civil society.
This series also gives us an interesting insight and deeper understanding of the wide range of urban economic development and human settlements development issues. It will serve UN member States well in their quest for better policies and strategies to address increasing global challenges in these areas
Joan Clos Under-Secretary-General, United Nations
Executive Director, UN-HABITAT
foreWorD

iv
conTenTS
foreWorD III
conTenTS Iv
lIST of abbrevIaTIonS anD acronymS vI
lISTS of fIgUreS, graphS, mapS anD TableS vII
Chapter 1 InTroDUcTIon 1
1.1 Climate Change: Current and Future Trends in Colombia 5
1.1.1 Geography and Climate 5
1.2 Global Scenarios 7
1.3 Climate Changes in the latin-american Region 9
1.4 National Climate Scenarios and Trends 11
1.4.1 Temperature Changes 11
1.4.2 Precipitation Changes 11
1.4.3 Ice Cap Melting 14
1.4.4 Sea-Level Rise 15
1.4.5 Natural Disasters 18
1.5 Recent Climate Change Findings: The Cases of boyacá and Cundinamarca 19
1.5.1 Trends in Precipitation in the Departments of Boyacá and Cundinamarca 21
1.5.2 Extreme Precipitation Trends in the Departments of Boyacá and Cundinamarca 23
1.5.3 Trends in Maximum and Minimum Temperatures 25
Chapter 2 polIcIeS anD InSTITUTIonS for aDapTaTIon To clImaTe change In Urban colombIa 28
2.1 adaptation to Climate Change 28
2.2 Urban Governance and the institutional arrangements for adaptation in Colombia 29
2.3 Direct adaptation Policies in Colombia 30
2.4 Urban Development Policies and adaptation in Colombia 32

Chapter 3 The ImpacTS of clImaTe change on Urban SeTTlemenTS In colombIa: conTexT anD crITIcal ISSUeS 39
3.1 Typology of impact of Climate Change on Urban Settlements 41
3.2 The Urbanisation Process in Colombia 43
3.3 Urban Settlements and Climate Change impacts: Global Risks and local Vulnerabilities 44
3.4 Conceptualising the Vulnerability and adaptation of Cities 45
3.5 Cities and Social Vulnerability: Towards an asset-based Framework for adaptation 46
3.6 The 2nd National Communication on Climate Change: Evidence of Potential impacts of Climate Variability on Urban areas 48
3.6.1 Landslides 48
3.6.2 Climate Variability Impacts on Potable Water System 48
3.6.3 Impacts on Low-Elevation Coastal Zones 50
3.7 Case Studies of Urban Vulnerability to Environmental Risk 51
3.7.1 Case study 1 – Bogotá 51
3.7.2 Case study 2 – Cartagena: an Assessment of its Ecosystems and Adaptation Constraints 54
3.7.3 Case study 3 – Manizales 56
3.7.4 Case study 2 – Tumaco 59
Chapter 4 loW-Income groUpS’ aDapTaTIon To clImaTe change In colombIa 65
4.1 income Poverty and Distribution 66
4.2 multidimensional Poverty as an approach to the Capacity to adapt 68
4.2.1 Changes and Trends in the Factors of the Conditions of Life Index 69
4.2.2 Multidimensional Poverty According to the Conditions of Life Index 73
4.3 millennium Development Goals 73
Chapter 5 conclUSIonS 79
bIblIography 81

vi
The ImpacT of clImaTe change on Urban SeTTlemenTS In colombIa
lIST of abbrevIaTIonS anD acronymS
BID (Banco Interamericano de Desarrollo)
Car (Corporación autónoma regional)
CC (Climate Change)
CCI (Climate Change Indexes)
CCIar (Climate Change Impact and adaptation research)
CepaL (Comisión económica para américa Latina y el Caribe)
CLIVar (Climate Variability and predictability Organization)
CONpeS (Consejo Nacional de política económica y Social)
DaNe (Departamento administrativo Nacional de estadística)
DFID (Department for International Development)
DIMar (Dirección General Marítima)
DNp (Departamento Nacional de planeación)
Dpae (Dirección de prevención y atención de emergencias)
eCLaC (economic Commission for Latin-america and the Caribbean)
eCV (encuesta de Calidad de Vida)
GCCM (Group for Climate Change Mitigation)
GeC (Global environmental Change)
hD (human Development)
IDeaM (Instituto de hidrología, Meteorología y estudios ambientales)
INap (Integrated National adaptation project)
IpCC (International panel on Climate Change)
MaVDt (Ministerio de Medio ambiente, Vivienda y Desarrollo territorial)
MDGs (Millennium Development Goals)
MeN (Ministerio de educacion Nacional)
MeSep (Misión para el empalme de las Cifras de empleo, pobreza y Desigualdad)
NCDC (National Climate Data Centre)
NhS (National household Survey)
NOaa (National Oceanic and atmosphere Organization)
SDa (Secretaría Distrital de ambiente)
SDh (Secretaría Distrital de habitat)
SDIS (Secretaría Distrital de Integración Social)
UNDp (United Nations Development programme)
UNeSCO (United Nations educational, Scientific and Cultural Organization)
UNFCCC (United Nations Framework Convention on Climate Change)

vii
lISTS of fIgUreS, graphS, mapS anD TableS
List of figures
Figure 1: Climate Change: Processes, Characteristics and Threats 8
Figure 2: Climate Impacts of El Niño Phenomenon in Latin America and the Caribbean 10
Figure 3: Changes in Average Annual Temperature in Colombia - (2071-2100 vs. 1961-1990). A2 IPCC Scenario 12
Figure 4: Changes in Total Annual Precipitation in Colombia. A2 IPCC Scenario - (2071-2100) – (1961-1990) * 100 13
Figure 5: Evolution of Six Main Glacier-covered Areas in Colombia 1960s-2000s (different periods) 15
Figure 6 Flood-prone Areas in Colombia to the Effects of Sea-level rise, river-flooding and other Hydro-meteorological Effects 16
Figure 7: Precipitation trends in Boyacá and Cundinamarca (approx.) 1975 - 2008 22
Figure 8: Changing trends according to the base year considered - Selected monitoring stations in the Boyacá and Cundinamarca departments 23
Figure 9: Trends in extreme precipitation in Boyacá and Cundinamarca (approx.) 1975 - 2008 24
Figure 10: Maximum temperature trends in the Boyacá and Cundinamarca departments (mid-seventies - 2008) 26
Figure 11: Minimum temperature trends in the Boyacá and Cundinamarca departments (mid-seventies - 2008) 27
Figure 12: Percentage of population in environmental risk-prone areas in Bogotá (2010) 33
Figure 13: Conceptual model of coupled human-natural systems 40
Figure 14: Vulnerability framework 46
Figure 15: Precipitation and disasters events in Colombian departments classified as group 1 (high vulnerability) 49
Figure 16: Hydrographic Map of the Urban Sector ‘Alto de la Estancia’ - Bogotá 52
Figure 17: Map of the Risk for Landslide in the Urban Sector ‘Alto de la Estancia’ - Bogotá 53
Figure 18: Land Occupation and Use in the Urban Sector of Alto de la Estancia (Bogotá) 53
Figure 19: Localization of Manizales within the Department of Caldas and Colombia 56
Figure 20: Manizales’ expansion towards risk-prone areas 57
Figure 21: Classification of the Area of Manizales according to their Vulnerability 59
Figure 22: Tumaco within its Surrounding Region and within Colombia 60
Figure 23: Areas at Risk from Flooding in Tumaco 61
Figure 24: Timber Industry on Tumaco’s Bay 62
Figure 25: Typical pole houses in Tumaco (top), illegal water connection
(middle) and children playing in polluted waters (bottom) 63

viii
The ImpacT of clImaTe change on Urban SeTTlemenTS In colombIa
List of grAPHs
Graph 1: Number of disasters per natural region 1910 - 2002 18
Graph 2: Number of disasters by decade and type (1910 – 2003) 19
Graph 3: Risk Management Index for 12 Latin American Countries 36
Graph 4: Proportion of households in poverty according to the CLI.
ECV 2008 73
List of mAPs
Map 1: Colombia’s political division 6
List of tAbLes
Table 1: Main expected physical-ecosystem climate change impacts
in Colombia 17
Table 2: Disasters classification 18
Table 3: Temperature trends summary according to the RClimdex in the
Boyacá and Cundinamarca departments 20
Table 4: Main adaptation to climate change projects in Colombia by
geographical location and main activities 31
Table 5: Projected impact on urban areas of changes in extreme
weather and climate events 42
Table 6: Urbanisation trends in Colombia and Bogotá 1973 – 2005 44
Table 7: Events related to climate variability affecting aqueducts in
Colombia 1987-2007 50
Table 8: Projection of No. Of People Affected by Moderate and
Severe Flooding in Cartagena by Area (Locality) 55
Table 9.1: Poverty and Inequality in Colombia 2002-2008 67
Table 9.2: Standards of Living Index 2003-2008 (Urban, Rural and Total) 69
Table. 9.3: CLI factor ‘housing quality’, values and relative variation
2003-2008 71
Table. 9.4: CLI factor ‘access and quality of public services’, values and
relative variation 2003-2008 71
Table. 9.5: CLI factor ‘human capital’, values and relative variation
2003-2008 72
Table. 9.6: CLI factor ‘size and composition of the household’, values and
relative variation 2003-2008 72
Table 9.7: MDG 1. Eradicate extreme poverty and hunger 74
Table 9.8: MDG 2. Achieve universal primary education 75
Table 9.9: MDG 3. Promote gender equality and empower women 75
Table 9.10: MDG 4. Reduce child mortality 76
Table 9.11: MDG 5. Improve maternal health (improve sexual and
reproductive health) 77
Table 9.12: MDG 6. Combat HIV/AIDS, malaria and other diseases 77
Table 9.13: MDG 7. Ensure environmental sustainability 78

1
Chapter 1 InTroDUcTIon
Latin America faces a number of unique challenges in the face of the likely impacts of climate change (CC) and the broader and long-term effects of global environmental change (GEC). The capacity to adapt to short- and long-term changes depends on a complex web of factors that is not reliant only on technical variables but also on ethical values and the political balance of power among actors, which makes the difference between policies oriented to serve the interest of the majority rather than the immediate gain of the few. The specific features of these processes within each region and country are shaped by the local geographies of power and resources across the different dimensions of development. Developing countries are affected to different degrees by the double exposure to economic and environmental crises. In Latin America this specific feature is represented by high insertion in the global economy, high level of urbanisation vs. deep socio-economic inequalities and a number of highly contrasting but extremely marginalised geographies.
If on the one hand the region is well integrated in the global economy and has a growing and innovative middle class, on the other it is highly dependent on natural resources, while pervasive poverty and high inequality remain critical challenges (Eakin and Lemos, 2010). As noted by the Economic Commission for Latin America and the Caribbean (ECLAC), in recent decades “the region has gone through three periods of broad decline in per capita GDP”(ECLAC, 2010:19), in 1995 (Mexican peso crisis), in 1999 (as a result of the Asian crisis) and again in 2001-2002 (international
financial crisis related to the dot.com burst). In 2008, 33% of the population in the region was income-poor, including 12.9% of people living in a condition of extreme income-poverty (ECLAC, op.cit.). These figures indicate that the reduction in absolute poverty recorded since 2002 was both a relative phenomenon and one prone to be severely affected by the next crisis; whereas extreme poverty had significantly worsened, mostly as a consequence of a rise in the price of food staples.
If the food-crisis of 2008 and the financial crisis of 2009 do not necessarily indicate a halt to a broader trend of income-poverty reduction and improvement in the distribution of income recorded in comparison to 2002 (ECLAC, op.cit.) they raise two broad points for reflection. First, the challenge of persistent high levels of income-poverty and highly skewed distribution and, second, the challenge different typologies of recurrent crises leave to the governments of the region regarding their ability to provide stability and protection to the population. Those who are asset and income-poor, often overlapping with women, the elderly and ethnic or minority groups, represent a particular concern that this report highlights with special emphasis as far as Colombia and its urban settlements are concerned.
As Eakin and Lemos (op.cit.) also point out, these figures and trends have to be read from a perspective that considers the two-way combination between the global and local dynamics. Since in Latin America the economies of many countries are heavily dependent on natural resources, they are also greatly affected by price fluctuations and macro-economic

2
The ImpacT of clImaTe change on Urban SeTTlemenTS In colombIa
instability. High levels of income-poverty and inequality interact with the potential impacts of climate change on the economies of the region to provide a double challenge for adaptation, which we have typified above as double-exposure. The challenges represented by unfinished development tasks such as the universal provision of basic services, water and sanitation, food security, access to health and education, critically combine with unequal distribution of the opportunities to benefit from the potential gains of a global economy for a vast number of people.
The distribution of social opportunities and endowments, the reach of institutional capacity and social protection systems are as important as the capacity to build more sustainable cities in the face of crises that mark our time. As Seto and Satterthwaite recently reiterated, “global environmental change will result in significant risks for urban areas and their inhabitants. Many of these risks will exacerbate existing vulnerabilities in urban areas. Urban areas and institutions, especially those in low and middle income countries, often lack the human and financial capital as well as the adaptive capacity to adequately address these challenges.” (Seto and Satterthwaite, 2010: 127).
Colombia is a country that concentrates much of the contrasts that characterise both the specific features of Latin-American countries illustrated above and the critical governance challenges signalled by Seto and Satterthwaite. It also presents great geographical and power asymmetries both in terms of institutional capacity and the severity of the social challenges across its varying typologies of human settlements as well as within them.
The country presents a typology of urban settlements as diverse as Bogotá and Medellín on the one hand or Buenaventura and Tumaco on the other. In the metropolitan areas of Bogotá and Medellín, pressing social inequalities combine with new challenges concerning city-region integration. In the same vein, persisting high levels of spatially
polarised social inequalities coexist with innovative solutions in terms of mass public transport, a tradition of independent mayors and a significant insertion within the global economy.
Adaptation to the impact of climate change necessarily means adaptation at the local level within a specific territory (Agrawal, 2008), and a finer analysis of the differences existing among Latin American, Asian and African urbanisation trends and features is one of the most challenging research tasks ahead.
The IPCC estimates that there is more than a 90 percent probability that the actually recorded changes in the average global temperature over the last century have been primarily the result of human activity (IPCC, 2007a). This already widely accepted finding, pointing to the urgency of better understanding human and natural ecosystem relationships, is not mirrored in the understanding among international organisations, national and local governments and even scholars of the importance of urban settlements in enabling adaptation to climate change.
The impacts of climate change on urban settlements will be the result of a combined effect from GEC-induced transformations at both the global and the local scale, mediated by the degree of exposure and adaptive capacity of each settlement. The literature revised in this report highlights a few key and increasingly recognized issues that help in conceptualizing the impact of climate change on urban settlements. The complex mix of direct climate change, broad GEC and development effects in terms of impacts can hardly be separated one from the other, at least given the actual state-of-the-art of climate change science. The broader phenomenon of GEC that includes and, at the same, time interacts with climate change differs from both disasters and ecological deterioration. GEC has clear climatic implications since it increases the frequency and severity of extreme environmental events and impacts; but is also

3
chapter 1 IntroductIon
occurring on top of long-term ‘secular’ rises in sea level and atmospheric CO2 concentration; besides being related to slow-onset, long-lasting changes. These three baseline concepts are helpful in providing a platform for the conceptualisation of the impacts of climate change on urban settlements but do not make the task of operationalising the measurement less complex. Science modeling and sources of evidence remain highly fragmented. Climate modeling still faces the task of managing to downscale its scenarios so as to allow urban planners and social scientists to analyse the potential impacts using units of analysis that could be observed at the same geographical scale from an interdisciplinary perspective.
The combined effect of GEC, climate change and development cannot be easily disentangled on the ground even when sufficiently robust datasets exist to undertake quasi-experimental studies. Human-natural urban ecology approaches are still in their infancy. Although a promising field for interdisciplinary research and science-policy exchange, they have not yet produced multi-scale, multi-task analytical tools easily appropriated by a broader scientific and, even more, policy-making community. Keeping in mind the need to mainstream greater attention to urban diversity across regions within adaptation to climate change studies, it is undeniable that a large number of urban areas in developing countries do not count on the institutional capacity to monitor even the most basic natural, demographic and socio-economic variables.
The net effect is that scholars dedicated to the analysis of the impacts of climate change on urban settlements have been faced with significant dilemmas that have resulted in the following outputs. First, a renewed effort to foster interdisciplinary research, as well as greater attention from social scientists and urban planners/administrators to the findings coming from the natural science community. Climate change impact and adaptation research (CCIAR) is increasingly based on assessing the
threats, exposure and scenarios of cities, their infrastructure and, more broadly, the built environment. The second pillar of CCIAR is the analysis of land-use changes as well as of the exposure, vulnerability and resilience of the several sub-systems comprising the city. Third, since much of the foreseen impacts of climate change on urban areas closely overlap with the impacts and consequences of “unfinished development business”, scholars have concentrated in analysing macro-and meso-level indicators such as those depicting demographic, health, education, income and multi-dimensional poverty trends, as well as assessing the institutional and city-level capacity to adapt, combining a variety of conceptual and methodological approaches. Fourth, since adaptation takes place at the local level and given that communities were already adapting to climate variability even before climate change was an issue on the international agenda, many scholars have concentrated on community-based and participative analysis.
This report values these four contributions as a whole and takes inspiration from and advantage of all of them according to the limitations of information and data availability on urban settlements in Colombia.
Due to its geographical location in the so-called Pacific fire belt and the Andean region, Colombia is highly exposed both to the risk of earthquakes and volcanic activity as much as to the effect of intense meteorological and hydrological activities. Socio-economic factors contribute to the fact that the country is not only made up of a collection of fragile ecosystems but is also a territory extremely exposed to the likely impacts of climate change. Rapid population growth and urbanization have played a major role in shaping the high exposure of the country to the risks created and magnified by climate change. Colombia’s population increased fourfold over the last 50 years, with the magnitude of the urbanization process now reflected in the fact that 3 out of 4 inhabitants live in cities.

4
The ImpacT of clImaTe change on Urban SeTTlemenTS In colombIa
Ecosystem degradation, indiscriminate forest depletion and patterns of land use that have not complied with national and local regulations are but one of the main critical factors determining both the context for adaptation to climate change as much as a persistent factor in migration to cities from rural areas. The other major factors are internal displacement due to the armed conflict and economic migration.
Colombia has not yet included adaptation to climate change within its national policies. There is no national policy that systematically deals with a risk management framework related to the issue and urban institutions have only began to analyse threats and scenarios without having yet embedded the issues of climate change, the impacts of climate variability on urban life and the required changes in terms of public policy. These would most possibly demand a greater capacity to integrate policies for low-income settlements, place the issues of equality, and of socio-economic, cultural and environmental rights at the centre of the debate for a new policy and a renewed ability to gather better and more insightful data regards of urban dynamics vs the direct and indirect effects of environmental change.
Since the majority of the population lives in the highlands and over the Caribbean coast, where water scarcity, environmental disasters and the environmental transformation of the ecosystems are already pressing issues, Colombia’s urban system is an interesting case for other countries due to the fact that similar problems manifest themselves across very diverse human and physical geographies. This combination has significant impacts on food security and human health, and is a good approximation of the types of challenges urban settlements and their local administrations will have to likely face in the next future. Urban settlements along the coasts are home to approximately 30% of the population but high density and critical socio-economic
problems often expose them to the impacts of sea level rise, water scarcity and ecosystem transformation with a concomitant impact on human life and, particularly, on the sustainability of the livelihoods of the urban poor.
Chapter 1 focuses on climate change scenarios and trends for the Latin American region and specifies the likely implications for Colombia, with emphasis on those transformations that will have greater relevance for urban settlements. Among them are included the transformation of ecosystem conditions and their implications for socio-economic life and for the sustainability of the livelihoods of the less endowed in terms of assets and adaptive capacity to cope with change and stress.
The overarching focus of chapters 2, 3 and 4 remains adaptation by the poor and for the poor, who are the least represented and who, also in Colombia, pay a heavy toll to the lack of a more organic and effective urban policy. This is often either considered of a second order in comparison to mainstream economic policy or poorly implemented due to the lack of institutional capacity, channels for the effective participation into the decision process for communities and civil society organisations as well as finance at the local level.
Chapter 2 presents a review of the institutions and policy interventions for adaptation. It regards adaptation to climate change as a dynamic social process driven by the underlying vulnerability of populations to the impacts of climate change. Through analysis of other key factors that affect future impacts related to climate change such as migration, land-use planning implementation and institutional capacity, it provides an applied framework for the understanding of the role played by the interaction between institutional and social actors, thus providing new meaning to socio-economic and impact-related indicators at the local level.

5
chapter 1 IntroductIon
Chapter 3 analyses the urban transformation of Colombia stressing those factors that generate pressure on urban environments and low-income mostly peri-urban settlements. It analyses the historical trends Colombian cities have followed in terms of public services and infrastructure provision, where clear differences emerge between the capital city of Bogotá, other major urban agglomerations such as Medellín, Cali and Barranquilla and more recently, Armenia, Cartagena, Manizales Pasto and Popayan. It reviews the main trends in socio-economic, demographic and other relevant indicators of Colombian cities. It reviews how demographic, economic, migration and conflict-related factors among others will likely represent pressures that will interact with the impact of climate-related trends.
Chapter 4 presents an analysis of national indicators related to income poverty and distribution; the condition of life index, a multi-dimensional measurement periodically carried out in Colombia since 1997; and the indicators related to the Millennium Development Goals (MDGs). The chapter presents urban specific indicators when available.
1.1 Climate Change: Current and future trends in Colombia
This chapter situates Colombia within global climate change scenarios and reviews the regional scenarios for a changing climate. In its second part, it analyses national scenarios and trends, such as the El Niño southern oscillation, as well as changing temperature, precipitation, sea level rising and ice-melting patterns. The relationships between likely climate change impacts and disasters is also analysed for the relevance it has for urban settlements and low-income groups. The final section of the chapter presents two case studies from the
departments of Boyacá and Cundinamarca illustrating, on the basis of IDEAM data from 2009, the potential for more refined modelling as a scientific basis to analyse likely impacts for urban settlements.
1.1.1 geography and Climate
Colombia is the fourth largest country of South America, its area is 207.040.800 hectares and it is the only one with Caribbean and Pacific Coasts. As divided by IDEAM, on whose work this section largely draws, the territory is made up of five geographical regions: Amazonia, Andean, Caribbean, Orinoquia and Pacific, besides its Pacific and Atlantic islands among which the San Andrés and Old Providence are the biggest (IDEAM, 2010). As in tropical countries, temperatures tend to vary with height and most parts of the country tend to have a temperature ranging between 24° C and 28° C. This is the case for the Caribbean plains and the strip of the Pacific Coast bordered by the Western range of the Cordillera. Temperatures that average over 28° C are found in the lower, middle and some parts of the upper Magdalena valley. In a much smaller area, including Andean and Interandean zones a variety of thermal floors is found due to the wider variation of the air temperature at high altitudes. The snow line begins above 4.600 m above sea level with temperatures below 0°C, and is also the smallest among the different climatic typologies in Colombia as far as the extension of land is concerned.

6
The ImpacT of clImaTe change on Urban SeTTlemenTS In colombIa
Map 1: colombia’s political division
Source: University of Texas

7
chapter 1 IntroductIon
1.2 global scenariosThe most recent international assessment of
climate change established that warming of the global atmosphere was now unequivocal, with atmospheric carbon dioxide concentrations already at levels predicted to lead to global warming of between 2 and 2.4 degrees (IPCC, 2007) 1. Scientific updates since 2007 state that the risks are likely to be larger than previously assumed, with some climate indicators at the upper end of the ranges predicted by the IPCC in 1990 (Climate Change Congress, 2009). This applies in particular to sea-level rise this century, which is changing at greater rates than IPCC predictions, and the risks from increases in extreme weather events, which cause some of the most damaging effects of climate change (ibid; Fussel, 2008). Figure 1 is telling as regards the kind of mainstream conceptualization about the relationship between urbanization and the main climate change processes according to the scientific community. Urbanization is thought of as an important but still somehow peripheral process, mostly connected with the greenhouse effect through changes in land use. Little attention is paid in the models to two important aspects. First, the fact human processes of material and cultural production have socio-economic and institutional components, meaning that they should not be compared to natural processes. Second, cities are not only physical places, that is, those where urbanization has historically developed. They also are major loci for the production of increasingly serious inequalities and, at the same time, for unprecedented forms of collaboration and co-operative action.
1 2° degrees is considered in international assessments as the threshold beyond which human and ecological systems would face serious risks – although recent analysis emphasises that even with temperature increases of less, the impacts can be significant (Climate Congress 2009).
Global climate models - the scientific tools that provide scenarios for possible future changes - tend to operate at too broad a resolution to capture the interactions with urban climates (Sanderson, 2009). In addition, what is distinct in reference to studying climate in relation to urban areas is the mediating effect of the “urban heat island” – or heat storage in the built environment which raises air temperatures above those of surrounding rural areas (ibid.). This drives an independent modification to the urban climate, but one that is also sensitive to weather and climate in the surrounding environment (ibid.).

8
The ImpacT of clImaTe change on Urban SeTTlemenTS In colombIa
FIG
Ure
1:
clim
ate
ch
ang
e: p
roce
sses
, ch
arac
teri
stic
s an
d T
hre
ats
Sour
ce: U
NFC
C (2
007)
Chan
ge i
n Pa
rtic
ipat
ion
ice
cap
mel
ting
Aver
age
tem
pera
ture
ris
e‘G
loba
l war
min
g‘
Abr
upt
clim
ate
chan
ge
sea
leve
l ri
se
Land
use
cha
nges Agr
icul
ture
indu
stry
Hea
ting
tran
spor
t
urb
aniz
atio
n
Def
ores
tati
on
Carb
on c
ycle
di
stur
banc
es
Co2
CH4
N2o
Dis
ease
s sp
read
Casu
alti
es
fam
ines
econ
omic
lo
sses
biod
iver
sity
lo
sses
Loss
of
trad
itio
nal
lifes
tyle
s
Dis
aste
rs
Drou
ghts
Hood
sCy
clon
es
Heat
w
aves
Euro
pe
cool
ing
(enh
ance
d)g
reen
hous
e ef
fect
Clou
ds
Incr
ease
in
impe
rmea
ble
surfa
ce
gre
enh
ou
se
gas
em
issi
on
s
gu
lf s
trea
m
mo
difi
cati
on
s
Hu
man
act
ivit
ies
maj
or
thre
ats
mai
n c
limat
e ch
arac
teri
stic
s
Clim
ate
chan
ge
pro
cess
es
fore
st fu
el
burn
ing
Salin
ity
oce
an
circ
ulat
ion
uphe
aval
Wat
er
tem
pera
ture

9
chapter 1 IntroductIon
1.3 Climate Changes in the Latin-American region
As figure 2 illustrates, Latin America is already affected by climate change (Magrin et al., 2007). According to the regional projections of the IPCC (Christensen et al., 2007), South America is characterised by two complementary trends. In the northern part, near the Caribbean, the annual mean precipitation is projected to decrease, as for vast sub-areas of Brazil, Chile and Patagonia. On the contrary in the area comprising Colombia, Ecuador and Peru annual mean precipitation is projected to increase. Models seem also to suggest that as the Amazonia gets dryer the potential acceleration of the anthropogenic global warming increases too.
While the climatic and geographic heterogeneity of the region means that future climate scenarios are necessarily diverse, of particular importance to the regional climate taken as a whole are any variations in El Niño2 events, along with changes in temperature and rainfall, and sea level rise (DFID, 2004; Magrin et al., 2007). The El Niño oscillation is the largest driver of climate variability in the region, and the natural phenomenon with the largest socio-economic impact (Magrin et al., op. cit., 2007). Temperatures in the region rose around 1 degree in the last century, sea level has been rising at a rate of 2-3mm per year since the 1980s and both increases and declines in precipitation patterns have been observed in different parts of the region (World Bank 2009). Extreme weather events have become more common in some parts of the region (ibid.). The overall estimates of the IPCC point towards more intense wet days per year over large parts of south-eastern South America, scarcer precipitation in northern South America, but again wetter
2 The periodic, above-average warming of the Pacific which affects coastal waters of Northern Peru, Ecuador and Southern Colombia. This variability is likely to enhance any climate-change related alterations in extremes, although the exact influence of global climate change on the variability of the oscillation remains under investigation (UK Met Office, pers comm.)
seasons along the coast, as is also the case for Colombia. Projections for the region indicate temperature increases of around 1.5 - 2 degrees above current temperatures post 2050 (CEPAL, 2009). The World Bank highlights four impacts as of particular concern for the region: the disabling of mountain ecosystems in the Andes, the bleaching and collapse of coral reefs in the Caribbean basin, damage to coastal systems in the Gulf of Mexico and the risk of forest dieback in the Amazon basin (World Bank 2009).
Despite the fact that Latin America is a predominantly urbanised region (Winchester, 2009), there is as yet n o comprehensive synthesis of the scenarios and possible impacts of climate change in urban areas. However, with the exact manifestation depending on their location and geography, urban settlements will feel the impacts of the above changes. These include flooding and damages in relation to increases in extreme weather events, precipitation intensity and sea-level rise; threats to the availability of freshwater from sea-level rise in coastal cities and glacier retreat and the loss of wetlands in the Andes; the increased likelihood of water- and vector-borne diseases as well as the negative health impacts of heightened temperatures compounding the ‘urban heat island’ effect (Romero-Lankao, 2008a). The impacts are both direct and indirect in the sense that some effects are produced directly (e.g. flooding) while others are transmitted by intervening variables (e.g. disease through various vectors). Some are produced within the city itself, whereas others are produced in non-urban areas but have secondary effects on towns and cities, for example, decreased food availability and higher food prices, rural to urban migration and the availability of water and other natural resources (Lankao 2008).

10
The ImpacT of clImaTe change on Urban SeTTlemenTS In colombIa
FIGUre 2: climate Impacts of el niño phenomenon in latin america and the caribbean
Source: IPCC 2001, FAO 2002, UNEP 2003

11
chapter 1 IntroductIon
1.4 National Climate scenarios and trends
IDEAM, Colombia’s Meteorological Office3, has undertaken a range of modelling exercises to produce projections for Colombia, as well as analysis of historical climate data and trends. The most recent temperature and precipitation modelling exercises for Colombia highlight:
1.4.1 temperature Changes
The most marked projected elevations in temperature for 2080-2099 occur in the high zones of the central and eastern Andean ranges, with marked increases also in the south of Antioquia and the Northwest of Caldas (Ruiz Murcia 2007) 4. A different modelling scenario revealed possible temperature changes of 2-4 degrees in average air temperature in nearly all regions of the country for 2070-2080 (MAVDT 2007) 5, a trend confirmed by the most recent modelling exercise carried out by IDEAM comparing temperature for the period 2071-2100 to those recorded across the 1961-1990 period (figure 3).
3 Instituto de Hidrología, Meteorología y Estudios Ambientales.4 The study used the Japanese Earth Simulator Model, which
uses the assumptions of the IPCC’s A1B Scenario (i.e. a global scenario that assumes rapid economic growth, slow down in population growth from mid-century, a rapid introduction of new and efficient technologies and a balanced fossil-based and non-fossil fuel based energy mix).
5 Using a PRECIS model, adjusted for precipitation trends, which used the IPCC A2 scenario (A more conservative scenario in which economic growth and technology take-up are more fragmented and localised, with continuous population growth) for the period 2070-2080 compared with 1961-1970.
1.4.2 Precipitation Changes
Precipitation scenarios alter depending on the region of the country. Increases in rain could reach in the order 80mm every 10 years in the west of Nariño, over 30mm towards Vichada and the centre-west of Meta and approximately 10mm every 10 years in the central coastal region, Urabá Gulf, west of Antioquia, Arauca, the west of Casanare and significant parts of Amazonia (Ruiz Murcia 2007). The second modelling exercise projected drastic decreases in precipitation (of over 50%) in the regions of the west-central Caribbean coast, the North-Eastern Sierra Nevada and Guajira peninsula as well as the high Magdalena; and increases in the north of the Pacific region and Urabá as well as the foothills of the Llanos plains (MAVDT 2007). As for the analysis of national precipitation trends, this is also confirmed by the most recent exercise carried out by IDEAM (figure 4). On the most negative projection of global CO2 concentrations, precipitation would decrease across all areas of Colombia territory (ibid.).

12
The ImpacT of clImaTe change on Urban SeTTlemenTS In colombIa
FIGUre 3: changes in average annual Temperature in colombia - (2071-2100 vs. 1961-1990). a2 IpCC Scenario
Source: IDEAM (2009)

13
chapter 1 IntroductIon
FIGUre 4: changes in Total annual precipitation in colombia. a2 Ipcc Scenario - (2071-2100) – (1961-1990) * 100
Source: MAVDT, IDEAM & PNUD (2007)

14
The ImpacT of clImaTe change on Urban SeTTlemenTS In colombIa
Historical analysis from meteorological stations across the country from 1970 to 2008 confirmed a tendency towards increased daily maximum and minimum temperatures, and increases in total annual precipitation, with the exception of the South-West regions, including Bogota (see section 1.5.1). These exercises, however, highlight changes in typical climate patterns on a few variables. Climate variability and extremes, among other variables, may actually be more important to the livelihoods of people who are affected, and for adaptation decision-making (Burton et al., 2002).
The El Niño-Southern Oscillation, made up of the two phases of El Niño and La Niña, exerts the most important influence on inter-annual variations in climate in Colombia (Poveda, 2004). This pre-existing variability could alter with climate change, but will also interact with, and possibly amplify, climate-change induced variability (IDEAM, op.cit., 2001). The El Niño phase originates with the surface warming and increased level of Pacific coastal waters, but it has a generalised impact on the entire country (IDEAM, 2002). Average air temperatures across most of the country rise to 1 and 2 degrees above normal for the duration of El Niño (ibid.). The other principal effect is to periodically augment inter-annual variations in precipitation, although the net effect varies by region, with overall deficits in precipitation in the Andes, Caribbean and Orinoquia and surpluses in the southern Pacific region, the eastern slopes of the eastern Andes and some parts of Amazonas (ibid.). The La Niña phase is marked by a cooling of sea surface temperatures, and increases in precipitation and humidity, principally in the Caribbean and Andean regions (Sanchez 2001).
1.4.3 ice Cap melting
According to UNDP, accelerated ice cap melting will imply a major threat to the availability of water for the urban populations, agriculture and productive activities, with harsher impacts in the Andean region (UNDP, 2008). Páramos and glaciers will be heavily affected by a change in annual average temperature between 1°C and 2°C. If that were to become a reality by 2050 Colombia would lose 78% of its glaciers and 56% of its páramos (IDEAM, op.cit., 2001). Colombian glaciers are not only fragile but also extremely precious ecosystems since only three areas with perennial snows exist above the equator in the tropics. Over the last century Colombia has lost eight of its glaciers and since 1850 the country lost 80% of its total coverage. The ice cap’s lower limit is nowadays estimated at 4.700 – 4.800 mts. above sea level. Figure 5 illustrates the rapid pace at which Colombia is losing these precious ecosystems, with annual losses ranging between 3% and 5% of its total ice caps and a receding breath in the order of 20 to 25 meters per year. From 55.4 Km2 in 2002/2003, the country now has only 47.1 Km2 left (IDEAM, op.cit., 2010)

15
chapter 1 IntroductIon
1.4.4 sea-Level rise
Analysis for the country’s first official communication to the UNFCCC also highlighted the possible effect of global sea-level rise on Colombia’s coastal areas, with average increases in levels of 40 to 60cm by 2050-2060 (IDEAM 2001) 6. The 2nd National Communication on Climate Change stresses that the country has been losing land all across its coasts and regardless of the typology of marine ecosystems (IDEAM, op.cit., 2010). According to this very recent report, sea-level rise varies depending on the measuring station. In the north of the country, the oceanographic station of Cartagena reports of a rise in the magnitude of 3.5mm per year over the last 40 years. Further north-west bound, near Panamá, the station of Puerto Cristóbal recorded over a similar period a rise of 2.2mm per year, while moving south along the Pacific Coast the station located in Buenaventura also recorded a 2.2mm rise. Table 1 below, drawing on a 2007 official report from the Ministry of Environment, Housing and Territorial Development (MAVDT), summarises the main expected physical-ecosystem impacts of the above climatic changes. Table 1 below, drawing
6 Using the global benchmark of a 1 metre rise, the standard recommended by the IPCC for international comparison.
on a 2007 official report from the Ministry of Environment, Housing and Territorial Development (MAVDT), summarises the main expected physical-ecosystem impacts of the above climatic changes (see figure 6, which presents an overview of exposure to floods for increased precipitation and sea-level rise realized by IDEAM in 2011)
FIGUre 5: evolution of Six main glacier-covered areas in colombia 1960s-2000s (different periods)
1950 1960 1970 1980 1990 2000 2010
40
35
30
25
20
15
10
5
0
1 Sierra Nevada de El Cocuy
1
3
Area
(km
2)
4
5
2
6
4 Volcan-Nevado del Hula
Year
2 Sierra Nevada de Santa Maria
5 Volcan-Nevado Santa Isabel 3 Volcan-Nevado del Ruz 3 Volcan-Nevado del Toima
Source: IDEAM (2010)

16
The ImpacT of clImaTe change on Urban SeTTlemenTS In colombIa
FIGUre 6: flood-prone areas in colombia to the effects of Sea-level rise, river-flooding and other hydro-meteorological effects
Source: IDEAM (2011)

17
Chapter 2 POLICIES AND INSTITUTIONS FOR ADAPTATION
TO CLIMATE CHANGE IN URBAN COLOMBIA
system Physical – ecosystem impact
Coastal and insular Areas Flooding and erosion due to sea-level rise; possible impact of cyclones.
Water resources On a doubling of CO2 in the earth’s atmosphere, 50% of the national territory would be in a highly or very highly vulnerable situation. Projected run-off scenarios vary by region, with possible decreases in the South of the Andes, the departments of La Guajira and Nariño and increases in Amazonas, Orinoquía, the North of the Andean and Pacific regions and the rest of the Caribbean region. 7
ecosystems Negative impacts on high mountain ecosystems: on 2001 temperature and precipitation scenarios up to 56% of highland moorlands (paramos) could disappear by 2050 and Colombia’s glaciers could completely disappear within the next 100 years. Changes in vegetation according to shifting temperature, rain and humidity patterns.
Agriculture Reduction in areas amenable to cultivation; erosion, salinisation, compacted soil and the loss of organic material causing degradation.
Desertification Increased drought could lead to a 75% increase in desertified areas.
Increase in desertified areas.
Health An increase in areas exposed to malaria and dengue, as well as other diseases such as tuberculosis whose organisms are responsive to changes in temperature, humidity and precipitation.
Source: adapted from MAVDT (2007)
7 The Magdalena river basin – which produces more than 95% of the water used for production and domestic activity in the country – could suffer 55% losses in mean flow (IDEAM 2001; Magrin 2007).
taBLe 1: main expected physical-ecosystem climate change impacts in colombia

18
The ImpacT of clImaTe change on Urban SeTTlemenTS In colombIa
Graph 1: number of disasters per natural region 1910 - 2002
1.4.5 Natural Disasters8
According to the database DesInventar, between 1910 and 2002 14,595 disasters occurred in Colombia, including both low and high magnitude events. If the toll count includes the 1,960 technological disasters a total of 16,555 events in roughly 90 years of history, corresponding to 183 events per year (Lampis, 2010a).
Colombia experiences one of the highest rates of occurrence of natural disasters in Latin America, most of which are related to floods and landslides (Sánchaz-Traian et al. 2007). Data on extensive disasters in the country – or events whose impacts are too small to be classified as a major disaster, but nevertheless cause premature death and injury and impoverishment – shows strong links between these events and hydrometeorological phenomena (Corporación OSSO, 2008) 9. Graph 1 illustrates the geographical distribution of disasters. The Andean region, also the most densely populated and urbanized is the one where the number of disasters is the highest, followed by the Western and Caribbean regions, both also densely populated and urbanised. The occurrence of extensive disasters fluctuates according to annual rainfall patterns. The El Niño-Southern oscillation therefore also exerts a strong influence on the occurrence of floods and landslides, especially in the mountainous regions (ibid.).
Disasters can be classified as in table 2 according to their origin. However, a classification according to the type of impact or magnitude (low – high) will also be very useful from an analytical point of view to analyse the relationship between disasters, climate change, urban settlements and low-income groups throughout this report. In fact, many often
8 This report adopts the term ‘natural disasters’ on the grounds of broader comparability with international literature. Disasters though are never natural despite the fact that they are related to natural forces and drivers, but always the product of human interaction with these forces and socially-determined drivers altering their natural course.
9 Avalanches, floods, landslides, hailstorms, frosts, hurricanes, rains, sea surges, mists, snow, heatwaves, droughts, storms, electric storms, tornados and strong winds.
unaccounted events of small magnitude or low impact, according for instance to the number of deaths or injuries as well as the financial impact tend to go unnoticed. However, not only are these types of events very likely to occur in urban areas of developing countries but, looked at over relatively long periods of time (one year, ten years, more than one decade), they become increasingly relevant to the capacity of low-income groups to cope with and eventually to adapt to a number of changing situations related to livelihood insecurity and fragility.
geodynamic (internal)
Earthquakes, volcanic eruptions, tsunamis and liquation
geodynamic (external)
Landslides, mudslides flash floods
Hydrologic Floods, tides, draughts and sedimentation
Atmospheric Hurricanes, forest fires, haze, frosts, rain, storms, electric storms, tornados, heat waves
technologic Accidents, poisoning, escapes, structural damage, explosions, fires, intoxications and mass panic phenomena
environmental Biological events, epidemics and plagues
Source: BID (2003)
taBLe 2: Disasters classification
9000
8000
7000
6000
5000
4000
3000
2000
1000
0Andean Region
WesternRegion
Caribbean Region
Orinoquia Amazonia
Source: Lampis (2010a:18) based on data from DesInventar (2003)

19
chapter 1 IntroductIon
Although these events are not modelled under climate change scenarios, analysis of historical trends is used to indicate possible changes in their frequency and intensity. Graph 2 below shows that most disasters have occurred in the last 30 years. The association of particular types of disaster with climatic events is a strong feature in the history of disasters in Colombia over the same period.
Due to one of its main effects, the intensification of extreme meteorological events, climate change is likely to exacerbate this pattern. Hydrologic events count for 45% of the total events over the last 30 years, geodynamic of the external type 25%, atmospheric 13%, technologic 9%, geodynamic of the internal type 4% and environmental 3% (Lampis, op.cit., 2010a).
1.5 recent Climate Change findings: the Cases of boyacá and Cundinamarca
After the A4R publication in 2007 Colombia devoted considerable energy to improve the modelling of climate change scenarios. Over the past two years this effort has produced improved temperature and precipitation projections. This improvement consisted of the modelling of changes over a longer period of time, up to 2071-2100 (as shown in figures 3 and 4), as well as more detailed data regarding likely small scale regional scenarios. For its second national communication to the UNFCCC, Colombia has been improving its data to provide specific regional information about climate change. According to the available data, this section presents recent climate variability findings for the departments of Boyacá and Cundinamarca, which are potentially relevant for the study of climate change.
Table 3 presents the summary of the evaluation made by IDEAM of overall changes in precipitation and temperature between the mid-seventies and 2008 (Mayorga, Hurtado and Benavides, 2009). IDEAM ran a programme initially created by Byron Gleason of the National Climate Data Centre (NCDC) at National Oceanic and Atmosphere Administration (NOAA) of
Graph 2: number of disasters by decade and type (1910 – 2003)
Source: Lampis (2010a: 16), on the basis of data from DesInventar (2003)

20
The ImpacT of clImaTe change on Urban SeTTlemenTS In colombIa
STATION MUNICIPALITY HEIGHT TOTAL YEARLY PERCIPITATION
INTENSE PRECIPITATION
MAXIMUM TEMP MINIMUM TEMP
TUNEBIA CUBARA 370 + - + +
EL CARDON SOCOTA 3590 - - + -
TUNGUAVITA PAIPA 2470 + + + ?
APTO LLERAS SOGAMOSO 2500 + +
VILLA DE LEYVA VILLA DE LEIVA 2215 + + + -
EL TUNEL CUITIVA 3000 + + + -
UPTC TUNJA 2690 + ? + +
VILLA CARMEN SAMACA 2600 - + + -
RONDON RONDON 2120 + -
EL VIVERO MIRAFLORES 1640 + + + -
CHISCAS CHISCAS 2350 + + - ?
SIERRA NEVADA GUICAN 3716 - - + -
BOAVITA BOAVITA 2150 - +
CUSAGUI LA UVITA 2950 - - + +
CHITA CHITA 2888 + - + -
SATIVANORTE SATIVANORTE 2594 - - + ?
BELENCITO NOBSA 2530 + +
NUEVO COLON NUEVO COLON 2438 + - + -
MACANAL MACANAL 1300 + + - +
SUTATENZA SUTATENZA 1930 + + + +
SURBATÁ DUITAMA 2485 - - - -
ISLA SANTUARIO FUQUENE 2580 + + - +
LA CABRERA PACHO 2000 - + + +
SILOS CHOCONTA 2709 - - + -
GJA SAN JORGE SOACHA 2900 - - - +
GACHETA GACHETA 1752 + + + -
GUASCA GUASCA 2750 - - + -
GJA PROVIDENCIA TENJO 2560 + + + +
TIBAITATÁ MOSQUERA 2543 + + + +
PASCA PASCA 2256 + + + -
ELDORADO BOGOTÁ 2547 - + + +
the United States Department of Commerce. The programme RClimdex processes 27 basic indices recommended by the Climate Change Indices and the Climate Variability and Predictability Organisation (CCl/CLIVAR). One of the main goals of the programme is to construct indices of extreme climate variability
to be employed in the study and monitoring of climate change. The most relevant change is represented by changes in the maximum temperature in a large number of monitoring stations. The next section 1.5.1 presents a more detailed review of the main findings according to IDEAM.
taBLe 3: Temperature trends summary according to the rclimdex in the boyacá and cundinamarca departments
Source: IDEAM (2010)NOTE: 1) Symbol (+) means a positive trend, that is, an overall increase over time and (-) a negative trend or decrease.2) Shadowed cells indicate that the majority of the indicators of the corresponding grouping have high statistical significance. 3) When a cell contains a (?) this indicates that the upward or downward direction of change is unclear. Source: IDEAM (Unpublished data).

21
chapter 1 IntroductIon
1.5.1 trends in Precipitation in the Departments of boyacá and Cundinamarca
Figure 7 illustrates that there are three different typologies according to changing precipitation patterns:
1. In light blue the areas where precipitation has increased. They correspond to the slopes of the eastern range of the Andean cordillera (specifically the low-altitude part of the mountain range of Cundinamarca and the south of Boyacá), as well as the western part of Cundinamarca and Boyacá in its limits with the Santander department.
2. In yellow and orange the areas where precipitation has decreased. These are located in the north of the Boyacá department. In addition, the highland area called Altiplano Cundiboyacense (including Bogotá in Cundinamarca and the municipalities of Duitama, Samacá and Sativanorte in Boyacá) presents the
same trend toward a significant decrease of total annual precipitation. Some monitoring stations have different base years on the basis of which the relative data series are calculated by IDEAM. Therefore, the interpretation of specific municipal features in this second group, although generally marked by a negative trend, has to be undertaken with care, as shown in figure 8 that compares the overall slope (continuous line) of the trend with the varying average (dotted line). Two very dry areas are highlighted in red within this area in the same map 2.
3. A third zone presents mixed evidence and very slight changes when comparing 2008 with the mid-seventies. This is indicated with white coloured areas and is located mostly at the centre of map 2, with two relatively large sub-regions, one in the south of the Boyacá department and the other in the north of Cundinamarca.

22
The ImpacT of clImaTe change on Urban SeTTlemenTS In colombIa
FIGUre 7: precipitation trends in boyacá and cundinamarca (approx.) 1975 - 2008
Source: IDEAM 2010(Unpublished data)

23
chapter 1 IntroductIon
1.5.2 extreme Precipitation trends in the Departments of boyacá and Cundinamarca
Figure 9 illustrates that the behaviour of high intensity precipitation (storms and heavy rainfalls) presents a similar trend to that of total annual precipitation. That is, the majority of the monitoring stations presenting an upward
trend (light blue dots), especially in large sub-regions of the Altiplano Cundiboyacense. In some high mountain areas a reverse trend was found by IDEAM (red dots), especially in the municipalities of Soacha, Guasca, Chocontá in Cundinamarca, and in those of Socotá, Chita, La Uvita and Guicán in Boyacá.
FIGUre 8: changing trends according to the base year considered - Selected monitoring stations in the boyacá and cundinamarca departments
a. Total precipitation in the El Eldorado airport (Bogotá) - Cundinamarca
c. Total precipitation in Villa Cármen (Samacá) - Boyacá
b. Total precipitation in Surbatá Bonza (Duitama) - Boyacá
d. Total precipitation in Sativanorte (Sativanorte) - Boyacá
Source: IDEAM (2010)

24
The ImpacT of clImaTe change on Urban SeTTlemenTS In colombIa
FIGUre 9: Trends in extreme precipitation in boyacá and cundinamarca (approx.) 1975 - 2008
Source: IDEAM (2010)

25
chapter 1 IntroductIon
1.5.3 trends in maximum and minimum temperatures
This section presents the evaluation of trends in maximum and minimum temperature changes for the departments of Boyacá and Cundinamarca according to data from IDEAM. In both cases, results seem to confirm the already existing large scale evidence of climate change but at a much more reduced scale, which has important scientific and policy implications for the adaptation of urban settlements in Colombia. In fact, these findings provide the beginnings of a badly missed piece of evidence which could bridge existing gaps between the academic and policy-making communities, reducing uncertainty and political viability for adaptation-oriented actions.
i. Trends in Maximum Temperature ChangeAs shown by figure 10 (red dots) there is
a trend towards the increase in maximum temperatures across the two departments, meaning days are hotter. As often happens with climate change trends, sub-regional variability is quite considerable even within broader trends towards the increase or decrease in both temperature and precipitation. Indeed, even in the relatively limited regions corresponding to the two departments of Boyacá and Cundinamarca, the municipalities of Chiscas, Macanal and Fúquene show statistically significant indicators illustrating that their maximum temperatures followed a downward trend over the same period of time. The municipalities that present the most robust and statistically significant indicators of an increasing trend in maximum temperature are Socotá, Paipa, Sogamoso, Villa de Leiva, Tunja, Chita, Sativanorte, Nuevo Colón, Sutatenza, Pacho, Chocontá, Tenjo, Mosquera and Pasca.
ii. Trends in Minimum Temperature ChangeTrends in minimum temperature change
point to different behaviours:
a) In the highland plain of Bogotá (municipalities of Mosquera, Tenjo and Bogotá), there is a trend towards an increase of the minimum daily temperature, implying a decrease in morning frosts and a positive effect for local cultivations (red dots in figure 11).
b) In the municipalities above 2.700 metres above sea level (Guicán, Chita, Chocontá and Gusca), that belong to the high mountain forest and páramo ecosystems a decrease in the minimum temperature is the dominant trend (blue dots in figure 11).

26
The ImpacT of clImaTe change on Urban SeTTlemenTS In colombIa
FIGUre 10: maximum temperature trends in the boyacá and cundinamarca departments (mid-seventies - 2008)
Source: IDEAM (2010)

27
chapter 1 IntroductIon
FIGUre 11: minimum temperature trends in the boyacá and cundinamarca departments (mid-seventies - 2008)
Source: IDEAM (2010)

28
The ImpacT of clImaTe change on Urban SeTTlemenTS In colombIa
Colombia has not yet included adaptation to climate change within its national policies. There is no national policy that systematically deals with a risk management framework related to the issue and urban institutions have only began to analyse threats and scenarios without having yet embedded the issues of climate change, the impacts of climate variability on urban life and the required changes in terms of public policy. These would most possibly demand a greater capacity to integrate policies for low-income settlements, place the issues of equality, and of socio-economic, cultural and environmental rights at the centre of the debate for a new policy and a renewed ability to gather better and more insightful data regards of urban dynamics vs the direct and indirect effects of environmental change.
2.1 Adaptation to Climate Change
This chapter seeks to shed light on dimensions of urban adaptation policy so far neglected in Colombia: the institutional and the social (Cardona Alzate, 2009; Lampis 2010). It examines a broad range of policy interventions, in recognition of the fact that adaptation to climate change is a dynamic social process that is driven by the underlying vulnerability of populations to the impacts of climate change. Narrow definitions of adaptation interpret adaptation as actions undertaken simply in response to anthropogenically-caused climate change, and tend to advocate adaptation interventions as ‘stand-alone’ actions (Ayers and Dodman
forthcoming). A broader approach, and one more in keeping with the trend in global adaptation research, recognises that socio-economic development policies have a key bearing on both vulnerability to climate change impacts, and the capacity to adapt to them – although not all development policy is sensitive to the need for adaptation (Ayers and Dodman forthcoming; Burton et al. 2002).
The IPCC-agreed definition of adaptation is: “the adjustment in natural or human systems in response to actual or expected climatic stimuli or their effects, which moderates harm or exploits beneficial opportunities” (IPCC, 2007b). Adaptation, and the capacity to adapt, will mediate the impacts of climate change. However, successful ‘global adaptation’ will ultimately depend on ‘local adaptation’, as the exact nature of the process is highly localised - depending on characteristics including the type, predictability and duration of the climate stimuli and the scale of the system in question (Smith et al., 2000; Agrawal, 2008). In urban areas, this is in turn mediated by a complex and unique set of territorial, institutional, socio-economic and cultural factors. This implies the development of policies and institutions sensitive to processes at local scales, but also greater attention to the way the capacity to adapt is mediated by existing power and institutional structures (Lampis, op. cit., 2010).
This chapter examines national, regional and urban institutions and policies, while chapter 4 focuses on adaptation by communities, households and individuals. The overarching focus of both chapters remains adaptation by and for poor urban people, whose interests
Chapter 2 polIcIeS anD InSTITUTIonS for aDapTaTIon To clImaTe change In Urban colombIa

29
Chapter 2 POLICIES AND INSTITUTIONS FOR ADAPTATION
TO CLIMATE CHANGE IN URBAN COLOMBIA
are not necessarily reflected at higher scales (Pelling 2003; Kates, 2000). However, the poorest social groups are the most vulnerable to impacts, and the least able to adapt to them (IPCC 2007b; Satterthwaite et al. 2007).
2.2 urban governance and the institutional Arrangements for Adaptation in Colombia
Putting the analysis of institutions for urban adaptation in a broader context, major institutional reform in the 1980s and early 1990s in Colombia radically altered the possibilities for policy-making in urban settlements, democratising local government and decentralising the country’s finances (Alesina, 2005; Torres, 2003). Popular elections of municipal mayors were approved in 1989, and the power of mayors was increased in the 1991 Constitution (Torres 2003; Gutiérrez Sanín et al., 2009). Furthermore, the law of participatory development planning (1994) sought to enshrine broader participation in planning processes, including in urban areas. The 1995 legislation for urban planning and land use obligated urban authorities to plan, and obligated them to coordinate with neighbouring municipalities (Torres, 2003). Still, it presented countless problems of implementation and in 2007 a new project of law for a comprehensive bill on urban and territorial planning was proposed at the lower chamber without yet achieving the necessary support. Bogotá is a special case within the country’s urban system since it has historically had its own legal and administrative regime. The city was granted a special status in these reforms, categorised as a district by the 1991 Constitution on a par with other municipalities (ibid.).
However, there has a been a huge divergence in how city governments and urban municipalities have taken advantage of decentralisation, with the larger cities better placed financially to effect reform
(Gutiérrez Sanín et al., op.cit., 2009), and ongoing discrepancy with small and medium sized urban settlements where municipal governments remain financially and institutionally weak. Although significant proportions of central government spending has been allocated to the sub-national levels, most revenue is collected at the central level and must be spent by local governments in tightly defined ways (Alesina 2005). City governments and municipalities have also diverged in the extent and manner in which they have promoted citizen participation in policy-making, and this has waxed and waned with changes in city administrations. The most radical experiments have again been in the big cities, although in Bogotá, despite municipal administrations committed to policy reform and modernisation, the promotion of participation in public policy has never been systematic, and where it has been undertaken it has remained a ‘top-down exercise’, confined to small local spaces (Velásquez, 2009). Medellin, however, has experimented with participatory budgeting since 2004 (Carvajal, 2009).
Adaptation policy poses huge challenges of working inter-institutionally and inter-sectorally across different scales. For example, there are at least five relevant municipal institutions in Bogotá whose activities are directly relevant to adaptation planning in the city. They are the Secretaría Distrital de Ambiente10 (SDA), the Secretaría Distrital de Hábitat (SDH), the Secretaría Distrital de Educación (SDE), the Secretaría de Integración Social (SDIS) and the Dirección de Prevención y Atención de Emergencias 11 (DPAE). In addition, SDA is in charge of the drafting and operation of the environmental policies of the city, in interaction with the Corporación Autónoma Regional (CAR), which is responsible for environmental management in the surrounding region (Lampis, op. cit., 10 Environmental Secretariat of the Capital District: www.
secretariadeambiente.gov.co11 Direction of Prevention and Attention to Emergencies www.
dpae.gov.co

30
The ImpacT of clImaTe change on Urban SeTTlemenTS In colombIa
2010). A “polyphony” of organisations is also currently responsible for disaster risk management, but there is no real concerted planning between any of these institutions and, besides a few educational projects, there is not a single project implemented in co-ordination by at least two of them beyond the pooling of resources in the occurrence of some critical event (ibid.).
2.3 Direct Adaptation Policies in Colombia
While awareness of climate change has been growing among national institutions over the last decade, a dedicated climate change policy for the country is still in formulation. The last five years has seen the development of several adaptation-specific initiatives, but most, if not all, are still in their pilot phases. The most significant national-scale, government-led project to date is the Integrated National Adaptation Project (INAP). This five-year project began in 2006, and has four key components: better provision of climate change data, adaptation for high mountain ecosystems, coastal areas and in response to climate change-related expansion of diseases (MAVDT 2009).
The adaptation agenda in Colombia has been developing (albeit at different paces) along three broad trajectories: initiatives operating at the scale of ecosystems; those which address the impacts of climate change by issue or geographic area, and include urban areas in their scope; and city-by-city adaptation planning by municipal governments themselves.
A critical conceptual and policy issue is the ambiguity in the use of the terms “adaptation” and “mitigation” by national authorities. For example, the Group for Climate Change Mitigation (GMCC) 12 of the MAVDT is in charge of both mitigation and adaptation
12 Grupo de Mitigación de Cambio Climático.
projects yet the name of the group does not include the word adaptation. This is not a secondary issue because Colombia entered the international dialogue on climate change with a clear aim of contributing to CO2 emissions and gaining from the clear development mechanism. Only in a very recent phase, has the fact that Colombia does not have much to contribute to greenhouse gas emissions but rather should concentrate in ecosystem conservation and adaptation, emerged in public debates. The fact that the first communication of Colombia to the UNFCCC (IDEAM, op. cit., 2001) dedicates so much effort to the calculation of the total amount of greenhouse gas emissions in the country and not a single section to the relevance of urban issues in the face of climate change is telling about the inclination of scientific and political actors towards international diplomacy and positioning. Many of the projects implemented still use the term “mitigation” to mean the cushioning of the negative impacts of climate variability, a contradiction the country has to resolve in order to be able to enter into a more proficient dialogue with what goes on in terms of research and policy at the international level. Nonetheless, a number of institutions from the national and local level have undertaken actions that are worth recalling for the potential they have to make a contribution to adaptation to climate variability and to future climate change.
a. ecosystem-based initiatives
The largest cluster of existing adaptation initiatives concentrates on high mountain ecosystems (Mogollon, 2008). Certainly, these ecosystems are key providers of environmental services to cities, including water and hydroelectric power, as well as water for agricultural production (Mogollon, 2008). For example, two key projects with implications for Bogota are:

31
Chapter 2 POLICIES AND INSTITUTIONS FOR ADAPTATION
TO CLIMATE CHANGE IN URBAN COLOMBIA
Project Geographic location and implications for urban areas
Main activities
iNAP Chingaza paramo: regulates 80% water supply for Bogota and surrounding areas.
Ecosystem management and planning; work with local communities to reduce environmental degradation.
Definition and Design of bogota’s ecological Corridor*
Bogota and 20 surrounding municipalities: principally working in high mountain ecosystems.
Includes design of an “ecological corridor” for the city; Payments for Environment Services.
taBLe 4: main adaptation to climate change projects in colombia by geographical location and main activities
The emergence of projects at this scale is an important development, given that towns and cities do not function in isolation, but respond on multiple ecosystemic and socio-economic dynamics beyond their official boundaries which are often difficult for public agencies to manage and regulate (Millennium Ecosystem Assessment, 2005). However, existing projects have tended only to look at the one way relationship ecosystem to city. They have not included a consideration of the impacts of the urban system itself on surrounding ecosystems, and the complex relationships between them (ibid.). Nor have they considered how the loss of ecosystem services might differentially affect urban dwellers or what this implies for urban as well as ecosystem management (ibid.).
b. Direct initiatives which incorporate urban impacts
i. Coastal areas: Specific projects have been undertaken as
part of the INAP programme and by the Marine and Coastal Research Institute (INVEMAR) to address potential climate change impacts in coastal areas, including urban zones. The INAP project included the implementation of a system of ocean monitoring, management of water resources to improve availability of freshwater, protection of marine areas, integrated coastal management to reduce the vulnerability of ecosystems, infrastructure
and populations. INVEMAR’s initial project13 involved a vulnerability assessment which identified the cities of Cartagena de Indias, Barranquilla and Santa Marta on the Caribbean and Tumaco and Buenaventura on the Pacific coast as among the critical zones in the country (MAVDT, op.cit., 2009). The second phase of the project 14 focussed on capacity-building with municipal, regional and national actors, public awareness raising and detailed vulnerability studies for Cartagena and Tumaco (ibid.).
ii. Health: The component of INAP related to reducing
the spread of malaria and dengue includes actions to improve the response to these two diseases in nine cities in Colombia. Models were developed for Monitoring and Early Warning of Malaria in the urban areas of Buenaventura, San José del Guaviare, Puerto Libertador, Montelibano, and Guapi, and for the Monitoring of dengue in Barranquilla, Bucaramanga, Floridablanca and Armenia. The project also seeks to improve data to evaluate the local risk of dengue and malaria
13 “Definición de la Vulnerabilidad de los Sistemas Biogeofísicos y Socioeconómicos Debido a un Cambio en el Nivel del Mar en la Zona Costera Colombiana (Caribe, Insular y Pacífico) y Medidas de Adaptación” que contó con el apoyo del gobierno holandés a través del Programa Holandés de Asistencia Técnica para Estudios de Cambio Climático (NCCSAP)
14 Generación de Capacidades para Mejorar la Adaptación al Aumento del Nivel del Mar en Dos Puntos Vulnerables de las Zonas Costeras Colombianas (Tumaco – Costa Pacífica y Cartagena – Costa Caribe) con Especial Énfasis en Poblaciones Humanas en Condiciones de Pobreza
*Conservation International Colombia, Ministry of Environment, Housing and Territorial Development (MAVDT), National Natural Parks System (UAESPNN), Government of Cundinamarca and Empresa de Acueducto y Alcantarillado de Bogotá (EAAB) (Bogota’s Water Supply Company).
Source: MAVDT 2009.

32
The ImpacT of clImaTe change on Urban SeTTlemenTS In colombIa
transmission, support preventative action and the implementation of a surveillance and control system (ibid.).
c. Adaptation planning by municipal governments
This is the area in which there has been least development in Colombia. The city council of Bogota approved the formulation of a district plan for both adaptation and mitigation in August 2009. However, while a district programme exists to encourage the reduction of greenhouse gases 15, no adaptation-specific activities are currently active.
2.4 urban Development Policies and Adaptation in Colombia
The capacity of a city or town to adapt to climate change depends on more than specific adaptation initiatives. A city able to meet the overall development needs of its population performs a ‘protective’ role, providing infrastructure that can prevent against or withstand physical impacts and services to respond to events when they occur (Dodman et al., 2009). It also promotes the capacities of its citizens to manage climate-related stress and events. However, without consideration of climate change impacts, development policies can be ‘maladaptive’, in that they increase vulnerability to climate hazards (Huq & Ayers, 2009). ‘Mainstreaming’ adaptation is an approach that aims to factor in climate-related hazards to existing planning and policies. This is not an approach currently operative in Colombia’s urban development policies, with the exception of nascent work in the disaster risk reduction sector.
Of course, the range of policies to be concerned with covers the dimensions of the built environment, ecological management, social management and risk management. Rather than aim to cover all of the related 15 See http://www.secretariadeambiente.gov.co/sda/libreria/php/
frame_detalle.php?h_id=1059
policies, this chapter looks in depth at a few key policy areas, namely land use planning and housing and disaster risk management; the social dimension of urban policies is dealt with in chapter 4.
a. Policies for the built environment
i. Land use planningMost Colombian cities have improved
their capacity for urban planning in the last 15 years, as new legislation strengthened the responsibilities and the instruments of urban planners (Prada, 2001; DPU, 2006).
For example, disaster risk management has featured in the country’s sectoral, territorial and development planning frameworks and statues since the late 1980s (Lampis, 2009). The Territorial Planning Law 388 of 1997 strengthened this, obliging municipalities to take certain actions such as including disaster prevention in land use and determining zones deemed uninhabitable for settlement due to disaster risks (ibid.). However, the national disaster risk management system is poorly aligned overall with the land planning system, while, despite programmes in a number of cities, the vast majority of municipalities have still failed to incorporate risk in their development plans (World Bank 2006a).
Using Risk Mapping in City Planning in Bogota Since the mid 1990s Bogota’s Disaster
Prevention and Attention Department (DPAE) has mapped zones of the city at high, medium and low risk from floods, landslides, earthquakes and forest fires. Risk classifications are integrated into the system of construction permits and licences, public works and public infrastructure provision. By the late 1990s – by which time there had been a large influx of migrants onto the city’s hillsides, which are prone to landslides – the legalisation of these barrios was subject, among other factors, to an assessment of the risk of hazards in the zone. Risk classification in the

33
Chapter 2 POLICIES AND INSTITUTIONS FOR ADAPTATION
TO CLIMATE CHANGE IN URBAN COLOMBIA
FIGUre 12: percentage of population in environmental risk-prone areas in bogotá (2010)
Source: DPAE (2010)

34
The ImpacT of clImaTe change on Urban SeTTlemenTS In colombIa
city triggers various types of programmes to mitigate hazards and reduce exposure and vulnerability for communities, including resettlement, engineering works, public services improvements (particularly drainage) and housing improvement subsidies. Areas of landslide occurrence deemed to be un-mitigable are declared protected land, and fall under the remit of the District Environment Secretariat to manage (see figure 12).
ii. Enforcing Land Use Planning in Low-Income Settlements
Enforcing planning regulations in informal settlements with high levels of urban growth is challenging for city governments. Since 2003 the city of Manizales (see also section 3.7.2.), which faced severe problems of landslides in low-income communities, has sought an innovative solution to the protection and management of its hillsides. Through the “Guardianes de la Ladera 16” (Slope Guardians) programme it employs predominantly women heads of household who are trained to disseminate disaster prevention messages to their communities, carry out mitigation works and monitor environmental management and new occupations of high risk zones. Since 1996, the Bogota municipal government has been rolling out a similar programme in its high-risk landslide zones. It aims to prevent cases such as that of Nueva Esperanza when in November 2004 an entire side of a mountain slope in the south of Bogotá, in the locality of Rafael Uribe, collapsed due to a complex mix of socio-economic pressures related to social vulnerability processes deeply entrenched in the lack of entitlement over physical assets by low-income groups, migrants and internally displaced people, lack of institutional action, social protection and enforced regulation as well as high structural vulnerability of the physical infrastructure.
16 See for a summary of this initiative, in Spanish, the following link http://www.manizales.unal.edu.co/gestion_riesgos/guardianas.php
a. Housing
The provision of quality, affordable housing is highly linked to the vulnerability of the poorest groups. Their choices about where to settle in cities are linked to the supply of housing, their experience of the impacts of climate-related events is linked to the quality of the physical infrastructure they inhabit and their ability to cope and recover from these events may be linked to the income they are able to derive from owning housing.
Colombia faces a housing deficit which predominantly affects the poorest, and as a result they seek informal solutions on the fringes of the largest cities (DPU 2006). A tentative comparison of housing deficit statistics from 1993 and 2005 17 shows that the country’s overall deficit – both rural and urban and in terms of quantity and quality – fell nearly 20% over the period (CENAC 2005). Most of the percentage decrease was due to improvements in the quantity of housing (ibid.). However, at current rates of change it would require 25 years to resolve the ongoing deficit (ibid.). There are also stark differences across regions: in the central region of the country and in the big cities, housing deficit affects less than 20% of the population, while on the Atlantic and Pacific coasts and other departments it affects the majority (ibid.).
17 Some caution is needed in the interpretation of this comparison: the 1993 data was based on an actual survey, and the 2005 on a census projection (DPU 2006).
The landslide areas of nueva esperanza (bogotá).photo ©: Jorge pardo /Dpae (2004)

35
Chapter 2 POLICIES AND INSTITUTIONS FOR ADAPTATION
TO CLIMATE CHANGE IN URBAN COLOMBIA
In 2008, 38% of urban homes in Colombia were still considered ‘precarious’, because of poor quality construction and inadequate materials or their location in risky zones (ECV 2008). Three-quarters of Bogota’s housing deficit is due to deficits in housing quality (CENAC 2005).
The latest evaluations of housing policy emphasise the lack of consideration of housing policy in land use plans, the need to improve the offer of flexible, social housing and the failure of housing subsidies to reach the very poorest households (DPU 2006).
Colombia also has legal minimum requirements for the design and construction of new buildings, modifications to existing buildings and post-disaster reconstruction building (Law 400 of 1997) as part of its disaster risk prevention portfolio. Most of the measures undertaken have been in response to earthquakes, though, while a key problem has been implementing requirements in informal settlements (Cardona & Yamin, 2006).
b. Disaster risk management
For a nation highly and increasingly exposed to disaster impacts, the additional effects of climate change heighten the imperative to prepare for and respond to disaster events. The links between the two are increasingly recognised by government actors in Colombia. At the national level, strengthening of disaster risk response through the international Hyogo framework of action 18 is being listed as a component of Colombia’s adaptation response alongside ecosystem-based adaptation approaches (MADVT 2009a). In Bogota, the city’s flood management system is beginning to be recognised as a tool for adaptation planning (DPAE, 2008).
However, as Ayers and Huq outline, there are both complementarities and differences between the adaptation and disaster response agendas (Huq & Ayers 2009). Trends in
18 A global plan to reduce disaster losses by 2015.
thought (and to a lesser extent practice) around both have converged on the idea that vulnerability to impacts is a function not just of physical events, but of the development context itself. Therefore, the required interventions are necessarily holistic and long-term as well as short-term, and aim to build the resilience at all levels of society to anticipate, prepare for, cope with, recover from and learn from climate and disaster-related shocks (ibid.).
The principal operational difference, however, is that adaptation and disaster response interventions respond to different sets of events. Disaster response is undertaken with respect to all hazards, not all of which are climate-related (such as earthquakes and volcanoes), and not all of which may be climate-change related (landslides, for example, can be induced by human activity). Adaptation responds not only to climate-change induced hazard events, but also slow-onset changes, such as salinisation caused by sea-level rise. Huq and Ayers point out the danger that actions taken in the short-term (such as building flood defences designed to short-term water level predictions) may actually prove to be maladaptive to climate change in the long-run (given water level rises in the long-term) (ibid.). The observation points to the need to ensure strong integration between both agendas at all levels of management.
iii. Colombia’s Disaster Risk Management System
Colombia’s national disaster risk management system is regarded as a leader in the region (Lampis 2009; Cardona & Yamin 2006), while various of the country’s cities have piloted innovative programmes in disaster prevention and attention (Manizales, Bogota and Medellin are the most commonly cited examples).
The National System for the Prevention of and Attention to Disasters (or SNPAD19) 19 Sistema Nacional para la Prevención y Atención de Desastres.

36
The ImpacT of clImaTe change on Urban SeTTlemenTS In colombIa
dates back to 1989. The system was based on principles of inter-institutional coordination, decentralisation, autonomy, participation and an integrated disaster response - replacing a fragmented and unclear institutional and legal regime that operated according to limited conceptions of emergency response (ibid.). The functioning of the system was codified in a National Plan, which was revised in 1998 to allow for a greater emphasis on disaster prevention than emergency response (World Bank 2005).
Recent evaluations of the strengths of the system highlight good technical capacity and levels of knowledge at the national level, the development of flood and landslide mapping in several cities (alongside other actions, see below), the incorporation of disaster risk into land use planning (see above), and the efforts to include disaster risk in education curricula, training of officials and communities and in public communications (Lampis 2009).
The development of the system has also been tracked over time and across countries using a Risk Management Index (IDGR) that combines variables measuring the organisation, capacity and institutional development for vulnerability reduction, disaster loss reduction, preparation and efficient recovery (Cardona & Yamin, 2006). As graph 3 below
shows, Colombia’s index has shown consistent improvement over time. Most of the advances have been concentrated in risk identification (systematic inventories of disasters, evaluation, monitoring and mapping of hazards and risks) and financing (such as the establishment of an emergency fund, insurance and budget allocations).
The same evaluations have also highlighted the generalised weaknesses in Colombia’s national system, which can be broadly categorised as issues of:
1. Comprehensive, coherent knowledge generation: Among other issues, Cardona et al. emphasise the lack of studies based on an integrated understanding of vulnerability to risk and hazard, and the lack of risk studies at a resolution to be compatible with vulnerability indicators, as well as sufficiently comparable studies at the national, regional and local level (Cardona & Yamin, ibid.).
2. Concentration on emergency response activities: Despite a system designed to promote a more comprehensive approach, in practice activities have remained concentrated on emergency response and preparation, with a lesser role for ex-ante risk reduction and post-disaster reconstruction (ibid).
Graph 3: risk management Index for 12 latin american countries
Source: BID, CEPAL y Universidad Nacional de Colombia (2003).

37
Chapter 2 POLICIES AND INSTITUTIONS FOR ADAPTATION
TO CLIMATE CHANGE IN URBAN COLOMBIA
3. Weakness at the municipal level: While innovative and integrated practice now exists in a few of the major cities, in the majority of municipalities (which covers most small and medium-sized urban settlements) disaster risk response programmes (of all types) have lagged. The capacity to address disaster risks locally is not only critical for its own sake, but is additionally important to the sum of the national response in Colombia as legislation has devolved to the municipalities the responsibility to do so (ibid) 20. However, municipal governments have been institutionally weak and lacked experience. They have also had very little financial leeway to allocate funds for disaster risk activities. The level of direct central government transfers for disaster risk activities has been inadequate, and only small proportions of the budgets transferred for use at the discretion of municipal governments are available for investments (Lampis, op. cit., 2009) 21. The 2006-2010 National Plan aimed to improve central support to capacity-building and planning at the municipal level (DNP, 2006).
4. Institutional co-ordination and capacity: The system still suffers from fragmentation, a lack of clarity about institutional responsibilities, the lack of participation by the private sector, lack of risk reduction consideration in sectoral plans and a tendency in major disasters to create parallel organisations to SNPAD to manage the response (Cardona & Yamin, op.cit., 2006; Lampis, op. cit., 2009). This fragmentation could be compounded by the emergence of new institutional units to tackle adaptation to climate change – most likely housed in the Ministry of
20 The Territorial Planning Law of 1997 (388) devolved responsibility for resettlement programmes, basic infrastructure, roads, legalisation and building improvements and subsidies (among other activities) to municipal governments. To encourage spending on disaster management, a new law enacted in 2001 permitted municipal governments to invest in disaster prevention and response.
21 In 2003 only 1% of national transfers were destined for risk management. 85% of Colombian municipalities were only able to use 20% of their discretionary budget for investment.
Environment and Meteorological Institute, where only limited overlap exists with disaster response activities – and impede coherence between the two agendas. National financial resources are also crucial to capacity. A National Disasters Fund 22 has existed since 1984, however it is entirely dependent on allocations from the national budget and its income has been both volatile and declining (Lampis, op. cit., 2009). The lack of the use of other financial instruments, e.g. to protect against disaster losses (Cardona & Yamin, 2006) prompted the government to commit to explore new financing strategies over the 2006-2010 period.
The disaster risk management system, and analyses of it, are concerned with the whole spectrum of disaster hazards, not just climate-related ones. Many of the responses in Colombia’s cities – such as insurance, structural modification of buildings, micro-mapping of risk – have been undertaken to protect against earthquake losses.
iv. City-led programmes for disaster risk response
Several cities in Colombia have created their own systems for disaster risk management which have become internationally known for their innovation and effectiveness. The most prominent among them are Manizales, Bogota and Medellin, all of which face flood and landslide risks and have seen influxes of poor populations into peripheral areas of the city situated on steep slopes or in flooding zones. Notably, all have their own financial resources for disaster response independent of the central government: Manizales and Bogota via dedicated funds which receive a certain proportion of local government revenue, and Medellin through a regular, pre-set allocation from the municipal budget (Cardona & Yamin, 2006; World Bank, 2006).
22 Fondo Nacional de Calamidades.

38
The ImpacT of clImaTe change on Urban SeTTlemenTS In colombIa
However, in the case of Bogota, the limitations of its programme lie in the fact that social determinants and drivers are not included in the conceptual and methodological focus (Wisner et al., 2006). In Bogotá neither the interdisciplinary understanding of how disasters are generated by political and socio-economic processes nor the importance of community participation for their prevention (van Aalst, Cannon and Burton ,2008) have been given the room they deserve in risk management policies, and they
are still dominated by a conceptual framework centred on the mechanics of disasters and by the discipline of engineering and economics. The Disaster Prevention and Emergency Department’s portfolio is dominated by geotechnical studies, projects of civil engineering aimed at the mitigation of risk and to the strengthening of the most critical spots across the slopes where the majority of peripheral barrios have been built over the last three decades (Lampis, op.cit., 2010).

39
Chapter 3 THE IMPACTS OF CLIMATE CHANGE ON URBAN SETTLEMENTS
IN COLOMBIA: CONTEXT AND CRITICAL ISSUES
Chapter 3 The ImpacTS of clImaTe change on Urban SeTTlemenTS In colombIa: conTexT anD crITIcal ISSUeS
This chapter analyses the likely impacts of climate change on urban settlements in the country. Colombia’s urban transformation, its main historical trends and contemporary drivers are presented at the beginning of the chapter right after a summary of the main insights produced by the literature on these broader issues of climate change, impact and cities. It analyses the conceptual and empirical aspects of physical and social vulnerability and presents four case studies illustrating it.
As indicated by Eakin and Lemos (op.cit., 2009), Latin America is characterised by economies with high levels of dependence on natural resources, which in turn tend to be critically affected by commodity price fluctuations and macro-economic instability.
The IPCC’s conclusions and country-based data summarised in chapter 1 of this report point to the existence of a number of potentially climate change-related risks relevant to the adaptation of urban settlements to GEC. The relationship between urban systems and climate needs to be conceptualised as a two-way one. Romero-Lankao points out that “since the dawn of the industrial era, concentrations of carbon dioxide and methane have increased at a rate that is very likely to have been unprecedented in more than 10,000 years, and urban centres have played a key, though not yet fully understood, role in this process” (Romero-Lankao, 2008b: 25).
Besides being cities in a sociological sense, that is, places of production and reproduction of societies’ economic and cultural wealth, activities, meaning and identity, urban settlements are also complex socio-ecological systems, which are creating new environmental conditions, such as heath islands, ozone holes, desertification and water pollution (Sassen, 2010). Urbanisation poses increasing strain on ecosystems’ health and functioning, insofar as it affects the natural landscape, biophysical processes and habitat, while it modifies biogeochemical cycles (Alberti, 2010). As Alberti points out:
“(E)cosystem function supports important services in urban areas. They provide clean water, sequester carbon and filter pollutants, moderate climate conditions, control flooding, protect soils from erosion, and maintain biodiversity. Changes in ecosystem function feed back into drivers of change” (Alberti, op.cit.: 179-180).
Figure 13 from the same scholar illustrates a number of delicate relationships that are given between bio-physical and human ecosystems where functions and patterns interact with drivers and processes to determine different outputs in terms of sustainability. What marks nowadays’ increasing importance of understanding these relationships is the extraordinarily large footprint of urbanized areas.

40
The ImpacT of clImaTe change on Urban SeTTlemenTS In colombIa
FIGUre 13: conceptual model of coupled human-natural systems
Source: Alberti (2010: 180)
Patterns
DriversProcesses
Functions
Multipleequilibria
Current Opinion in Environmental Sustainability
Scenarios
Scales

41
Chapter 3 THE IMPACTS OF CLIMATE CHANGE ON URBAN SETTLEMENTS
IN COLOMBIA: CONTEXT AND CRITICAL ISSUES
The way risk is produced within cities closely relates with Alberti’s concepts of structure and function. First, risk is multi-scalar. It affects different sub-systems across a continuum that goes from the micro to the macro level. Second, it tends to be poly-centric and, at the same time, spatially diffused, that is, it is produced within and from different locations across the city but also throughout different processes. Its production increasingly overlaps with strategic and determined geographical places, like plants or generators, or places that control key information for the functioning of the city as a whole or for sub-areas. Its increasingly diffused character lies in the fact that many structures of the city are produced by fluxes that overlap with its key functions. Third, risk tends to manifest in the city as a systemic challenge, as in the case of climate variability. Fourth, risk continues to be a major development problem across the three previously mentioned characteristics, as its presence and the ability to manage and reduce it affect the opportunities people have to lead better lives, improve their qualities and, never to be underplayed, achieve better material functioning (Lampis, 2010).
Although it has been suggested that urban form influences the impact that urban ecosystems have on natural ones, as Alberti (op,cit., 2010) points out, we do not know how alternative development patterns influence ecological systems along the rural-urban or the shape gradients. However the rationale for the study of coupled urban-natural systems in urbanising regions is that it is critical to develop future scenarios, as the same scholar points out.
3.1 typology of impact of Climate Change on urban settlements
As Romero-Lankao puts it, climate change is not the only risk facing urban centres and “its positive or negative significance lies in the interaction with other societal and environmental sources of change and stress” (Romero-Lankao, op.cit., 2010: 28).
The impact of climate change on urban settlements has been tackled from a number of viewpoints depending on disciplines and scholars interests, within a rich and cross-fertilising endeavour embracing academic institutions, international co-operation, community-based organisations, private enterprises and local governments. For instance, Bigio (2003) divides the impacts into two different categories ‘direct’ and ‘indirect’, considering the physical environment as the unit of observation when referring to direct impacts and both population and socio-economic processes when dealing with indirect impacts.
Direct impacts: Sea level rise; flooding and landslides;
heat waves; increased ‘heat island’ effect; water scarcity; decreasing water quality; worsening air quality; and ground ozone formation.
Indirect impacts: Frequency, intensity of natural disasters;
accelerated urbanisation; environmental refugees; increased energy demand for heating or cooling; epidemics, worsening public health; availability and pricing of food stuff.
Wilby (2007), reporting on one of the earliest city-based studies, that commissioned by the London Climate Change Partnership (LCCP) in 2002, present a different categorisation that adopts the built environment as the unit of observation and analyses impacts across

42
The ImpacT of clImaTe change on Urban SeTTlemenTS In colombIa
critical issues. These are: higher temperatures; flooding; water resources; health; biodiversity; built environment; transport; business and finance; tourism and lifestyle.
While these initial attempts have the merit of providing first-hand initial conceptualisations of impact, they do not overcome the limits represented by the lack of clarity in terms of the affected units of analysis, mixing up scales and gradients.
Climate phenomena by likelihood major projected bio-physical impacts mayor projected social impacts
Virtually certain: Warmer and fewer cold days and nights; and
Warmer and more frequent hot days and nights over most land areas
Reduced energy demand for heating Declining air quality in cities Reduced disruption to transport due to
snow, ice
Effects on winter tourism Increased demand for cooling
Very likely: Warm spells/heat waves Frequency increases over most land areas
Reduction in quality of life for people in warm areas
without air conditioning; Impacts on elderly, very young and poor;
Very likely: Heavy precipitation events: frequency increases over most areas
Pressure on infrastructure Potentials for use of rain in hydropower
generation Loss of property”
Disruption of settlements, commerce, transport and societies due to flooding
Likely: Increase in the areas affected by drought
Reduced hydropower generation potentials Water shortages for households, industries and services
Potential for population migration
Likely: Increase of intense tropical cyclone activity
Disruption by flood and high winds; Disruption of public water supply
Withdrawal of risk coverage in vulnerable areas by
private insurer (at least in high income countries)
Potentials for population migration
Likely: Increased incidence of extreme high sea level (excludes tsunamis)
Costs of coastal protection versus costs of land-use
relocation; Decreased freshwater availability due to
salt –water intrusion”
Potential for movement of population and
infrastructure (also see tropical cyclones)
taBLe 5: projected impact on urban areas of changes in extreme weather and climate events
Source: adapted from (IPCC, 2007b; Romero-Lankao, 2008
As already introduced in chapter 1, given this constraint is mostly due to the multi-scalar nature of risks affecting urban settlements in relation to climate change, table 5 categorises impacts more practically. On the one hand it goes back to original IPCC’s estimates of the likelihood of certain events and, on the other, it concentrates on the climate and its variability as the unit of observation. Impacts
are categorised in columns two and three according to a simple categorisation (bio-physical vs social), the advantage of which is threefold: it follows a mainstream approach that, after urban ecology, analytically separates bio-physical from social ecosystems, while recognising their interactions at higher levels of complexity; it does not disrupt the typical city-based division of issues according to

43
Chapter 3 THE IMPACTS OF CLIMATE CHANGE ON URBAN SETTLEMENTS
IN COLOMBIA: CONTEXT AND CRITICAL ISSUES
sectors, to which governmental and applied policy responsibilities generally relate, thus allowing governmental officers and planners to appropriate the issue from a well-known terrain to look at inter-disciplinary and more complex interactions in a second moment; and, it does not lose the possibility to further sub-categorise bio-physical and social impacts into direct and indirect ones.
3.2 the urbanisation Process in Colombia
With 75% of its population residing in cities and smaller urban settlements,23 Colombia has been a prevalently urbanized country since 2005. 24 Research on urban social dynamics tends to concentrate on urban violence, the relationship between poverty and violence (Boltvinik, 1991), the process of migration (Rivera, 2003), the provision of public services and transportation (Ardila, 2006), access to housing and land (Jaramillo, 1982 and Lulle, 2000) or decentralisation and urban institutions (García and Zamudio, 1997 and Prada, 2001). In spite of the numerous studies on health (Peñalosa Ramos, 2004; SSB, 1997a, 1997b and 2002), research directly focused on the issues of urban social development, livelihood and urban poverty (Gilbert and Gugler, 1992) dynamics has so far been rather neglected.
As Gouëset (1998) pointed out a decade ago, in his vibrant and lively synthesis of debate on the urbanization of Colombia over the period between the 1950s and the 1990s, 25 the debate on the normality or anomaly
23 The DANE definition of Urban Population in Colombia identifies the ‘Urban Cask’, called cabecera, for each single municipality. Its geographic boundaries are ultimately defined by the local administration, the remnant territory located within the administrative boundaries of the municipality, but outside the cabecera, being defined as ‘The Rest’.
24 Interestingly, a complex set of factors determinate a sort of diffuse auto-perception of Colombia by Colombians as a rural country. These find possible explanation on cultural and historical grounds. On the one hand, there are the recent and not too recent migration flows towards primary and secondary cities and, on the other, the fact that both the armed conflict and the economic history, tradition based on agriculture, cattle and mining are all linked both to a rural reality and imagination.
25 Data on this page are from the cited work of Gouëset.
of the Colombia-Bogotá case had occupied centre stage for almost two decades. As early as in the 1970s, for instance, Gilbert (1974) was pointing out the peculiarity of the Colombian case regarding the urbanisation process of its main city, Bogotá. It was argued that Bogotá did not occupy a clearly dominant position amongst the other cities. In this respect Colombia did not follow the pattern found in most Latin American countries, where up to 50% of the whole urban population tended to be concentrated in the capital, contributing to significant differences between it and secondary cities.
Gouëset recalled how, in the 1970s, the urbanisation process of Colombia was considered normal by urban studies of the time. However, nowadays it tends to be considered as rather anomalous. The same scholar provided a synthesis of the most important statistical elements:
1. The process of urban concentration took place in Colombia at roughly the same time as in other Latin American countries, starting in the 1930s.
2. Colombia’s primary urban system as one comprised of four cities, Bogotá, Medellin, Cali and Barranquilla, within which 29% of the whole population are concentrated. This is approximately the same percentage of the population that is found concentrated in the capital city of other Latin American countries (Gouëset, op.cit).
3. The fact that Colombia’s largest city, Bogotá, did not contain a large concentration of the population for a long time: 14% according to the 1985 census, 16.6% in 1993 and 18.7% in 2005. 26 Bogotá’s growth followed a slower pace than that of Medellin, Cali and Barranquilla, but its
26 This 1993 data is not reported by Gouëset, but directly taken from the statistics of the National Statistic Department (DANE). All data from the 1993 census already processed by interested parties is available to the general public for purchase on CD-Rom.

44
The ImpacT of clImaTe change on Urban SeTTlemenTS In colombIa
1973 1985 1993 2005
Colombia 24,862 30,062 37,422 42,090
Urban population (millions) 13.652 19.644 25.489 31.556
Urban population (%) 59.7% 65.3% 69.1% 75,0%
urban Network: primacy
Bogotá’s rank 1 1 1 1
Bogotá’s Capital District population (millions) 4,861 4,236 5,484 6,778
Total Population of the Metropolitan Area of Bogotá * 3,1.21 4,685 6,218 7,887
Metropolitan Area of Bogotá / Total Population of Colombia 13.7% 15.6% 16.6% 18,7%
Metropolitan Area of Bogotá / Total Urban Population of Colombia 24.9% 23.9% 24.1% 25,0%
Metropolitan Area of Bogotá / Total Population of N.2 raking Metropolitan Area (Medellín)
1.93 2.21 2.48 3.60
* The Metropolitan Area includes the Capital District, conformed by 19 urban localities and 1 (Sumapaz) rural locality, plus 17 municipalities located on the outskirts of the city.
growth burgeoned at a much faster pace than that of these other Colombian cities during the years 1905 to 1951. Recent trends show that the primacy of Bogotá is actually increasing and the gap between Bogotá and the other three main cities is widening, albeit relatively slowly.
As illustrated in table 6, reporting data from a recent comparative study (Cuervo 27 et al. 2002: 336, Dane, 2005), the importance of the metropolitan area of Bogotá is constantly increasing, even though the pace has slowed down over the last two decades. This is relevant in terms of the pressure this places on scarce resources and the competition for them. Such pressure takes place in a socio-economic context that is not only monetized, as Wratten (1985) underlined in her seminal paper, but also strongly marked by the impact of neo-liberal policies that have come to the fore over the last ten to 15 years (Garay, 2002).
27 The data from Cuervo 2002 have been up-dated with more recent ones from the census of 2005.
3.3 urban settlements and Climate Change impacts: global risks and Local Vulnerabilities
GEC differs from both disasters and ecological deterioration. Simon (2007a) highlights the common misperception that GECs do not differ substantially from (natural) disasters and that coping mechanisms from the latter can represent the backbone of coping strategies for GEC impacts. By contrast, scientific evidence increasingly shows that GEC a) increases the frequency and severity of extreme environmental events and impacts; b) is occurring on top of long-term ‘secular’ rises in sea level and atmospheric CO2 concentration; and, c) relates to slow-onset, long-lasting changes that imply that human systems will necessarily have to adapt – a prominent concern since the first reflections on GEC (Turner et al. 1990).
GEC challenges in cities of the global south have been recognized as a phenomenon that will affect the urban poor with harsher impacts. The urban social vulnerability tradition offers relevant analytical tools as a basis for research on the interactions and
Source: DANE (2005) – Population census statistics (adjusted)
taBLe 6: Urbanisation trends in colombia and bogotá 1973 – 2005

45
Chapter 3 THE IMPACTS OF CLIMATE CHANGE ON URBAN SETTLEMENTS
IN COLOMBIA: CONTEXT AND CRITICAL ISSUES
responses of urban systems and populations in the face of the indirect social impacts of GEC. As indicated in the UGEC Science Plan (Sánchez-Rodríguez et al 2005), a policy agenda that places adaptation centre stage cannot be fully accomplished while ignoring the impacts of GEC on the livelihoods of diverse groups in cities of the global south. People’s adaptation depends on resilience in the face of structurally adverse conditions, economic crisis or environmental events such as disasters.
Resilience generally is a function of people’s access to assets, social protection and opportunities as research on low-income groups’ vulnerability demonstrated during the evolution of an urban vulnerability approach (Chambers 1989; Moser 1996; 1998) that draw important insights from the work of Amartya Sen (1981, 1999) on entitlements. Integrating such an approach into the study of GEC’s indirect impacts on low-income countries and groups (Parnell, Simon, Vogel 2007) broadens the vulnerability debate compared to the disaster tradition (Blaikie et al 1994; Pelling 2003; Schipper & Pelling 2006). It does so by combining the analysis of how risks are shifted across the landscape with a systemic approach to the study of the range of causes of urban and human vulnerabilities.
3.4 Conceptualising the Vulnerability and Adaptation of Cities
Vulnerability in its most general meaning refers to the susceptibility to harm. This apparently simple concept hides in reality many complexities from which different approaches have been spurred by different disciplines. However, climate change requires a more integrated framework in order to operationalise the analysis of both bio-physical and social vulnerability. Figure 14 presents a broad conceptualisation of vulnerability that has the advantage of being adaptable
to both physical and social vulnerability. Urban vulnerability is ultimately the product of the unequal access to capital-assets and rights resulting from uneven development. Nonetheless, it could not be affirmed that vulnerability is only a social matter. Therefore, before analysing social vulnerability in more depth, this section presents some general conceptual elements regarding what vulnerability is and how it works, adopting a more general scientific model and, through this, hoping to foster dialogue among different disciplines. This is considered an important component of adaptation to climate change and it is with this in mind that a broader vulnerability framework is presented here. The elements pointed out by Turner and colleagues are taken as a reference point, but the framework is analytically enriched highlighting, wherever suitable, the contributions of the social development tradition to certain dimensions, component or factors within the enlarged vulnerability framework proposed by Turner. Vulnerability has three dimensions that can be thought of as the component one has to spell out in order to evaluate and/or measure it. Before defining them it is necessary to stress that vulnerability is determined by multiple stressors; these can be related to changes either in the human or environmental conditions. Social vulnerability approaches have contributed to highlight that often these two sources of stress, or drivers, happen to combine in the same geographical and time frame (Blaikie et al, 1994).
1. Exposure is a dimension of vulnerability that is important beyond the presence of a perturbation. It depends on how human-environmental systems experience hazards. Many specific studies have highlighted the dynamic nature of the relationship between exposure and sensitivity. Especially in social vulnerability studies sensitivity is not just described as in Turner et al. (2003) but the relationship with assets and resources accumulation is put forward as

46
The ImpacT of clImaTe change on Urban SeTTlemenTS In colombIa
a key factor (Blaikie et al, 1994; Moser, 1996, Pryer, 2003, Lampis, 2007). The fact that inequality in access to resources as a political issue can hardly be incorporated by natural sciences and remains a unique contribution of the social development tradition to the analysis of urban social vulnerability.
2. Sensitivity depends on the specific characteristics of the unit of the analysis. In the case of cities its geographical position is very important, whereas in the case of community and family, besides the place of residence, the condition they are found in at the moment a stressor acts upon them is also a key component.
3. Resilience is a third component that is borrowed from ecology and contributes
to explain the capacity to cope or respond “including the consequences and attendant risk of slow (or poor) recovery” (Turner et al., op.cit., 2003: 8075).
3.5 Cities and social Vulnerability: towards an Asset-based framework for Adaptation
During the first half of the 1990s, Moser and Chamber’s works placed at the centre stage of the debate a number of issues that had previously been granted only scant attention within the poverty debate. Looking back at that debate, it can be said that this lack of relevance of a people-centred perspective was by and large due to the strong influence
Human influences outside the placeMacro political economy, institutions, global
trends and transitions
Environmental influences outside the PlaceState of Biosphere; State of Nature
Global Environment Changes
Characteristics & components
of exposureAdjustment & adaptation /
response
Variability & change in human conditions
interactions of hazards (perturbations, stresses,
sensors)
Variability & change in environmental
conditions
Adjustment & adaptation /
response
Human conditions
environmentalconditions
Coping/response
impact/response
exposure sensitivityVulnerability
resilience
system operates at multiple spatial, functional, and temporal scales
Drivers/causes Consequences
WorldCross-scale
in placebeyond place
DyNAmiCs
regionPlace
impact / responses
FIGUre 14: vulnerability framework
Source: Turner et al. (2003)

47
Chapter 3 THE IMPACTS OF CLIMATE CHANGE ON URBAN SETTLEMENTS
IN COLOMBIA: CONTEXT AND CRITICAL ISSUES
of a neo-liberal tradition of poverty analysis within the whole development debate over many decades. Due to the dominating role of economics within social and, later, development-related disciplines, this historical shift determined to a large extent the identification of the problem of well-being with issues of welfare and individual utility; eventually making a strong contribution to the turning of the whole poverty issue into a problem of measurement (Ruggeri Laderchi, 2003).
Central to both Moser’s and Chambers’ reflection was the questioning of the limits of the monetary approach in terms of poverty conceptualisation and measurement and what it can tell about how poverty works and what it implies in terms of policy for people. At the beginning of the nineties, they set a new research agenda, taking to the fore issues such as the different control and allocation of resources within the household, the diversity28 that can be found both in people’s experiences of poverty and in the range of differential impacts that same experience.
In a recent paper on the relevance of vulnerability analysis for the understanding of poverty traps, Barrientos has underlined that “(t)here are important gaps in the literature on that topic. There are no standard methodologies - and no cross-disciplinary paradigm” (Barrientos 2006:4). The relevance of his argument for the discussions on vulnerability and chronic poverty goes beyond the span of the present review. Within mainstream development thought, so heavily influenced by international financial institutions (IFIs) over the last two decades, this gap assumes an even greater relevance because it has persisted at least since the time of the publication by the World Bank of World Development Report 1990. Thus it is a vacuum that testifies to the difficulties attached to the process of
28 On the use of the term ‘diversity’, see Beall (1997) regarding a conceptualisation that helps uncover the interconnections among issues like urbanisation, poverty, livelihoods, power, gender and governance.
bringing within mainstream policy a debate that ultimately touches upon issues such as property, private wealth, collective rights, access and power in relation to the control people have over resources and the way local institutions respond to social exclusion of large population groups, women and those most exposed, not only in Colombia, but in developing countries as one of the most relevant policy issues of our time.
The relationship between people and their habitat, as well as their respective vulnerabilities are key determinants of the future chances for successful adaptation; and the way habitats are managed by institutions and local governments will play a major role in shaping those variables.
In Latin America, according to the World Bank’s recent estimates, for five out of six people this is a very much felt issue. Those who live in these human settlements, especially in socio-environmental hot spots, will be able to undertake at least partly successful adaptation actions, hence becoming more resilient and less vulnerable to the likely effects of climate change, depending on how effectively local governments will be able to foster enabling policies (IIED, 2007).
Public policy that enables communities to address their own environmental and developmental priorities on the one hand while on the other hand increasing the capacity to respond to the existing shortfalls in terms of the regulation of the interaction between human settlements and their environment are paramount; especially regarding those ecosystems that play a major role in the local provision of food, water and energy. The provision of access to collective services and goods within each urban settlement is an issue that brings into the discussion the concepts of habitat and good governance and, therefore, represent a link also to the institutions, which through the creation of new regulatory frameworks at the city and community

48
The ImpacT of clImaTe change on Urban SeTTlemenTS In colombIa
level play a major role in determining the sustainability of the relationships existing in a determinate habitat. These factors are arguably among those that will be the most relevant in shifting the stakes with regards to future opportunities for assets strengthening at the household, community and regional levels.
3.6 the 2nd National Communication on Climate Change: evidence of Potential impacts of Climate Variability on urban Areas
This section presents a review of the findings recently presented by IDEAM in its 2nd National Communication to the IPCC.
3.6.1 Landslides
Massive people resettlement is a common scenario in the Colombian Andes. Steep slopes are a common feature in the country’s morphology and have historically interacted with traditionally intense tropical rains to determine high levels of exposure to the risk of landslides in urban areas for a high number of departments.
Figure 15 illustrates IDEAM’s findings regarding the association between the number of monthly events of mass removal and the distribution of precipitation of the same period. Departments are ordered according to the number of events of mass removal from the highest to the relatively lowest; accordingly Antioquia (where the city of Medellín is located) and Caldas (Manizales) are those exposed to the highest risk. In spite of making clear that this is a preliminary insight that requires validation through the modeling of
other climatic variables, IDEAM reports a direct association between the intensity of precipitation and the number of events of mass removal requiring the resettlement of large numbers of people. IDEAM also found statistically relevant association between the phenomenon of La Niña and the highest number of landslides episodes.
3.6.2 Climate Variability impacts on Potable Water system
Interesting data allowing a closer look at a strategic urban sub-system is that presenting the historical trends of the impact of both intense hydro-meteorological and drought events on urban aqueducts. Table 7 presents aggregate data to provide an overall picture of this impact showing how many times potable water systems have been affected by a type of event and (third column) the associated number of times these same events not only affected the infrastructure but also the population (damage to personal safety, health or property) and (fourth column) the number of events with an estimated losses above 10 millions of Colombian pesos.
Out of 748 events ranging from interruption in service provision, severe rationing and damage to the infrastructure, 78% directly affected the population, while 3.9% produced financial losses greater than COP10 million, approximately USD5,000. These estimates possibly deserve revising because they seem underestimated in the face of the magnitude of the events and IDEAM has not produced a methodological justification of how it calculated the impacts. Besides, they seem to include damage only and not the cost of recovery. Finally, they seem to refer to the infrastructure and not to the social costs.

49
Chapter 3 THE IMPACTS OF CLIMATE CHANGE ON URBAN SETTLEMENTS
IN COLOMBIA: CONTEXT AND CRITICAL ISSUES
FIGUre 15: precipitation and disasters events in colombian departments classified as group 1 (high vulnerability)
Source: Ideam, Corrales et al. (2008), cited in IDEAM (2010: 288)
120
90
60
30
0
90
60
30
0
Jan
Feb
Mar
Apr
May Jun Jul
Aug
Sep
Oct
Nov De
c
Jan
Feb
Mar
Apr
May Jun Jul
Aug
Sep
Oct
Nov De
c
Jan
Feb
Mar
Apr
May Jun Jul
Aug
Sep
Oct
Nov De
c
Jan
Feb
Mar
Apr
May Jun Jul
Aug
Sep
Oct
Nov De
c
Jan
Feb
Mar
Apr
May Jun Jul
Aug
Sep
Oct
Nov De
c
Jan
Feb
Mar
Apr
May Jun Jul
Aug
Sep
Oct
Nov De
c80
60
40
20
0
100
75
50
25
0
160
120
80
40
0
300
250
200
150
100
50
0
Antioquia
Valle del Cauca
Cauca
Eventos mm
Eventos mm
Eventos mm
Eventos mm
Eventos mm
Eventos mm
Caldas
Cundinamarca
santander
135
90
45
0
400
300
200
100
0
400
300
200
100
0
135
90
45
0
250
200
150
100
50
0
250
200
150
100
50
0
Mis
sing t
ext
Mis
sing t
ext
Mis
sing t
ext
Mis
sing t
ext
Mis
sing t
ext
Mis
sing t
ext

50
The ImpacT of clImaTe change on Urban SeTTlemenTS In colombIa
taBLe 7: events related to climate variability affecting aqueducts in colombia 1987-2007
type of event No. of times it affected an aqueduct
No. of times the effects were directly felt by the populations
No. of events recording losses > 10 millions of CoP
Floods 309 245 17
Torrential rains 97 68 5
Landslides 205 158 7
Contamination 24 22 -
Draught 113 95
total 748 588 29
Source: IDEAM (2010 289), based on data from Desinventar (2009)
Even in 1997-1998 official records related to the phenomenon of El Niño indicated that out of 1,082 municipalities 780 reported a decrease in their capacity to provide water to the population. Out of these 780, 50 also directly reported having been directly affected by the El Niño. More generally, over the 1987-2007 period, the Atlantic Region, particularly the low and middle traits of the river Magdalena’s valley, and the Andean Region were the most harshly affected, including the large number of cities and villages.
3.6.3 impacts on Low-elevation Coastal Zones 29
Considering a sea-level rise in the order of 1 metre by 2100, up to 4,900 Km2 of coasts would be permanently flooded (IDEAM, 2010). The Caribbean coast had a population of 2,103,787 in 2000 and 55% was estimated as severely exposed to the risk of flooding. Up to one million people (roughly 90% of the potentially affected) live in urban areas such as Cartagena, San Juan de Urabá, Turbo, Ponedera and Puerto Colombia. On the Pacific coast IDEAM estimates a population of 462,457 inhabitants in 2000. Of these 41% would be affected by a sea-level rise of one metre by 2100, with the estimate calculating that up to 68,258 urban dwellers would be directly affected. Among the main municipalities of the Pacific coast are Buenaventura, Tumaco, El Charco, Nuquí, Juardó, Santa Bárbara and Olaya Herrera (see figure 6).
29 This section largely draws from data provided by IDEAM 2nd National Communication to the IPCC, particularly section 4.8.17.3 ‘Vulnerabilidad del sistema socioeconmómico’, pages 293-294.

51
Chapter 3 THE IMPACTS OF CLIMATE CHANGE ON URBAN SETTLEMENTS
IN COLOMBIA: CONTEXT AND CRITICAL ISSUES
3.7 Case studies of urban Vulnerability to environmental risk
While section 2.4 has dealt with the issue of urban development policies, this section presents four case studies focusing on the interplay between bio-physical and social vulnerability.
3.7.1 Case study 1 – bogotá
Bogotá, the capital of Colombia, is a clear example of how complex adaptation to climate change will be in the future. More urgent measures will have to be put in place in the face of the intensification of extreme weather-related events, not to talk of other impacts such as those expected on human health and food security. The case presented here deals with just one critical issue, how to sustainably manage environmental risk in the face of multiple bio-physical and social drivers. Altos de la Estancia is a settlement located in Ciudad Bolívar. Since 1998 the corresponding mountain area began a process of detachment from the main mountain body which has continued ever since. Already 110 ha. have disappeared, an area as big as the major park of Bogotá, the Simón Bolívar, together with 4,000 housing units and surrounding infrastructure. From 1, 165 housing units at risk in 2000, the figure rose to 4,752 in 2004 and it is estimated to have surpassed the 5,000 units threshold in 2010 (Rubiano, 2009 30).
The short case study presented in this section can be considered as a follow up to a number of issues already presented by the UN-HABITAT Global Human Settlement Report 2003 that included a case study on Bogotá, also from the same locality of Ciudad Bolívar, where the area of Altos de la Estancia is found. Environmental risk management (ERM) is already recognized as a key issue for the sustainability of cities (Pelling, 2003). However, as the pointed out by the 30 See: http://biblioteca.uniandes.edu.co
International Institute for Environment and Development (IIED) future adaptation policies will challenge established practices in the face of the likely impacts of climate change (Satterthwaite et al., 2007). Indeed, ERM faces structural challenges such as the potential alternation or even destruction of already delicate livelihoods of a large number of households and individuals, often in the order of thousands or even hundreds of thousands, besides fundamental governmental challenges that the authors detail according to the following points:
i. “Providing infrastructure and services (perhaps with some contracted to private enterprises or non-government organizations);
ii. Guiding where development takes place – for instance influencing where urban settlements develop and where they do not and what provision they have to avoid floods, fires, etc;
iii. Regulating building design and construction (including support and training for builders, especially those who are active in building within low-income settlements);
iv. Regulating hazardous activities that can produce disasters (including industries and transport);
v. Influencing land availability (through land-use regulations, zoning and bureaucratic procedures for buying or obtaining land and what can be built on it) – the quality of land-use management influences the proportion of poorer groups having to live on hazardous or disaster-prone sites;
vi. Encouraging and supporting household/community action that reduces risk (for instance better-quality housing, safer sites, good infrastructure and good disaster preparedness);
vii. Providing “law and order” which should

52
The ImpacT of clImaTe change on Urban SeTTlemenTS In colombIa
also act to protect low-income groups from risk;
viii. Coordinating and supporting links between disaster avoidance and disaster preparedness – for instance ensuring that all tasks above integrate with agencies responsible for disaster response”.
(Satterthwaite et al., op.cit., 2007: 35).
This case-study concentrates on the mass removal process that occurred in the area know as Altos de la Estancia. This sector is located in the locality of Ciudad Bolívar in the southern part of the city and is delimited by a number of water courses such as the Santa Rita, Santo Domingo and Carbonera (see figure 16). According to Rubiano (2009), in the mid 1990s, once the area had been abandoned by the companies extracting building-construction materials, a slow process of land occupation of the slopes by economic migrants and internally displaced people began. In 1998-9 the first alerts of landslide were noted by the authorities and the DPAE but no major action
was undertaken besides technical studies and in year 2000 a technical resolution indicating the need to resettle 180 households. Between August 2001 and May 2002 the inner area of Altos de la Estancia called Cerro del Diamante increased its instability and a massive process of evacuation of 900 households began according to a technical concept by DPAE. Figure 17 illustrates the way geological risk is distributed across the areas with the red area indicating high risk not suitable for any kind of intervention. Figure 18 illustrates that the actual occupation of the area in 2009 still presents a great overlapping with the red areas indicating zones most at risk of landslide. A very detailed recount and analysis of official intervention by Rubiano (op.cit.) illustrates that the latter were mostly directed to monitoring the physical vulnerability of the area, mitigating risk through either mass evacuation or initial resettlement, as well as through technical intervention to consolidate those areas of the slopes that were suitable to environmental engineering intervention.
FIGUre 16: hydrographic map of the Urban Sector ‘alto de la estancia’ - bogotá
Source: (Rubiano, 2009:132). Based on DPAE (2008)

53
Chapter 3 THE IMPACTS OF CLIMATE CHANGE ON URBAN SETTLEMENTS
IN COLOMBIA: CONTEXT AND CRITICAL ISSUES
FIGUre 17: map of the risk for landslide in the Urban Sector ‘alto de la estancia’ - bogotá
FIGUre 18: land occupation and Use in the Urban Sector of alto de la estancia (bogotá)
Source: (Rubiano, 2009: 134). Based on DPAE (2008)
Source: Rubiano (2009: 135)

54
The ImpacT of clImaTe change on Urban SeTTlemenTS In colombIa
Rubiano analyses more than 70 interventions, comprising monitoring, physical vulnerability and risk reduction as well as households’ removal, that were carried out between 1999 and 2006 before elaborating an integrated plan for risk mitigation. Risk management in Bogotá is a concerted process between DPAE, SDIS and other agencies within the local administration carried out according to carefully designed procedures that consider the immediate needs of the population. Thus it is a scenario that is quite far removed from the mass evictions witnessed for a long time in Latin America between the 1960s and the 1980s, and even in more recent times.
Nonetheless the dynamic of social vulnerability is virtually untouched by these institutional interventions and the notorious process of land occupation of the urban poor at the mercy of speculators and without the protection of the local administration is a story the Ciudad Bolívar shares with thousands of other locations across the country and the continent too. As McGranahan, Mitlin and Satterthwaite put it, the demands of the urban poor “for shelter and environmental services are not well met by markets, which favour areas where property rights are well defined and people are willing and able to pay for the full range of household services” (McGranahan, Mitlin and Satterthwaite, 2008: 77).
The risk and environmental management plans do not pay attention to the social dimensions and process that produced the disaster. The Secretaría Distrital de Ambiente has been formulating between 2005 and 2009 an environmental management plan articulated in five specific projects centred on the recuperation of 50,000 of woodland in the area, but with eucalyptus, that is, a highly water consuming type of tree. At the same time, the risk management plan by DPAE, while considering the same elements, also indicates the need to tackle soil erosion by canalizing the water flows to provide sewage
connections to two barrios (Perdomo and Rosales), rather than planning a strategy for waterbeds’ recuperation in conjunction with the community (Rubiano, op.cit., 2009).
Besides the root causes, Rubiano also points to the fact that local institutions have neither conceptualised nor operationalised two other key aspects that link the physical exposure of the territory to the social vulnerability of the urban poor: a) the impact on the productive structure of society at the local level, that impinges upon often delicate networks and mechanisms created by the local communities to support their livelihoods and, b) damages affecting the social structure of the community, such as schools, hospitals, communal centres (ibid.). These two factors she highlights leave a sequel of impact that unfolds over time, diminishing communities’ resilience in so far they reduce their ability to absorb them, which as Bebbington (1999) has pointed out, always relates to the cultural use of capitals and resources.
Institutional disarticulation, lack of sensibility and capacity to act upon the determinants of social vulnerability and the conditions that generate disasters illustrate the complexities of a more comprehensive socio-environmental governance, such as that required by adaptation to climate change, even within a city that in many respects has shown remarkable improvements in risk management, transparent and participative governance or poverty reduction over the last decade. It indirectly poses a question about the challenges faced by medium and small cities where the institutional capacity and civil society organization are much less developed.
3.7.2 Case study 2 – Cartagena: an Assessment of its ecosystems and Adaptation Constraints
Located on the northern coast of Colombia and with a population of 845,851 inhabitants according to the Census of 2005, Cartagena

55
Chapter 3 THE IMPACTS OF CLIMATE CHANGE ON URBAN SETTLEMENTS
IN COLOMBIA: CONTEXT AND CRITICAL ISSUES
de Las Indias is one of the three main ports on the Colombian Caribbean. IDEAM and the oceanographic institute INVEMAR have carried out studies to estimate the degree of bio-physical impact regarding a sea-level rise of 1 metre by 2100. Table 8 reports projected data regarding the number of people potentially affected. The number of people is relatively high. It would be incorrect to affirm that it corresponds to one third of the actual total population because we do not know exactly what the population will be in 2100 31.
31 IDEAM’s 2nd National Communication to the IPCC does not mention if the number of affected people are estimated including in the calculation the population projection of each locality or not. This is a critical fault that is also found in many other parts of the same publication.
32 Sub-urban units are called localidad en Cartagena as in most Colombian cities. The names of these localidades have been left as in Spanish.
33 This is the figure reported in the original by IDEAM
Betancourth (2007), including elements of analysis from the case of Cartagena in a broader reflection on urban ecological sustainability, has pointed out how infrastructure will have to include the concept of eco-efficiency in order to manage to fit climate change within traditional planning approaches. The city has a great lagoon, the Ciénaga de la Virgen, once the place where mangroves used to grow and a symbol of bio-physical and social lack of sustainability and low resilience. Nowadays the Ciénaga is occupied by thousands of huts of internally displaced people and present the features of a severely run down human settlement. Betancourth depicts the situation as it follows:
taBLe 8: projection of no. of people affected by moderate and Severe flooding in cartagena by area (locality)
Data refer to an increase of sea-level rise of 1m. by 2100
Locality32 Communal government unit
People at risk for moderate flooding
People at risk for severe flooding
De la Virgen & Yuristica 4 21,885 45,274
5 26,086 53,093
6 No flooding projected 40,669
7 12,232
Histórica & Caribe Norte 1 10,935 11,500
10 5133 11,877
2 No flooding projected 8,786
3 51 11,520
8 No flooding projected 7,490
9 9,569
Industrial de la Bahía 11 No flooding projected 20, 492
12 27,471
13 9,551
14 23,988
15 10,378
total urban Area 59,956 308,558
Source: Vides (2008), cited in IDEAM (2010)

56
The ImpacT of clImaTe change on Urban SeTTlemenTS In colombIa
FIGUre 19: localization of manizales within the Department of caldas and colombia
Source: http://es.wikipedia.org/wiki/Archivo:MunsCaldas_Manizales.png
“Unplanned urban and industrial development in Ciénaga de la Virgen and Cartagena Bay’s has resulted in a lack of sewage treatment that has deteriorated the environment in these areas. Additionally, garbage accumulation and infrastructure have interrupted water exchange between the Ciénaga de la Virgen and the sea, resulting in further damage” (Betancourth, 2009: 8).
3.7.3 Case study 3 – manizales34
Manizales is located in a central department in the middle of the Andean central range in an area known as eje cafetero35 (figure 19). It was established in 1834 by the colonizer Fermín López and populated in 1869 through a distribution of land to colonos’ families. It soon became an educational centre and an area renowned for its coffee production.
34 This case study largely draws on Chardón (2004)35 Literally coffee axe, or coffee strand.
Built on steep slopes, Manizales is also known as the San Francisco of Colombia. Figure 20 already gives the reader a fair idea of the way it was built. The average temperature is 18°C and there are two rainy seasons over the year. It receives 2,000 mm of rain per year. Its climate favours the thriving of humid tropical forest. According to the last census (2005), Manizales has a population of 342,620 inhabitants projected to increase to 361,39336 by the National Statistical Department of Colombia (DANE). The city is exposed to the risk of earthquakes since it was built on seismic grounds.
Precipitation in Manizales is often intense and can be defined as torrential, which exacerbates processes of erosion and favours landslides, whereas some sectors of the city are also exposed to flooding.
36 See: http://www.dane.gov.co/files/censo2005/PERFIL_PDF_CG2005/17001T7T000.PDF

57
Chapter 3 THE IMPACTS OF CLIMATE CHANGE ON URBAN SETTLEMENTS
IN COLOMBIA: CONTEXT AND CRITICAL ISSUES
The history of Manizales is marked by speculation on land operated by coffee landowners and traders since the 1930s. The lack of popular and affordable housing reflects how politicians and planners have overlooked the issue since the first decades of the 20th century when changing production patterns increased the demand for land. From the 1950, as indicated in figure 15, people started to occupy the slopes, thus fostering a process of slum proliferation and unsustainable urban settlements.
As it happens with the majority of disasters, they are the result of a process through which restricted access to sustainable livelihoods and a poor asset base at the macro level combine with drivers at the meso and macro level that bear strong relationships with the unequal distribution of power within societies as much as with the presence of poor democratic and participative mechanisms (Wisner at al., 2006).
Chardón carried out a study of the global vulnerability of Manizales’ slums with a systemic approach that considers the spatial analysis into which the slum can be sub-
divided (barrios) as geo-systems that can be analysed from a multi-dimensional and multi-disciplinary perspective.
Her research on vulnerability to environmental hazards takes a similar approach to the widely known index elaborated by Cutter (2003). This is a combination of two main groups of variables, broadly responding to a bio-physical and social domains characterisation. In Chardón’s case these are the following ones:
Bio-physical variables group: previous disasters experiences; the typology of the slopes, the degree of erosion and the presence of land fillings.
Social variables group: the degree of sub-normality 37 of the barrio; socio-economic level; net population density; community-based organisations; functional organisation and accessibility.
Variables are analysed using the principal component method, from the family of 37 Many scholars in Colombia refer to slums as sub-normal
settlements. This is a normative definition that includes a pejorative element. The case study report has been literally translated to preserve as much as possible the original approach of the author.
FIGUre 20: manizales’ expansion towards risk-prone areas
Source: Chardón (2004: 4)
sur Norte
Rií Chinchiná Río Olivares
la Avenida Satander
Eje de
Quebrada
QuebradaMinitas
El Guamo
2
3
3
aa
2
1

58
The ImpacT of clImaTe change on Urban SeTTlemenTS In colombIa
factorial analysis and five typologies are identified with the help of geo-information systems (GIS)-based cartography. They are depicted in different colours from the most vulnerable (black) to the least vulnerable (white). The study concludes that while all Manizales’ barrios are vulnerable to some degree, a correlation exists between the drivers represented by natural conditions and socio-economic factors. The highest, relatively plain and safe part of the city is occupied by middle and high classes, with low-income groups occupying the lowlands and the slopes and thus facing the highest risks of being affected by landslides and floods. In the face of more extreme hydro-meteorological events, these areas remain most likely to be affected, reiterating the overlap between exposure to risk due to development and climate change-related dynamics.
The usefulness of this study shares many common elements with Cutter’s approach. The GIS-based analysis of vulnerability-related variables provides useful information for decision-making and planning processes, while it reaffirms the overlap among bio-physical and socio-economic exposure to a complex set of risks that, combined with a lesser resilience, make both slums and its residents the most likely to be affected by potential climate change impacts in Manizales.
However, these kinds of approaches that tend to make a great synthesis of complex dynamics tend to lead to the following two crucial critiques: first of all, they are descriptive and do not manage to explain the “whys” and “hows” of how vulnerability is built over time as social vulnerability approaches do, within and without the domain of disaster studies 38. Second, in spite of their practical usefulness for applied policy, they can be questioned on scientific grounds considering two elements: a) the variables they employ are not explicative of any causal process within society as it does
38 See Blaikie at al. (1994); Moser (1998), Pryer (2003) and Lampis (2007).
not explain much to say that people are poor because they have a low-income level or that to live on risk-prone areas is dangerous and exposes people to the effect of extreme weather events; b) the fact that they require considerable resources to produce insights that the literature on participative and community-based vulnerability analysis has already and consistently produced over the last 20 years.
It is important to conclude this short case study on Manizales by saying that the city has continued to produce a number of coordinated efforts between the administration and the community that, besides the already mentioned guardianas de la ladera, has tackled the issues of risk identification, reduction, management and transference. The city remains an internationally-recognised example of innovation in risk management practices and Cardona (2005) one of its most representative scholars who significantly contributed to this positioning.
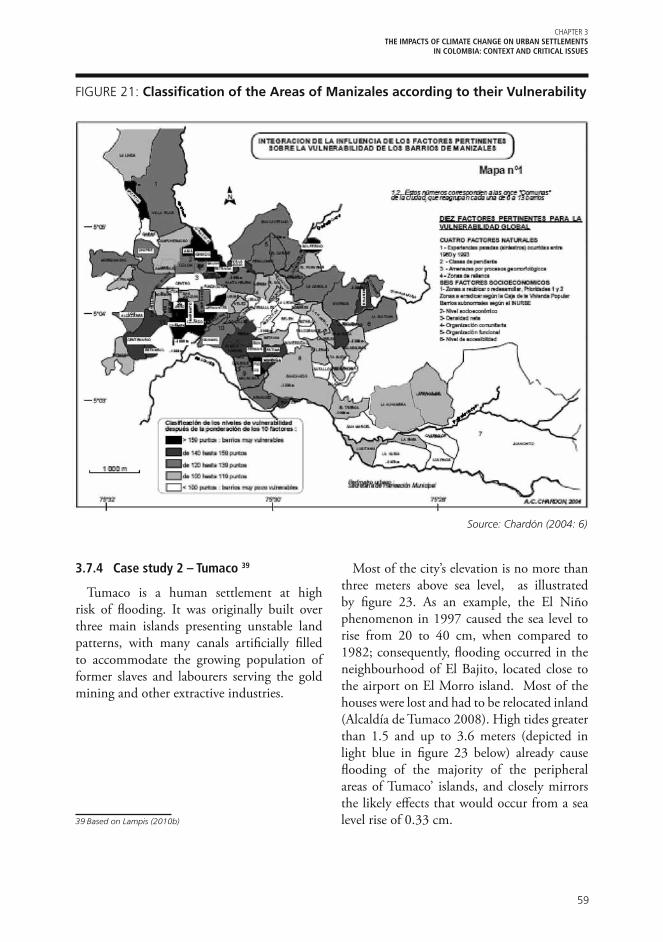
59
Chapter 3 THE IMPACTS OF CLIMATE CHANGE ON URBAN SETTLEMENTS
IN COLOMBIA: CONTEXT AND CRITICAL ISSUES
3.7.4 Case study 2 – tumaco 39
Tumaco is a human settlement at high risk of flooding. It was originally built over three main islands presenting unstable land patterns, with many canals artificially filled to accommodate the growing population of former slaves and labourers serving the gold mining and other extractive industries.
39 Based on Lampis (2010b)
Most of the city’s elevation is no more than three meters above sea level, as illustrated by figure 23. As an example, the El Niño phenomenon in 1997 caused the sea level to rise from 20 to 40 cm, when compared to 1982; consequently, flooding occurred in the neighbourhood of El Bajito, located close to the airport on El Morro island. Most of the houses were lost and had to be relocated inland (Alcaldía de Tumaco 2008). High tides greater than 1.5 and up to 3.6 meters (depicted in light blue in figure 23 below) already cause flooding of the majority of the peripheral areas of Tumaco’ islands, and closely mirrors the likely effects that would occur from a sea level rise of 0.33 cm.
FIGUre 21: classification of the areas of manizales according to their vulnerability
Source: Chardón (2004: 6)

60
The ImpacT of clImaTe change on Urban SeTTlemenTS In colombIa
FIGUre 22: Tumaco within its Surrounding region and within colombia
Source: Corporación OSSO (2003: 24)

61
Chapter 3 THE IMPACTS OF CLIMATE CHANGE ON URBAN SETTLEMENTS
IN COLOMBIA: CONTEXT AND CRITICAL ISSUES
Environmental and socio-economic degradation are a net effect of political power imbalances, cultural and social exclusion difficult to disentangle in the bay of Tumaco, which has traditionally been one of the main resources for people’s livelihoods. These processes of degradation have worsened due to the overlapping of industrial activities (i.e., palm oil, shrimp harvesting and the timber industry, see figure 24).
Human activities, such as small scale commerce and untreated domestic waste, mostly dumped directly in the water from pole house inhabitants, dramatically increases environmental degradation. This is magnified by poorly controlled industrial processes and also doubled in terms of environmental impacts by the nearby river Mira that increases the speed of sedimentation in the bay. Consequently, mangroves have been severely
40 Light blue are at risk from medium tides, yellow areas: at risk from high tides.
affected and in the worst case scenario, the great majority in the bay has a rate of survival of just 12.75%; 47.62% under more optimistic scenarios (Alcaldía de Tumaco 2008). The net result is the collapse of the ecosystem of the internal bay of Tumaco and the virtual extermination of the fisheries industry. The impact on the livelihoods of the many families of fishermen has been dramatic, compelling them to move their fishing activities further from the bay where they cannot compete with the more sophisticated fishing boats from Ecuador.
Approximately 65% of the 160,000 inhabitants of the central island of Tumaco live in pole houses, such as those in figure 25. The situation of public service provisioning including water, sanitation and electricity has not improved. For instance, in the neighbourhood of Las Americas 41, one of the
41 In Photo 1, this neighbourhood is located on the longer side of the island of Tumaco, the most densely populated area is at the centre of the photo.
FIGUre 23: areas at risk from flooding in Tumaco40
Source: DIMAR (2001)

62
The ImpacT of clImaTe change on Urban SeTTlemenTS In colombIa
FIGUre 24: Timber Industry on Tumaco’s bay
Source: Lampis (2008)
three neighbourhoods where fieldwork was conducted, the percentage of people living in pole houses is 91.7%, according to official statistics, while those who can only afford to rent one room in a pole house is 7.65%. Virtually no other type of housing exists for low-income households in Tumaco. While official data (DANE 2006) report a rate of 77% connected to electricity, up to 98% of interviewed households had electricity, thus showing the probable existence of illegal connections. According to official data, only 21.3% of the population has no water service; while in the households interviewed, this percentage rises to 49.46%. Most of the existing water connections for low-income households consist of an illegal connection (Photo 3, middle photograph) made by a pipe often passing through enormous quantities of solid waste floating in water severely contaminated by human excreta. There is absolutely no waste collection along the whole ring of pole houses on the main island of Tumaco. Up to
60% of interviewed households have suffered some type of flooding, mostly related to the tidal cycle that peaks each fortnight.
For a large number of households, critical life events powerfully impact the fragile assets upon which they depend. Their livelihoods are pushed to the verge of collapse; often close to below the threshold which guarantees the entire household a decent meal at least twice a day. Social vulnerability is a condition depending on the capacity to foresee, prevent, cope with and recuperate from life events that imply the loss of material and intangible assets (Lampis, 2007).
People living in the pole houses along the perimeter of Tumaco’s islands can hardly prevent critical life events, as they have little resiliency. Here, in-depth qualitative interviews were conducted in order to analyze vulnerability patterns. Out of a random sample of 54 households, only 15 said they did not have anything worth mentioning

63
Chapter 3 THE IMPACTS OF CLIMATE CHANGE ON URBAN SETTLEMENTS
IN COLOMBIA: CONTEXT AND CRITICAL ISSUES
FIGUre 25: Typical pole houses in Tumaco (top), illegal water connection (middle) and children playing in polluted waters (bottom)
Photos: Lampis (2008)

64
The ImpacT of clImaTe change on Urban SeTTlemenTS In colombIa
over the three years previous to the interview. Vulnerability patterns connect critical life events to their related causes, consequences and coping strategies (ibid).
On the whole, there are three groups of critical life events affecting households. One such life event consists of the death of a household member related to causes associated with health (mostly illnesses) and violence (mostly assassinations due to interpersonal problems or urban violence). A second group of critical life events concerns economic problems related with unemployment and indebtedness, and the third major group relates to internal displacement, reflecting at the micro level the broader dynamic of rural-urban migration due to the armed conflict. Tumaco is a distinct example of how a multi-layered analysis of macro, meso and micro-level constraints may illustrate the interaction of a number of critical failures in terms of human rights, human needs and human security. This point is highly relevant on three grounds with regards to the debate on adaptation policies to GEC.
There are three main reasons that justify the relevance of an asset and vulnerability-based entry point to the issue of adaptation to climate change with emphasis in low-costal urban areas:
1) Mainstream IPCC’s lead approaches to climate change have produced a dual (mitigation – adaptation) analytical framework. The issue of how to strengthen the asset-base of individuals and households has not been mainstreamed so far as reflection on the capacity to adapt goes.
2) Mainstream reflection on adaptation in low and middle-income countries has so far not paid enough attention to the infrastructure of human settlements, nor financial and institutional limitations.
3) A reflection on the capacity to adapt of communities and institutions, which would entail scaling up asset-based vulnerability analysis to more complex units of analysis, is not only still lacking but at the same time one of the greatest intellectual challenges posed in relation to a broader interdisciplinary research agenda.

65
Chapter 4 LOW-INCOME GROUPS’ ADAPTATION TO CLIMATE CHANGE IN COLOMBIA
Worldwide, scholars and organizations are seeking to evaluate the impact of climate change on cities and urban dwellers, among which the poor generate special concern as the scientific community has indicated that the likely impacts of climate change will disproportionally hit the poor (IPCC, 2007b). However, when the analysis concentrates on impact evaluation, the scale of climate modelling, the lack of time series regards of key indicators and the possibility of clearly disentangling climate from environmental and social variables to establish precise causal relationships, are the main obstacles to defining processes occurring at the local level. Indeed, a direct causal relationship between the impact of climate change on climate-related vital resources and livelihoods has not been demonstrated; neither in Latin America nor in Colombia at the local level yet. Therefore all impacts presented in this chapter have to be considered as indirect ones. The predictive capacity of the analysis relates to the evidence phenomena related to climate variability and, if the predictions regarding the impacts of climate change at the regional and local level are to be confirmed, the analysis may offer insights about what urban settlements and low-income groups might be facing. There are a number of constraints to be taken into consideration when seeking an answer to these questions, not least the fact that a variation in the average annual air temperature of between 2°C and 4°C would likely entail unforeseen transformations of social and economic relationships, with implications concerning the foundations of ethical principles governing society, the stability of institutions and the processes that
articulate collective social relations. It is likely that all this would be significantly shaken by transformed productive and reproductive conditions in the face of a changed climate.
When thinking of impacts to a more local scale, there are three considerations to be made. First, as mentioned above, at the city level the impacts generated by poverty drivers and climate variability are not easily discernible from those caused by climate change. Second, impacts depend to a large extent on the stability of the socio-economic context and the degree of human security that is granted to people in a given geographical context. Third, in most cases, besides a few major cities, there is no impact baseline apart from a very limited number of indicators and indexes. Even when there are available data they come often in an aggregate form, which renders making robust affirmations about the situation of specific social groups very difficult. As a general rule, indicators that may prove the most useful to analyse the capacity low-income groups have to adapt to the direct impact of climate variability should respond to two features: 1) they should be dynamic, that is, capable of capturing the behaviour of assets and resources that are important to allow effective/high resilience in the face of the unfolding of live events, consequences and strategies over time. 2) They should be able to capture changes in well-being as well as in the entitlement to rights such as those to food and nutrition or to vital basic services such as water and electricity.
To think of the potential impacts of climate change implies innovating and considering what kind of data and what type of new
Chapter 4 loW-Income groUpS’ aDapTaTIon To clImaTe change In colombIa

66
The ImpacT of clImaTe change on Urban SeTTlemenTS In colombIa
indicators we may need to perform innovative evaluations and assess relatively unknown processes. Traditional indicators of social protection, domiciliary services provision and urban infrastructure availability have been fully recognised for their importance and it cannot be denied that if many cities had them, even in minimal proportion, policy analysis and political discourse would be undoubtedly fostered. However, even less attention has been paid in urban areas to the collection of data to measure and value what assets and resources allow people to be resilient in the face of change. We need a better understanding of the control people have on and the use they make of tangible assets and intangible assets (Bebbington, 1999).
These play a major role in the potential for effective adaptation. The case studies presented in chapter 3 provide elements that back the need of a more in-depth analysis of an asset-based adaptation perspective. Although not directly highlighted in the case studies’ section to re-examine the relationship between assets use and risk perception, its cultural and geographical specific features are key elements on the basis of which social groups enter adaptation processes.
This chapter is also the first of two that present data and case studies to assess future impacts. It analyses relevant, nationally available indicators that indirectly measure the capacity of low-income groups to adapt and cope with the likely impacts of climate change. Socio-economic and demographic data are a good proxy to analyse how the socio-economic context prevents or opens up new opportunities for adaptation. The chapter revises national data to assess recent changes in Colombian cities and regions’ in income distribution, progress towards higher level of Human Development (HD) and the achievement of the Millennium Development Goals (MDG).
4.1 income Poverty and Distribution
In Colombia, income poverty is measured on the basis of a national poverty line, estimating income using consumption patterns as a proxy. Data are collected by the national statistical service (DANE) through the National Household Survey, and generally made available to the public after having been analysed by the National Planning Department (DNP from its Spanish acronym). This section presents poverty trends between 2002 and 2008 for the national poverty line, the extreme poverty line as well as for the same two indexes but for the 13 biggest urban areas in the country.
Between 2002 and 2008, income poverty dropped 7.7 percentage points (table 4.1.) at the national level, from 53.7% to 46.0%. This drop can be historically framed, remembering that, according to the data provided by the same institutional sources, the incidence of income poverty was 49.5% in 1995 and 57.5% in 1999 (López and Núñez, 2007). Thus, although income poverty dropped almost 10 percentage points since the beginning of the last decade from the peak it had reached in 1999, after the harshest economic crisis experienced by the country over the last 70 years, it has not improved much compared with its level 15 years ago.
Extreme poverty 42 decreased at the national level by a modest 1.9% between 2002 and 2008. When dividing this period of time in two shorter ones, extreme poverty levels rose in the most recent years. While extreme poverty had dropped four percentage points between 2002 and 2005 down to 15.7% (still a negatively remarkable figure by absolute
42 In Colombia the concept of chronic poverty has not been mainstreamed, nor have most of the approaches that build a new understanding of poverty around the concept of time, duration and resilience in the face of critical life events, such as chronic poverty and, before, that, vulnerability. The concept of extreme poverty (at times referred to as “misery”) refers to a level of, namely, extreme, income poverty whereas household income is barely sufficient to provide for physical survival, measured as the capacity to purchase an extremely basic food basket.

67
Chapter 4 LOW-INCOME GROUPS’ ADAPTATION TO CLIMATE CHANGE IN COLOMBIA
standards), over the next three years it reverted to the previous upward trend, reaching 17.8% in 2008. It is worth looking back at 1995 in this case too. Over a period of 15 years, extreme poverty did not change significantly, it was in fact at 15.5% in 1995, meaning that no significant change was achieved. As indicated by the Social Panorama for America Latina recently issued by ECLAC, the recent rice in food prices had a significant negative effect on the rise of extreme poverty in many America Latina countries. An interesting notation indicates how critical the reflection about whether transformations of the greatest magnitude such as those related to climate change can be faced by means of policies based on conditional transfer programmes is. These are tied to financial resources at the national level and tend to run short when crisis hits, thus losing their supposed counter-cyclical nature. Climate change impacts compel us to reflect on the relationship between social protection and economic, social and cultural rights, because the issue of the very possibility to improve and sustain life in the cities of the future, as in the world, needs to confront the themes of resources availability, distribution and equal access.
Urban income poverty has been traditionally lower on an aggregate basis in Colombia than that indicated by national figures due to the high incidence of poverty in rural areas. Between 2002 and 2008 it dropped in the 13 main urban areas by 9.6 percentage points from 40.3% to 30.7%, and by 7.1 percentage
points, from 60.2% to 53.1% in all the other urban areas. In those same 13 main urban areas, extreme poverty decreased by 2.6% over the same period; while it dropped by 5.6% in all other urban areas. However, the importance of this last improvement is diminished by the fact that if the period considered is the one between 2005 and 2008 extreme poverty increased by 3.9%. In terms of inequality, Colombia has been challenging Brazil to the notorious record of the most unequal country of the world over the last two decades. In 2008, according to the GINI index, inequality was as high as it was 2002 (0.59) at the national level. Table 4.1 shows that urban areas recorded very modest improvement in the GINI index over the same period of time. A GINI coefficient of 0 means perfect equality within a given distribution; in the case of income that each individual say in a city has the same income as anybody else. A GINI of 1 means absolute inequality, that is, only one person has the whole income of the city under her control.
Overall, the analysed changes in income poverty present a negative picture as far as the implication in terms of adaptation to climate change. Income-poverty has not been reduced below the level where it was 15 years ago, nor has inequality in income distribution improved, offering diminishing reasons to believe that in the future many millions will be able to count on their own means and capabilities to face worsening conditions.
National 13 main urban Areas rest of urban Areas
2002 2008 2002 2008 2002 2008
Income poverty 53.7% 46.0% 40.3% 30.7% 60.2% 53.1%
Extreme poverty 19.7% 17.8% 9.4% 6.8% 23.9% 22.2%
Inequality 0.59 0.59 0.56 0.55 0.54 0.51
Source: MESEP (2009), on the basis of data from DANE
taBLe 9.1: poverty and Inequality in colombia 2002-2008

68
The ImpacT of clImaTe change on Urban SeTTlemenTS In colombIa
4.2 multidimensional Poverty as an Approach to the Capacity to Adapt
The Conditions of Life Index (CLI) has been calculated in Colombia since 1997. Initially developed from reflections that were central in the debate of the 1980s on what constitutes the core of the standard of living, the index rests on the idea that goods and commodities do not grant access to well-being, but provide individual agency with endowment for doing and being, which are key components toward the improvement of the quality of life. Goods and commodities are always given within a set of socially desirable and technically feasible capabilities. For example, in a post-nuclear war society the basic capability of living a long and healthy life would not have the almost universal recognition it has in contemporary society.
The index combines in one measure variables related to a) physical resources at the individual level, measured through the infrastructure; b) physical collective resources, measured through access to public services; c) human individual resources, measured through the educational level of the household members; d) collective human resources, measured through the composition of the household 43. The index allocates to each household a score between 0 and 100 and allows for the ordering of households along a continuous scale of higher or lower quality of life.
The analytical assumption when presenting CLI data is that a reduction in multidimensional poverty is a contribution towards adaptation insofar as it indicates two types of changes: a) an improvement in living standards and b) a greater potential for further improvement. Overall improvements in living standards as well as in each of the component of the CLI need to be analysed separately. For instance, improvements in individual
43 It follows the ex – ante income estimation of the household according to Hicks (1939), cited in PNDH (2005).
and collective endowments may have a very direct effect on the capacity of low-income households to adapt. This is generally the case with the up-grading in the quality of housing, sewage systems, sanitation and potable water, as well as of roads and other urban equipment. However, as much as income, the CLI is not a direct measure of the adaptation capacity for a number of reasons. First, adaptation is a multi-dimensional process that cannot be reduced to the presence or absence of physical risk, or to the higher or lower quality of housing, infrastructure and public services. Second, adaptation is a relational process that entails that the agency of people finds a positive and reinforcing response within organisations and institutions both from the public, the private and the community sphere. Third, an improvement in the elements that are usually associated with well-being does not mean that assets and capitals are transformed in final achievements in terms of well-being. Nonetheless, in the absence of a direct estimate of adaptation, the CLI is an interesting proxy of the potential to adapt and an upward trend over time would certainly indicate that the assets and resources available to people have increased and provided them with greater security and less vulnerability in the face of changing conditions.
Table 4.2 presents a comparison of the CLI across the last two implementations of this national survey. Over the period 2003-2008 the country improved its conditions overall, but with a number of key relevant inequalities and asymmetries. The absolute distances between Bogotá and the rest of the country remain wide in terms of the condition of life indexes as far as averages (totals) are concerned. So do those between the most industrialised regions (Bogotá, Antioquia, Valle and the Central region) and the rest of the country. The urban vs. rest of the country divide is constantly large, with distances being abysmal even in those regions that do not fare well at the urban level.

69
Chapter 4 LOW-INCOME GROUPS’ ADAPTATION TO CLIMATE CHANGE IN COLOMBIA
When looking at the changes over time, the important Atlantic cities of Barranquilla and Cartagena recorded the least improvement between 2003 and 2008; only 2.5 points overall and 2.6 at the urban level, while smaller urban settlements and rural areas actually lost out 0.5 points. In the Oriental and Central regions urban areas recorded relative gains over the rest of the country (small urban settlements and rural areas). In the Oriental region urban areas gained 5.3 points comparing 2003 and 2008, while the rest of the country only 4.3 points. In the Central region urban areas gained 7.3 points over the same 2003-2008 period and the rest of the country only 5.0. The Pacific region, Antioquia and Valle saw urban areas recording slightly smaller increases than the rest of the country (again DANE joins in just one category both small urban settlements and rural areas). In the Pacific region the rest of the country gained 7.9 points compared to the 7.3 of urban areas; in the department of Antioquia the rest of the country gained 3.7 points versus the 2.6 of urban areas and, finally, in the department of Valle the rest of the country improved its Conditions of Life Index by 7.1 points versus the 6.2 of urban areas. The absolute magnitude
of the change between 2003 and 2008 is also remarkably skewed with small urban areas and rural regions that scored still very low in the index gaining momentum, thanks to investments in infrastructure and education. More urbanised regions maintain nonetheless important distances compared to the rest of the country. The analysis of the component of the index presented below allows for a more in-depth understanding of the relevance of multi-dimensional analysis of poverty. Results related to components of the index such as housing quality and public services provision shed light on inequalities and policy making challenges of great relevance if adaptation to the future impacts of climate change by the urban poor is to be given a chance beyond rhetoric.
4.2.1 Changes and trends in the factors of the Conditions of Life index
This section presents an assessment of the changes occurred in the four factors that are used to measure the CLI over the period 2003 – 2008. These factors are i) Housing quality, which was meant to act as a proxy measure for physical resources at the individual level,
2003 2008
urban rest of the country
total urban rest of the country
total
Atlantic 75.0 52.5 68.3 77.6 52.0 70.8
oriental 79.7 55.3 71.2 85.0 59.6 77.1
Central 78.4 55.5 71.4 85.7 60.5 78.4
Pacific 72.5 49.7 60.0 79.8 57.6 67.6
bogotá D.C 85.3 85.3 89.6 89.6
Antioquia 82.4 57.7 76.3 85.0 61.4 79.6
Valle 80.6 63.1 78.3 86.8 70.2 84.7
san Andrés & Providence
74.2 74.7
orinoquia & Amazonía 72.9 79.3
total 80.0 54.6 73.8 84.7 58.6 78.8
taBLe 9.2: Standards of living Index 2003-2008 (Urban, rural and Total)
Source (DNP, 2009)

70
The ImpacT of clImaTe change on Urban SeTTlemenTS In colombIa
measured through the infrastructure; ii) Access and quality of public services, meant to be a proxy for the availability of physical collective resources, measured through a weighted index of the access to and quality of public services; c) Human capital, meant to be a proxy of human individual resources, measured through the educational level of the household members; and d) Collective human resources, measured through the size and composition of the household.
The core idea is that well-being is not a result of individual utility but it relates to the freedom that are provided to people by complex combinations of the potential provided to individual agency by endowments such as good health and the capacity to be educated as well as by collective capitals that allow to transform the potential of agency into realizations; for instance, through the interaction between the individual and the family, the group of peers, professional groups, institutions (the school, the religious community, etc.) and societal collective instances at large (the judicial system, the local government, the market, etc.).
i. Housing QualityThe quality of housing has long since
been considered a fundamental productive and reproductive asset in the literature on development and urban poverty (Hardoy and Satterthwaite, 1989; Moser, 1996). The relationship between a secure environment and safe housing and the health status is critical not only from the point of view of the connections between epidemiological impacts, bad housing and human development, but also in terms of the political economy of poverty and inequality. In fact, access to decent and safe housing relates to the distribution of power within society and to the way opportunities are redistributed within it.
Table 4.3 shows a worrying decline in the factor that weights a number of indicators related to housing quality in a large proportion of the Colombian regions. In the Atlantic the relative variation between 2003-2006 is -2.6%, in the Pacific region -3.9%, in the department of Valle del Cauca – 7.5% and in the islands of San Andrés and Providence – 3.2%. These negative changes indicate the existence of recent socio-economic and policy processes leading to significant fallbacks in a country that had constantly recorded improvements in the housing-related indicators over the previous three measurements of the index in 1993, 1997 and 2003.
These trends are all the more striking when considering that government documents published five years ago warned about the critical housing situation of the country. In the key development planning and political manifesto documents Colombia Vision 2019, which aimed to set out the social and economic goals for the country, the analysis was that:
“In spite of the great progress recorded in the Unmet Basic Needs Index, there still are worrying breaches within cities. In effect, big cities are characterised by the existence of belts of misery in which millions of people live in conditions of extreme poverty. Many of the inhabitants of these cities lack housing, live in crowded settlements or have no access to basic services. Precarious settlements represent the physical and spatial manifestation of poverty in cities, a situation affecting 1.3 million households. Within that toll, 63% live in housing with qualitative problems (mainly lack of sewage system and overcrowding), 20% in areas exposed to some kind of environmental risk and 17% in housing that has been evaluated as having no possibility to be physically up-graded” (DNP, 2005: 17).

71
Chapter 4 LOW-INCOME GROUPS’ ADAPTATION TO CLIMATE CHANGE IN COLOMBIA
2003 2008 relative variation 2003-2008
1. Atlantic 9.5 9.2 -2.6%
2. Oriental 10.6 10.8 2.0%
3. Central 9.7 10.3 6.0%
4. Pacific 8.8 8.5 -3.9%
5. Bogota D.C 12.3 12.3 0.2%
6. Antioquia 10.6 10.7 1.1%
7. Valle Cauca 11.3 10.5 -7.5%
8. San Andrés & Providence 10.8 10.5 -3.2%
9. Orinoquia y Amazonia (Urban)
9.9 11.4 15.0%
Source: Authors’ elaboration on the basis of DANE, Encuesta de Calidad de Vida 2003 and 2008
ii. Access and Quality of Public ServicesTable 4.4 confirms that in the Atlantic region and, to a lesser extent, the department of
Antioquia, key factors in the conditions of life that play an important role in adaptation to changing climate conditions have suffered a downward trend. The access and quality of public services declined 4.9% from the previous survey in the Atlantic region, which suffered the combined effect of internal displacement and the economic crisis. The Pacific region which contains the cities of Buenaventura and Tumaco presents the best relative gain, although the absolute variation should not be a reason for celebration given the critical condition of the region in terms of socio-economic indicators, often compared to those found in African countries by both official and non-official development literature in Colombia.
taBLe. 9.3: clI factor ‘housing quality’, values and relative variation 2003-2008
2003 2008 relative variation
1. Atlantic 19.9 18.9 -4.9%
2. Oriental 20.9 21.4 2.2%
3. Central 21.7 22.5 3.5%
4. Pacific 15.6 17.1 9.3%
5. Bogota D.C 26.9 27.1 0.6%
6. Antioquia 23.1 23.0 -0.4%
7. Valle Cauca 24.6 25.3 2.7%
8. San Andrés & Providence 16.4 15.5 -5.3%
9. Orinoquia y Amazonia (Urban) 22.7 24.6 8.2%
Source: Authors’ elaboration on the basis of DANE, Encuesta de Calidad de Vida 2003 and 2008
taBLe. 9.4: clI factor ‘access and quality of public services’, values and relative variation 2003-2008

72
The ImpacT of clImaTe change on Urban SeTTlemenTS In colombIa
iii. Human capitalIn terms of human capital, the country made significant gains throughout all its regions and
departments. As shown in table 4.5, the regions showing the most significant gains since 2003 are the Pacific and the Central ones, with 21.5% and 16.1%, respectively. The effect of the widespread efforts performed by conditional cash transfer programs, such as Familias en Acción, now part of Red Juntos, in terms of keeping young children well fed and in the educational system may have played an important part.
iv. Collective Human ResourcesData on the size and composition of the household show a positive trend in terms of relative
variation across all regions and departments. Again, the Pacific (+13.9%), Oriental (+ 10.9%) and Central (+ 9.5%) regions, together with the Valle del Cauca (+10.7%) department show the best gains. The advancements might have two contrasting reasons. On the one hand the positive effect of the demographic transition combined, on the other, with the statistically positive but socially detrimental effect of families mobilising more unskilled work into the labour market as a reaction to the critical situation of the job market in the country.
2003 2008 relative variation
1. Atlantic 26.3 29.4 12.1%
2. Oriental 26.5 30.2 14.1%
3. Central 26.1 30.3 16.1%
4. Pacific 23.4 28.4 21.5%
5. Bogota D.C 30.9 34.2 10.6%
6. Antioquia 27.7 30.6 10.5%
7. Valle Cauca 27.8 32.2 15.7%
8. San Andrés & Providence 31.6 34.1 8.0%
9. Orinoquia y Amazonia (Urban) 27.5 30.8 12.3%
Source: Authors’ elaboration on the basis of DANE, Encuesta de Calidad de Vida 2003 and 2008
taBLe. 9.5: clI factor ‘human capital’, values and relative variation 2003-2008
taBLe. 9.6: clI factor ‘size and composition of the household’, values and relative variation 2003-2008
2003 2008 relative variation
1. Atlantic 12.8 13.6 6.4%
2. Oriental 13.4 14.9 10.9%
3. Central 14.1 15.4 9.5%
4. Pacific 12.4 14.1 13.9%
5. Bogota D.C 15.2 16.0 5.8%
6. Antioquia 15.0 15.7 4.7%
7. Valle Cauca 14.4 15.9 10.7%
8. San Andrés & Providence 15.8 14.3 -9.5%
9. Orinoquia y Amazonia (Urban) 13.5 14.1 4.8%
Source: Authors’ elaboration on the basis of DANE, Encuesta de Calidad de Vida 2003 and 2008

73
Chapter 4 LOW-INCOME GROUPS’ ADAPTATION TO CLIMATE CHANGE IN COLOMBIA
100
90
80
70
60
50
40
30
20
10
0bogotá
%
Pobre
No Pobre
Valle de Cauca
orinoq uia-
amazonia
San andrés y Provi-dencia
antioquia Nacional Central oriental atlantica Pacifica
Graph 4: proportion of households in poverty according to the clI. ecv 2008
Source: Author’s own elaboration on the basis of DANE (2008)
4.2.2 multidimensional Poverty According to the Conditions of Life index
The CLI is used in Colombia to contrast income poverty measures with a multi-dimensional measurement of poverty. Along a continuum from 0 to 100, which is the range of values the index may take, the value of 69 is considered the cut-off point below which a household is considered poor in terms of conditions of life. Graph 4.1 reflects the high spatial inequalities in terms of conditions of life poverty. It indicates that most urbanized regions present a much higher proportion of non-poor households than regions that have a greater share of their populations in rural areas.
4.3 millennium Development goals
Colombia delayed the implementation of a governmental policy to pursue the achievement of the Millennium Development Goals (MDGs) until 2005, when the government published an official document, the CONPES No.91 (DNP. 2005), setting the goals for the subsequent years.
This section reviews the latest official data on the country’s advancement against the goals it set to achieve the MDGs. The tables presenting the data are structured in the following way. They present the goal the country has set for 2015 as well as the baseline it officially adopted and the latest measurement available. The tables are complemented by the goal set in the National Development Plan (NDP) for 2006-2010, i.e. during the term of the current government44. However, the case is that the MDGs were set as a political goal and a national commitment in year 2000, Colombia had not signed any specific treaty that put specific pressure on national institutions to dedicate special effort to the achievement of a number of goals. Therefore, a baseline dated 1991 has only technical meaning but no policy and somewhat politically doubtful significance.44 The baseline of most indicators is calculated by DNP going back
to the beginning of the 1990, which poses some legitimate questioning regarding the meaningfulness of the assessment of the country’s performance, especially when the analyses were to be supported by indicators focusing on the relative improvement comparing the baseline year and the year of the last measurement. In fact, it is very much legitimate to expect that the country will have trodden a certain positive upward path in a number of indicators and that the comparison between, say, year 1991 and 2005 will show positive but not impressive achievements.

74
The ImpacT of clImaTe change on Urban SeTTlemenTS In colombIa
2015 goal baseline (1991)
Last measurement
National Development Plan goal 2006-2010
mDg 2015 goal
To reduce the percentage of people in poverty to 28.5% 53.80% 45.1% (2006) 35% 28.50%
To reduce to 8.8% the percentage of people living in extreme poverty
20.40% 12% (2006) 8% 8.80%
To reduce to 3% the number of children with global malnourishment (weight for age)
10% (1990) 7% (2005) 5% 3%
Source: Departamento Nacional de Planeación (2007)
Table 4.745 provides three main insights. First, the country has progressed in terms of poverty reduction compared to the governmental baseline, but the improvement (as illustrated through the analysis of table 4.1, above) is much less significant if data are analysed comparing year 2000 with 2005/2006 or even more with 2008, since over the period 2005-2008, poverty indicators worsened. Second, extreme poverty was at 17.8% at the national level in 2008, which invalidates the measurement presented by the government for 2006 and presents the country with a huge challenge in order to meet the 2015 of cutting it down by more than 50% in just five years to hit the 8.8% goal. It has to be noticed that the government through its 2006-2010 NDP set an even more ambitious goal of reducing extreme poverty to 8.0% in 2015. ECLAC (2009) has recently warned that the country should undertake a profound reflection on its employment and social spending policies and trends if the objective of reducing poverty has to be given a chance of being met.
45 Data on poverty in table 4.7 slightly differ from those in table 4.1 because of a change the country applied to its National Household Survey (NHS) in 2006. That affected the comparability of data collected through the NHS as far as the series on the labour market, poverty and inequality are concerned. That generated great problems and the impossibility for the academic community and the country to be able to assess with certainty what happened with those variables between 2006 and 2007. The government asked for the collaboration of ECLAC and between January and August 2009 a mission of experts worked on the issue, providing a solution allowing a comparison between the old and the new methodologies of data collection (MESEP, 2009). The net result is that poverty data can be again compared nowadays but a somewhat embarrassing gap remains regarding what exactly happened between the end of 2005 and the beginning of 2008.
The World Bank recently assessed the country’s performance in education, concluding that Colombia has significantly progressed towards the goals of universal access and coverage during the last two decades (Banco Mundial, 2008). However, in 2007 UNESCO reported that Colombia appeared as one of the four Latin-American countries that did not reach the goal of 90% in terms of net enrolment (UNESCO, 2007). The same institution reported that Colombia had reached a rate of almost 100% of students finalizing their schooling year. It has not been evaluated what effects the decree No. 230 of 2002 had on that rate. The decree established that there would be a maximum of 5% of students taking the same level for the second consecutive year, almost establishing automatic promotion and generating many questions regarding the quality of education. According to the Ministry of Education the rate of desertion dropped between 2002 and 2007 from 8% to 5.6% (MEN, 2008).
This data, in spite of representing a much more complex dynamic, complements the official data provided in relation with MDG 2. There is no doubt that the country has made great progress from where it was almost 20 years ago. However, the latest data presents mixed evidence about ongoing trends and do not allow affirmation that MDG 2 will be certainly accomplished. If in terms of illiteracy the government affirms it has accomplished 84% of the set goal and 41% in terms of the
taBLe 9.7: mDg 1. eradicate extreme poverty and hunger

75
Chapter 4 LOW-INCOME GROUPS’ ADAPTATION TO CLIMATE CHANGE IN COLOMBIA
goals for primary and secondary education (DNP, op.cit., 2007), what remains to be covered, especially in rural and peri-urban areas, represents a significant challenge.
The special United Nations commissioner for education’s report on Colombia (Tomasevsky, 2004), affirmed that the country has not yet accomplished its constitutional mandate of free compulsory education, set by the National Constitution of 1991. The existence
of a double public-private system replicates severe forms of inequality and exclusion that perpetuate poverty. She underlines a concept later retaken by Pérez (2005), who affirmed that as long as in Colombia there are two parallel educational systems, one for the poor and another for the rich, education might convert from a means of social emancipation to a mechanism for the reproduction of inequality and social immobilization.
2015 goal baseline (1991)
Last measurement
National Development Plan goal 2006-2010
mDg 2015 goal
To reduce the percentage of people in poverty to 28.5%
53.80% 45.1% (2006) 35% 28.50%
To reduce to 8.8% the percentage of people living in extreme poverty
20.40% 12% (2006) 8% 8.80%
To reduce to 3% the number of children with global malnourishment (weight for age)
10% (1990) 7% (2005) 5% 3%
Source: Departamento Nacional de Planeación (2007)
taBLe 9.8: mDg 2. achieve universal primary education
taBLe 9.9: mDg 3. promote gender equality and empower women
2015 goal baseline not available
Last measurement “National Development Plan goal 2006-2010”
mDg 2015 goal
To develop with a time frame of data collection of five years a measurement of the magnitude of intra-household violence among partners and define the annual goals for its reduction
16% of the total of interviewed women was the object of physical violence on behalf of somehow different from their partner or spouse. 41% object of violence from partner or spouse (2000)
See column 1
By year 2008 to implement and keep in operation an inter-sector strategy of monitoring of intra-household family as a public health concern, especially regards of violence exerted against partners.
To improve above 30% the participation of women in the different decisional tiers of public institutions
Local & regional level 2001-2003: Governors (6.25%) Departmental assemblies (13.84%) Mayors (7.4%) Municipal assemblies (12.89%) National level 2002-2006 MP (11.98%) Senate house (11.76%)”
Source: Departamento Nacional de Planeación (2007)

76
The ImpacT of clImaTe change on Urban SeTTlemenTS In colombIa
According to the data provided by the National Survey of Demography and Health run by the widely recognised institution PROFAMILIA, 16% of women had suffered physical violence from a person who was not their partner or spouse in 2000. Up to 41%, that is, two women out of five, had suffered violence from their partner or spouse; a figure representing the severity of the drama related to the condition of women in Colombia, given how many women have been physically assaulted within their own home.
MDG 3 along with the policies, the cultural and right-based measures that should be implemented to promote and achieve better gender equality through the empowerment of women has been only partially conceptualised in Colombia. It is indeed one of the MDGs seldom talked about within official evaluations, making the definition of indicators and goals partial and incomplete.
Colombia has done well in reducing child mortality and the achievements towards the goals reported by the government as shown in table 4.9 (DNP, op.cit., 2007) have received international recognition by ECLAC, among others. At present, the country has advanced in achieving more than 70% of what it had planned to advance for 2015. It should be nonetheless pointed out that the child mortality rate of Chile, the country often compared to Colombia or used as a model to imitate for the country, is estimated at 5.9 in 2016 by ECLAC vs. 15.0 for Colombia.
As table 4.10 illustrates, Colombia has satisfactorily progressed in this objective. Maternal health has been made the focus of special policy attention during the 2006-2010 government with public spending devoted to improve the quality of medical attention and the diffusion of contraception and cancer prevention. In the prevention of the spread of HIV/AIDS, Colombia is still struggling to get a robust baseline, particularly for what concerns mother-to-baby transmission. Broad public policy guidelines state that the country aims at 50% coverage of retro-viral medicines for those who require therapy.
2015 goal baseline (1990)
Last measurement
National Development Plan goal 2006-2010
mDg 2015 goal
Reduce mortality in 5-year-old minors, to 17 deaths for 1.000 born alive
37 22 18.2 17
Reduce mortality in 1-year-old minors, to 14 deaths for 1.000 born alive.
31 19 16.5 14
Achieve and maintain the coverage of vaccination in 95 %, with the PAI for 5-year-old minors in all the municipalities and districts of the country.
86% (1994) 87.30% 95% 95%
Source: Departamento Nacional de Planeación (2007)
taBLe 9.10: mDg 4. reduce child mortality

77
Chapter 4 LOW-INCOME GROUPS’ ADAPTATION TO CLIMATE CHANGE IN COLOMBIA
2015 goal baseline Last measurement
National Development Plan goal 2006-2010
mDg 2015 goal
HIV prevalence among population (aged 15-49 years)
0.7% (2004) 0.7% (2004) < 1.2% < 1.2%
Establish a baseline in the period 2005-2010 to achieve measure mortality due to HIV / AIDS and reducing it by 20% during the five years 2010-2015.
Reduce by 20% the incidence of mother-child transmission, compared to five years (from 2005 to 2010)
Increase by 30 percentage points the coverage of antiretroviral therapy to persons who need it.
52.3% (2003) 54.8% (2005) 82% 96%
Reduce by 85 % the cases of malaria mortality 227 (1998) 155 (2002) 117 34
Reduce by 45 % the incidence of malaria in municipalities with urban malaria.
17/1.000 (2003) 17/1.000 (2003) 12.6/1.000 9/1.000
Reduce by 80 % the cases of mortality for fastidiousness.
229 (1998) 157 (2002) 106 46
Reduce and maintain to less than 10% the indexes of Aedes’s infestation in the special municipalities, category 1 and 2 below 1.800 mts above sea level
30% (2003) 30% (2003) 16% 10%
Source: Departamento Nacional de Planeación (2007)
2015 goal baseline (1991)
Last measurement
“National Development Plan goal 2006-2010”
mDg 2015 goal
Increase to 90 the percentage of women with four or more prenatal care visits.
66% 83.1% (2005) 100% 90%
Increase institutional attention of childbirth to 95%. a. Institutional attention b. Qualified personal attention
76.3%
80.6%
92% (2005)
90.7% (2005)
95%
95%
95%
95%
Increase the prevalence of use of modern contraceptive methods. a. 75 % of the sexually active population. b. 65 % of the population between(among) 15 to 19 years sexually active.
59% (1995)
38% (1995)
68.2% (2005)
66.1% (2005)
75%
75%
75%
65%
Detain the growth of the percentage of teenagers who have been mothers or are in pregnancy, maintaining this number below 15%.
13% 20.5% (2005) < 15% < 15%
Reduce the rate of mortality for cancer of uterine neck to 5.5 deaths for 100.000 women
13 10.9 (2003) 8.8 5.5
Source: Departamento Nacional de Planeación (2007)
taBLe 9.11: mDg 5. Improve maternal health (improve sexual and reproductive health)
taBLe 9.12: mDg 6. combat hIv/aIDS, malaria and other diseases

78
The ImpacT of clImaTe change on Urban SeTTlemenTS In colombIa
Cities are only partially included within the MDGs. Dimensions of urban sustainability that have great relevance for adaptation to climate change such as housing quality and sanitation are included within the set of goals the country seeks to achieve by 2015 within
MDG 7, as table 4.12 illustrates. However, cities are not considered as a system in a two-way interaction with the surrounding ecosystems, and problems as important as energy and water provision have been left out.
2015 goal baseline (1991)
Last measurement National Development Plan goal 2006-2010
mDg 2015 goal
Consolidate the protected areas from the National Natural Parks System (SPNN)
10,320,224 (2004)
1,062,602 new ha. 49 of 51 areas of the SPNN with
management plans
200,000 new ha. 3 areas of the SPNN lacking management
plans
10,485,224
Eliminate the consumption of ozone-depleting substances (2015)
1,000 tons. (2003)
440 tons. reduced (2006)
600 tons. reduced 0 tons.
Construction of 2,292,354 Social Interest Housing (VIS)
355,885 (accumulated 2002 - 2006)
804,089 solutions (accumulated 2006-2010)
2,300,000 (accumulated 2002-2020)
Attention to 449,000 households that require housing improvement
68,000 (accumulated 2002 - 2006)
254,438 (accumulated 2006-
2010)
449,000 (accumulated 2002-2020)
Incorporate new urban inhabitants to the aqueduct and sewer infrastructure:
a. 7.7 millions with aqueduct
b. 9.2 millions with solution of sewer
94.6%
81.8%
97.9 % (2005 2,923,743) ben.
(accumulated 2002 - 2006)
92.4 % (2005
3,035,215) ben. (accumulated 2002 - 2006)
3,177,715 ben. (accumulated 2006-2010)
4,219,537 ben. (accumulated 2006-2010)
7,700,000 (accumulated 2002-2020)
9,200,000
(accumulated 2002-2020)
Incorporate new rural inhabitants to aqueduct and basic sanitation:
a. 2.3 millions to a solution of water supply
b. 1.9 millions to a solution of basic sanitation
41.1%
51.0%
70.7 % (2005 197,967) ben. (accumulated 2002 - 2006)
66.6 %
(2005 356,663) ben. ( accumulated 2002 - 2006)
903,619 (accumulated 2006 - 2010)
817,941
(accumulated 2006 - 2010)
2,300,000 (accumulated 2002 - 2020)
1,900,000
(acumulated 2002 - 2020)
Source: Departamento Nacional de Planeación (2007)
taBLe 9.13: mDg 7. ensure environmental sustainability

79
Chapter 5 CONCLUSIONS
Like many other countries in the global south, Colombia presents a number of challenges in adapting its urban settlements to climate change. The country can show important achievements in terms of national environmental institutions and legal frameworks. The work carried out by IDEAM, particularly the systematization of the impacts on the different ecosystems of climate variability and environmental change are landmarks in building the capacity of the country to understand and adapt to climate change and its challenges.
However, these institutional and scientific advancements, such as an increasing country-based capacity to monitor and model local climate change scenarios, have not translated into an operative urban policy framework for impact evaluation and adaptation.
As highlighted in chapter 2, the country has not yet included adaptation to climate change in its national policies. Furthermore, not only is there no national policy that systematically deals with a risk management framework related to the issue; urban institutions have only just began to analyse threats and scenarios without having yet embedded the issues of climate change. The urban issue is also critically absent from the horizon of policy frameworks and politic discourse. Even the 2nd National Communication from IDEAM and the National Government to the IPCC touches upon urban issues in a tangential way, whereas the fundamental point of urban poverty and inequality is not even mentioned. Thus, critical impacts can neither be conceptualised nor measured because they are still politically invisible for the majority of policy-makers.
Administrative decentralisation has produced greater asymmetries within an urban system that has not been conceptualised as such, besides some initial elaboration regarding metropolitan areas. Indeed, the very concept of metropolitan area as an emerging strategic and driving concept for policy implicitly denies the relevance of smaller human settlements and blurs a badly required attention to the diversity of urban typologies. In a similar vein, since adaptation policy poses huge challenges of working inter-institutionally and inter-sectorally across different scales, it has to be pointed out how even in the most advanced cases such as Bogotá and Medellín, people’s participation is often a good intention on paper while inter-agency communication is marked by lack of continuity and long-term sustainability.
The country has no national policy for adaptation to climate change and it has dedicated an unusual emphasis to the measurement of its green-house gases, when its total figure does not even approach 1% of the world’s emissions. City governments have not made efforts to re-balance this situation as has happened in other countries of the continent such as Chile, in spite of the fact that Bogotá belongs to high-profile urban climate change networks such as the C40 initiative. The use of the terms “adaptation” and “mitigation” by national authorities is ambiguous and reflects a lack of clarity regarding the difference between “risk mitigation” within the jargon of the management of disasters and that of the reduction of risk due to the direct causes of global warming.
Chapter 5 conclUSIonS

80
The ImpacT of clImaTe change on Urban SeTTlemenTS In colombIa
Adaptation pilots in the country are based in the mountains and concentrated on the fragile ecosystem of the páramo. In spite of its importance for the sustainability over time of environmental services such as water provision, this approach falls short of a comprehension of the critical role played by cities as places where impacts will be most felt and as potential generators of collective solutions.
The conceptualisation and the policy approach to the impacts of and adaptation to climate change (felt and potential ones) seem to be domains where the issues of inequality and different capacities to cope and withstand change have not entered mainstream local analysis.
In spite of the presence of a national system for disasters prevention, Colombian cities face great challenges in terms of double exposure to the impacts of environmental and development-related dynamics.
Chapter 3 and 4 have pointed out either through case studies or the analysis of macro-level indicators that the combined impacts of climate variability, environmental change and socio-economic inequality are potentially destructive to livelihoods. Whereas climate-related and environmental impacts are measurable at departmental or urban level, data show that their magnitude is severe.
The case studies analysed through the report tell a common story with different words: one of greater exposure of the poor and, particularly of the poorest, coupled by great challenges in terms of a more inclusive, democratic and also effective urban governance.

81
Alberti, M. (2010). ‘Maintaining ecological integrity and sustaining ecosystem function in urban areas’, Current Option in Environmental Sustainability, Vol. 2: 178.184.
Alcaldía de Tumaco (2008). ‘Plan de Ordenamiento Territorial 2008 – 2019, ‘Tumaco territorio especial, industrial, portuario, biodiverso y ecoturístico’, documento técnico de soporte, Tumaco: Alcaldía de Tumaco.
Agrawal, A. (2008). ‘The Role of Local Institutions in Adaptation to Climate Change’, paper prepared for the Social Dimensions of Climate Change, Social Development Department, The World Bank: Washington D.C., March.
Alesina, A. (Ed.) (2005). Institutional Reforms: The Case of Colombia, MIT Press, Boston, Massachusetts.
Amat, C. (2008). El Cambio Climático no tiene fronteras: Impacto del Cambio Climático en la Comunidad Andina, Lima: Comunidad Andina.
Aquatella, J. (2008). ‘Energía y cambio climático: oportunidades para una política energética integrada en América Latina y el Caribe’, CEPAL, GTZ, Santiago de Chile: Naciones Unidas.
Ayers, J and Dodman, D. (forthcoming). Climate change adaptation and development: The state of the debate, Progress in Development Studies, Sage Publications.
Bebbington, A. (1999). ‘Capitals and Capabilities: A Framework for Analyzing Peasant Viability, Rural Livelihoods and Poverty’, World Development, Vol. 27, No.12: 2021-2044.
Berhentz, E. (2007). ‘Relevancia del Cambio Climático para la Agenda Ambiental de Colombia’, Centro de Investigaciones en Ingeniería Ambiental, Universidad de Los Andes, Coloquios Ambientales, power point slides, May.
Betancourth, C. (2009). ‘Creating secure urbanities through self-sufficient eco-infrastructures’, “Cities and Climate Change: Responding to an Urgent Agenda” Fifth World Bank Urban Research Symposium, June 2009, Marseille.
BID (2003). ‘Resultados de la aplicación del sistema de indicadores en doce países de Latinoamérica’, Programa de información e indicadores de gestión de riesgos, Banco Interamericano de Desarrollo, Comisión Económica para América Latina, Instituto de Estudios Ambientales de la Universidad Nacional sede Manizales, Manizales.
Bigio, A.G. (2003). ‘Cities and Climate Change’, in Kreimer, A., Arnold, M. and Carlin, A. (eds.), Building Safer Cities: The Future of Disaster Risk, Disaster Risk Mangement Series No. 3, The World Bank: Washington D.C. Available at: http://www.unisdr.org/eng/library/Literature/7759.pdf
bIblIography

82
The ImpacT of clImaTe change on Urban SeTTlemenTS In colombIa
Burton, I., S. Huq, B. Lim, O. Pilifosova & Schipper, E. (2002). ‘From impacts assessment to adaptation priorities: the shaping of adaptation policy’, Climate Policy Vol. 2: 145-159.
Capra, F. (1996). The web of life: a new scientific understanding of living systems, New York: Anchor Books.
Cardona, O. (2005). ‘Manizales: Frente al Futuro’, Alcaldía Municipal 2002 – 2005, Alcaldía de Manizales: Manizales.
Cardona, O. & Yamin, L.E. (2006). ‘Información sobre el riesgo de desastre a través del estudio de casos piloto: Estudio nacional de Colombia’, Bogotá: BID-CEPAL-IDEA.
Cardona Alzate, A. (2009). ‘Actores relacionados con el abordaje al cambio climático en Colombia’, Proyecto INAP, Bogotá: PNUD Colombia.
Carvajal Y. L. (2009). Participación ciudadana y buen gobierno: el presupuesto participativo como aporte a la democratización de la ciudad de Medellín. Foro, Sep 2009. Bogotá, Colombia.
CCCP (2002). Compilación Oceanográfica de la Cuenca Pacífica Colombiana, Centro de Control de Contaminación del Pacífico, Cali: CCCP.
CDC (2006). ‘Guardianas de la Ladera: Un Programa de Cultura Ciudadana en la Prevención de Riesgo’, Taller Internacional sobre Gestión de Riesgo a Nivel Local. Manizales, Colombia, September, 28-29.
CENAC (2005). ‘Evolución del Déficit Habitacional en Colombia 1993-2005’, Bogotá: CENAC.
CEPAL (2009). ‘Cambio climático y desarrollo en América Latina y el Caribe: una reseña’, Documento de proyecto, Santiago de Chile: Naciones Unidas.
Chambers, R. (1989). ‘Vulnerability, Coping and Policy’, IDS bulletin, Vol.20, No.2: 1-7, April.
Chardón, A.M. (2004). ‘Un enfoque geográfico de la vulnerabilidad global de un hábitat urbano de ladera expuesto a amenazas naturals: El caso andino de Manizales’, Colombia Documentación. CYTED. Available at: http://hdrnet.org/372/
Chavarro, M. and Ulloa, A. (2008). ‘Preparándose para el futuro: Amenazas, riesgos, vulnerabilidad y adaptación frente al cambio climático’, Material de Difusión y Socialización sobre el Cambio Climático, Bogotá: UNODC-Colombia.
Christensen, J.H., B. Hewitson, A. Busuioc, A. Chen, X. Gao, I. Held, R. Jones, R.K. Kolli, W.-T. Kwon, R. Laprise, V. Magaña Rueda, L. Mearns, C.G. Menéndez, J. Räisänen, A. Rinke, A. Sarr and P. Whetton, (2007). Regional Climate Projections. In: Climate Change 2007: The Physical Science Basis. Contribution of Working Group I to the Fourth Assessment Report of the Intergovernmental Panel on Climate Change [Solomon, S., D. Qin, M. Manning, Z. Chen, M. Marquis, K.B. Averyt, M. Tignor and H.L. Miller (eds.)]. Cambridge University Press, Cambridge, United Kingdom and New York, NY, USA.
CID (2006). ‘Bien-estar y macroeconomía III: informe de coyuntura’, Bogotá: CID – UNAL – CGR.

83
BIBLIOGRAPHY
Climate Change Congress (2009). ‘Synthesis Report. Climate Change: Global Risks, Challenges and Decisions’, Copenhagen: University of Copenhagen.
Commoner, B. (1971). The closing circle: nature, man and technology, New York: Knopf.
Corporación OSSO (2008). ‘Manifestaciones de riesgo extensivo e intensivo en Colombia, Background report for Global Assessment Report for Disaster Risk Reduction’, septiembre.
Costa, C. (2007). ‘La adaptación al cambio climático en Colombia’, Revista de Ingeniería, No. 26: 74-80, Universidad de Los Andes, noviembre.
Cutter, S.L. (2003). ‘Social Vulnerability to Environmental Hazards’, Social Science Quarterly, Vol. 84, No. 2: 242-261, June.
DFID (2004). ‘Climate change in Latin America’, Climate Change Factsheet. DFID, London.
DNP (2003). ‘CONPES 3242. Estrategia Institucional para la Venta de Servicios Ambientales de Mitigación para el Cambio Climático’, Bogotá: Ministerio de Ambiente, Vivienda y Desarrollo Territorial, Departamento Nacional de Planeación.
DNP (2005). ‘CONPES 091. Mestas y Estrategias de Colombia para el Logro de los Objetivos de Desarrollo del Milenio – 2015’. Bogotá: Consejo Nacional de Política Económica y Social, Departamento Nacional de Planeación, March.
DNP (2006). Plan Nacional de Desarrollo, ‘Estado Comunitario; Desarrollo para Todos’, Departamento Nacional de Planeación: Bogotá. Available at: http://www.dnp.gov.co/PortalWeb/PND/PND20062010/tabid/65/Default.aspx
Dodman, D., Hardoy, J. and Satterthwaite, D. (2009). ‘Urban Development and Intensive and Extensive Risk’, Contribution to the Global Assessment Report on Disaster Risk Reduction, London: IIED.
DPAD (2008). Colombia: Integrating disaster risk reduction at the local level. Sistema Nacional de Prevención y Atención de Desastres (SNPAD). Available at: http://www.eird.org/wikien/images/Colombia_NP_Good_practice_-_02_07_08.pdf
DPAE (2008). ‘Influencia de un clima cambiante en las amenazas’, Bogotá: DPAE.
DPU (2006). COLOMBIA: HOUSING AND LAND FOR THE URBAN POOR: Case studies of Bogotá-Soacha-Mosquera and Medellín.Report for DNP, MAVDT & World Bank, 2006.
Eakin, H. and Lemos, M.C. (2010). ‘Institutions and change: The challenge of building adaptive capacity in Latin America’, Global Environmental Change, Vol. 20: 1-3.
Ehrhart, C., Thow, A., De Blois, M. & Warhurst, A. (2008). ‘Humanitarian Implications of Climate Change: Mapping emerging trends and risk hotspots’, CARE & Maplecroft. Available at www.careclimatechange.org
ECLAC (2010). Social Panorama of Latin America, ECLAC: Santiago de Chile. Available at: http://www.eclac.org/publicaciones/xml/0/37840/PSI2009-full-text.pdf

84
The ImpacT of clImaTe change on Urban SeTTlemenTS In colombIa
Fussel, H.M. (2008) The risks of climate change: A synthesis of new scientific knowledge since the finalization of the IPCC Fourth Assessment Report (AR4). Background note to the World Development Report 2010, World Bank, Washington.
Hicks, J. (1939). Valor y Capital, Ciudad de México: Fondo de Cultura Económica.
Guitiérrez Sanín, F., M.T. Pinto, J.C. Arenas, T. Guzmán & M.T. Guitiérrez (2009). Politics and Security in Three Colombia Cities, Working Paper 44.London: Crisis States Research Centre, LSE.
Huq, S., and Ayers, J. (2009). ‘Linking Adaptation and Disaster Risk Reduction’. In Climate Change and Global Poverty: A Billion Lives in the Balance, Washington D.C.: Brookings Institution Press.
IDEAM (2001a). Colombia Primera Comunicación Nacional ante la Convención Marco de Naciones Unidas sobre el Cambio Climático. Bogotá: IDEAM.
IDEAM (2001b). ‘Vulnerabilidad y adaptación de la zona costera colombiana al ascenso acelerado del nivel del mar’, Bogotá: IDEAM, Diciembre.
IDEAM (2002). ‘Efectos naturales y socioeconómicos del Fenómeno el Niño en Colombia’, Bogotá: IDEAM,.
IDEAM (2006). ‘Colombia: Integrated National Adaptation Plan: High Mountain Ecosystems, Caribbean Islands and Human Health’, Bogotá: IDEAM.
IIAP (2007). Diagnóstico Preliminar de la Calidad del Aire y del Agua en Centros de Mayor Poblamiento Humano de la Región del Chocó Biogeográfico Colombiano, Quibdó: IIAP.
IPCC (2007a). ‘Climate Change 2007: Synthesis Report’, Brussels: WMO, UNEP, April.
IPCC (2007b) ‘Impacts, Adaptation and Vulnerability’. Contribution of Working Group II to the Fourth Assessment Report of the Intergovernmental Panel on Climate Change. M.L. Parry, O.F. Canziani, J.P. Palutikof, P.J. van der Linden and C.E. Hanson, Eds., Cambridge University Press, Cambridge, UK, 976pp.
IPCC (2007c). ‘Climate Change (2007) Synthesis Report’. Contribution of Working Groups I, II and III to the Fourth Assessment Report of the Intergovernmental Panel on Climate Change [Core Writing Team, Pachauri, R.K and Reisinger, A. (eds.)]. IPCC, Geneva, Switzerland.
IDEAM (2009). Colombia Adaptation Portfolio 2009, Bogotá: IDEAM.
IDEAM (2010). 2a Comunicación Nacional ante la Convención Marco de las Naciones Unidas sobre el Cambio Climático, Ministerio de Ambiente, Vivienda y Desarrollo Territorial, IDEAM, PNUD, Bogotá: IDEAM.
Kates, R. (2000). ‘Cautionary Tales: Adaptation and the Global Poor’, Climatic Change Vol. 45: 5 – 17.
Lampis, A. (2007). ‘Vulnerabilidad y Protección Social en Colombia: Estudios de Caso en Bogotá, Cali y Manizales’, in Zorro, C. (Comp.), El Desarrollo: Perspectivas y Dimensiones – Aportes Interdisciplinarios, Bogotá: CIDER, Embajada de los Países Bajos en Colombia. Available at: http://cider.uniandes.edu.co/@index/Noticias/Libro_30_anos_3_05_09.asp

85
BIBLIOGRAPHY
Lampis, A. (2010a). ‘Pobreza y Riesgo Medioambiental’, Working Paper, Red de Estudios Sociales en Prevención de Desastres en América Latina, agosto. Available at: http://www.desenredando.org/ page 17.
Lampis, A. (2010b). ‘Challenges to Adaptation for Risk-Prone Coastal Livelihoods in Tumaco, Pacific Coast (Colombia), UGEC Viewpoints No. 3: 18-22, March.
Lampis, A. (2010c). ‘Ciudad y riesgo: un reto de seguridad ecológica urbana’ (Editorial), Revista de Ingeniería de la Universidad de Los Andes, No. 31: 62-71. Available at: http://revistaing.uniandes.edu.co/index.php?idr=40&ri=6790ea056fe94f4590eb0f7f609fe41d
Lampis, A. (2012). ‘Cities and Climate Change Challenges: Institutions, Policy Style and Adaptation Capacity in Bogotá (Colombia)’, International Journal of Regional and Urban Research (forthcoming).
Liverman, D. (2004). ‘Who Governs, at What Scale, and at What Price? Geography, Environmental Governance and the Commodification of Nature’, Annals of the Association of American Geographers, Vol. 94, No. 4: 734 – 778, December.
Magrin, G., C. Gay García, D. Cruz Choque, J.C. Giménez, A.R. Moreno, G.J. Nagy, C. Nobre and Villamizar,A. (2007). ‘Latin America. Climate Change 2007: Impacts, Adaptation and Vulnerability. Contribution of Working Group II to the Fourth Assessment Report of the Intergovernmental Panel on Climate Change’, M.L. Parry, O.F. Canziani, J.P. Palutikof, P.J. van der Linden and C.E. Hanson, (Eds.), Cambridge University Press, Cambridge, UK, 581-615.
MAVDT, PNUD, IDEAM (2008). ‘Reflexiones sobre el clima futuro y sus implicaciones en el desarollo humano de Colombia’, MAVDT, PNUD and IDEAM: Bogotá.
MAVDT (2009). Colombia Adaptation Portfolio 2009, MAVDT, IDEAM: Bogotá.
MAVDT (2009a). ‘Procesos de Negociación Bajo la Convención del Cambio Climático: Adaptación al Cambio Climático’. Bogota, Oct 2009.
Mayorga, R., Hurtado, G. and Benavides, H. (2009). ‘Evidencias de Cambio Climático para Boyacá y Cundinamarca mediante el Análisis de Tendencias de la Precipitación y la Temperatura usando el RClimdex’, IDEAM: Bogotá.
McGranahan, G., Mitlin, D. and Satterthwaite, D. (2008). ‘Land and Services for the Urban Poor in Rapidly Urbanizing Countries’, in Martine, G., McGranahan, Montgomery, M. and Fernández-Castilla, R. (Eds.), The New Global Frontier: Urbanization, Poverty and Environment in the 21st Century, London and Sterling, VA: Earthscan.
Ministerio del Interior y de Justicia (2009). ‘Decreto No. 505 del 23 de febrero de 2009 por medio del cual se declara la existencia de una situación de desastre municipal en Tumaco’.
Mogollon, J.S. (2008). Experiencias de Adaptación en Colombia, Consultancy report for WWF Colombia, Bogotá.
Moser, C. (1996). ‘Confronting Crisis: A Comparative Study of Household Responses to Poverty and Vulnerability in Four Poor Urban Communities’, Washington D.C.: The World Bank.

86
The ImpacT of clImaTe change on Urban SeTTlemenTS In colombIa
Moser, C. (2009). ‘A Conceptual and Operational Framework for Pro-Poor Asset Adaptation to Urban Climate Change’, Paper presented at the 5th Urban Research Symposium ‘Cities and Climate Change: Responding to an Urgent Agenda’, World Bank, Marseille, 28-30 June.
Pabón Caicedo, J.D. (2007). ‘Variabilidad Climática y Cambio climático en la Sabana de Bogotá’, Departamento de Geografía, Universidad Nacional de Colombia, Bogotá: UNAL.
Pelling, M. (2003). The Vulnerability of Cities: social resilience and natural disaster London: Earthscan.
PNDH (2005). Los Municipios Colombianos hacia los Objetivos de Desarrollo del Milenio: Salud, Educación y Reducción de la Pobreza, Bogotá: DNP, PNDH, UNDP, GTZ, Cooperación República de Alemania.
PNUD (2008). Bogota: Una Apuesta para Colombia. Informe de Desarrollo Humano para Bogotá, Bogotá: UNDP.
Poveda, G. (2004). ‘La hidroclimatología en Colombia: Una síntesis desde la escala inter-decadal hasta la escala diurna’, Revista de Academia Colombiana de Ciencias Exactas Físicas y Naturales, Vol 28. No. 107: 201 – 222. Bogotá, junio.
Prada, F. (2001). ‘La estrategia económica de las ciudades: Innovaciones y balance conceptual de la planeación local en Colombia’, in Brand, P. (Ed. y comp.), Trayectorias urbanas en la modernización del Estado en Colombia, Bogotá: Tercer Mundo Editores, Universidad Nacional – Sede Medellín.
Prowse, M. and Scott, L. (2008). ‘Assets and Adaptation: An Emerging Debate’, IDS Bulletin, Vol. 39, No. 4: 42-52.
Rakodi, C. (1999). ‘A Capital Assets Framework for Analysing Household Livelihood Strategies’, Development Policy Review, Vol. 17, No. 3, 315-342, September.
Romero-Lankao, P. (2008a). ‘The Challenge of Climate Change in Latin America’, Urban Age, No. 7, London.
Romero-Lankao, P. (2008b). ‘Urban Areas and Climate Change: Review of Current Issues and Trends’, Issues Paper for the 2011 Global Report on Human Settlements, December.
Rubiano, L. (2009). ‘Desafíos para la gestión del riesgo en materia de recuperación ambiental como resultado de la adaptación a los desastres ambientales de baja intensidad en la zona de deslizamientos del sector Altos de la Estancia, Bogotá, D.C.’, Master’s thesis in Environmental Engineering, Faculty of Engineering, Universidad de Los Andes, Bogotá, D.C. Ref: 624.15136 R813 MF in the library catalogue.
Ruíz Murcia, J.F. (2007). ‘Escenarios de cambio climático, algunos modelos y resultados de lluvia para Colombia bajo el escenario A1B, IDEAM-METEO/003-2007, Nota Técnica del IDEAM, Bogotá: IDEAM.
Sánchez, R., et al. (2007). Instituto de Hidrología, Meteorología y Estudios Ambientales IDEAM. Los fenómenos cálido del pacifico (el niño) y frio del Pacifico (la niña) y su incidencia en la estabilidad de laderas en Colombia. III Simposio Panamericano de deslizamientos. Cartagena, Colombia. Agosto de 2001

87
BIBLIOGRAPHY
Sánchez-Traian, E., K. Ahmed Y. Awe (Eds.) (2007). Environmental Priorities and Poverty Reduction: A Country Environmental Analysis for Colombia, Washington: World Bank.
Sánchez-Rodríguez, R., Seto et al. (2005). ‘Science plan: urbanization and global
Programme on Global Environmental Change. Available at http://www.ugec.org
Sanderson, M. (2009). ‘Using Climate Models to Assess Climate Change Impacts in Cities’, Cities and Climate Change: Responding to an Urgent Agenda, Fifth World Bank Urban Research Symposium, June 2009, Marseille.
Satterthwaite, D. et al. (2007). ‘Adapting to Climate Change in Urban Areas: The Possibilities and constraints in low and middle-income nations’, Human Settlements Discussion Paper, Theme: Climate Change and Cities – 1, London: IIED, July. http://www.iied.org/pubs/pdfs/10549IIED.pdf
Sen, A.K. (1981). Poverty and famines: an essay on entitlement and deprivation, Oxford: Clarendon Press.
Sen, A.K. (1999). Development as Freedom, New York: Knopf.
Sassen, S. (2010). ‘Cities are at the centre of our environmental future’, Revista de Ingeniería de la Universidad de Los Andes, No. 31: 72-83. Available at: http://revistaing.uniandes.edu.co/index.php?idr=40&ri=6790ea056fe94f4590eb0f7f609fe41d
Seto, K, and Satterthwaite, D. (2010). ‘Interactions between urbanization and global environmental change’, Current Opinion in Environmental Sustainability, Vol. 2: 127-128.
Smit, B., I. Burton, R. Klein & J. Wandel (2000). ‘An anatomy of adaptation to climate change and variability’, Climatic Change, Vol. 45: 223-251.
Torres, J. (2003). ‘Urban governance and political entrepreneurs: the experience of Bogota’s politics 1980-2000’, Paper for School in Local Government, University College: Cork, Ireland.
Turner, B.L., Kasperson, R.E., Matson, P.A., McCarthy, J.J., Corell, R.W., Christensen, L., Eckley, N., Kasperson, J.X., Luers, A., Martello, M.L., Polsky, C., Pulsipher, A., (2003). ‘A framework for vulnerability analysis in sustainability science’, Proceeding of the National Academy of Sciences, Vol. 100, No. 14: 8074-8079.
Steer, R., et al. (1997). ‘Documento base para la elaboración de la “Política Nacional de Ordenamiento de las Zonas Costeras Colombianas”, Bogotá: Ministerio del Medio Ambiente, Serie de Publicaciones Especiales No. 6.
UN-Habitat (2003). The Challenge of Slums. Global Report on Human Settlements 2003, Earthscan Publications Ltd., London & Sterling, VA.
UNDP (2008). Human Development Report 2007/2008. Fighting Climate Change: Human Solidarity in a Divided World, UNDP: New York. http://hdr.undp.org/en/media/HDR_20072008_EN_Complete.pdf
UNEP (2005). Millennium Ecosystem Assessment, Urban Systems. Island Press.

88
The ImpacT of clImaTe change on Urban SeTTlemenTS In colombIa
Uribe, E.B. (2005). ‘The Allocation Of Water Resources In The Bogotá Savanna Region: Case Study’. Documento CEDE 2005-6, Facultad de Economía, Universidad de los Andes. Bogotá: Universidad de Los Andes.
Van Aalst, Cannon, T. & I. Burton (2008). ‘Community level adaptation to climate change: The potential role of participatory community risk assessment’. Global Environmental Change, Vol.18, No. 1: 165-179.
Velásquez, F.C. (2009). ‘La política pública de participación en Bogotá: Una tarea imposible?’ Revista Foro, No. 24, Septiembre..
Vides, E. (Ed.) (2008). ‘Sea-level rise coastal adaptation: Technical report NCAP Colombia Project’, ETC Project No. 032135, Marine and Coastal Research Institute, INVEMAR, Santa Marta, Colombia.
Villa, W. (1998). ‘Movimiento social de comunidades negras en el Pacífico colombiano. La construcción de una noción de territorio y región’, in Maya, A. (Ed.), Los afrocolombianos. Geografía humana de Colombia, Tomo VI, Bogotá: Instituto colombiano de cultura hispánica.
Wade, D. (1997). Gente negra, nación mestiza: dinámica de las identidades raciales en Colombia, Bogotá: Uniandes, Universidad de Antioquia.
Wiesner, B. et al. (2006). At Risk: natural hazards, people’s vulnerability and disasters, London and New York: Routledge, Second Edition; First Edition, 1994 (Blaikie, P. et al.)
Wilby, R.L. (2007). ‘A Review of Climate Change Impacts on the Built Environment’, Built Environment, Vol. 33, No. 1: 31-45.
Wilches, G. (2007). ‘¿Qu-ENOS pasa? Guía de la Red para la gestión radical de riesgos asociados con el fenómeno ENOS’, Bogotá: IAI-La Red.
Winchester, L. (2009). ‘The urban poor’s vulnerability to the impacts of climate change in Latin America and the Caribbean. A Policy Agenda. Cities and Climate Change: Responding to an Urgent Agenda’, Fifth World Bank Urban Research Symposium, June 2009, Marseille.
World Bank (2005). ‘Project Appraisal Document: Natural Disaster Vulnerability Reduction Project’, Washington, D.C.: World Bank, April.
World Bank (2006). ‘Disaster Vulnerability Reduction for Sustainable Development. In Colombia 2006-2010 A Window of Opportunity’, World Bank Policy Notes. ?
World Bank (2009). Low Carbon, High Growth: Latin American Responses to Climate Change, Washington, D.C.: World Bank.
UNITED NATIONS HUMAN SETTLEMENTS PROGRAMMEP.O.Box 30030,Nairobi 00100,Kenya;Tel: +254-20-7623120; Fax: +254-20-76234266/7 (Central office) [email protected] www.unhabitat.org/publications
This report examines the impact of climate change on urban settlements and adaptation strategies and practices, and particularly low-income groups’ adaptation in Colombia.
HS/110/12EISBN (Series): 978-92-1-132027-5ISBN (Volume): 978-92-1-132524-9
The Global Urban economic DialoGUe SerieS
climaTe chanGeThe impacT of
on Urban SeTTlemenTS in colombia