Embed Size (px)
Citation preview

University of Plymouth
PEARL https://pearl.plymouth.ac.uk
Faculty of Arts and Humanities Plymouth Business School
Impact of Big Data & Predictive
Analytics Capability on Supply Chain
Sustainability
Jeble, S
http://hdl.handle.net/10026.1/9612
10.1108/IJLM-05-2017-0134
International Journal of Logistics Management, The
Emerald
All content in PEARL is protected by copyright law. Author manuscripts are made available in accordance with
publisher policies. Please cite only the published version using the details provided on the item record or
document. In the absence of an open licence (e.g. Creative Commons), permissions for further reuse of content
should be sought from the publisher or author.

International Journal of Logistics Managem
ent
Impact of Big Data & Predictive Analytics Capability on
Supply Chain Sustainability
Journal: International Journal of Logistics Management
Manuscript ID IJLM-05-2017-0134
Manuscript Type: Original Article
Keywords:
Big Data & Predictive Analytics (BDPA), Resource Based View (RBV),
Contingency Theory (CT), Partial Least Squares (PLS), Supply Base
Complexity (SBC), Sustainability
Research Method: Structural equation modeling
Geography: India
International Journal of Logistics Management

International Journal of Logistics Managem
ent
0
Impact of Big Data & Predictive Analytics Capability on Supply Chain
Sustainability
Abstract
Purpose- The main purpose of this paper is to develop a theoretical model to explain the impact
of big data and predictive analytics (BDPA) on sustainable business development goal of the
organization.
Design/methodology/approach- We have developed our theoretical model using resource based
view (RBV) logic and contingency theory (CT). The model was further tested using PLS-SEM
(partial least squares- Structural Equation Modelling) following Peng and Lai (2012) arguments.
We gathered 205 responses using survey based instrument for PLS-SEM.
Findings- The statistical results suggest that out of four research hypotheses, we find support for
three hypotheses (H1-H3) and we did not found support for hypothesis H4. Although, we did not
find support for H4 (moderating role of supply base complexity (SBC)). However, in future the
relationship between BDPA, SBC and sustainable supply chain performance measures remain
interesting research questions for further studies.
Originality/value- This study makes some original contribution to the operations and supply
chain management literature. We provide theory-driven and empirically-proven results which
extend previous studies which have focused on single performance measures (i.e. economic or
environmental). Hence, by studying the impact of BDPA on three performance measures we
have attempted to answered some of the unresolved questions. We also offer numerous guidance
to the practitioners and policy makers, based on empirical results.
Keywords- Big Data & Predictive Analytics (BDPA), Resource Based View (RBV), Contingency
Theory (CT), Partial Least Squares (PLS), Structural Equation Modelling (SEM), Supply Base
Complexity (SBC), Sustainability, Supply Chain Management (SCM).
Paper type- Research
Page 1 of 43 International Journal of Logistics Management
123456789101112131415161718192021222324252627282930313233343536373839404142434445464748495051525354555657585960

International Journal of Logistics Managem
ent
1
1. Introduction
In the recent years, big data analytics has been considered as the next big thing for organizations
to gain competitive advantage (Wamba et al. 2015; Akter et al. 2016). With the increasing
digitalization of every aspect of business and government, large datasets are available for
analysis. Big data has been defined primarily with 5 Vs: volume, variety, velocity, veracity and
value (Wamba et al. 2015). Big data analytics is a field which consists of big data, analytical
tools and techniques to derive actionable insights from the big data for delivering sustainable
value, improving business performance and providing competitive advantage (Wamba et al.,
2017). Predictive analytics is defined as the process of discovering meaningful patterns of data
using pattern recognition techniques, statistics, machine learning, artificial intelligence and data
mining (Abbott, 2014).
Big data and predictive analytics (BDPA) is an emerging field which uses various
statistical techniques and computer algorithms to derive insights, patterns from large datasets.
Analytics is considered as the next big frontier of innovation, competition, and productivity
(Manyika et al., 2011, p.1). While next generation information technology techniques (such as
smart phones, digital devices, scanning devices, cloud computing, internet of things etc.) help in
improving productivity, these generate variety of large datasets which help in building analytics
capabilities for the firms.
Business firm’s primary goal is to make profits for long term economic sustainability.
With globalization, improved communication and arrival of social media, firms are competing as
never. Despite, the challenging business environment, going forward keeping profit alone as a
goal may not be sustainable considering long term impact of commercial activities on
environment and society. Thus, in addition to profit maximization, social and environmental
sustainability goals are necessary for businesses as per (Elkington, 1994). Environmental
Sustainability has gained significant attention in recent years due to growing concern for
environment. Extreme weather, rising temperature, scarcity of natural resources – all these call
for a different strategy towards environment (Winston, 2014). To preserve natural resources for
future generations, sustainability needs to be considered in every aspect of business, supply
chains and executive decision making.
Page 2 of 43International Journal of Logistics Management
123456789101112131415161718192021222324252627282930313233343536373839404142434445464748495051525354555657585960
International Journal of Logistics Managem
ent
2
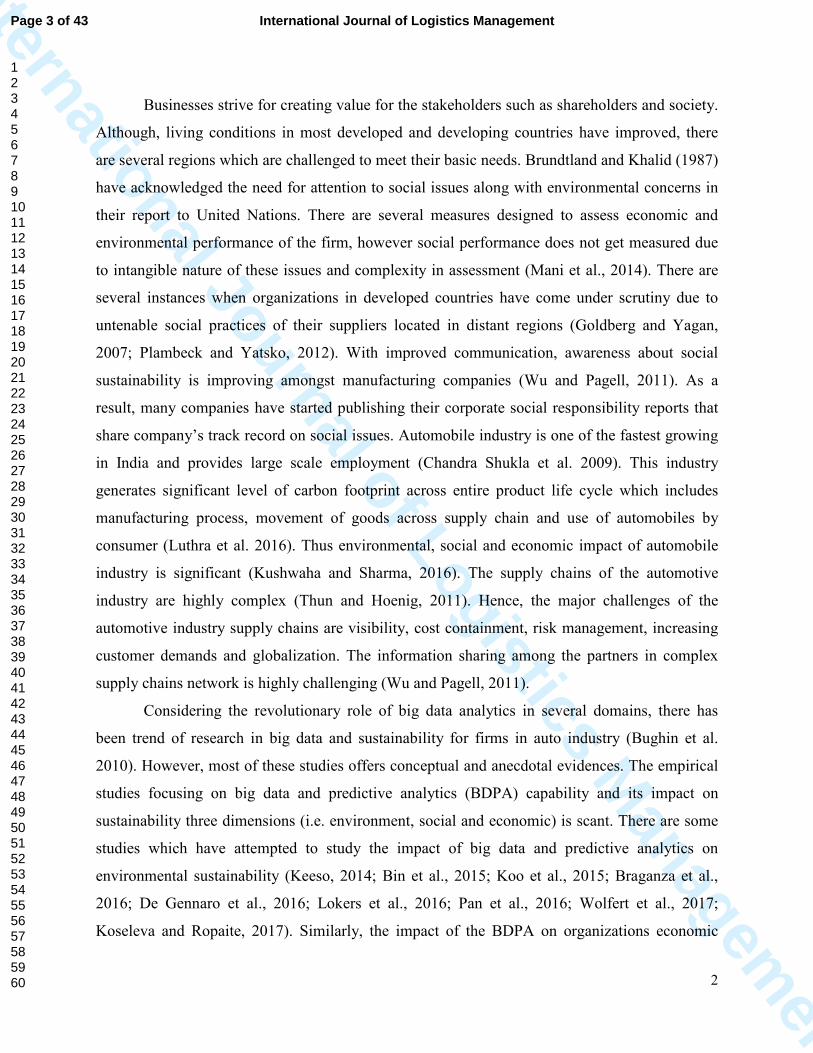
Businesses strive for creating value for the stakeholders such as shareholders and society.
Although, living conditions in most developed and developing countries have improved, there
are several regions which are challenged to meet their basic needs. Brundtland and Khalid (1987)
have acknowledged the need for attention to social issues along with environmental concerns in
their report to United Nations. There are several measures designed to assess economic and
environmental performance of the firm, however social performance does not get measured due
to intangible nature of these issues and complexity in assessment (Mani et al., 2014). There are
several instances when organizations in developed countries have come under scrutiny due to
untenable social practices of their suppliers located in distant regions (Goldberg and Yagan,
2007; Plambeck and Yatsko, 2012). With improved communication, awareness about social
sustainability is improving amongst manufacturing companies (Wu and Pagell, 2011). As a
result, many companies have started publishing their corporate social responsibility reports that
share company’s track record on social issues. Automobile industry is one of the fastest growing
in India and provides large scale employment (Chandra Shukla et al. 2009). This industry
generates significant level of carbon footprint across entire product life cycle which includes
manufacturing process, movement of goods across supply chain and use of automobiles by
consumer (Luthra et al. 2016). Thus environmental, social and economic impact of automobile
industry is significant (Kushwaha and Sharma, 2016). The supply chains of the automotive
industry are highly complex (Thun and Hoenig, 2011). Hence, the major challenges of the
automotive industry supply chains are visibility, cost containment, risk management, increasing
customer demands and globalization. The information sharing among the partners in complex
supply chains network is highly challenging (Wu and Pagell, 2011).
Considering the revolutionary role of big data analytics in several domains, there has
been trend of research in big data and sustainability for firms in auto industry (Bughin et al.
2010). However, most of these studies offers conceptual and anecdotal evidences. The empirical
studies focusing on big data and predictive analytics (BDPA) capability and its impact on
sustainability three dimensions (i.e. environment, social and economic) is scant. There are some
studies which have attempted to study the impact of big data and predictive analytics on
environmental sustainability (Keeso, 2014; Bin et al., 2015; Koo et al., 2015; Braganza et al.,
2016; De Gennaro et al., 2016; Lokers et al., 2016; Pan et al., 2016; Wolfert et al., 2017;
Koseleva and Ropaite, 2017). Similarly, the impact of the BDPA on organizations economic
Page 3 of 43 International Journal of Logistics Management
123456789101112131415161718192021222324252627282930313233343536373839404142434445464748495051525354555657585960
International Journal of Logistics Managem
ent
3
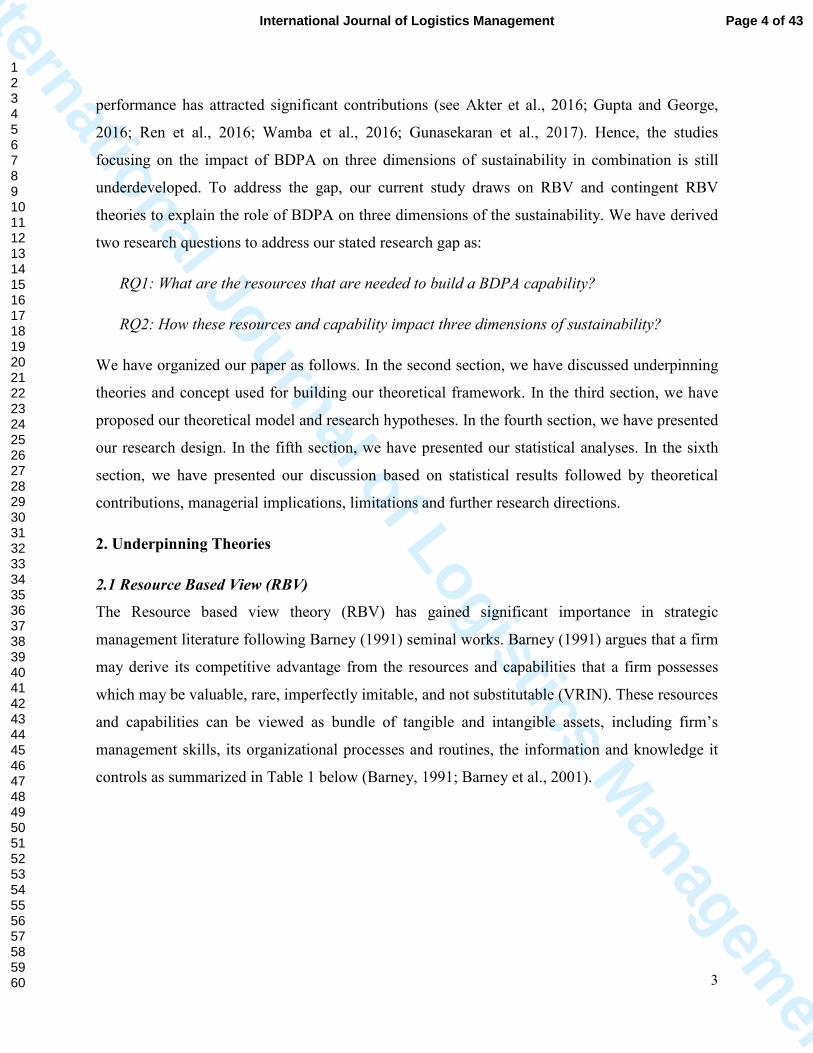
performance has attracted significant contributions (see Akter et al., 2016; Gupta and George,
2016; Ren et al., 2016; Wamba et al., 2016; Gunasekaran et al., 2017). Hence, the studies
focusing on the impact of BDPA on three dimensions of sustainability in combination is still
underdeveloped. To address the gap, our current study draws on RBV and contingent RBV
theories to explain the role of BDPA on three dimensions of the sustainability. We have derived
two research questions to address our stated research gap as:
RQ1: What are the resources that are needed to build a BDPA capability?
RQ2: How these resources and capability impact three dimensions of sustainability?
We have organized our paper as follows. In the second section, we have discussed underpinning
theories and concept used for building our theoretical framework. In the third section, we have
proposed our theoretical model and research hypotheses. In the fourth section, we have presented
our research design. In the fifth section, we have presented our statistical analyses. In the sixth
section, we have presented our discussion based on statistical results followed by theoretical
contributions, managerial implications, limitations and further research directions.
2. Underpinning Theories
2.1 Resource Based View (RBV)
The Resource based view theory (RBV) has gained significant importance in strategic
management literature following Barney (1991) seminal works. Barney (1991) argues that a firm
may derive its competitive advantage from the resources and capabilities that a firm possesses
which may be valuable, rare, imperfectly imitable, and not substitutable (VRIN). These resources
and capabilities can be viewed as bundle of tangible and intangible assets, including firm’s
management skills, its organizational processes and routines, the information and knowledge it
controls as summarized in Table 1 below (Barney, 1991; Barney et al., 2001).
Page 4 of 43International Journal of Logistics Management
123456789101112131415161718192021222324252627282930313233343536373839404142434445464748495051525354555657585960

International Journal of Logistics Managem
ent
4
Table 1: Classification of Resources
Resource type Examples Source
Physical capital resources Physical technology used, plant and
equipment, geographic location,
access to raw materials
Barney (1991); Williamson
(1975)
Human capital resources Training, experience, judgment,
intelligence, relationships, insight of
individual managers and workers
Barney (1991); Becker
(1964)
Organizational capital
resources
Firm’s reporting structure, planning,
controlling and organizing systems
etc.
Barney (1991); Tomer
(1987)
Grant (1991) argues that, an organization may create capabilities by combining these
strategic resources which may be difficult for the competitors to imitate. However, developing
capabilities for long term sustenance of the firm requires a long-term plan, well defined business
processes and complex patterns of close coordination between people and other resources where
organizational members are critical components (Dubey et al., 2017; Grant, 1991). Toyota’s
unique lean system is difficult to replicate for several competitors despite plenty of literature
available on lean (Iyer et al., 2009). Similarly, McDonald’s capability to integrate different
business functions is a source of its competitive advantage (Grant, 1991). Many times, firms
create innovative products with their management and technical skills. Both these skills are
valuable and rare. Innovative product developed by a firm, gives them a first mover advantage
for some time (Barney, 1991). However, soon competition catches up by imitating such products
to capture market share. Apple has introduced several innovative products which were soon
imitated by competitors. As more firms can imitate the product, segments which were once
profitable will be subject to intense competition (Grant, 1991). Whereas, certain resources or
capabilities (e.g. company culture, business processes, continuous learning culture within
organization, unique information systems or innovative capabilities of the firm) are relatively
difficult to imitate.
Page 5 of 43 International Journal of Logistics Management
123456789101112131415161718192021222324252627282930313233343536373839404142434445464748495051525354555657585960

International Journal of Logistics Managem
ent
5
2.2 Contingent Resource Based View (CRBV)
RBV explains how organizations can achieve competitive advantage by possession of certain
resources or capabilities (Barney, 1991; Grant, 1991). Resources can be procured from the
market whereas capabilities (such as learning culture or management skills) need to be
developed within the firm (Brush and Artz, 1999), thus process of building capabilities is more
complex than acquiring resources in general. RBV theory has traditionally focused only on the
competitive implications of internal organizational resources and capabilities (Aragón-Correa
and Sharma, 2003), however this theory is unable to identify conditions in which resources or
capabilities provide competitive advantage (Ling-Yee, 2007). Influence of external factors or
conditions has not been considered in the resource based view theory. In general, the
contingency theory argues that superior organizational performance is a result of the proper
alignment of internal and external variables (Burns and Stalker, 1961; Lawrence and Lorsch,
1967). Contingent RBV argues that ability of firms possessing resources and capabilities
achieving competitive advantage is dependent on certain conditions (Aragón-Correa and Sharma,
2003). Thus, the contingency theory helps to address the somewhat static nature of RBV
(Brandon-Jones, et al., 2014).
2.3 Big data
Big data is defined as datasets that are too large for traditional data processing systems and
therefore require new technologies to handle them (Waller and Fawcett, 2013). Since the arrival
of the internet and digital economy, big data is set to be one of the most significant disruptors in
technology (Agarwal and Dhar, 2014). Considering high volumes, variety of data, it requires
advanced and unique storage, management, analysis and visualization technologies (Chen et al.,
2012). Big Data cannot be defined just by volume of data, but also by high velocity, diverse
variety, exhaustive in scope, and relational in nature (Kitchin, 2014). Big data has been defined
as an umbrella term for any collection of large and complex datasets that are difficult to store,
process, analyze with earlier methods (Huang and Chaovalitwongse, 2015). Traditional database
management technologies are unable to scale up to the demand of storage, analysis or
management of such large volumes of continuous data from a variety of data sources. Visionary
companies such as Google, Amazon, Wal-Mart, Netflix, have developed unique ways of tapping
Page 6 of 43International Journal of Logistics Management
123456789101112131415161718192021222324252627282930313233343536373839404142434445464748495051525354555657585960

International Journal of Logistics Managem
ent
6
value from these high speed, large datasets. A new field of analytics has emerged in recent years,
which uses computer science, advanced data storage and management techniques and statistics
concepts. This field is based on finding out patterns within data, correlation among dependent
and independent variables.
2.3.1 Big data analytics
Many economic transactions such as banking, e-commerce and social transactions are moving
online. Large scale data is created from these applications. With the availability of big data and
major advancements in techniques that derive intelligence from data, several new research
questions and opportunities are created (Agarwal and Dhar, 2014). Big data analytics has its
roots in the earlier data analysis methodologies using statistical techniques such as regression,
factor analysis etc. It includes data mining from high speed data streams and sensor data to get
real time analytics (Chen et al., 2012). Thus, it is an interdisciplinary field which uses the
knowledge of computer science, data science, statistics and mathematical models. It consists of a
systematic process of capturing and analyzing business data, developing a statistical model to
explain the phenomenon (Descriptive Analytics), developing a model to predict future outcomes
based on variable inputs (Predictive Analytics) as well as developing a model to optimize or
simulate outcomes based on variations in inputs (Prescriptive Analytics). It leverages statistical
techniques such as regression, factor analysis, multivariate statistics and knowledge of
mathematics for developing equations (Dubey and Gunasekaran, 2015).
In the present era, researchers and people are not concerned with what happened or why
it happened commonly known as descriptive analytics but the main issue of concern is to find out
the answer to questions like what is happening at present and what is likely to happen in the
future commonly known as Predictive Analytics and what actions should be taken to find out the
optimal results basically known as Prescriptive Analytics. Therefore, business analytics may be
further classified into Descriptive, Predictive and Prescriptive Analytics (Bose, 2009).
2.3.2 Predictive analytics
Predictive analytics is the most useful technique for getting insights from data about what can
happen in future from available big data. It is defined as the process of discovering meaningful
patterns of data using pattern recognition techniques, statistics, machine learning, artificial
Page 7 of 43 International Journal of Logistics Management
123456789101112131415161718192021222324252627282930313233343536373839404142434445464748495051525354555657585960

International Journal of Logistics Managem
ent
7
intelligence and data mining (Abbott, 2014). Also, referred as advanced analytics, it simply
means application of data analytics techniques to answer questions or solve problems (Bose,
2009). It is a further progression of Business Intelligence (BI) and data mining combined with
statistical techniques. Business Intelligence processes help analysis of internal and external data
to enable business executives to make intelligent decisions. The questions and variables are
developed by experts in the field of study whereas in case of predictive analytics, selection of
model and relationship are data driven (Abbott, 2014).
2.4 Big Data & Predictive Analytics (BDPA) Capability
According to RBV logic, when firm integrate and deploy strategic resources, they develop
capabilities which are distinct from other competitors (Bharadwaj, 2000; Barratt and Oke, 2007;
Brandon-Jones et al. 2014). Several firms have developed infrastructure to gather large datasets,
analyze them and use them either for making operational decisions or predictions. This
additional information helps them to gain market share or improve profitability. This ability to
assemble, integrate and deploy firm’s big data specific resources is defined as big data and
predictive analytics (BDPA) capability (Gupta and George, 2016). There is no dearth of recent
literature which explains significance of data science. Drawing on the RBV logic, Gupta and
George (2016), have identified tangible (data, technology and other basic resources), human
(managerial and technical skills) and intangible (organizational learning and data driven culture)
resources as building blocks of BDPA capabilities.
2.4.1 Tangible Resources
According to Barney (1991) and Grant (1991), tangible resources include capital, buildings, IT
infrastructure, networks, connectivity, data sources etc. These resources are necessary for
engineers to develop analytics solutions. There is a recent trend of investments into big data and
relevant technologies. However, investments alone may not provide the competitive advantage
from big data. It is important that in addition to these investments, firms devote enough time to
their big data analytics projects to accomplish their objectives (Mata et al. 1995; Wixom and
Watson, 2001; Gupta and George, 2016). These resources will not provide competitive
advantage on their own but these are required as a foundation for building capabilities. Thus,
availability of data, technology, time and money are some of the basic resources towards the
BDPA objectives (Gupta and George, 2016).
Page 8 of 43International Journal of Logistics Management
123456789101112131415161718192021222324252627282930313233343536373839404142434445464748495051525354555657585960

International Journal of Logistics Managem
ent
8
2.4.2 Human Resources
In addition to investments in basic resources required for big data analytics projects, firm needs
human resources with skills in big data analytics technology as well as management skills to run
the projects effectively (Bharadwaj, 2000; Chae et al., 2014; Mata et al., 1995; Gupta and
George, 2016). A firm’s human resources consists of its employee’s experience, knowledge,
business acumen, problem solving skills, leadership qualities, relationships with others (Barney,
1991; Ross et al.,1996).
Technical skills: Big data analyst, commonly referred as data scientist needs to possess specific
skills and knowledge in statistical analysis, machine learning and business acumen to understand
business problems, articulate research problems, problem solving skills, strong communication
and people skills (Davenport, 2014). According to Davenport (2014), many large firms are
augmenting their existing analytical staff with data scientists who possess higher order IT
capabilities and ability to manipulate big data technologies.
Management skills: Technical skills may be developed through training or hiring from the
market, whereas managerial skills are rare and highly firm specific (Mata et al., 1995).
Management skills are important for analytics projects as managers play an important role in
leading and culture building role (Davenport, 2014). Success of analytics projects depends on
how well managers can assemble a team with right skills and align team members towards
common goals. Managers need to possess good communication and relationship building skills
as they need to deal with internal and external stakeholders for the project.
2.4.3 Intangible Resources
Unlike tangible resources, intangible resources are not documented on the firm’s financial
reports (Grant, 2010). Prior studies have identified organization culture as a source of sustained
firm performance (Barney, 1986; Barney, 1995; Teece, 2015). Organization culture built over a
period differs from company to company and it’s hard to replicate. It’s hard for competitors to
replicate close coordination and trust based relationship across supply chains required for
imitating Toyota Production System or McDonalds functional capabilities to integrate different
functions within the chain (Grant, 1991). On similar lines, recent work in big data has confirmed
organization culture as critical success factor for big data initiatives (Lavalle et al., 2011). For
Page 9 of 43 International Journal of Logistics Management
123456789101112131415161718192021222324252627282930313233343536373839404142434445464748495051525354555657585960

International Journal of Logistics Managem
ent
9
realizing full potential of big data owned by firms, it is critical that firms develop data driven
culture (Gupta, 2015; McAfee et al., 2012; Ross et al., 2013).
External environment keeps changing with changes in the political, economic, social,
technological, environmental or legal environment. Employees of the organization need to
upgrade themselves with the latest knowledge in their field and push the boundaries towards
developing new knowledge. Significance of continuous learning within an organization is well
understood by many competitive firms. They invest into training their workforce regularly. The
only way to retain sustainable competitive advantage for the firm is to learn faster than their
competitors (De Geus, 1988; Stata, 1989; Pedler et al., 1991) and its needs to keep pace with the
change in its external environment (Garratt, 1987, p.54; Revans, 1982). Thus, in line with prior
studies data driven culture (McAfee et al., 2012; Ross et al., 2013; Gupta and George, 2016) and
organizational learning (De Geus, 1988; Garratt, 1987; Grant, 1996; Gupta and George, 2016)
are key intangible resources that contribute towards BDPA capabilities.
2.5 Sustainable Business Development (SBD)
United Nations Brundtland Commission published report “Our Common future” in 1989 seeking
“Development meeting the needs of the current generation without compromising the ability of
future generations to meet their needs”. UN efforts have given a much-needed impetus at
political level for sustainable development. It has evolved over a period to blend and balance
environmental, economic and social goals (Virakul, 2015). Sustainability means different things
to different organizations. Some organizations may be striving for financial self-sustainability,
whereas another may be committed to financial-social objectives or another may be focusing
entirely on environmental sustainability (Swanson and Zhang, 2012). Nevertheless, sustainability
has become part of common business nomenclature in recent years. It is increasingly being used
as a measure of a firm’s overall performance. ISO 26000 provides guidance on how businesses
and organizations can operate in a socially responsible way. This means acting in an ethical and
transparent way that contributes to the health and welfare of society.
2.6 Sustainable Supply Chain Performance Measures
Dubey et al. (2016) have developed a framework to assess impact of world class sustainable
manufacturing practices (WSCM) on environmental, social and economic sustainability of the
Page 10 of 43International Journal of Logistics Management
123456789101112131415161718192021222324252627282930313233343536373839404142434445464748495051525354555657585960

International Journal of Logistics Managem
ent
10
firm. They have identified various practices (leadership, regulatory pressure, supplier
relationship management, employee involvement, customer relationship management, TQM,
TPM, lean) that contribute towards WCSM to achieve economic, social and environmental
sustainability. Wilson (2015) in their study of a leading UK based retailer firm, have found that
the retailer has enhanced their economic bottom-line by adopting TBL.
2.7 Supply Base Complexity (SBC)
Complexity in the general business environment can be defined as having many factors and
issues to deal with to conduct the business (Duncan, 1972; Miller and Friesen, 1983; Smart and
Vertinsky, 1984). Complexity increases with the increase in number of factors and issues the
manager must deal with. The greater the complexity, the managers end up spending more time in
solving issues than to deal with important issues of strategic concern (Amit and Schoemaker,
1993). To get cost and quality advantage, large manufacturers and retailers source their materials
globally. They make extensive use of sea, air and ground transportation for logistics purpose.
Transporting large quantities by ships give significant cost and quality advantage. However, with
addition of each global supplier, the materials manager must deal with uncertainty posed by
distance, geography, culture and increased management work. This is termed as supply base
complexity (SBC). It is defined by factors related to number of suppliers (scale complexity),
delivery lead time (delivery complexity), differences between suppliers (differentiation
complexity) and their different geographic locations (geographic dispersion complexity)
(Vachon and Klassen, 2002; Choi and Krause, 2006; Caridi et al., 2010; Brandon-Jones et al.
2014). Well defined business processes, database and state of the art information system
including BDPA capabilities helps firms to get visibility and transparency to reduce the
complexity. Firms get visibility of real time demand, inventory and delivery status across supply
chain, which helps in reducing uncertainty. This facilitates one or more members of supply chain
to respond to changes in timely manner (Brandon-Jones et al., 2014). Manufacturing firms based
in India being members of local or global supply chain, their performance is interlinked with
SBC.
Page 11 of 43 International Journal of Logistics Management
123456789101112131415161718192021222324252627282930313233343536373839404142434445464748495051525354555657585960

International Journal of Logistics Managem
ent
11
3. Theoretical Framework and Hypotheses Development
The foundation of our theoretical framework comprises of two elements: RBV and SBC (Figure
1). To answer our first research question, we have grounded our arguments in RBV. Although,
numerous studies have attempted to explain BDPA using RBV (Gupta and George, 2016) and
dynamic capability view (Akter et al. 2016). However, the dynamic capability view (DCV) and
contingent resource based view (CRBV) are the further extensions of the RBV to address the
criticisms of some antagonists who believes that RBV is static in nature or suffers from context
insensitivity. In the present study, we further built upon Akter et al. (2016) and Gupta and
George (2016) to include the moderating role of SBC. The complexity in supply chains increases
with the increase in supplier’s base as there are additional relationships to manage, alongside
additional information and product flows to oversee (Bozarth et al. 2009). Hence, the
geographical dispersion and differences in suppliers in terms of cultural differences generates
complexity in supply chains. Thus, we argue that moderating role of SBC may positively
enhance the effect of the BDPA on three performance measures of sustainable supply chain.
Figure 1: Theoretical Framework
Page 12 of 43International Journal of Logistics Management
123456789101112131415161718192021222324252627282930313233343536373839404142434445464748495051525354555657585960

International Journal of Logistics Managem
ent
12
3. 1 Impact of Big Data & Predictive Analytics (BDPA) on Environmental Performance
Environmental concerns have been a topic of discussion at different levels from local
government bodies to international forums such as United Nations as the effects of global
warming caused by carbon emissions are quite visible. In 1987, United Nations Brundtland
commission proposed long term strategies for achieving sustainable development by the year
2000 and beyond. Those objectives remain unfulfilled. This commission defined sustainable
development as the one that seeks to meet the needs and aspirations of the present without
compromising the ability to meet those of the future (Brundtland and Khalid, 1987). The impact
of carbon emissions arising from various manufacturing, logistics and supply chain activities are
clearly visible in form of global warming leading to melting of ice layers and rising sea levels.
Environmental sustainability objectives such as reducing carbon footprint can be achieved
through programs such as “reduce, reuse and recycle”. Consumers are increasingly concerned
with ethical and environmental issues that affect their purchasing decisions (Laroche et al., 2001,
Trudel and Cotte, 2009). This is leading to carbon-labeling which provides product’s impact on
environment (Svensson and Wagner, 2015). In recent studies (see Zhao et al. 2017; Xie et al.
2017; An et al. 2017) scholars have attempted to study the impact of big data and predictive
analytics on reducing the negative effects of carbon emissions. Hence, we hypothesize it as:
H1: BDPA has positive impact on environmental performance (EP);
3.2 Impact of Big Data & Predictive Analytics (BDPA) on Social Performance
In addition to the planet, the second area of concern is society in which firms operate, i.e. social
sustainability. While the standard of living is improving in many countries, some societies are
challenged in meeting basic needs. There are several challenges ahead of us in terms of equity,
gender equality, child labor, malnutrition and sustainable working conditions etc. Brundtland and
Khalid (1987) in their report to United Nations on sustainable development call for social equity
between generations as well as equity within generations. Developmental goals should not ignore
interest of future generations and other societies sharing the planet. For measuring economic
performance of the firm, there are many economic indicators available in the balance sheet and
stock markets. Environmental performance is being measured with help of GRI (Global
Reporting Initiative) or ISO 14001 Environmental Management System (EMS). However, social
dimension of sustainability has not received enough attention due to challenges in getting
Page 13 of 43 International Journal of Logistics Management
123456789101112131415161718192021222324252627282930313233343536373839404142434445464748495051525354555657585960

International Journal of Logistics Managem
ent
13
tangible outcomes and very complex human issues involved (Mani et al., 2014). There are
numerous cases where the firms in developed countries have come under scrutiny for unethical
practices of their suppliers located elsewhere. The big data in the form of social media like
twitter, face book and other forms of unstructured data creates significant level of awareness
about wages, employment conditions, equity, safety and living conditions are created amongst
various stakeholders (Lindsey et al. 2013). This is leading to recognition by firms the
significance of social and environmental responsibility and its influence on their performance
(Porter and Linde, 1995; Zadek, 2004). Thus, socially sustainable manufacturing and sourcing
practices are getting better. Firms are contributing in the form of raising living standards for the
society, improving workplace conditions, eliminating waste and using resources efficiently etc.
(Mani et al., 2015). Many companies have started publishing their corporate social responsibility
reports that share company’s track record on social issues. Consumers and stakeholders expect
firms to be responsible towards profitability, good environment and ethical behavior (Ashby et
al., 2012). Song et al. (2017) argues that BDPA has enough potential to improve social
sustainability. Hence, we hypothesize it as:
H2: BDPA has positive impact on social performance (SP);
3.3 Economic Sustainability
The primary focus of business firms is to remain profitable for a long-term survival. Firms
operate in a highly competitive marketplace where every other firm wants to gain market share
(Svensson and Wagner, 2015). Due to globalization, improved information and communication
technologies and creative destruction, average lifespan of the firms is reducing drastically in
recent years (Foster and Kaplan, 2001). Economic success is measured by profitability,
competitiveness, cost reduction and brand equity (Svensson and Wagner, 2015). Business firms
need to be profitable to be able to provide returns to stakeholders. They need to remain
competitive by continuous improvement of their product or service and reducing costs. A
measurement model has been suggested by Svensson and Wagner (2015) for economic, social
and environmental sustainability. In previous studies (see Gupta and George, 2016; Akter et al.
2016) have noted based on empirical studies that BDPA has positive influence on economic
performance. Hence, we hypothesize as:
H3: BDPA has positive impact on economic performance (ECOP)
Page 14 of 43International Journal of Logistics Management
123456789101112131415161718192021222324252627282930313233343536373839404142434445464748495051525354555657585960

International Journal of Logistics Managem
ent
14
3.4 The Moderating Role of Supply Base Complexity (SBC)
Drawing upon contingent RBV (Aragón-Correa and Sharma, 2003), moderating role of SBC on
the relationship between BDPA capability of the firm and its economic, social and environmental
performance is discussed. BDPA capability can be created by bundling of resources such as
tangible, human resource and intangible resources (Gupta and George, 2016). Brandon-Jones et
al., (2014), argues that the scale complexity which is a result of several suppliers, has strong
moderating effect on the relationship between supply chain visibility and firm performance.
Barratt and Oke (2007) further established the relationships between supply chain visibility,
improved firm performance and sustainable competitive advantage. We argue that SBC may
have moderating effect on the links connecting BDPA capability and environment, social and
economic sustainability performance of the organization. Hence, we hypothesize it as:
H4a: Supply base complexity (SBC) has positive moderating effect on the path connecting BDPA
and EP
H4b: Supply base complexity (SBC) has positive moderating effect on the path connecting BDPA
and SP
H4c: Supply base complexity (SBC) has positive moderating effect on the path connecting BDPA
and ECOP
4. Research Design
In this study, all measurement items were derived from existing literature and were adapted to fit
BDPA context. Survey design was pretested with the help of four experienced researchers and
academicians working in the field of big data analytics. Based on feedback received, the
questionnaire was modified to make it more objective and clear. Then the questionnaire was
emailed to senior managers from manufacturing companies in Indian automobile industries from
CII database. All exogenous and endogenous constructs in the model are operationalized as
reflective. Responses were measured on a five point Likert scale ranging from strongly disagree
(1) to strongly agree (5).
4.1 Constructs Operationalization
We used survey based instrument to test our theoretical model. The instrument was developed by
identifying measures based on extensive review of existing literature. Some modifications were
Page 15 of 43 International Journal of Logistics Management
123456789101112131415161718192021222324252627282930313233343536373839404142434445464748495051525354555657585960

International Journal of Logistics Managem
ent
15
made to existing scale to make those more suitable in context to BDPA study. All the exogenous
and endogenous constructs was operationalized as reflective constructs.
Table 2: Operationalization of Constructs
Construct Type Relevant Literature Measures
Tangible
Resources
Reflective Barney, 1991; Grant,
1991; Gupta, 2015;
Mata et al. 1995;
Wixom and Watson,
2001
a) We have allocated adequate funds
for big data and predictive analytics
project (BR1)
b) We have enough time to achieve
desired results from big data and
predictive analytics (BR2)
Reflective Barney, 1991; Grant,
1991; Davenport, 2014;
Gupta, 2015
a) We have access to very large,
unstructured and fast moving data
for analysis (D1)
b) We integrate data from multiple
internal sources into a data
warehouse (D2)
c) We integrate external data with
internal to facilitate high-value
analysis of our business
environment (D3)
Technology Reflective Davenport, 2014; Gupta
and George, 2016.
a) We have explored or adopted
parallel computing approaches (e.g.
Hadoop) to big data processing
(T1)
b) We have explored or adopted
different data visualization tools
(T2)
c) We have explored or adopted cloud
based services for processing data
and doing analytics (T3)
d) We have explored or adopted open-
source software for big data and
analytics (T4)
e) We have explored or adopted new
forms of databases such as NoSQL
(Not only SQL) for storing data
(T5)
Technical Skills Reflective Mata et al., 1995; f) We provide big data related training
Page 16 of 43International Journal of Logistics Management
123456789101112131415161718192021222324252627282930313233343536373839404142434445464748495051525354555657585960

International Journal of Logistics Managem
ent
16
Construct Type Relevant Literature Measures
Carmeli and Tishler,
2004; Gupta and
George, 2016.
to our employees (TS1)
g) We hire new employees that
already have the big data &
predictive analytics skill (TS2)
h) Our big data & predictive analytics
staff has right skills to accomplish
their jobs successfully (TS3)
i) Our big data & predictive analytics
staff has suitable education to fulfill
their jobs (TS4)
j) Our big data & predictive analytics
staff is well trained (TS5)
Management
Skills
Reflective Davenport, 2014; Gupta
and George, 2016.
a) Our big data & predictive analytics
managers understand and
appreciate sustainable business
development needs of other
functional managers, suppliers and
customers (MS1)
b) Our big data & predictive analytics
managers can coordinate big data &
predictive analytics related
activities in ways to support other
functional managers, suppliers and
customers (MS2)
c) Our big data & predictive analytics
managers can work with functional
managers, suppliers, and customers
to determine opportunities that big
data might bring to our business
(MS3)
d) Our big data & predictive analytics
managers can anticipate the future
business needs of the other
functional managers, suppliers and
customers (MS4)
e) Our big data & predictive analytics
managers have good sense of where
to use big data (MS5)
f) Our big data & predictive analytics
Page 17 of 43 International Journal of Logistics Management
123456789101112131415161718192021222324252627282930313233343536373839404142434445464748495051525354555657585960

International Journal of Logistics Managem
ent
17
Construct Type Relevant Literature Measures
managers can understand and
evaluate the output generated from
big data (MS6)
Organizational
Learning
Reflective De Geus, 1988; Garratt,
1987; Grant, 1996;
Bhatt and Grover, 2005;
Gupta and George,
2016
a) We can search for new and relevant
knowledge (OL1)
b) We can acquire new and relevant
knowledge (OL2)
c) We can assimilate new and relevant
knowledge (OL3)
Data Driven
Culture
Reflective Laney, 2001; Mcafee et
al., 2012; Ross et al.,
2013;
Davenport and Dyché,
2013; McAfee et al.,
2012, Davenport and
Patil, 2012)
a) We treat data as a tangible asset
(DD1)
b) We base our decisions on data
rather than instinct (DD2)
c) We are willing to override our own
intuition when data contradict our
view points (DD3)
Social
Performance
Reflective Elkington, 1991;
Svensson and Wagner,
2015; Wilson, 2015;
Dubey et al, 2016.
a) Our firm believes in gender
equality (SP1)
b) Our firm pays significant attention
to the mortality rate of the daily
wage workers children (SP2)
c) Our firm believes in poverty
reduction (SP3)
d) Our firm pays significant attention
to the nutritional status of the meal
served in the canteen (SP4)
Environmental
Performance
Reflective Elkington, 1991;
Svensson and Wagner,
2015; Wilson, 2015;
Dubey et al, 2016.
a) Our organization has adopted
adequate measures for reduction of
air emissions (EP1)
b) Our organization has adopted
adequate measures for re-cycling
waste water (EP2)
c) Our organization has adopted
adequate measures to prevent
discharge of solid waste (EP3)
d) Our organization has adopted
adequate measures to prevent
consumption of hazardous harmful
toxic materials (EP4)
Page 18 of 43International Journal of Logistics Management
123456789101112131415161718192021222324252627282930313233343536373839404142434445464748495051525354555657585960

International Journal of Logistics Managem
ent
18
Construct Type Relevant Literature Measures
Economic
Performance
Reflective Elkington, 1991;
Svensson & Wagner,
2015; Wilson, 2015;
Dubey et al, 2016.
a) Decrease of cost for materials
purchasing (ECOP1)
b) Decrease of cost for energy
consumption (ECOP2)
c) Decrease of fee for waste treatment
(ECOP3)
d) Decrease of fee for waste discharge
(ECOP4)
Supply Base
Complexity
Reflective Barratt and Oke, 2007;
Brandon-Jones et al.,
2014; Gunasekaran et
al., 2017
a) The supply chain network involves
a lot of players (SCBC1)
b) The supply chain network is
complex (SCBC2)
c) Suppliers in this supply chain are of
the same size (SCBC3)
d) Suppliers in this supply chain have
the same level of technical
capability (SCBC4)
e) We depend on on-time delivery
from suppliers in this supply chain
network (SCBC5)
f) We can depend on short-lead times
from suppliers in this supply chain
(SCBC6)
4.2 Data Collection
For this study, a simple random sampling method was used. An email survey of a sample of auto
component manufacturing companies from CII database was conducted. The initial sample
consisted of 635 manufacturing firms located in the Pimpri-Chinchwad industrial area. Each
survey included an email request and was followed up with emails, and one or more phone calls.
Survey emails were sent to key functional heads from above mentioned manufacturing
companies, from logistics, operations management, materials management departments and are
aware of role of big data analytics. We have received 215 responses however, only 205
responses were complete and usable, resulting in effective response rate of 32.28%. Most of the
respondents (45%) are in large auto component manufacturing companies with sales revenue
above $100 million and more than 500 employees working in the firm. According to Cohen
(1992), a sample size recommended for PLS-SEM for statistical power of 80% is given in the
Page 19 of 43 International Journal of Logistics Management
123456789101112131415161718192021222324252627282930313233343536373839404142434445464748495051525354555657585960

International Journal of Logistics Managem
ent
19
Table 3 below. Thus, the sample size for minimum R2 of 50% with 5% significance level is 45
and with minimum R² of 10% sample size is 147, therefore, our 205-sample size is suitable for
PLS-SEM analysis. We have further assessed non-response bias using t-tests to compare the
responding and non-responding organizations and found no significant differences (p>0.05). The
appendix 1 presents the demographics of the respondents.
Table 3 – Sample size recommendation in a PLS-SEM for a statistical power of 80%
Maximum
number of
Arrows pointing
at a construct
Significance
Level
Minimum R2
10%
Minimum R2
25%
Minimum R2
50%
5 1% 205 98 62
5 5% 147 70 45
5 10% 120 58 37
Source: Cohen (1992)
5.0 Data Analysis and Results
Structural equation modelling (SEM) is a second-generation multivariate data analysis technique,
which overcomes the limitations of the first-generation techniques in terms of accounting for
measurement error. We have used WarpPLS version 5.0, which relies on the Partial Least
Squares (PLS), for analyzing the model as it exhibits several advantages in theory development
and explanation of variance (Peng and Lai, 2012; Hazen et al. 2015). It has a higher level of
statistical power in situations with complex model structures or smaller sample sizes (Hair et al.,
2016). This technique relies on pre-specified networks of relationships between constructs as
well as their measures (Mateos-Apricio, 2011). It works efficiently with complex relationships,
makes practically no assumptions about underlying data. PLS-SEM’s statistical properties
provide very robust model estimations with data that have normal as well as non-normal
distributional properties (Reinartz et al., 2009; Ringle et al., 2009; Hazen et al. 2015).
5.1 Measurement Model
Confirmatory factor analysis (CFA) was used to verify the convergent and discriminant validity
of the first order measurement model. The study calculated all the item loadings which exceeded
Page 20 of 43International Journal of Logistics Management
123456789101112131415161718192021222324252627282930313233343536373839404142434445464748495051525354555657585960

International Journal of Logistics Managem
ent
20
the cut-off values of 0.7 and were significant at p<0.001. The study calculated average variance
extracted (AVE) and socio composite reliability (SCR) for all the constructs (Fornell and
Larcker, 1981). AVE is found to be greater than 0.5 and socio composite reliability (SCR) is
greater than 0.7 for all the constructs (Table 4 below). We can therefore conclude that data is
supporting convergent validity. AVE measures the amount of variance that a construct captures
from its indicators relative to measurement error, whereas SCR measures internal consistency
(Chin, 2010). These two tests indicate extent of association between a construct and its
indicators.
Discriminant validity is a comparison of values of squared correlation between latent variables
with value of AVE of the construct. If the square root of AVE of the construct is larger than its
squared correlation with other constructs, the discriminant validity is considered good (Hair et
al., 2010). Discriminant validity of the reflective constructs was established using Fornell and
Larcker (1981) criteria. The square root of AVEs of each latent variable was greater than its
correlation with any other constructs. Examination of cross loadings yielded further support for
discriminant validity (see Table 5). This test indicates that the constructs do not share the same
type of items and they are conceptually distinct from each other (Chin, 2010). Thus, each
construct and its measure are distinct from other constructs and corresponding measures.
Overall, the measurement model is considered satisfactory as per evidence of convergent validity
and discriminant validity as shown in Table 4 and Table 5.
Table 4: Convergent Validity Test
Item Factor
Loadings Variance(λ²) Error SCR AVE
BR1 0.75 0.56 0.44 0.85 0.58
BR2 0.75 0.56 0.44
D1 0.77 0.6 0.4
D2 0.77 0.6 0.4
T1 0.89 0.8 0.2 0.94 0.77
T2 0.94 0.89 0.11
T3 0.91 0.83 0.17
T4 0.9 0.81 0.19
T5 0.74 0.54 0.46
MS1 0.87 0.76 0.24 0.95 0.75
Page 21 of 43 International Journal of Logistics Management
123456789101112131415161718192021222324252627282930313233343536373839404142434445464748495051525354555657585960

International Journal of Logistics Managem
ent
21
Item Factor
Loadings Variance(λ²) Error SCR AVE
MS2 0.89 0.79 0.21
MS3 0.92 0.84 0.16
MS4 0.9 0.81 0.19
MS5 0.9 0.81 0.19
MS6 0.7 0.49 0.51
OL1 0.98 0.95 0.05 0.98 0.95
OL2 0.97 0.95 0.05
OL3 0.97 0.95 0.05
DD1 0.66 0.44 0.56 0.78 0.54
DD2 0.77 0.6 0.4
DD3 0.77 0.59 0.41
SP1 0.93 0.86 0.14 0.93 0.87
SP2 0.94 0.88 0.12
EP1 0.92 0.84 0.16 0.96 0.85
EP2 0.95 0.91 0.09
EP3 0.93 0.86 0.14
EP4 0.89 0.79 0.21
ECOP1 0.96 0.93 0.07 0.98 0.93
ECOP2 0.97 0.94 0.06
ECOP3 0.97 0.93 0.07
ECOP4 0.95 0.91 0.09
SCBC1 0.8 0.63 0.37 0.9 0.6
SCBC2 0.77 0.6 0.4
SCBC3 0.78 0.6 0.4
SCBC4 0.67 0.45 0.55
SCBC5 0.87 0.75 0.25
SCBC6 0.77 0.59 0.41
Table 5: Discriminant Validity Test
TR TS MS OL DDC SP EP ECOP SCBC
TR 0.88
TS 0.61 0.87
MS 0.28 0.50 0.97
Page 22 of 43International Journal of Logistics Management
123456789101112131415161718192021222324252627282930313233343536373839404142434445464748495051525354555657585960

International Journal of Logistics Managem
ent
22
OL -0.02 0.03 0.23 0.73
DDC 0.01 0.01 -0.04 -0.06 0.93
SP 0.10 0.14 0.09 -0.07 -0.02 0.92
EP -0.22 -0.31 -0.36 -0.08 -0.03 0.08 0.96
ECOP -0.07 -0.09 -0.15 0.02 0.01 0.20 0.20 0.96
SCBC 0.18 0.16 0.02 0.03 -0.05 0.17 -0.04 0.04 0.77
5.2 Common Method Bias (CMB) Test
As with all self-reported data, there is potential for CMB resulting from multiple sources such as
consistency motif and social desirability (Podsakoff et al. 2003). Following Podsakoff and Organ
(1986) arguments, we have conducted, single factor Harman’s test. The results yielded that one
factor could explain only 32.623% of the variance. Hence, we can argue that CMB may not be a
major issue in our study. Although, Guide and Ketokivi (2015) argues that Harman’s single
factor test is not a robust approach to address the CMB. Hence, following Fawcett et al. (2014)
we have requested the organization to respond after consulting their team members rather than
responding based on their experiences. In this way, we have attempted to enforce procedural
remedy which may have minimized the CMB effect on our data.
5.3 Hypothesis Testing
The PLS does not assume a multivariate normal distribution. Hence, traditional based
parametric-based techniques for significance tests are inappropriate. PLS uses a bootstrapping
procedure to estimate standard errors and significance of parameter estimates (Chin, 1998). We
have reported the PLS path coefficients and p-values of the model (see Figure 2) in the Table 6.
Page 23 of 43 International Journal of Logistics Management
123456789101112131415161718192021222324252627282930313233343536373839404142434445464748495051525354555657585960

International Journal of Logistics Managem
ent
23
Figure 2: PLS-SEM Model
Table 6: Structural Estimates
Hypothesis Effect of on β p-value Results
H1 BDPA EP 0.74 <0.01 Supported
H2 BDPA SP 0.21 <0.01 Supported
H3 BDPA ECOP 0.80 <0.01 Supported
H4a SBC BDPA→EP 0.01 0.45 Not-supported
H4b SBC BDPA→SP 0.10 0.07 Not-supported
H4c SBC BDPA→ECOP 0.08 0.12 Not-supported
Page 24 of 43International Journal of Logistics Management
123456789101112131415161718192021222324252627282930313233343536373839404142434445464748495051525354555657585960

International Journal of Logistics Managem
ent
24
Addressing H1, first we observe support (Table 6) for the prediction that the BDPA is positively
associated with EP (β=0.74; p<0.01), consistent with the previous studies (Dubey et al. 2016;
Song et al. 2017; Xie et al. 2017; Zhao et al. 2017). Next, we found support for H2 (β=0.21;
p<0.01), is consistent with the previous claim (see Song et al. 2017). Addressing the H3(β=0.80;
p<0.01), found support is consistent with the previous findings (Akter et al. 2016; Gupta and
George, 2016; Dubey et al. 2016). The hypotheses H4a-H4c, did not find support (see Table 6).
H4a (β=0.01; p=0.45) did not find support. These results suggest that SBC is not significantly
related to the path joining BDPA and the three dimensions of sustainability. The exact role of
SBC in the role of BDPA and its influence on sustainable supply chain performance remains
interesting questions for future research. Next, we have examined the R² value of the endogenous
constructs to examine the explanatory power of the model. Using R² to assess the structural
model is consistent with the objective of PLS to maximize the variance explained in the
endogenous variables (Peng and Lai, 2012). The R² for environmental performance, social
performance and economic performance are 0.55, 0.07 and 0.63, respectively, which are
moderately strong except social performance construct (see Figure 2).
To evaluate the effect size of the predictor construct (BDPA), we used Cohen f² formula
(see Cohen, 1988). The effect size of the BDPA on EP was 0.545, SP was 0.052 and ECOP was
0.660 are considered large in case of BDPA on EP and ECOP. However, in comparison to other
two dimensions the effect size of the BDPA on SP is considerably small (see Cohen, 1988).
Next, to evaluate model’s capability to predict, Stone-Geisser’s Q² for endogenous
constructs are 0.547, 0.075 and 0.691 for EP, SP and ECOP, respectively, which are all greater
than zero, indicating acceptable predictive relevance (Peng and Lai, 2012).
6.0 Discussion
6.1 Theoretical Implications
The empirical results highlight that how BDPA as an organizational capability may help
organization’s initiative to improve environmental, social and economic performance of the
organization. The data analyses suggest that BDPA and EP, SP and ECOP are positively related
(H1-H3). Together, these results imply that BDPA as a higher order reflective construct which in
combination with organization tangible and intangible resources may help organizations to
Page 25 of 43 International Journal of Logistics Management
123456789101112131415161718192021222324252627282930313233343536373839404142434445464748495051525354555657585960

International Journal of Logistics Managem
ent
25
achieve desired sustainability goal. Although, previous scholars have indicated the potential of
BDPA in achieving sustainability in supply chains. What is less understood is how the BDPA
affect process of sustainable business development. Two key aspects of this study signify our
main contributions to the operations and supply chain management literature. First is the focus
on the implementation of the BDPA. We have conceptualized our theoretical framework,
grounded in RBV logic. In the current study, we have answered the most important question:
What are the resources that are needed to build a BDPA capability?
From previous research, we can argue that organization achieve competitive advantage
by building organizational capability which in turn created by combining and deploying several
organization-level resources (Bharadwaj, 2000; Akter et al. 2016; Gupta and George, 2016).
Following this stream of research, we have attempted to answer that what are the organization-
level resources that may be required to build BDPA capability which may help organizations to
achieve sustainable business development goal.
To answer second research question: How these resources and capability impact three
dimensions of sustainability?
This study integrates the RBV logic and contingency theory into one model and
reconciles what had previously been presumed to be independent in the literature. In this study,
we show that how BDPA impact three dimensions of sustainability under moderating effect of
SBC. This study extends the previous studies (Akter et al. 2016; Gupta and George, 2016) by
including environmental and social performance measures along with economic performance
measures. Hence, our study is one of the first studies which has empirically investigated the
influence of BDPA on the supply chain sustainability. Hence, by doing so we have attempted to
answer the previous research calls of (Waller and Fawcett, 2013; Song et al. 2017).
Page 26 of 43International Journal of Logistics Management
123456789101112131415161718192021222324252627282930313233343536373839404142434445464748495051525354555657585960

International Journal of Logistics Managem
ent
26
6.2 Managerial Implications
Our study yields some interesting results which may be useful for the practitioners and policy
makers, engaged in sustainable business development programs. By highlighting the importance
of technical skills and managerial skills, this study has offered numerous guidance to the big data
managers, human resource managers and policy makers that how mastering these skills or
focusing on cultivating these specific skills may provide sustainable competitive advantage to the
organization. Secondly, our study further offers some interesting insights that by making
investments, collecting hordes of data, and having access to world class technology are not
sufficient for building successful BDPA capability. The organizational learning and an
organizational culture have also significant influence on building BDPA capability. Finally, our
study suggests that BDPA can help organizational initiatives towards sustainable business
development. Hence, this may provide enough direction to the policy makers who are engaged in
charting future path for sustainable business development.
6.3 Limitations and Future Research Directions
It is important to evaluate the study’s results and contributions in the light of its limitations. Our
study has the following limitations that can be addressed by future research. First, we have tested
our research hypotheses using cross-sectional data. Guide and Ketokivi (2015) in their editorial
note have outlined some specific guidelines for the empirical articles. The use of cross-sectional
data for testing the model continues to be the common trend. However, the use of cross-sectional
data using survey based instrument often leads to CMB. Although, we have tried to use multi-
informants to minimize the effect of CMB in our study, but may not be sufficient to eliminate the
CMB which may contaminate our results (Ketokivi and Schroeder, 2004). Hence, in the light of
Guide and Ketokivi (2015) arguments, we believe that longitudinal data would further enrich our
understanding by offering information about causal relationship between independent and
dependent variables. It further allows us to investigate how SBC can influence the role of BDPA
on the three performance measures of sustainable supply chains.
Second, this research focuses on a firm’s perception on BDPA influence rather than
actual impact. To ensure that the measures of BDPA capability can accurately predict the actual
impact of BDPA on EP, SP and ECOP, we have conducted strict operationalization of item
development to improve the validity and compatibility of the indicators. A stated impact of
Page 27 of 43 International Journal of Logistics Management
123456789101112131415161718192021222324252627282930313233343536373839404142434445464748495051525354555657585960

International Journal of Logistics Managem
ent
27
BDPA on three performance measures were used as proxy for the actual impact of BDPA may
not represent a nomological net for the actual performance. Hence, it may be more interesting to
examine the actual impact of BDPA for a model framed in the resource based view. Future
research may focus on building more comprehensive scales for BDPA capability and its actual
impact on sustainable supply chain performance measures.
Finally, the demographic of our research sample may limit the generalizability of our
findings. To avoid noise caused by industry differences, we purposely chose to study auto
components manufacturing industry. We acknowledge that generalizability is one of the major
issues that trouble the survey based research because it is difficult to gather samples from large
population base. However, we still believe that future research may explore data from more
industries, countries and informants with diverse backgrounds to improve the generalizability.
Page 28 of 43International Journal of Logistics Management
123456789101112131415161718192021222324252627282930313233343536373839404142434445464748495051525354555657585960

International Journal of Logistics Managem
ent
28
Appendix 1: Sample Frame
Annual Sales Revenue Number of Firms Percentage
Under 10 Million USD 15 7.3%
10- 25 Million USD 15 7.3%
26- 50 Million USD 35 17.1%
76-100 Million USD 48 23.4%
101-250 Million USD 22 10.7%
251-500 Million USD 24 11.7%
Over 251 Million USD 46 22.4%
Number of Employees Number of respondents
0-50 16 7.8%
51-100 6 2.9%
101-200 13 6.3%
201-500 8 3.9%
501-1000 105 51.2%
1001+ 57 27.8%
Page 29 of 43 International Journal of Logistics Management
123456789101112131415161718192021222324252627282930313233343536373839404142434445464748495051525354555657585960
International Journal of Logistics Managem
ent
29
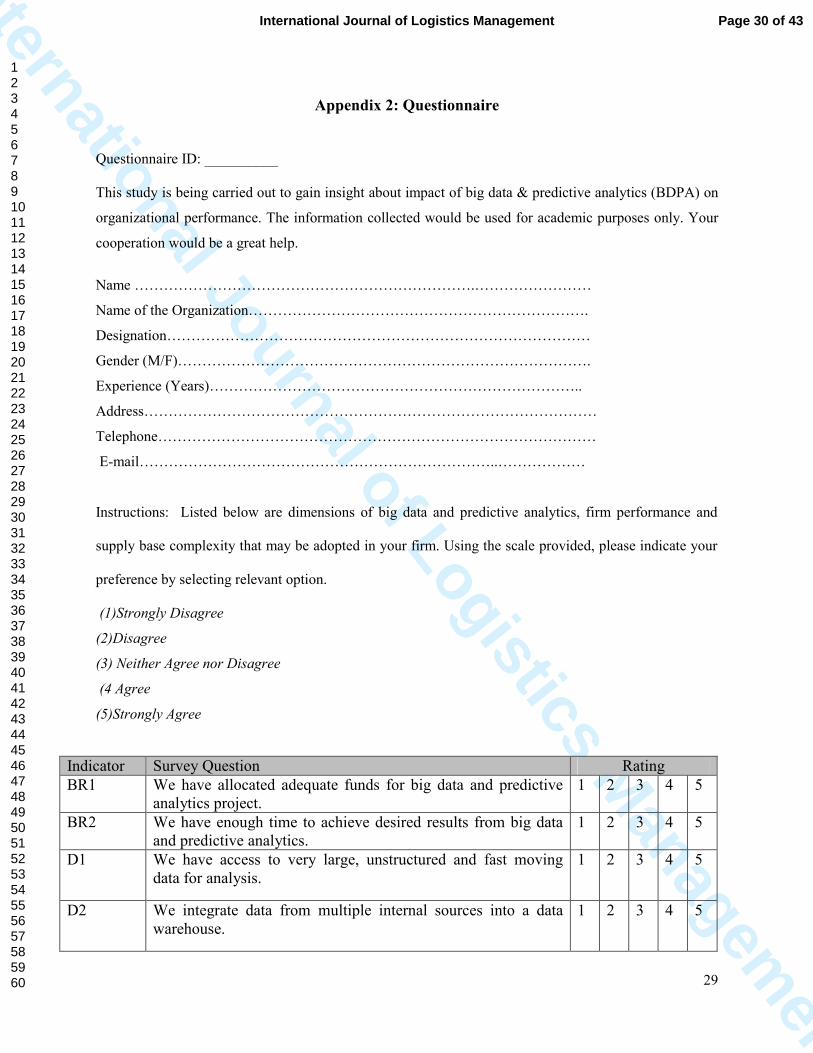
Appendix 2: Questionnaire
Questionnaire ID: __________
This study is being carried out to gain insight about impact of big data & predictive analytics (BDPA) on
organizational performance. The information collected would be used for academic purposes only. Your
cooperation would be a great help.
Name …………………………………………………………….……………………
Name of the Organization…………………………………………………………….
Designation……………………………………………………………………………
Gender (M/F)………………………………………………………………………….
Experience (Years)…………………………………………………………………..
Address…………………………………………………………………………………
Telephone………………………………………………………………………………
E-mail………………………………………………………………..………………
Instructions: Listed below are dimensions of big data and predictive analytics, firm performance and
supply base complexity that may be adopted in your firm. Using the scale provided, please indicate your
preference by selecting relevant option.
(1)Strongly Disagree
(2)Disagree
(3) Neither Agree nor Disagree
(4 Agree
(5)Strongly Agree
Indicator Survey Question Rating
BR1 We have allocated adequate funds for big data and predictive analytics project.
1 2 3 4 5
BR2 We have enough time to achieve desired results from big data and predictive analytics.
1 2 3 4 5
D1 We have access to very large, unstructured and fast moving data for analysis.
1 2 3 4 5
D2 We integrate data from multiple internal sources into a data warehouse.
1 2 3 4 5
Page 30 of 43International Journal of Logistics Management
123456789101112131415161718192021222324252627282930313233343536373839404142434445464748495051525354555657585960

International Journal of Logistics Managem
ent
30
Indicator Survey Question Rating
D3 We integrate external data with internal to facilitate high-value analysis of our business environment
1 2 3 4 5
T1 We provide big data related training to our employees. 1 2 3 4 5
T2 We hire new employees that already have the big data & predictive analytics skill
1 2 3 4 5
T3 Our big data & predictive analytics staff has right skills to accomplish their jobs successfully.
1 2 3 4 5
T4 Our big data & predictive analytics staff has suitable education to fulfill their jobs.
1 2 3 4 5
T5 Our big data & predictive analytics staff is well trained. 1 2 3 4 5
TS1 We have explored or adopted parallel computing approaches (e.g. Hadoop) to big data processing
1 2 3 4 5
TS2 We have explored or adopted different data visualization tools 1 2 3 4 5
TS3 We have explored or adopted cloud based services for processing data and doing analytics
1 2 3 4 5
TS4 We have explored or adopted open-source software for big data and analytics
1 2 3 4 5
TS5 We have explored or adopted new forms of databases such as NoSQL (Not only SQL) for storing data
1 2 3 4 5
MS1 Our big data & predictive analytics managers understand and appreciate sustainable business development needs of other functional managers, suppliers and customers.
1 2 3 4 5
MS2 Our big data & predictive analytics managers can coordinate big data & predictive analytics related activities in ways to support other functional managers, suppliers and customers.
1 2 3 4 5
MS3 Our big data & predictive analytics managers can work with functional managers, suppliers, and customers to determine opportunities that big data might bring to our business.
1 2 3 4 5
MS4 Our big data & predictive analytics managers can anticipate the future business needs of the other functional managers, suppliers and customers.
1 2 3 4 5
MS5 Our big data & predictive analytics managers have good sense of where to use big data.
1 2 3 4 5
MS6 Our big data & predictive analytics managers can understand and evaluate the output generated from big data.
1 2 3 4 5
OL1 We can search for new and relevant knowledge. 1 2 3 4 5
OL2 We can acquire new and relevant knowledge. 1 2 3 4 5
OL3 We can assimilate new and relevant knowledge 1 2 3 4 5
DD1 We treat data as a tangible asset. 1 2 3 4 5
DD2 We base our decisions on data rather than instinct. 1 2 3 4 5
DD3 We are willing to override our own intuition when data contradict our view points.
1 2 3 4 5
SP1 Our firm believes in gender equality 1 2 3 4 5
Page 31 of 43 International Journal of Logistics Management
123456789101112131415161718192021222324252627282930313233343536373839404142434445464748495051525354555657585960
International Journal of Logistics Managem
ent
31
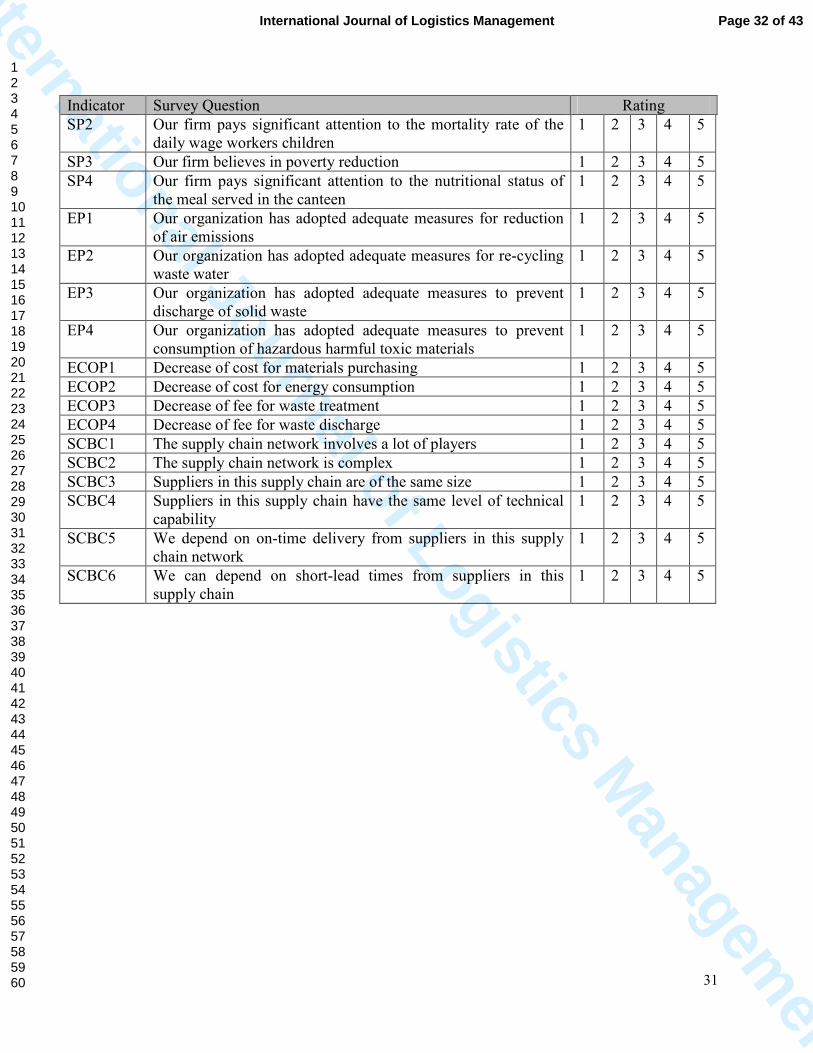
Indicator Survey Question Rating
SP2 Our firm pays significant attention to the mortality rate of the daily wage workers children
1 2 3 4 5
SP3 Our firm believes in poverty reduction 1 2 3 4 5
SP4 Our firm pays significant attention to the nutritional status of the meal served in the canteen
1 2 3 4 5
EP1 Our organization has adopted adequate measures for reduction of air emissions
1 2 3 4 5
EP2 Our organization has adopted adequate measures for re-cycling waste water
1 2 3 4 5
EP3 Our organization has adopted adequate measures to prevent discharge of solid waste
1 2 3 4 5
EP4 Our organization has adopted adequate measures to prevent consumption of hazardous harmful toxic materials
1 2 3 4 5
ECOP1 Decrease of cost for materials purchasing 1 2 3 4 5
ECOP2 Decrease of cost for energy consumption 1 2 3 4 5
ECOP3 Decrease of fee for waste treatment 1 2 3 4 5
ECOP4 Decrease of fee for waste discharge 1 2 3 4 5
SCBC1 The supply chain network involves a lot of players 1 2 3 4 5
SCBC2 The supply chain network is complex 1 2 3 4 5
SCBC3 Suppliers in this supply chain are of the same size 1 2 3 4 5
SCBC4 Suppliers in this supply chain have the same level of technical capability
1 2 3 4 5
SCBC5 We depend on on-time delivery from suppliers in this supply chain network
1 2 3 4 5
SCBC6 We can depend on short-lead times from suppliers in this supply chain
1 2 3 4 5
Page 32 of 43International Journal of Logistics Management
123456789101112131415161718192021222324252627282930313233343536373839404142434445464748495051525354555657585960

International Journal of Logistics Managem
ent
32
References
Abbott, D. (2014). Applied Predictive Analytics: Principles and Techniques for the Professional
Data Analyst. John Wiley & Sons.
Adomavicius, G., & Tuzhilin, A. (2005). Toward the next generation of recommender systems:
A survey of the state-of-the-art and possible extensions. IEEE Transactions on
Knowledge and Data Engineering, 17(6), 734-749.
Agarwal, R., & Dhar, V. (2014). Editorial—Big data, data science, and analytics: The
opportunity and challenge for IS research. Information Systems Research, 25 (3),443-448.
Akter, S., Wamba, S. F., Gunasekaran, A., Dubey, R., & Childe, S. J. (2016). How to improve
firm performance using big data analytics capability and business strategy alignment?
International Journal of Production Economics, 182, 113-131.
An, Q., Wen, Y., Xiong, B., Yang, M., & Chen, X. (2017). Allocation of carbon dioxide
emission permits with the minimum cost for Chinese provinces in big data
environment. Journal of Cleaner Production, 142, 886-893.
Aragón-Correa, J. A., & Sharma, S. (2003). A contingent resource-based view of proactive
corporate environmental strategy. Academy of Management Review, 28(1), 71-88.
Ashby, M. F. (2012). Materials and the environment: eco-informed material choice. Elsevier.
Barney, J. (1991). Firm resources and sustained competitive advantage. Journal of Management,
17(1), 99-120.
Barney, J. B. (1986). Organizational culture: can it be a source of sustained competitive
advantage? Academy of Management Review, 11(3), 656-665.
Barney, J. B. (1995). Looking inside for competitive advantage. The Academy of Management
Executive, 9(4), 49-61.
Barney, J., Wright, M., & Ketchen Jr, D. J. (2001). The resource-based view of the firm: Ten
years after 1991. Journal of Management, 27(6), 625-641.
Barratt, M., & Oke, A. (2007). Antecedents of supply chain visibility in retail supply chains: a
resource-based theory perspective. Journal of Operations Management, 25(6), 1217-
1233.
Becker, G. S. (1964). Human capital theory. Columbia, New York.
Page 33 of 43 International Journal of Logistics Management
123456789101112131415161718192021222324252627282930313233343536373839404142434445464748495051525354555657585960

International Journal of Logistics Managem
ent
33
Bharadwaj, A. S. (2000). A resource-based perspective on information technology capability
and firm performance: an empirical investigation. MIS Quarterly, 24(1), 169-196.
Bhatt, G. D., Grover, V., & GROVER, V. (2005). Types of information technology
capabilities and their role in competitive advantage: An empirical study. Journal of
Management Information Systems, 22(2), 253-277.
Bin, S., Zhiquan, Y., Jonathan, L. S. C., Jiewei, D. K., Kurle, D., Cerdas, F., & Herrmann, C.
(2015). A big data analytics approach to develop industrial symbioses in large cities.
Procedia CIRP, 29, 450-455.
Bose, R. (2009). Advanced analytics: opportunities and challenges. Industrial Management &
Data Systems, 109(2), 155-172.
Boyd, D., & Crawford, K. (2012). Critical questions for big data: Provocations for a cultural,
technological, and scholarly phenomenon. Information, Communication & Society,
15(5), 662-679.
Bozarth, C. C., Warsing, D. P., Flynn, B. B., & Flynn, E. J. (2009). The impact of supply
chain complexity on manufacturing plant performance. Journal of Operations
Management, 27(1), 78-93.
Braganza, A., Brooks, L., Nepelski, D., Ali, M., & Moro, R. (2017). Resource management in
big data initiatives: Processes and dynamic capabilities. Journal of Business Research,
70, 328-337.
Brandon‐Jones, E., Squire, B., Autry, C. W., & Petersen, K. J. (2014). A contingent resource‐
based perspective of supply chain resilience and robustness. Journal of Supply Chain
Management, 50(3), 55-73.
Brundtland, G. H., & Khalid, M. (1987). Our common future. New York.
Brush, T. H., & Artz, K. W. (1999). Toward a contingent resource-based theory: The impact of
information asymmetry on the value of capabilities in veterinary medicine. Strategic
Management Journal, 223-250.
Page 34 of 43International Journal of Logistics Management
123456789101112131415161718192021222324252627282930313233343536373839404142434445464748495051525354555657585960

International Journal of Logistics Managem
ent
34
Bughin, J., Chui, M., & Manyika, J. (2010). Clouds, big data, and smart assets: Ten tech-enabled
business trends to watch. McKinsey Quarterly, 56(1), 75-86.
Burns, T. E., & Stalker, G. M. (1961). The management of innovation.
Butner, K. (2010). The smarter supply chain of the future. Strategy & Leadership, 38(1), 22-31.
Caridi, M., Crippa, L., Perego, A., Sianesi, A., & Tumino, A. (2010). Do virtuality and
complexity affect supply chain visibility?. International Journal of Production
Economics, 127(2), 372-383.
Carmeli, A., & Tishler, A. (2004). Resources, capabilities, and the performance of industrial
firms: A multivariate analysis. Managerial and Decision Economics, 25(6‐7), 299-315.
Chae, H. C., Koh, C. E., & Prybutok, V. R. (2014). Information Technology Capability and
Firm Performance: Contradictory Findings and Their Possible Causes. Mis Quarterly,
38(1), 305-326.
Chandra Shukla, A., Deshmukh, S. G., & Kanda, A. (2009). Environmentally responsive
supply chains: Learnings from the Indian auto sector. Journal of Advances in
Management Research, 6(2), 154-171.
Chen, H., Chiang, R. H., &Storey, V. C. (2012). Business Intelligence and Analytics: From
Big Data to Big Impact. MIS Quarterly, 36(4), 1165-1188.
Chin, W. W. (2010). How to write up and report PLS analyses. Handbook of partial least
Choi, T. Y., & Krause, D. R. (2006). The supply base and its complexity: Implications for
transaction costs, risks, responsiveness, and innovation. Journal of Operations
Management, 24(5), 637-652.
Cohen, J. (1988). Statistical power analysis for the behavioral sciences, 2nd Edition, Lawrence
Earlbaum Associates. Hillsdale, NJ.
Cohen, J. (1992). A power primer. Psychological bulletin, 112(1), 155-159.
Davenport, T. H., & Dyché, J. (2013). Big data in big companies. International Institute for
Analytics, 3.
Davenport, T. H., & Patil, D. J. (2012). Data scientist. Harvard Business Review, 90(5), 70-76.
Page 35 of 43 International Journal of Logistics Management
123456789101112131415161718192021222324252627282930313233343536373839404142434445464748495051525354555657585960

International Journal of Logistics Managem
ent
35
De Gennaro, M., Paffumi, E., & Martini, G. (2016). Big Data for Supporting Low-Carbon
Road Transport Policies in Europe: Applications, Challenges and Opportunities. Big
Data Research, 6, 11-25.
De Geus, A. P. (1988). Planning as learning. Harvard Business Review, 66(2),70-74.
Dubey, R., & Gunasekaran, A. (2015). Education and training for successful career in Big
Data and Business Analytics. Industrial and Commercial Training, 47(4), 174-181.
Dubey, R., Altay, N., Gunasekaran, A., Blome, C., Papadopoulos, T., & Childe, S. J. (2018).
Supply Chain Agility, Adaptability and Alignment: Empirical Evidence From the Indian
Auto Components Industry. International Journal of Operations & Production
Management (accepted).
Dubey, R., Gunasekaran, A., Childe, S. J., Wamba, S. F., & Papadopoulos, T. (2016). The
impact of big data on world-class sustainable manufacturing. The International Journal
of Advanced Manufacturing Technology, 84(1-4), 631-645.
Duncan, R. B. (1972). Characteristics of organizational environments and perceived
environmental uncertainty. Administrative Science Quarterly, 313-327.
Dutta, D., & Bose, I. (2015). Managing a big data project: the case of ramco cements
limited. International Journal of Production Economics, 165, 293-306.
Elkington, J. (1994). Towards the sustainable corporation: Win-win-win business strategies for
sustainable development. California Management Review, 36(2),
Fan, J., Han, F., & Liu, H. (2014). Challenges of big data analysis. National Science Review,
1(2), 293-314.
Fawcett, S. E., Waller, M. A., Miller, J. W., Schwieterman, M. A., Hazen, B. T., &
Overstreet, R. E. (2014). A trail guide to publishing success: tips on writing influential
conceptual, qualitative, and survey research. Journal of Business Logistics, 35(1), 1-16.
Fornell, C., & Larcker, D. F. (1981). Evaluating structural equation models with unobservable
variables and measurement error. Journal of Marketing Research, 18(3), 39-50.
Foster, R., & Kaplan, S. (2001). Creative Destruction. McKinsey & Company. Inc.
Garratt, B. (1987). Learning is the core of organisational survival: action learning is the key
integrating process. Journal of Management Development, 6(2), 38-44.
Page 36 of 43International Journal of Logistics Management
123456789101112131415161718192021222324252627282930313233343536373839404142434445464748495051525354555657585960
International Journal of Logistics Managem
ent
36
Goldberg, R. A., & Yagan, J. D. (2007). McDonald’s Corporation: managing a sustainable
supply chain. Harvard Business School, 16.
Grant, R. M. (1991). The resource-based theory of competitive advantage: implications for
strategy formulation. California Management Review, 33(3), 114-135.
Grant, R. M. (1996). Toward a knowledge‐based theory of the firm. Strategic Management
Journal, 17(S2), 109-122.
Gunasekaran, A., Papadopoulos, T., Dubey, R., Wamba, S. F., Childe, S. J., Hazen, B., & Akter,
S. (2017). Big data and predictive analytics for supply chain and organizational
performance. Journal of Business Research, 70, 308-317.
Guide, V. D. R., & Ketokivi, M. (2015). Notes from the Editors: Redefining some
methodological criteria for the journal. Journal of Operations Management, (37), v-viii.
Gupta, M., & George, J. F. (2016). Toward the development of a big data analytics
capability. Information & Management, 53(8), 1049-1064.
H. Davenport, T. (2014). How strategists use “big data” to support internal business decisions,
discovery and production. Strategy & Leadership, 42(4), 45-50.
Hair Jr, J. F., Hult, G. T. M., Ringle, C., & Sarstedt, M. (2016). A primer on partial least
squares structural equation modeling (PLS-SEM). Sage Publications.
Harford, T. (2014). Big data: A big mistake?. Significance, 11(5), 14-19.
Hazen, B. T., Boone, C. A., Ezell, J. D., & Jones-Farmer, L. A. (2014). Data quality for data
science, predictive analytics, and big data in supply chain management: An introduction
to the problem and suggestions for research and applications. International Journal of
Production Economics, 154, 72-80.
Hazen, B. T., Overstreet, R. E., & Boone, C. A. (2015). Suggested reporting guidelines for
structural equation modeling in supply chain management research. The International
Journal of Logistics Management, 26(3), 627-641.
Huang, S., & Chaovalitwongse, W. A. (2015). Computational Optimization and Statistical
Methods for Big Data Analytics: Applications in Neuroimaging. In The Operations
Research Revolution (pp. 71-88). INFORMS.
Page 37 of 43 International Journal of Logistics Management
123456789101112131415161718192021222324252627282930313233343536373839404142434445464748495051525354555657585960

International Journal of Logistics Managem
ent
37
Iyer, A., Seshadri, S., & Vasher, R. (2009). Toyota supply chain management: A strategic
approach to Toyota's renowned system. McGraw Hill Professional.
Ji-fan Ren, S., Fosso Wamba, S., Akter, S., Dubey, R., & Childe, S. J. (2016). Modelling quality
dynamics, business value and firm performance in a big data analytics environment.
International Journal of Production Research, 1-16.
Keeso, A. (2014). Big data and environmental sustainability: A conversation starter. Working
paper 14-04, Smith School Working Paper Series.
Ketokivi, M. A., & Schroeder, R. G. (2004). Perceptual measures of performance: fact or
fiction?. Journal of Operations Management, 22(3), 247-264.
Kim, Y., Jeong, S. R., Dwivedi, R., & Zhang, J. (2016). Competitive Intelligence in Social
Media Twitter: iPhone 6 vs. Galaxy S5. Online Information Review, 40(1).
Kitchin, R. (2014). Big Data, new epistemologies and paradigm shifts. Big Data & Society,
1(1), 2053951714528481.
Koo, D., Piratla, K., & Matthews, C. J. (2015). Towards Sustainable Water Supply: Schematic
Development of Big Data Collection Using Internet of Things (IoT). Procedia
Engineering, 118, 489-497.
Koseleva, N., & Ropaite, G. (2017). Big Data in Building Energy Efficiency: Understanding
of Big Data and Main Challenges. Procedia Engineering, 172, 544-549.
Kristof, K., Baedeker, C., Kolberg, S., & Liedtke, C. (2008). Policy instruments for resource
efficiency. Refereed Sessions I-II Monday 10 March, 201.
Kushwaha, G. S., & Sharma, N. K. (2016). Green initiatives: a step towards sustainable
development and firm's performance in the automobile industry. Journal of Cleaner
Production, 121, 116-129.
Laney, D. 2001. "3d Data Management: Controlling Data Volume, Velocity and Variety,"
META
Laroche, M., Bergeron, J., & Barbaro-Forleo, G. (2001). Targeting consumers who are willing to
pay more for environmentally friendly products. Journal of Consumer Marketing, 18(6),
503-520.
Page 38 of 43International Journal of Logistics Management
123456789101112131415161718192021222324252627282930313233343536373839404142434445464748495051525354555657585960

International Journal of Logistics Managem
ent
38
LaValle, S., Lesser, E., Shockley, R., Hopkins, M. S., & Kruschwitz, N. (2011). Big data,
analytics and the path from insights to value. MIT Sloan Management Review, 52(2), 21.
Lawrence, P. R., & Lorsch, J. W. (1967). Differentiation and integration in complex
organizations. Administrative Science Quarterly, 1-47.
Lindsey, A., King, E., McCausland, T., Jones, K., & Dunleavy, E. (2013). What we know and
don't: Eradicating employment discrimination 50 years after the Civil Rights
Act. Industrial and Organizational Psychology, 6(4), 391-413.
Ling-Yee, L. (2007). Marketing resources and performance of exhibitor firms in trade shows: A
contingent resource perspective. Industrial Marketing Management, 36(3), 360-370.
Liu, X., Singh, P. V., & Srinivasan, K. (2016). A structured analysis of unstructured big data by
leveraging cloud computing. Marketing Science, 35(3), 363-388.
Lokers, R., Knapen, R., Janssen, S., van Randen, Y., & Jansen, J. (2016). Analysis of Big
Data technologies for use in agro-environmental science. Environmental Modelling &
Software, 84, 494-504.
Luthra, S., Garg, D., & Haleem, A. (2016). The impacts of critical success factors for
implementing green supply chain management towards sustainability: an empirical
investigation of Indian automobile industry. Journal of Cleaner Production, 121, 142-
158.
Mani, V., Agrawal, R., & Sharma, V. (2014). Supplier selection using social sustainability: AHP
based approach in India. International Strategic Management Review, 2(2), 98-112.
Mani, V., Agrawal, R., & Sharma, V. (2015). Supply chain social sustainability: A comparative
case analysis in indian manufacturing industries. Procedia-Social and Behavioral
Sciences, 189, 234-251.
Manyika, J., Chui, M., Brown, B., Bughin, J., Dobbs, R., Roxburgh, C., & Byers, A. H.
(2011). Big data: The next frontier for innovation, competition, and productivity.
Mata, F. J., Fuerst, W. L., & Barney, J. B. (1995). Information technology and sustained
competitive advantage: A resource-based analysis. MIS quarterly, 487-505.
Page 39 of 43 International Journal of Logistics Management
123456789101112131415161718192021222324252627282930313233343536373839404142434445464748495051525354555657585960

International Journal of Logistics Managem
ent
39
Mateos-Aparicio, G. (2011). Partial least squares (PLS) methods: Origins, evolution, and
application to social sciences. Communications in Statistics-Theory and Methods,
40(13), 2305-2317.
Mayer-Schönberger, V., & Cukier, K. (2013). Big data: A revolution that will transform how
we live, work, and think. Houghton Mifflin Harcourt.
McAfee, A., Brynjolfsson, E., Davenport, T. H., Patil, D. J., & Barton, D. (2012). Big data. The
management revolution. Harvard Bus Rev, 90(10), 61-67.
McGahan, A. (2013). Unlocking the big promise of big data. Totman Management, 6(1), 53-
57.
Miller, D., & Friesen, P. H. (1983). Strategy‐making and environment: the third link. Strategic
Management Journal, 4(3), 221-235.
Minelli, M., Chambers, M., & Dhiraj, A. (2012). Big data, big analytics: emerging business
intelligence and analytic trends for today's businesses. John Wiley & Sons.
Nair, P. R. (2012). Supply Chain Analytics. CSI Communications, 33(9), 11.
Pan, Y., Tian, Y., Liu, X., Gu, D., & Hua, G. (2016). Urban big data and the development of
city intelligence. Engineering, 2(2), 171-178.
Pedler, M., Burgoyne, J., & Boydell, T. (1991). The Learning Company: A strategy for
sustainable growth. Maidenhead, UK: McGraw-Hill.
Peng, D. X., & Lai, F. (2012). Using partial least squares in operations management research:
A practical guideline and summary of past research. Journal of Operations
Management, 30(6), 467-480.
Plambeck, E., Lee, H. L., & Yatsko, P. (2012). Improving environmental performance in your
Chinese supply chain. MIT Sloan Management Review, 53(2), 43.
Podsakoff, P. M., & Organ, D. W. (1986). Self-reports in organizational research: Problems and
prospects. Journal of Management, 12(4), 531-544.
Page 40 of 43International Journal of Logistics Management
123456789101112131415161718192021222324252627282930313233343536373839404142434445464748495051525354555657585960

International Journal of Logistics Managem
ent
40
Podsakoff, P. M., MacKenzie, S. B., Lee, J. Y., & Podsakoff, N. P. (2003). Common method
biases in behavioral research: a critical review of the literature and recommended
remedies. Journal of Applied Psychology, 88(5), 879-903.
Porter, M. E. (1985). Competitive advantage: creating and sustaining superior performance.
1985. New York: FreePress.
Provost, F., & Fawcett, T. (2013).Data science and its relationship to big data and data-driven
decision making. Big Data, 1(1), 51-59.
Reinartz, W., Haenlein, M., & Henseler, J. (2009). An empirical comparison of the efficacy
of covariance-based and variance-based SEM. International Journal of research in
Marketing, 26(4), 332-344.
Revans, R. W. (1982). What is action learning?. Journal of Management Development, 1(3),
64-75.
Ross, J. W., Beath, C. M., & Goodhue, D. L. (1996). Develop long-term competitiveness
through IT assets. Sloan management review, 38(1), 31.
Russom, P. (2011). Big data analytics. TDWI Best Practices Report, Fourth Quarter.
Smart, C., & Vertinsky, I. (1984). Strategy and the environment: A study of corporate responses
to crises. Strategic Management Journal, 5(3), 199-213.
Song, M. L., Fisher, R., Wang, J. L., & Cui, L. B. (2016). Environmental performance evaluation
with big data: Theories and methods. Annals of Operations Research, 1-14.
Song, M., Cen, L., Zheng, Z., Fisher, R., Liang, X., Wang, Y., & Huisingh, D. (2017). How
would big data support societal development and environmental sustainability? Insights
and practices. Journal of Cleaner Production, 142, 489-500.
Stata, R., & Almond, P. (1989). Organizational learning: The key to management innovation.
The training and development sourcebook, 2, 31-42.
Svensson, G., & Wagner, B. (2015). Implementing and managing economic, social and
environmental efforts of business sustainability: Propositions for measurement and
Page 41 of 43 International Journal of Logistics Management
123456789101112131415161718192021222324252627282930313233343536373839404142434445464748495051525354555657585960

International Journal of Logistics Managem
ent
41
structural models. Management of Environmental Quality: An International Journal,
26(2), 195-213.
Swanson, L. A., & Zhang, D. D. (2012). Perspectives on corporate responsibility and sustainable
development. Management of Environmental Quality: An International Journal, 23(6),
630-639.
Teece, D. J. (2015). Intangible assets and a theory of heterogeneous firms. In Intangibles,
Market Failure and Innovation Performance (pp. 217-239). Springer International
Publishing.
Thun, J. H., & Hoenig, D. (2011). An empirical analysis of supply chain risk management in
the German automotive industry. International Journal of Production
Economics, 131(1), 242-249.
Tomer, J. F. (1987). Organizational capital: The path to higher productivity and well-being.
Praeger publishers.
Trudel, R., & Cotte, J. (2009). Does it pay to be good?. MIT Sloan Management Review, 50(2),
61.
Vachon, S., & Klassen, R. D. (2002). An exploratory investigation of the effects of supply chain
complexity on delivery performance. IEEE Transactions on Engineering Management,
49(3), 218-230.
Van Der Aalst, W. (2012). Process mining: Overview and opportunities. ACM Transactions
on Management Information Systems, 3(2), 7.
Virakul, B. (2015). Global challenges, sustainable development, and their implications for
organizational performance. European Business Review, 27(4), 430-446.
Waller, M. A., & Fawcett, S. E. (2013). Data science, predictive analytics, and big data: a
revolution that will transform supply chain design and management. Journal of Business
Logistics, 34(2), 77-84.
Wamba, S. F., Akter, S., Edwards, A., Chopin, G., & Gnanzou, D. (2015). How ‘big data’can
make big impact: Findings from a systematic review and a longitudinal case
study. International Journal of Production Economics, 165, 234-246.
Page 42 of 43International Journal of Logistics Management
123456789101112131415161718192021222324252627282930313233343536373839404142434445464748495051525354555657585960

International Journal of Logistics Managem
ent
42
Wamba, S. F., Gunasekaran, A., Akter, S., Ren, S. J. F., Dubey, R., & Childe, S. J. (2017). Big
data analytics and firm performance: Effects of dynamic capabilities. Journal of Business
Research, 70, 356-365.
Williamson, O. E. (1975). Markets and hierarchies. New York, 26-30.
Wilson, J. P. (2015). The triple bottom line: undertaking an economic, social, and environmental
retail sustainability strategy. International Journal of Retail & Distribution Management,
43(4/5), 432-447.
Winston, A. (2014). Resilience in a hotter world. Harvard business review,92(4), 56-64.
Wixom, B. H., & Watson, H. J. (2001). An empirical investigation of the factors affecting data
warehousing success. MIS quarterly, 17-41.
Wolfert, S., Ge, L., Verdouw, C., & Bogaardt, M. J. (2017). Big Data in Smart Farming–A
review. Agricultural Systems, 153, 69-80.
Wu, Z., & Pagell, M. (2011). Balancing priorities: Decision-making in sustainable supply
chain management. Journal of Operations Management, 29(6), 577-590.
Xie, H., He, Y., & Xie, X. (2017). Exploring the factors influencing ecological land change
for China's Beijing–Tianjin–Hebei region using big data. Journal of Cleaner
Production, 142, 677-687.
Zadek, S. (2004). The path to corporate responsibility. Harvard business review, 82(12).
Zhao, R., Liu, Y., Zhang, N., & Huang, T. (2017). An optimization model for green supply chain
management by using a big data analytic approach. Journal of Cleaner Production, 142,
1085-1097.
Zhong, R. Y., Huang, G. Q., Lan, S., Dai, Q. Y., Chen, X., & Zhang, T. (2015). A big data
approach for logistics trajectory discovery from RFID-enabled production data.
International Journal of Production Economics, 165, 260-272.
Page 43 of 43 International Journal of Logistics Management
123456789101112131415161718192021222324252627282930313233343536373839404142434445464748495051525354555657585960