Embed Size (px)
Citation preview

IMPACT EVALUATION OF A DRIVING SUPPORT SYSTEM ON
TRAFFIC FLOW BY MICROSCOPIC TRAFFIC SIMULATION
Makoto Okamura
Almec Corporation, 1-19-14, Aobadai, Meguro, Tokyo 153-0042, Japan,
e-mail: [email protected]
Atsushi Fukuda
Professor, College of Science and Technology, Nihon University, 7-24-1 Narashinodai
Funabashi, Chiba 274-8501, Japan, e-mail: [email protected]
Hirohisa Morita
Professor, Advanced Research Institute for the Sciences and Humanities, Nihon University, 7-
24-1 Narashinodai Funabashi, Chiba 274-8501, Japan, e-mail: [email protected]
Hironori Suzuki
Assistant Professor, Nippon Institute of Technology, 4-1 Gakuendai, Miyashiro-Machi,
Minamisaitama-Gun, Saitama 345-8501, Japan, e-mail: [email protected]
Masatoshi Nakazawa
Graduate School of Science and Technology
Nihon University, 7-24-1 Narashinodai Funabashi, Chiba 274-8501, Japan,
e-mail: [email protected]
Submitted to the 3rd
International Conference on Road Safety and Simulation,
September 14-16, 2011, Indianapolis, USA
ABSTRACT
In this study, we estimated dangerous traffic situations by installing a driving support system
and using a microscopic traffic simulation which was modified by adding the function of
perception-response process. In this approach, a dangerous situation is assessed by detecting
conflict through simulation. For this assessment, a safety indicator named TIDSS (Time
Integral of Difference of Space distance and Stopping distance) was defined from the time
integral of the relative distance between the leading and following vehicle when the leading
vehicle brakes suddenly. This indicator is superior to existing indicators because it can
evaluate any type of situation and consider the degree and duration of danger for each vehicle.
The proposed approach was applied to evaluate the adaptive cruise control system (ACC) and
automated platoon system (APS) for heavy trucks on the Tokyo metropolitan expressway. To
evaluate the impact of ACC and APS on traffic flow, many cases with different installation
rates of ACC and APS were simulated using the proposed approach, and the relation between
installation rate, safety indicators, and traffic flow rate was analyzed. Thus, we found that the
introduction of ACC might mitigate dangerous situations on the expressway by decreasing the
traffic flow rate. In contrast, introduction of APS might mitigate dangerous situations and
increase the traffic flow rate.
Keywords: Adaptive cruise control system, microscopic traffic simulation, traffic safety
indicator
INTRODUCTION
A driving support system has been developed to reduce traffic accidents as well as traffic
congestion. For example, the adaptive cruise control system (ACC) is one of such driving
support systems, which helps to avoid rear-end collisions by maintaining the headway
distance, and it has found widespread use in Japan, gradually. However, at the early stages of
the ACC promotion, it was expected that a mixture of vehicles with and without ACC might
trigger an increase in the number of vehicles cutting in the traffic stream and add to traffic
congestion because a vehicle with ACC intends to maintain a long headway. Thus, this
practice might decrease the safety and traffic flow rate. Therefore, it is necessary to evaluate
the impact on traffic flow of the introduction of a driving support system. Until now, a driving
support system has been evaluated in tests that used a single vehicle or simulator. However,
the impact on traffic flow of the driving support system installation has not been evaluated
because of the difficulty in evaluating accident occurrences with respect to the complexity of
the interaction between vehicles with and without a driving support system.
Thus, this study proposes an approach to evaluate the impact of a driving support system on
traffic safety and traffic flow by using a microscopic traffic simulation model that can
represent the driving behavior of the individual driver/vehicle. In the proposed model, the
driving behavior was represented by adding the function of the perception-response process
and then detected the conflicts or near miss situations that suggest a potential accident
between vehicles on the existing microscopic traffic simulation. The simulation model
consisted of Paramics and the behavior of with/without the driving support system was
rewritten by API. In addition, the proposed evaluation method used a traffic safety indicator,
which represents conflicts instead of actual traffic accidents. This study first examined the
proposed traffic safety indicators for the case of ACC in a traffic stream at a metropolitan
expressway as well as the automated platoon system for heavy trucks (APS), which was also
one of the driving support systems tested in Japan. Many cases with different installation rates
of ACC and APS were simulated using the proposed approach and the relation between
installation rate and safety indicator was assessed.
LITERATURE REVIEW
Existing Evaluation Approach
To date, a lot of driving support systems have been developed and their feasibility was
evaluated through real-world field tests, and driving and microscopic traffic simulation. By
using real vehicle tests, the function of the driving support system could be evaluated based
on actual driving behavior in a real road network (Mizutani, 2007). However, the influence of
the driving system to other vehicles in the traffic stream was not evaluated. Road environment
can be simulated using a driving simulator so that the function of a driving support system can
be evaluated under various traffic situations. However, the influence to other vehicles could
not be evaluated even with a driving simulator (Shimizu et al. 2006). A microscopic traffic
simulation might be an alternative approach to evaluate the driving support system, which
makes possible the measurement of the impact on traffic flow. U.S. DOT developed the
Surrogate Safety Assessment Model (SSAM), which combined existing microscopic traffic
simulation and automated conflict analysis (2009). However, the vehicle behavior of the
existing microscopic traffic simulation is based on uniform car behavior, and consequently
traffic accidents or dangerous situations are not simulated. Because of this, the impact of any
ITS installation on traffic safety cannot be evaluated by microscopic traffic simulation.
Several attempts were made to combine a driving simulator with a microscopic traffic
simulator (Hasegawa, 2007). However, it has not been used widely because it requires large-
scale equipment.
Evaluation of the Driving Support System
The evaluation of the ACC installation has been attempted. For instance, Fukuda et al. (2007)
reported that ACC prevents speed degradation on road sag. Suzuki et al. (2004) concluded
that ACC is effective in reducing travel time when the setting headway time is about 1.0 s. In
contrast, Miderhoud et al. (1999) mentioned that ACC decreases the traffic flow rate when its
setting headway time is longer than the actual traffic flow. Thus, the impact of ACC showed
different results according to the reproducibility of the model and the parameter settings of
ACC.
Several researchers have attempted to evaluate the impact of the ACC installation on traffic
safety in a traffic stream. Minderhoud et al. (2001) have reported that dangerous situations
increase because of the ACC installation. Nevertheless, the microscopic traffic simulation
used in this study could not account for driving errors and behavior. Thus, the result may
differ from a real situation. There have been fewer attempts to evaluate the impact of a driving
support system on traffic flow safety conditions.
The studies of the APS impact on traffic flow are limited because the platoon system is
presently in the development stage.
Thus, it is important for the proposed evaluation process of the impact of the driving support
system on traffic flow to discuss the spread process and control techniques of the driving
support system.
DEVELOPMENT OF THE MICROSCOPIC TRAFFIC SIMULATION MODEL
Typical vehicle behavior model
The vehicle velocity of the existing microscopic traffic simulation is based on a model of a
car following the current velocity, position, and acceleration rate of the leading and following
vehicles. All vehicles in the microscopic traffic simulation model are controlled in the same
manner. Actually, the vehicle behavior is controlled by the perception-response process
function of the driver and a traffic accident happens by errors in the perception-response
process. A driving support system such as ACC contributes to traffic safety by preventing
errors. Thus, this study basically modified the existing microscopic simulation model by
adding the perception-response process function.
In this study, we employed Xin’s model (Xin, 2008), which is based on the car following
model and includes the perception-response process of the Gipps model (Gipps, 1981). The
perception-response process is based on three factors, which are the visual expansion rate, the
change of distance, and the instantaneous time gap. The visual expansion rate is calculated
from the vehicle width, relative speed, and headway distance. The change of distance is
simply the difference between the current headway distance and the headway distance at the
previous scanning interval. The instantaneous time gap is derived by dividing the current
headway distance by the vehicle’s instantaneous speed. At each scanning interval of the driver,
the following questions are checked:
1. True or False: visual expansion rate θ exceeds the threshold Cθ.
2. True or False: change of distance exceeds the threshold CD.
3. True or False: gap time outside of [(1-Eg) tg’, (1+Eg) tg’].
Eg = time gap error; tg’ = driver’s desired following gap time.
If all answers are false, the vehicle cannot recognize the changing velocity of the front vehicle.
Thus, the vehicle continues to either accelerate or decelerate. When none of the above checks
is true, the vehicle can recognize the changing velocity of front vehicle. Then, the vehicle
calculates a new acceleration following the Gipps model, which is shown in Eqs. (1-3)
*
+ (1)
+ 2.5𝑎 𝑡𝑔 (1 −𝑉𝑛 𝑡
𝑉𝑛𝑚𝑎𝑥)√0.025 +
𝑉𝑛 𝑡
𝑉𝑛𝑚𝑎𝑥 (2)
( )
−𝑡𝑔𝑏 +
√𝑡𝑔2𝑏
2 + 𝑏 {2(𝑥 −1 − 𝑥 − 𝑆0) − 𝑡𝑔 + −1
2
�� −1⁄ }
(3),
where
tg: reaction time (sec);
an: maximum comfortable acceleration rate for vehicle n (m/s2);
bn: maximum comfortable braking rate for vehicle n (m/s2);
xn, xn-1: position of vehicle n and n-1, respectively (m);
−1: nth driver’s estimation for n-1th vehicle maximum comfortable braking rate
(m/s2);
Vnmax
: desired free flow speed of vehicle n (m/s);
S0: headway distance at standstill (m);
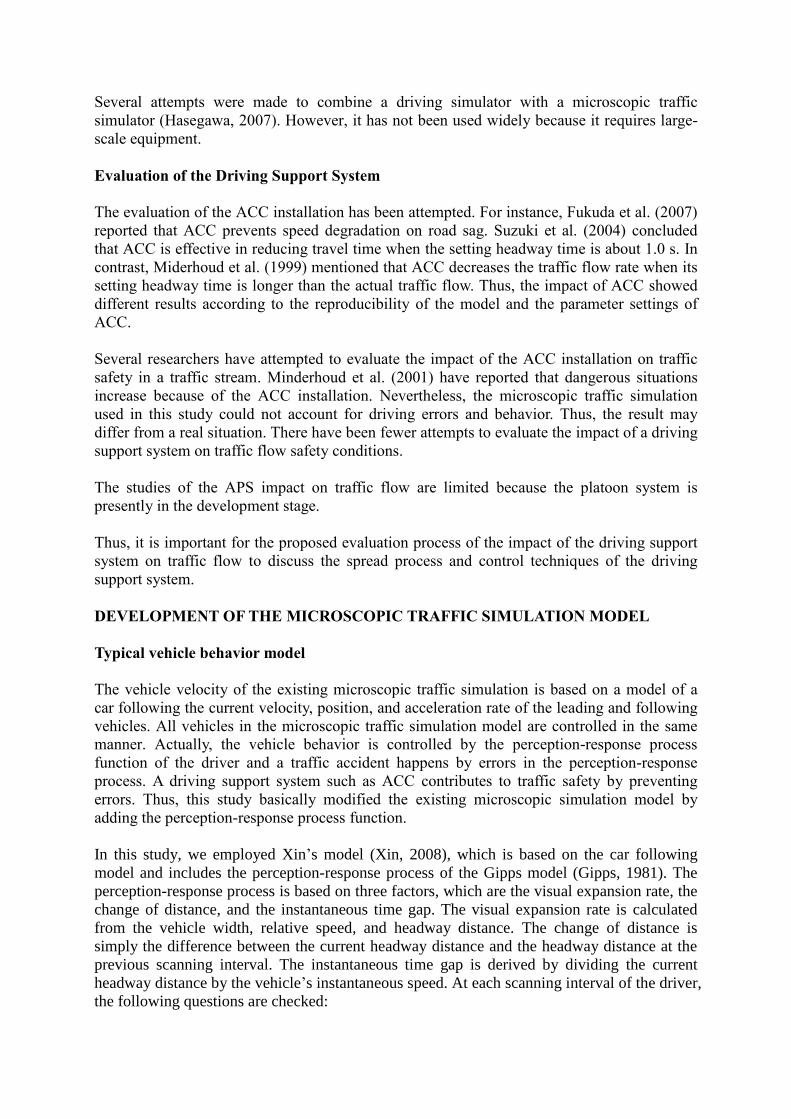
Xin’s model considers the behavior of the front vehicle. However, the driver actually
perceives not only the changing velocity of the front vehicle but also several of the vehicles in
front. Therefore, in this study, the perception process based on the visual expansion rate and
change distance is expanded to the second vehicle in front when the following conditions are
satisfied. The conditions are shown in Fig. 1 and are based on the results of the research done
by Suzuki (Suzuki, 2009):
1. The following vehicle is a passenger car, the first vehicle in front is a passenger car,
and the second vehicle in front is a truck.
2. The following vehicle is a truck and the first vehicle in front is a passenger car.
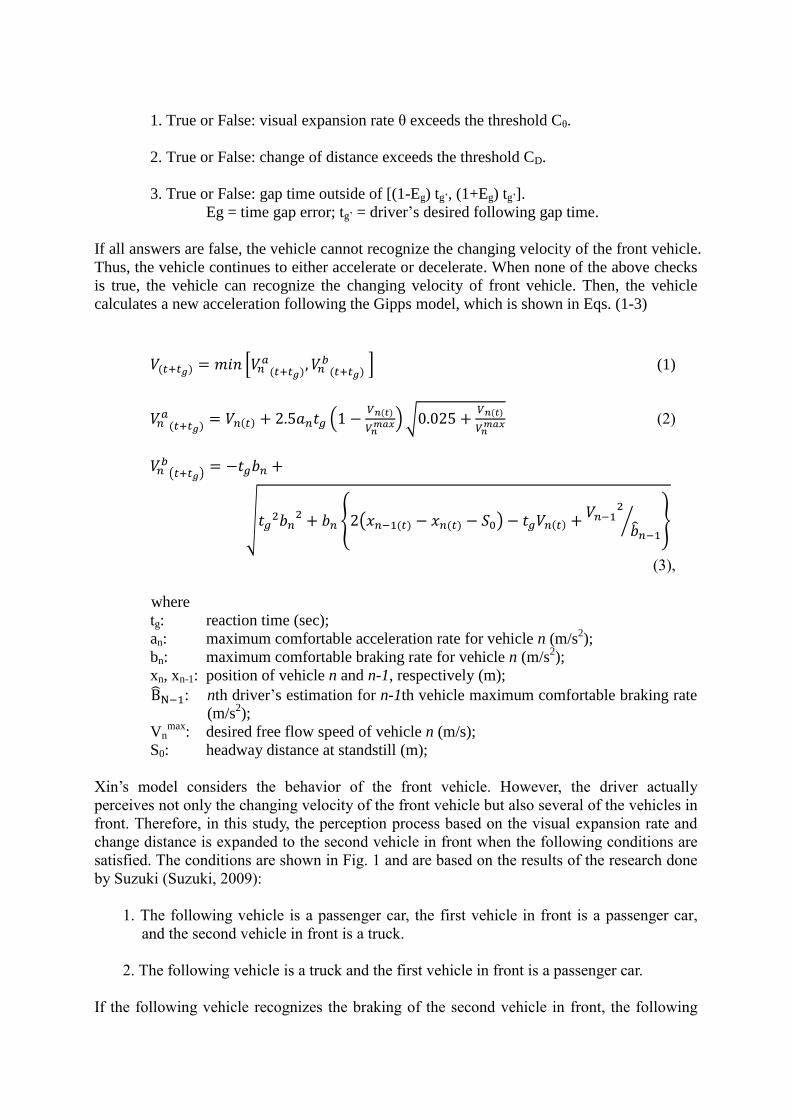
If the following vehicle recognizes the braking of the second vehicle in front, the following
vehicle will brake in advance. The chart of the simulation model for a vehicle without the
driving support systems (typical vehicle) is shown in Fig. 2.
Figure 1 Condition for recognizing the second vehicle in front
Figure 2 Flow chart of the simulation model for typical vehicle
The parameters in the proposed model were set randomly based on real following vehicle data
obtained by the Japan Automobile Research Institute and the Japanese Industrial Standards:
P: Passenger vehicle, T; Truck,
Cθ: The threshold, normal distribution N (0.058, 0.00867),
CD: The threshold, normal distribution N (0.036, 0.08),
Eg: Time gap error, normal distribution N (0.095, 0.071) sec,
tg’: Reaction time of ACC, 1.5 sec,
Second vehicle
in the front
First vehicle
in the front
Following
vehicle
1.Following vehicle is passenger car, first
vehicle in the front is passenger car and
second vehicle in the front is truck.
2. Following vehicle is truck and first
vehicle in the front is passenger car.
Normal vehicle
The following vehicle
perceives deceleration of
second vehicle of the
front
The following vehicle
perceives deceleration/
acceleration of first
vehicle of the front
Decide the velocity by Gipps Model Keep the acceleration
Calculate traffic safety indicator value
yes
no
yes
no
yes
no
Repeat by driver’s reaction time
tg: Reaction time, lognormal distribution P: N (1.08, 0.43) sec, T: N (0.92,
0.51) sec,
a: Maximum comfortable acceleration rate, normal distribution P: N (2.6,
0.57) m/s2, T: N (2.0, 0.25) m/s
2,
b: Maximum comfortable braking rate, normal distribution P: N (3.5, 1.11)
m/s2, T: N (3.1, 0.85) m/s
2,
Vmax
: Desired free flow speed, normal distribution N (27.3, 4.42) m/s,
b: Estimation maximum comfortable braking rate, P: N (3.5, 1.11) m/s2, T: N
(3.1, 0.85) m/s2,
S0: Headway distance at standstill, normal distribution, P: N (4.6, 1.65) m, T: N
(4.5, 1.65) m,
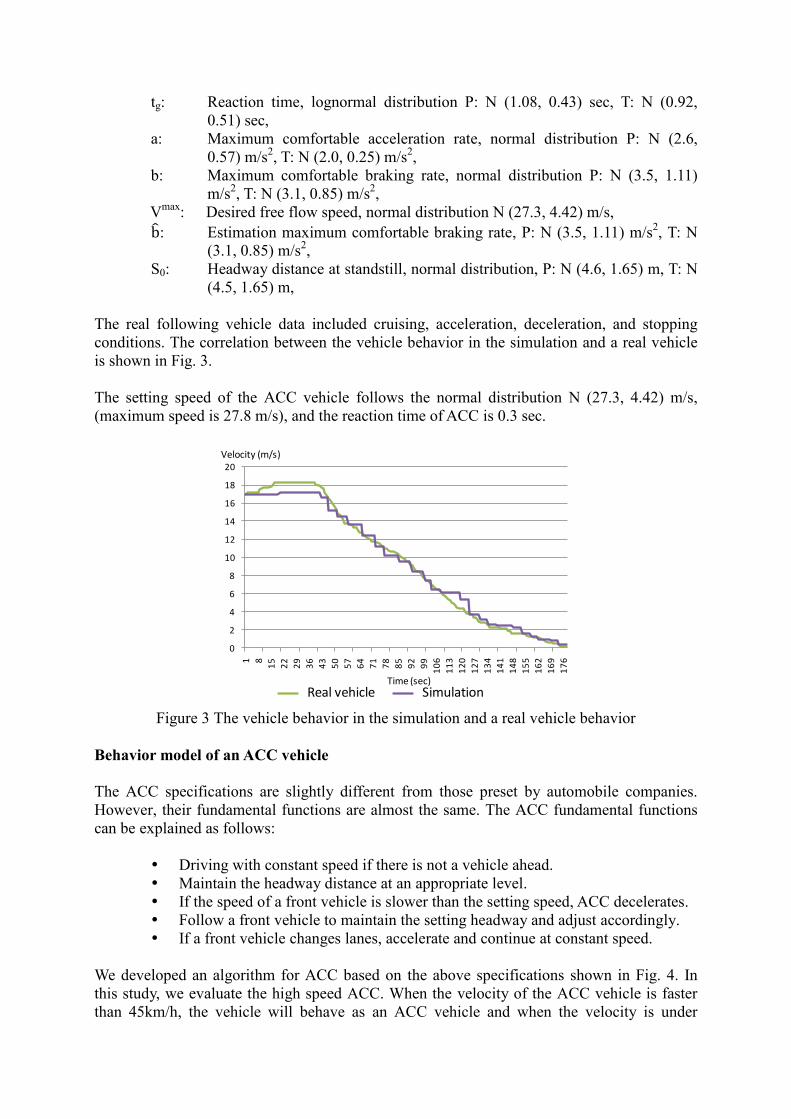
The real following vehicle data included cruising, acceleration, deceleration, and stopping
conditions. The correlation between the vehicle behavior in the simulation and a real vehicle
is shown in Fig. 3.
The setting speed of the ACC vehicle follows the normal distribution N (27.3, 4.42) m/s,
(maximum speed is 27.8 m/s), and the reaction time of ACC is 0.3 sec.
Figure 3 The vehicle behavior in the simulation and a real vehicle behavior
Behavior model of an ACC vehicle
The ACC specifications are slightly different from those preset by automobile companies.
However, their fundamental functions are almost the same. The ACC fundamental functions
can be explained as follows:
Driving with constant speed if there is not a vehicle ahead.
Maintain the headway distance at an appropriate level.
If the speed of a front vehicle is slower than the setting speed, ACC decelerates.
Follow a front vehicle to maintain the setting headway and adjust accordingly.
If a front vehicle changes lanes, accelerate and continue at constant speed.
We developed an algorithm for ACC based on the above specifications shown in Fig. 4. In
this study, we evaluate the high speed ACC. When the velocity of the ACC vehicle is faster
than 45km/h, the vehicle will behave as an ACC vehicle and when the velocity is under
0
2
4
6
8
10
12
14
16
18
20
1 8
15
22
29
36
43
50
57
64
71
78
85
92
99
10
6
11
3
12
0
12
7
13
4
14
1
14
8
15
5
16
2
16
9
17
6
3台目(実測値) 3台目(構築したモデル)
Velocity (m/s)
Real vehicle SimulationTime (sec)
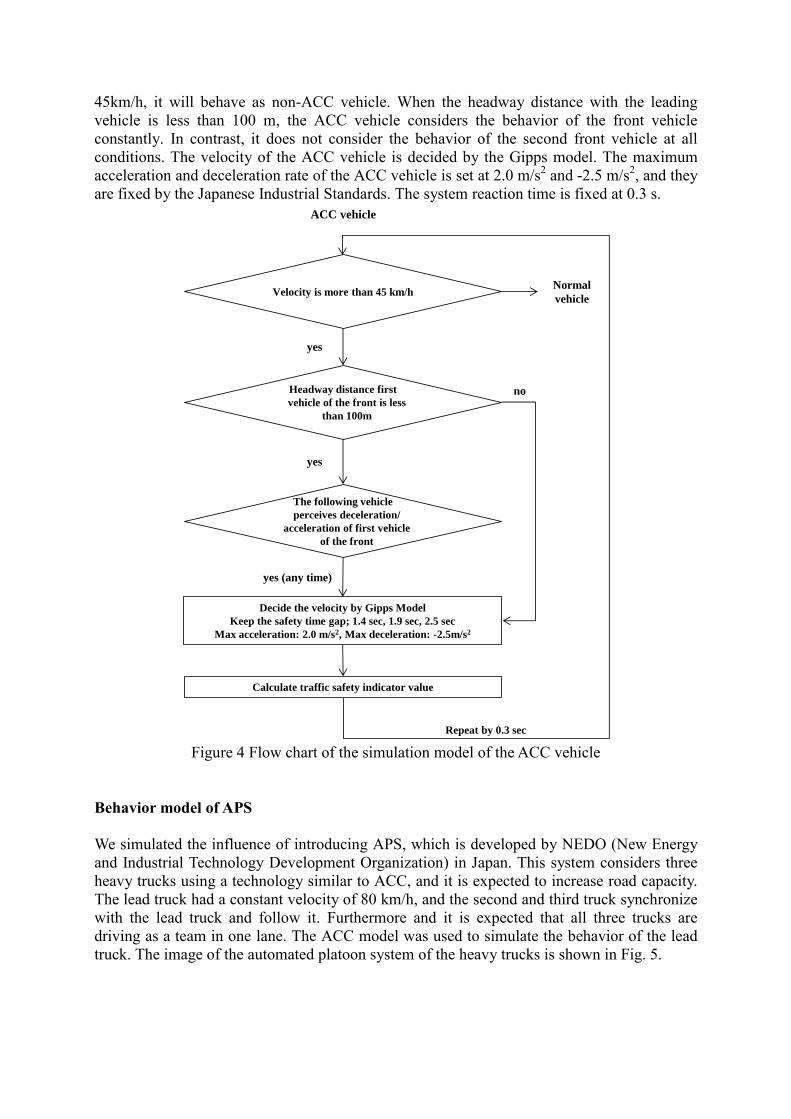
45km/h, it will behave as non-ACC vehicle. When the headway distance with the leading
vehicle is less than 100 m, the ACC vehicle considers the behavior of the front vehicle
constantly. In contrast, it does not consider the behavior of the second front vehicle at all
conditions. The velocity of the ACC vehicle is decided by the Gipps model. The maximum
acceleration and deceleration rate of the ACC vehicle is set at 2.0 m/s2 and -2.5 m/s
2, and they
are fixed by the Japanese Industrial Standards. The system reaction time is fixed at 0.3 s.
Figure 4 Flow chart of the simulation model of the ACC vehicle
Behavior model of APS
We simulated the influence of introducing APS, which is developed by NEDO (New Energy
and Industrial Technology Development Organization) in Japan. This system considers three
heavy trucks using a technology similar to ACC, and it is expected to increase road capacity.
The lead truck had a constant velocity of 80 km/h, and the second and third truck synchronize
with the lead truck and follow it. Furthermore and it is expected that all three trucks are
driving as a team in one lane. The ACC model was used to simulate the behavior of the lead
truck. The image of the automated platoon system of the heavy trucks is shown in Fig. 5.
Headway distance first
vehicle of the front is less
than 100m
Velocity is more than 45 km/h
The following vehicle
perceives deceleration/
acceleration of first vehicle
of the front
Decide the velocity by Gipps Model
Keep the safety time gap; 1.4 sec, 1.9 sec, 2.5 sec
Max acceleration: 2.0 m/s2, Max deceleration: -2.5m/s2
Calculate traffic safety indicator value
ACC vehicle
Normal
vehicle
yes
yes
yes (any time)
no
Repeat by 0.3 sec
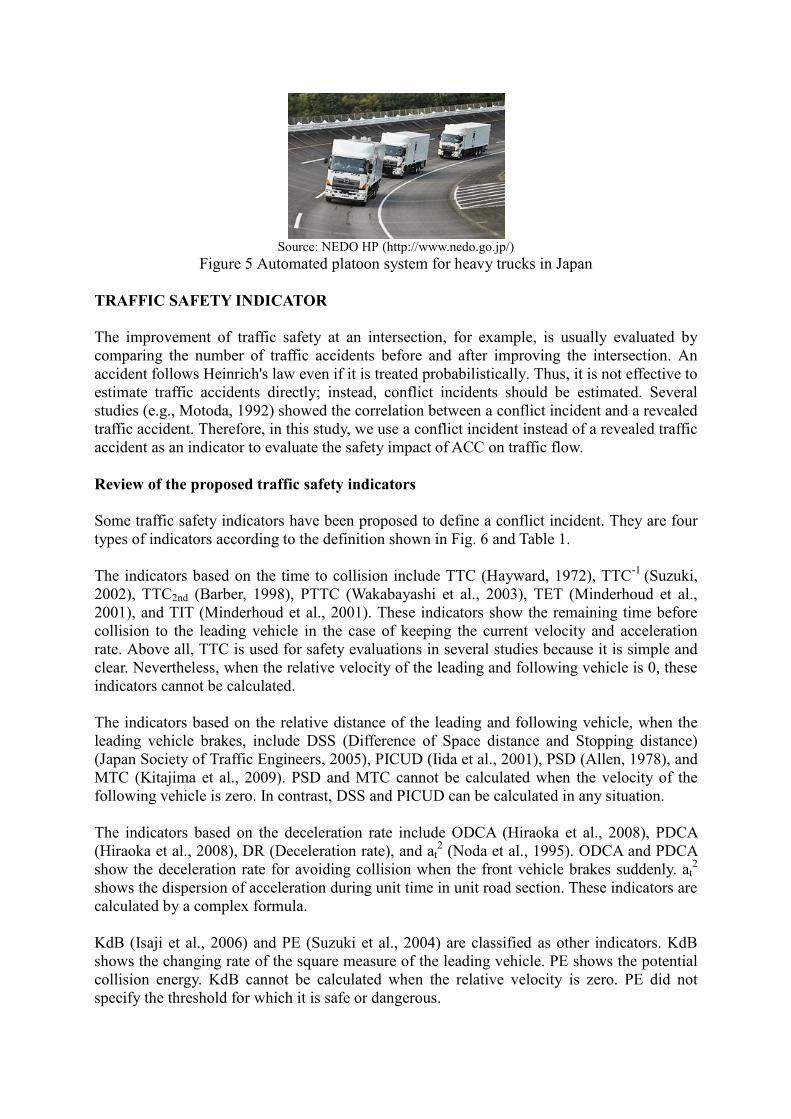
Source: NEDO HP (http://www.nedo.go.jp/)
Figure 5 Automated platoon system for heavy trucks in Japan
TRAFFIC SAFETY INDICATOR
The improvement of traffic safety at an intersection, for example, is usually evaluated by
comparing the number of traffic accidents before and after improving the intersection. An
accident follows Heinrich's law even if it is treated probabilistically. Thus, it is not effective to
estimate traffic accidents directly; instead, conflict incidents should be estimated. Several
studies (e.g., Motoda, 1992) showed the correlation between a conflict incident and a revealed
traffic accident. Therefore, in this study, we use a conflict incident instead of a revealed traffic
accident as an indicator to evaluate the safety impact of ACC on traffic flow.
Review of the proposed traffic safety indicators
Some traffic safety indicators have been proposed to define a conflict incident. They are four
types of indicators according to the definition shown in Fig. 6 and Table 1.
The indicators based on the time to collision include TTC (Hayward, 1972), TTC-1
(Suzuki,
2002), TTC2nd (Barber, 1998), PTTC (Wakabayashi et al., 2003), TET (Minderhoud et al.,
2001), and TIT (Minderhoud et al., 2001). These indicators show the remaining time before
collision to the leading vehicle in the case of keeping the current velocity and acceleration
rate. Above all, TTC is used for safety evaluations in several studies because it is simple and
clear. Nevertheless, when the relative velocity of the leading and following vehicle is 0, these
indicators cannot be calculated.
The indicators based on the relative distance of the leading and following vehicle, when the
leading vehicle brakes, include DSS (Difference of Space distance and Stopping distance)
(Japan Society of Traffic Engineers, 2005), PICUD (Iida et al., 2001), PSD (Allen, 1978), and
MTC (Kitajima et al., 2009). PSD and MTC cannot be calculated when the velocity of the
following vehicle is zero. In contrast, DSS and PICUD can be calculated in any situation.
The indicators based on the deceleration rate include ODCA (Hiraoka et al., 2008), PDCA
(Hiraoka et al., 2008), DR (Deceleration rate), and at2 (Noda et al., 1995). ODCA and PDCA
show the deceleration rate for avoiding collision when the front vehicle brakes suddenly. at2
shows the dispersion of acceleration during unit time in unit road section. These indicators are
calculated by a complex formula.
KdB (Isaji et al., 2006) and PE (Suzuki et al., 2004) are classified as other indicators. KdB
shows the changing rate of the square measure of the leading vehicle. PE shows the potential
collision energy. KdB cannot be calculated when the relative velocity is zero. PE did not
specify the threshold for which it is safe or dangerous.
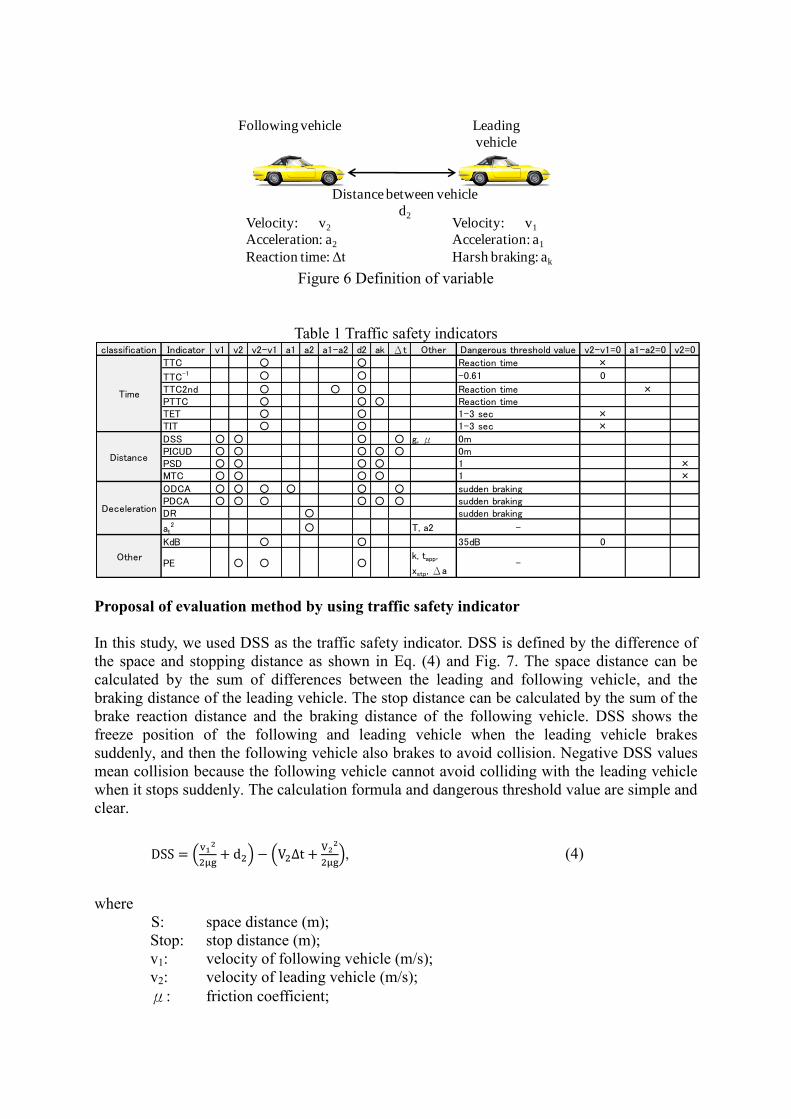
Figure 6 Definition of variable
Table 1 Traffic safety indicators
Proposal of evaluation method by using traffic safety indicator
In this study, we used DSS as the traffic safety indicator. DSS is defined by the difference of
the space and stopping distance as shown in Eq. (4) and Fig. 7. The space distance can be
calculated by the sum of differences between the leading and following vehicle, and the
braking distance of the leading vehicle. The stop distance can be calculated by the sum of the
brake reaction distance and the braking distance of the following vehicle. DSS shows the
freeze position of the following and leading vehicle when the leading vehicle brakes
suddenly, and then the following vehicle also brakes to avoid collision. Negative DSS values
mean collision because the following vehicle cannot avoid colliding with the leading vehicle
when it stops suddenly. The calculation formula and dangerous threshold value are simple and
clear.
DSS (v1
2
2μg+ d2) − (V2∆t +
V22
2μg), (4)
where
S: space distance (m);
Stop: stop distance (m);
v1: velocity of following vehicle (m/s);
v2: velocity of leading vehicle (m/s);
μ: friction coefficient;
Leading
vehicle
Following vehicle
Velocity: v1
Acceleration: a1
Harsh braking: ak
Velocity: v2
Acceleration: a2
Reaction time: Δt
Distance between vehicle
d2
classification Indicator v1 v2 v2-v1 a1 a2 a1-a2 d2 ak Δt Other Dangerous threshold value v2-v1=0 a1-a2=0 v2=0
TTC ○ ○ Reaction time ×
TTC-1 ○ ○ -0.61 0
TTC2nd ○ ○ ○ Reaction time ×PTTC ○ ○ ○ Reaction timeTET ○ ○ 1-3 sec ×TIT ○ ○ 1-3 sec ×
DSS ○ ○ ○ ○ g, μ 0mPICUD ○ ○ ○ ○ ○ 0mPSD ○ ○ ○ ○ 1 ×MTC ○ ○ ○ ○ 1 ×
ODCA ○ ○ ○ ○ ○ ○ sudden brakingPDCA ○ ○ ○ ○ ○ ○ sudden brakingDR ○ sudden braking
at2 ○ T, a2 -
KdB ○ ○ 35dB 0
PE ○ ○ ○k, tapp,
xstp, Δa-
Time
Distance
Deceleration
Other

g: gravity acceleration (m/s2);
d2: distance between leading vehicle and following vehicle (m);
⊿t: reaction time (sec).
Figure 7 Definitions of DSS
Clearly, a method, which can evaluate the traffic flow safety, is needed. In the existing
studies, the traffic flow safety was evaluated by the number of unsafe vehicles that were
defined by the traffic safety indicator. In the case of DSS, when DSS is under 0 m, an unsafe
vehicle can be defined. However, this evaluation method cannot consider the degree of danger
as well as the duration. Therefore, this study proposes a new evaluation method that evaluates
the safety of traffic flow by the total value of the time integrated value gap between DSS and
the dangerous threshold value (Time Integrated DSS; TIDSS) as shown in Eq. (5) and Fig. 8.
TIDSS ∫ {TH − DSS }dtt
0 (5)
Where:
T: Time (sec);
TH: Threshold value (m);
Figure 8 Example of safety evaluation by using TIDSS
Leading vehiclev1
v1=0Distance between
leading vehicle and
following vehicle:
d2
Following vehicle
S=v12/2μg+d2
Stop=v2Δt+v22/2μg
DSS
v2
Break reaction
distance
v2Δt
Breaking distance of
following vehicle:
v22/2μg
v2=0
v2
Following vehicle
Breaking distance of following
vehicle:
v12/2μg
Threshold
value
-6
-4
-2
0
2
4
6
0 5 10 15 20 25 30
S-Stop
Time
S-Stop (m)
This method can consider both the degree and duration of danger. In this study, the existing
and the new method are observed depending on the driving support system installation rate in
the traffic flow.
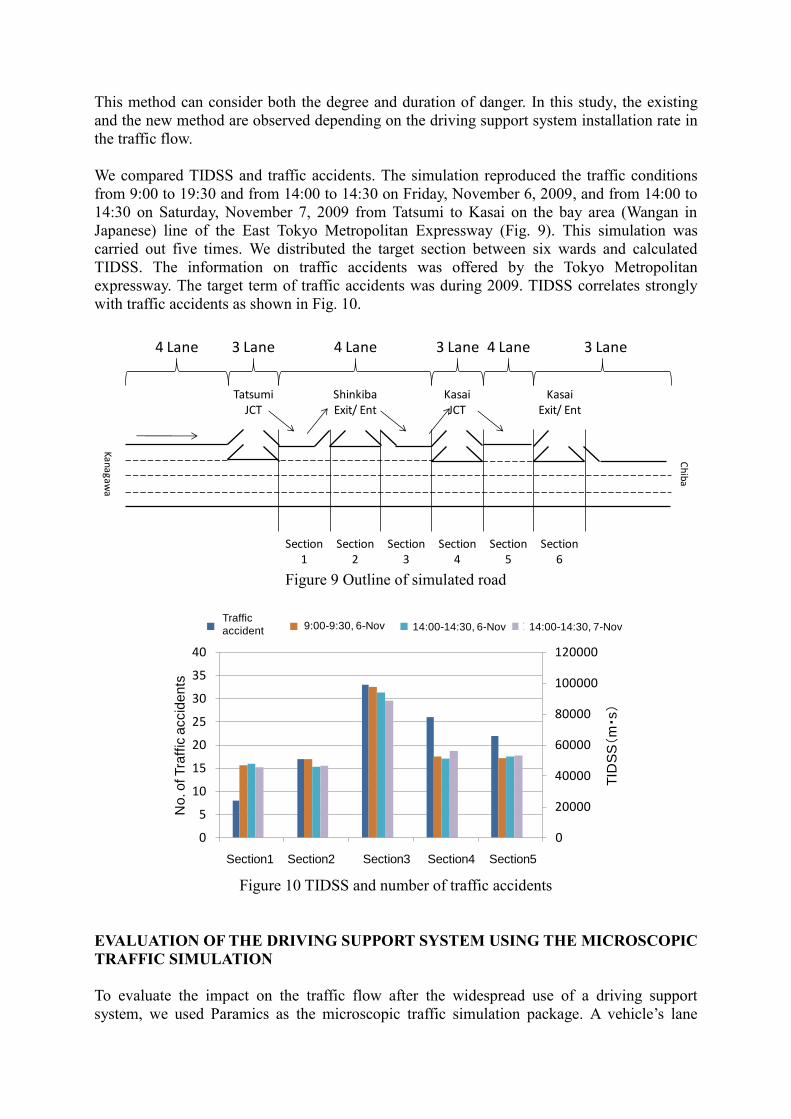
We compared TIDSS and traffic accidents. The simulation reproduced the traffic conditions
from 9:00 to 19:30 and from 14:00 to 14:30 on Friday, November 6, 2009, and from 14:00 to
14:30 on Saturday, November 7, 2009 from Tatsumi to Kasai on the bay area (Wangan in
Japanese) line of the East Tokyo Metropolitan Expressway (Fig. 9). This simulation was
carried out five times. We distributed the target section between six wards and calculated
TIDSS. The information on traffic accidents was offered by the Tokyo Metropolitan
expressway. The target term of traffic accidents was during 2009. TIDSS correlates strongly
with traffic accidents as shown in Fig. 10.
Figure 9 Outline of simulated road
Figure 10 TIDSS and number of traffic accidents
EVALUATION OF THE DRIVING SUPPORT SYSTEM USING THE MICROSCOPIC
TRAFFIC SIMULATION
To evaluate the impact on the traffic flow after the widespread use of a driving support
system, we used Paramics as the microscopic traffic simulation package. A vehicle’s lane
4 Lane 3 Lane 4 Lane 3 Lane 4 Lane 3 Lane
TatsumiJCT
ShinkibaExit/ Ent
KasaiJCT
KasaiExit/ Ent
Kanagawa
Chiba
Section 1
Section 2
Section 3
Section 4
Section 5
Section 6
0
20000
40000
60000
80000
100000
120000
0
5
10
15
20
25
30
35
40
区間1 区間2 区間3 区間4 区間5
TID
SS(m・s)
No. of Tra
ffic
accid
ents
事故データ 1106-0900-0930 1106-1400-1430 1107-1400-1430
Section1 Section2 Section3 Section4 Section5
Traffic
accident 9:00-9:30, 6-Nov 14:00-14:30, 6-Nov 14:00-14:30, 7-Nov
changing behavior depended on the initial setting of Paramics.
Evaluation of the ACC instauration
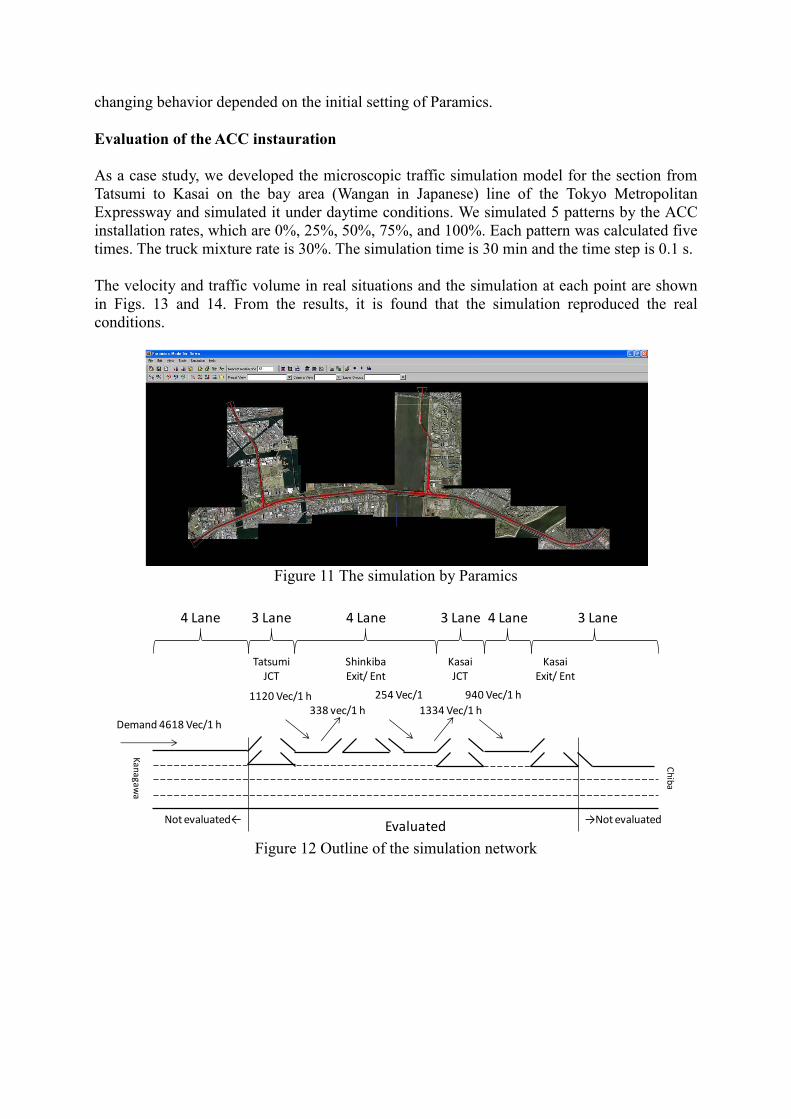
As a case study, we developed the microscopic traffic simulation model for the section from
Tatsumi to Kasai on the bay area (Wangan in Japanese) line of the Tokyo Metropolitan
Expressway and simulated it under daytime conditions. We simulated 5 patterns by the ACC
installation rates, which are 0%, 25%, 50%, 75%, and 100%. Each pattern was calculated five
times. The truck mixture rate is 30%. The simulation time is 30 min and the time step is 0.1 s.
The velocity and traffic volume in real situations and the simulation at each point are shown
in Figs. 13 and 14. From the results, it is found that the simulation reproduced the real
conditions.
Figure 11 The simulation by Paramics
Figure 12 Outline of the simulation network
4 Lane
Demand 4618 Vec/1 h
Not evaluated← →Not evaluated
3 Lane 4 Lane 3 Lane 4 Lane 3 Lane
TatsumiJCT
ShinkibaExit/ Ent
KasaiJCT
KasaiExit/ Ent
1120 Vec/1 h 254 Vec/1 940 Vec/1 h
Ka
na
ga
wa
Chiba
338 vec/1 h 1334 Vec/1 h
Evaluated
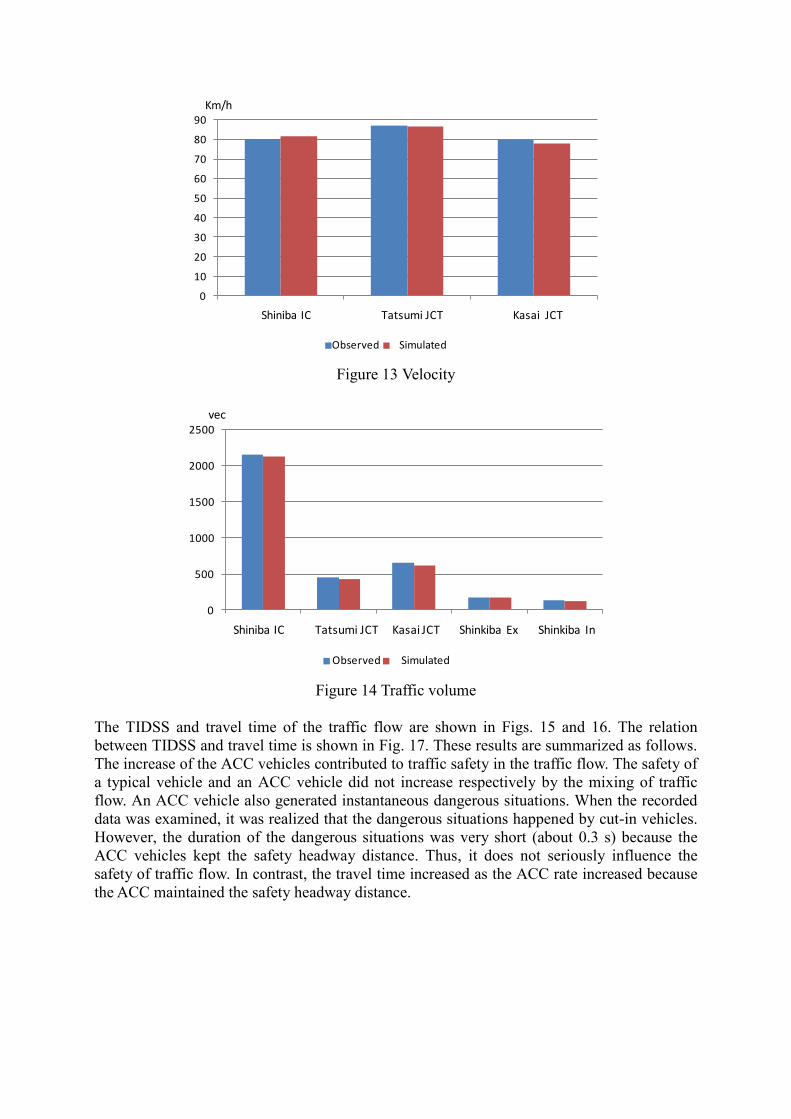
Figure 13 Velocity
Figure 14 Traffic volume
The TIDSS and travel time of the traffic flow are shown in Figs. 15 and 16. The relation
between TIDSS and travel time is shown in Fig. 17. These results are summarized as follows.
The increase of the ACC vehicles contributed to traffic safety in the traffic flow. The safety of
a typical vehicle and an ACC vehicle did not increase respectively by the mixing of traffic
flow. An ACC vehicle also generated instantaneous dangerous situations. When the recorded
data was examined, it was realized that the dangerous situations happened by cut-in vehicles.
However, the duration of the dangerous situations was very short (about 0.3 s) because the
ACC vehicles kept the safety headway distance. Thus, it does not seriously influence the
safety of traffic flow. In contrast, the travel time increased as the ACC rate increased because
the ACC maintained the safety headway distance.
0
10
20
30
40
50
60
70
80
90
湾岸線 辰巳JCT 葛西JCT
実測値 シミュレーション
Km/h
Shiniba IC Tatsumi JCT Kasai JCT
SimulatedObserved
0
500
1000
1500
2000
2500
湾岸線 辰巳JCT 葛西JCT 新木場出口 新木場入口
実測値 シミュレーション
vec
Shiniba IC Tatsumi JCT Kasai JCT Shinkiba Ex Shinkiba In
SimulatedObserved
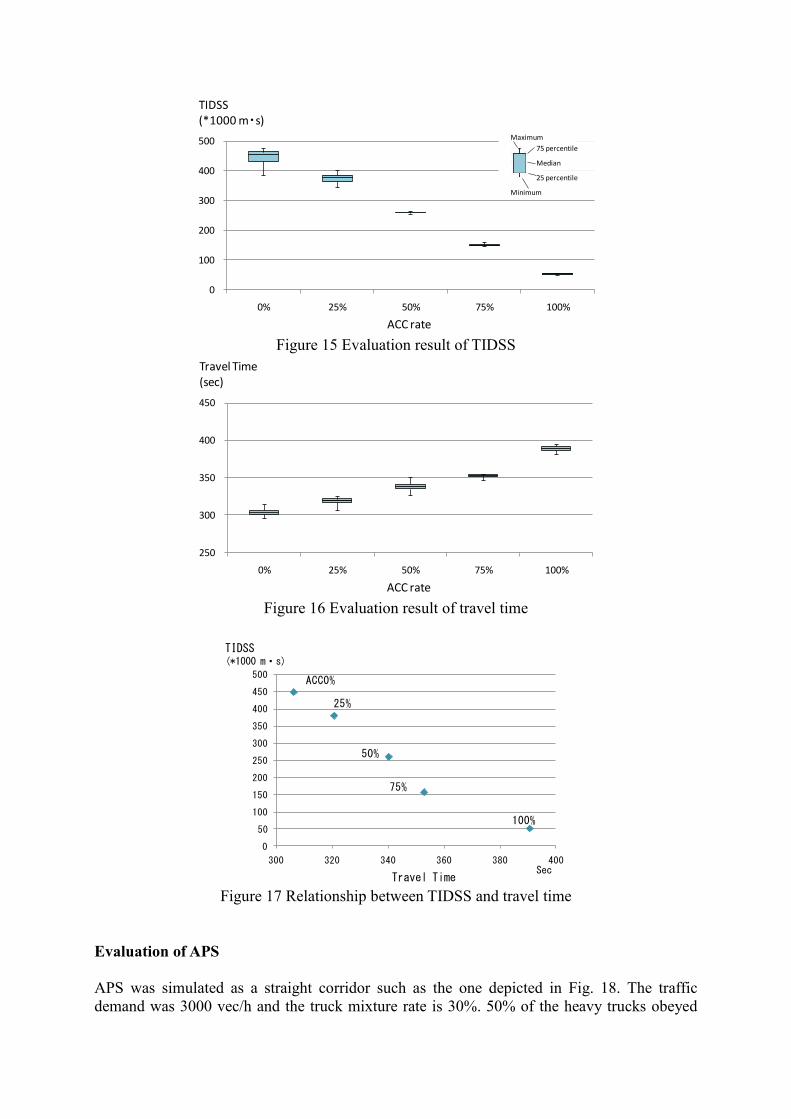
Figure 15 Evaluation result of TIDSS
Figure 16 Evaluation result of travel time
Figure 17 Relationship between TIDSS and travel time
Evaluation of APS
APS was simulated as a straight corridor such as the one depicted in Fig. 18. The traffic
demand was 3000 vec/h and the truck mixture rate is 30%. 50% of the heavy trucks obeyed
0
100
200
300
400
500
0% 25% 50% 75% 100%
TIDSS(*1000 m・s)
ACC rate
Maximum
75 percentile
Minimum
Median
25 percentile
250
300
350
400
450
0% 25% 50% 75% 100%
Travel Time(sec)
ACC rate
0
50
100
150
200
250
300
350
400
450
500
300 320 340 360 380 400
TIDSS(*1000 m・s)
Travel TimeSec
ACC0%
25%
50%
75%
100%
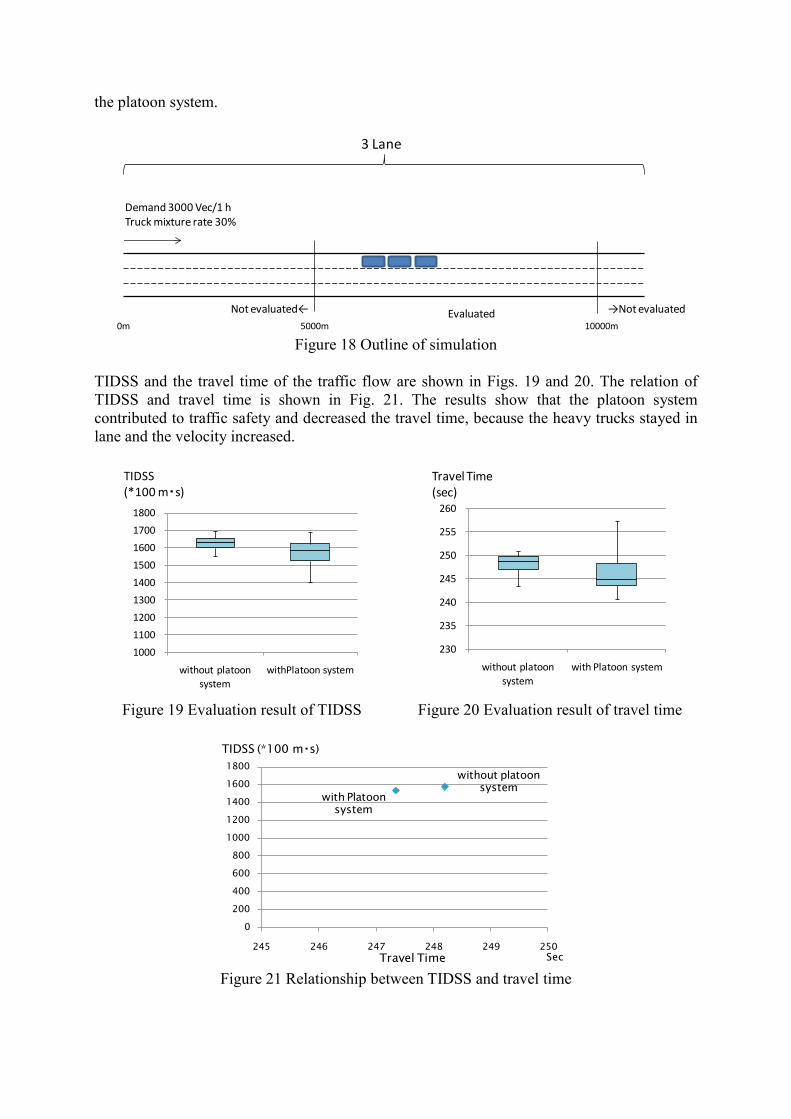
the platoon system.
Figure 18 Outline of simulation
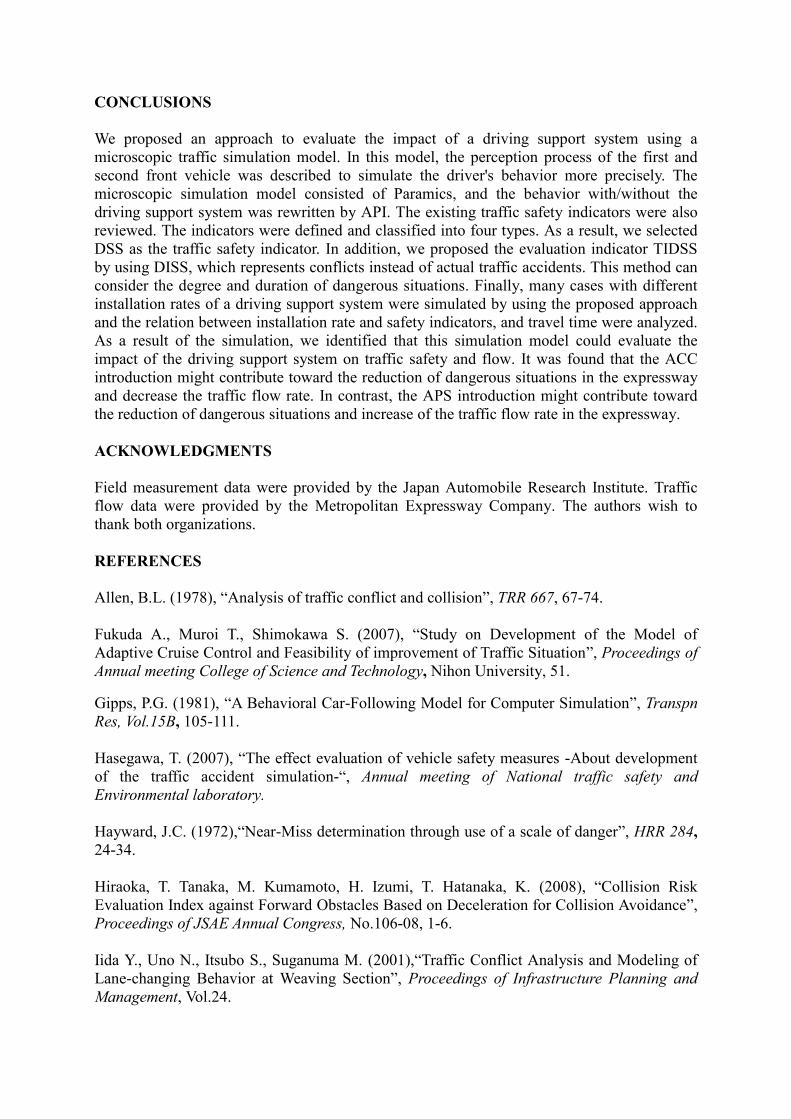
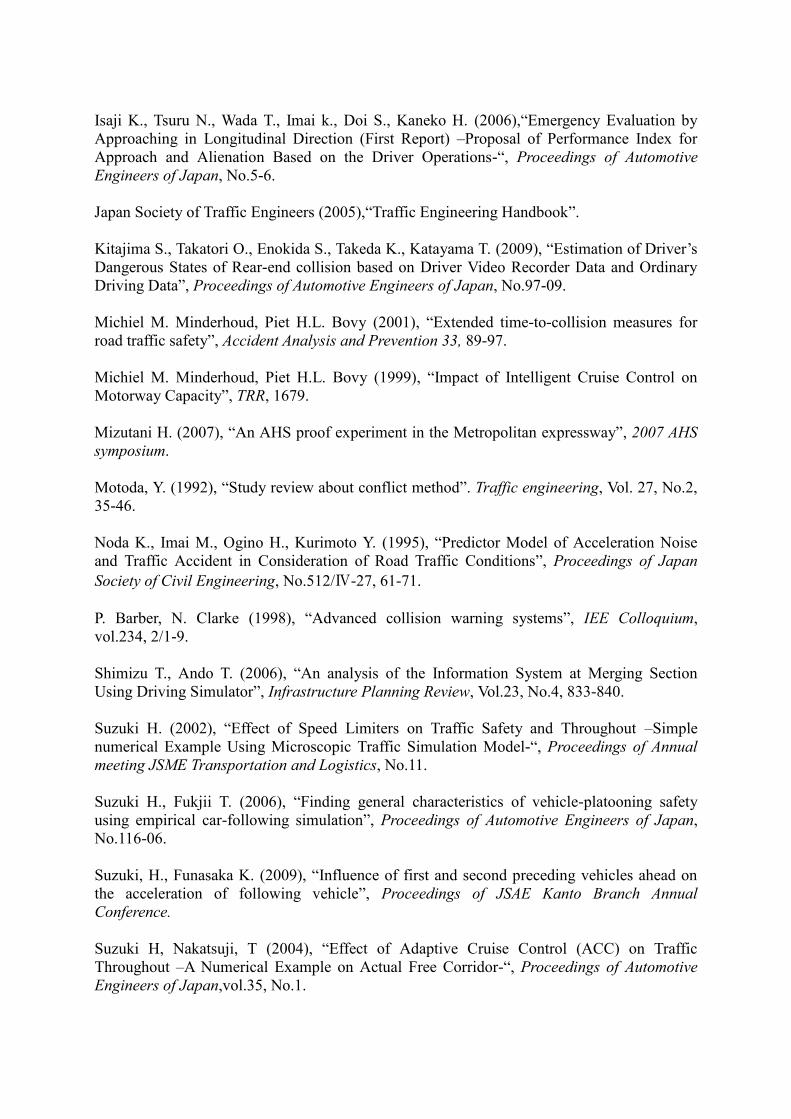
TIDSS and the travel time of the traffic flow are shown in Figs. 19 and 20. The relation of
TIDSS and travel time is shown in Fig. 21. The results show that the platoon system
contributed to traffic safety and decreased the travel time, because the heavy trucks stayed in
lane and the velocity increased.
Figure 19 Evaluation result of TIDSS Figure 20 Evaluation result of travel time
Figure 21 Relationship between TIDSS and travel time
3 Lane
Demand 3000 Vec/1 hTruck mixture rate 30%
10000m5000m0m
Not evaluated← →Not evaluatedEvaluated
TIDSS(*100 m・s)
1000
1100
1200
1300
1400
1500
1600
1700
1800
without platoon system
withPlatoon system
Travel Time(sec)
230
235
240
245
250
255
260
without platoon
system
with Platoon system
0
200
400
600
800
1000
1200
1400
1600
1800
245 246 247 248 249 250
TIDSS (*100 m・s)
Travel Time Sec
without platoon system
with Platoon system
CONCLUSIONS
We proposed an approach to evaluate the impact of a driving support system using a
microscopic traffic simulation model. In this model, the perception process of the first and
second front vehicle was described to simulate the driver's behavior more precisely. The
microscopic simulation model consisted of Paramics, and the behavior with/without the
driving support system was rewritten by API. The existing traffic safety indicators were also
reviewed. The indicators were defined and classified into four types. As a result, we selected
DSS as the traffic safety indicator. In addition, we proposed the evaluation indicator TIDSS
by using DISS, which represents conflicts instead of actual traffic accidents. This method can
consider the degree and duration of dangerous situations. Finally, many cases with different
installation rates of a driving support system were simulated by using the proposed approach
and the relation between installation rate and safety indicators, and travel time were analyzed.
As a result of the simulation, we identified that this simulation model could evaluate the
impact of the driving support system on traffic safety and flow. It was found that the ACC
introduction might contribute toward the reduction of dangerous situations in the expressway
and decrease the traffic flow rate. In contrast, the APS introduction might contribute toward
the reduction of dangerous situations and increase of the traffic flow rate in the expressway.
ACKNOWLEDGMENTS
Field measurement data were provided by the Japan Automobile Research Institute. Traffic
flow data were provided by the Metropolitan Expressway Company. The authors wish to
thank both organizations.
REFERENCES
Allen, B.L. (1978), “Analysis of traffic conflict and collision”, TRR 667, 67-74.
Fukuda A., Muroi T., Shimokawa S. (2007), “Study on Development of the Model of
Adaptive Cruise Control and Feasibility of improvement of Traffic Situation”, Proceedings of
Annual meeting College of Science and Technology, Nihon University, 51.
Gipps, P.G. (1981), “A Behavioral Car-Following Model for Computer Simulation”, Transpn
Res, Vol.15B, 105-111.
Hasegawa, T. (2007), “The effect evaluation of vehicle safety measures -About development
of the traffic accident simulation-“, Annual meeting of National traffic safety and
Environmental laboratory.
Hayward, J.C. (1972),“Near-Miss determination through use of a scale of danger”, HRR 284,
24-34.
Hiraoka, T. Tanaka, M. Kumamoto, H. Izumi, T. Hatanaka, K. (2008), “Collision Risk
Evaluation Index against Forward Obstacles Based on Deceleration for Collision Avoidance”,
Proceedings of JSAE Annual Congress, No.106-08, 1-6.
Iida Y., Uno N., Itsubo S., Suganuma M. (2001),“Traffic Conflict Analysis and Modeling of
Lane-changing Behavior at Weaving Section”, Proceedings of Infrastructure Planning and
Management, Vol.24.
Isaji K., Tsuru N., Wada T., Imai k., Doi S., Kaneko H. (2006),“Emergency Evaluation by
Approaching in Longitudinal Direction (First Report) –Proposal of Performance Index for
Approach and Alienation Based on the Driver Operations-“, Proceedings of Automotive
Engineers of Japan, No.5-6.
Japan Society of Traffic Engineers (2005),“Traffic Engineering Handbook”.
Kitajima S., Takatori O., Enokida S., Takeda K., Katayama T. (2009), “Estimation of Driver’s
Dangerous States of Rear-end collision based on Driver Video Recorder Data and Ordinary
Driving Data”, Proceedings of Automotive Engineers of Japan, No.97-09.
Michiel M. Minderhoud, Piet H.L. Bovy (2001), “Extended time-to-collision measures for
road traffic safety”, Accident Analysis and Prevention 33, 89-97.
Michiel M. Minderhoud, Piet H.L. Bovy (1999), “Impact of Intelligent Cruise Control on
Motorway Capacity”, TRR, 1679.
Mizutani H. (2007), “An AHS proof experiment in the Metropolitan expressway”, 2007 AHS
symposium.
Motoda, Y. (1992), “Study review about conflict method”. Traffic engineering, Vol. 27, No.2,
35-46.
Noda K., Imai M., Ogino H., Kurimoto Y. (1995), “Predictor Model of Acceleration Noise
and Traffic Accident in Consideration of Road Traffic Conditions”, Proceedings of Japan
Society of Civil Engineering, No.512/Ⅳ-27, 61-71.
P. Barber, N. Clarke (1998), “Advanced collision warning systems”, IEE Colloquium,
vol.234, 2/1-9.
Shimizu T., Ando T. (2006), “An analysis of the Information System at Merging Section
Using Driving Simulator”, Infrastructure Planning Review, Vol.23, No.4, 833-840.
Suzuki H. (2002), “Effect of Speed Limiters on Traffic Safety and Throughout –Simple
numerical Example Using Microscopic Traffic Simulation Model-“, Proceedings of Annual
meeting JSME Transportation and Logistics, No.11.
Suzuki H., Fukjii T. (2006), “Finding general characteristics of vehicle-platooning safety
using empirical car-following simulation”, Proceedings of Automotive Engineers of Japan,
No.116-06.
Suzuki, H., Funasaka K. (2009), “Influence of first and second preceding vehicles ahead on
the acceleration of following vehicle”, Proceedings of JSAE Kanto Branch Annual
Conference.
Suzuki H, Nakatsuji, T (2004), “Effect of Adaptive Cruise Control (ACC) on Traffic
Throughout –A Numerical Example on Actual Free Corridor-“, Proceedings of Automotive
Engineers of Japan,vol.35, No.1.

U.S. Department of Transportation (2009), “Surrogate Safety Assessment Model”.
Wakabayashi H., Takahashi Y., Nimi S., Renge K. (2003), “Traffic Conflict Analysis using
Vehicle Tracking System/Digital VCR and Proposal of a New Conflict Indicator”,
Proceedings of Infrastructure Planning and Management, Vol.20, No.4.
Xin, W. (2008), “The Less-Than-Perfect Driver: A Model of Collision-Inclusive Car-
Following Behavior”, TRR 2088, 126-137.


![5. [en]bocm fs eco drive-almec](https://img.dokumen.tips/doc/110x75/54123aa37bef0a6a098b7d44/5-enbocm-fs-eco-drive-almec.jpg)


