Embed Size (px)
Citation preview

Chemosphere 55 (2004) 227–255
www.elsevier.com/locate/chemosphere
Impact assessment of treated/untreated wastewatertoxicants discharged by sewage treatment plantson health, agricultural, and environmental quality
in the wastewater disposal area
Kunwar P. Singh a,*, Dinesh Mohan a, Sarita Sinha b, R. Dalwani c
a Environmental Chemistry Division, Industrial Toxicology Research Centre, Post Box No. 80,
Mahatma Gandhi Marg, Lucknow 226 001, Indiab National Botanical Research Institute, Rana Pratap Marg, Lucknow, India
c National River Conservation Directorate, CGO Complex, Lodi Road, New Delhi, India
Received 23 January 2003; received in revised form 30 September 2003; accepted 24 October 2003
Abstract
Studies were undertaken to assess the impact of wastewater/sludge disposal (metals and pesticides) from sewage
treatment plants (STPs) in Jajmau, Kanpur (5 MLD) and Dinapur, Varanasi (80 MLD), on health, agriculture and
environmental quality in the receiving/application areas around Kanpur and Varanasi in Uttar Pradesh, India. The
raw, treated and mixed treated urban wastewater samples were collected from the inlet and outlet points of the plants
during peak (morning and evening) and non-peak (noon) hours. The impact of the treated wastewater toxicants (metals
and pesticides) on the environmental quality of the disposal area was assessed in terms of their levels in different media
samples viz., water, soil, crops, vegetation, and food grains. The data generated show elevated levels of metals and
pesticides in all the environmental media, suggesting a definite adverse impact on the environmental quality of the
disposal area. The critical levels of the heavy metals in the soil for agricultural crops are found to be much higher than
those observed in the study areas receiving no effluents. The sludge from the STPs has both positive and negative
impacts on agriculture as it is loaded with high levels of toxic heavy metals and pesticides, but also enriched with several
useful ingredients such as N, P, and K providing fertilizer values. The sludge studied had cadmium, chromium and
nickel levels above tolerable levels as prescribed for agricultural and lands application. Bio-monitoring of the metals
and pesticides levels in the human blood and urine of the different population groups under study areas was undertaken.
All the different approaches indicated a considerable risk and impact of heavy metals and pesticides on human health in
the exposed areas receiving the wastewater from the STPs.
� 2003 Elsevier Ltd. All rights reserved.
Keywords: STPs; Wastewater; Metals and pesticides; Impact assessment; Agriculture, environment and health
*Corresponding author.
E-mail address: [email protected] (K.P. Singh).
0045-6535/$ - see front matter � 2003 Elsevier Ltd. All rights reserv
doi:10.1016/j.chemosphere.2003.10.050
1. Introduction
Soil and water quality are issues, which affect the
quality of our food, health and environment in general.
Growing levels of pollution and over-consumption of
resources demand some sort of solution. Anthropogenic
impact on natural environments and especially on
ed.

228 K.P. Singh et al. / Chemosphere 55 (2004) 227–255
aquatic ecosystems is currently a topic of increasing
concern. Deterioration of surface water and especially
river water quality has recently observed in many aqu-
atories (Boehm et al., 2002; Campolo et al., 2002; Jain,
2002; Nobukawa and Sanukida, 2002; Tara et al., 2003).
The potential causes of such a situation are various
point and non-point sources (Duda, 1993). Most of
these sources lead to the pollution of rivers. The quality
of river water may vary depending on the geological
morphology, vegetation and activities in the catchments,
as well as on the location of the sampling site, either
upstream in the mountains or the lower reaches of the
river course (Markantonatos et al., 1995; Brezonic et al.,
1999).
The Ganga is the most important river system in
India. It rises in the Gangotri glacier in the Himalaya
mountains at an elevation of 7138 m above mean sea
level in the Uttar Kashi district in the state of Uttar-
anchal, India. Already half a billion people almost one-
tenth of the world’s population live within the river
basin at an average density of over 500 per square
kilometer. This population is projected to increase to
over one billion people by the year 2030. Today the 2510
km long river supports 29 class I cities, 23 class II cities
and 48 towns, and thousands of villages. Nearly all the
sewage from these populations goes directly into the
river, totaling over 1.3 billion liters per day. Further 260
million liters of industrial waste, run off from the 6
million tons of fertilizers and 9000 tons of pesticides
used in agriculture within the basin enters into the river.
A large quantity of solid waste including thousands of
animal carcasses and several hundred human corps also
released into the river every day for spiritual rebirth.
In view of this, Ganga Action Plan (GAP) was for-
mulated in the 25 class I towns along the bank of the
river based on comprehensive survey of the Ganga
basin. In the planning stages of GAP-I in the mid 80s,
conventional technologies for sewage treatment were
adopted with designs on normative basis by the state
implementing agencies due to lack of experience in this
area. For the first time in the country under integrated
sanitation project of Indo-Dutch cooperation of the
Ganga Action Plan, Phase-I, and innovative sewage
treatment technology called up-flow anaerobic sludge
blanket process (UASB) was experimented with sewage
of 5 MLD capacity and had been in successful operation
since then. Sewage treatment plants (STPs) provide
agriculture benefits by supplying irrigation and non-
conventional fertilizer. Farmers for irrigation in the
adjoining villages use partly treated water from STPs
with significant amount of nutrients. Therefore STPs
under GAP, apart from reducing the pollution load of
households and industrial effluents to meet pollution
standard, provide irrigation and fertilizer benefits to
farmers. There are about 35 STPs under GAP with 13
located in Uttar Pradesh, 7 in Bihar, and 15 in West
Bengal. Besides providing irrigation, some of the STPs
are supporting pisciculture, especially in West Bengal.
All these STPs have capacity to treat a wastewater vol-
ume of 919.82 million liters per day. A variety of pol-
lutants can be removed from the sewage by biological
and chemical degradation, sorption to sludge or vola-
tilization (Rogers, 1996). In different countries, studies
have been carried out for the occurrence and removal of
pollutants and comparative evaluation in sewage and
landfill leachates (Hannah et al., 1986; Marttinen et al.,
2003). Very few studies are available on the impact
assessment of wastewater/sludge disposal on the envi-
ronment quality. Thus the aim of this study was to
investigate the impact assessment of treated/untreated
wastewater toxicants discharged by sewage treatment
plants on health, agriculture and environmental quality
in the wastewater disposal areas.
2. Study area
To assess the impact of the wastewater/sludge dis-
posal (metals and pesticides) on the environmental
quality of the receiving/application areas around sewage
treatment plants (STPs), two plants viz., UASB, Jajmau,
Kanpur (5 MLD) and STP, Dinapur, Varanasi (80
MLD) were identified and selected for study. Environ-
mental samples (surface water, ground water, soil, veg-
etables, crops, food grains, milk etc.) were collected from
different villages, both in the receiving (exposed) viz.,
Shekhpur, Motipur, Kishanpur, Madarpur, Hannia,
Trilokpur, Gadarianpurva, Karvigaon, Dinapur, Ko-
tawa, Kamauli, Danipura, Nawapura and non-receiving
(unexposed) viz., Paligaon, Kurgaon, Chakeri, T. Pa-
gambarpur, Gauria, C. Chhatimara, B. Chhatimara,
Tetepur, Kapildhara, Khalispur areas identified and fi-
nally selected. The water, soil, crop/vegetation and food
grains samples were collected from the treated/untreated
wastewater receiving and non-receiving areas around
UASB Kanpur and STP Varanasi and were transported
immediately to Industrial Toxicology Research Centre,
Lucknow under low temperature conditions. The sam-
ples were processed and analyzed for some selected heavy
metals viz., cadmium, chromium, copper, iron, manga-
nese, lead, nickel, and zinc and major pesticides viz.,
BHC isomers, DDT isomers and metabolites, endosul-
fan, malathion, methyl parathion, ethion and dimetho-
ate. The total numbers of water, soil, vegetables/crops,
and food grains samples collected were 32, 15, 20, and 17
respectively from the exposed area and 36, 13, 14 and 12
respectively from unexposed area. In preliminary field
survey it was noted that the treated wastewater from
Jajmau UASB plant at Kanpur (5 MLD) is mixed up
with the untreated wastewater and used for irrigation in
the nearby adjoining outskirts area of the city. Total area
receiving this wastewater for irrigation purpose is about

K.P. Singh et al. / Chemosphere 55 (2004) 227–255 229
25 km2. Along with this site near Kanpur city receiving
the mixed treated/untreated wastewater, a nearby area
adjoining to it but not receiving the wastewater at all was
also selected to serve as control for impact evaluation. A
total eight villages in the receiving (exposed) viz., Shekh-
pur, Motipur, Kishanpur, Madarpur, Hannia, Trilok-
pur, Gadarianpurva, Karvigaon, and seven villages in
non-receiving area (unexposed) viz., Paligaon, Kurgaon,
Chakeri, T. Pagambarpur, Gauria, C. Chhatimara, B.
Chhatimara were selected for further studies. For impact
analysis of exclusively treated wastewater as proposed,
an area near Varanasi receiving treated wastewater
from 80 MLD sewage treatment plant (STP) set up by
NRCD in Dinapur was also selected along with an
adjoining non-receiving area to serve as control for
impact evaluation. A total area receiving the treated
wastewater from this STP is about 10 km2. A total of five
villages in the receiving (exposed) viz., Dinapur, Kotawa,
Kamauli, Danipura, Nawapura and three villages in the
non-receiving (unexposed) viz., Tetepur, Kapildhara,
Khalispur areas were selected for further studies. The
sewage treatment plants (STPs) after treatment of the
raw wastewater discharge the treated wastewater usually
being utilized for agricultural irrigation purpose in the
nearby outskirts area of the town and the generated
sludge disposed through selling to the horticultural or
agricultural farmers. These components may be con-
taminated with high levels of the toxicants (such as heavy
metals and pesticides). In long run these may contami-
nate the surface and ground water, soils, crops and
vegetation (food/fruits/vegetables) causing considerable
adverse impact on health of the consumers/local popu-
lation as a result of environmental exposure. Therefore,
to analyze and evaluate the impacts of the treated
wastewater (toxicants), it is very much required to assess
and estimate the quantum of these toxicants loading to
the study area, which obviously needs characterization of
both the treated wastewater and sludge generated by the
STPs of these heavy metals and pesticides. The effect
of wastewater toxicants on human health in the areas
receiving the effluents from STPs was assessed through
three different methods:
(a) bio-monitoring of the metals and pesticides levels in
the human blood and urine under study areas;
(b) standard questionnaire based survey of the exposed
and unexposed population;
(c) environmental exposure risk analysis.
3. Material and methods
3.1. Chemicals and instrumentations
All the solvents and chemicals were of analytical
grade. Distilled water was occasionally analyzed similar
to wastewater samples to control the laboratory con-
tamination if any. The pH measurements were made
using a pH meter model Elico, L-27. An ANTEK-3000
Gas Chromatograph equipped with ECD/FPD and
capillary column was employed for the analysis of BHC
isomers, DDT isomers and metabolites, endosulfan,
malathion, methyl parathion, ethion and dimethoate
residue levels. The capillary column (RTX-1) supplied
by Restek Corporation, USA having dimensions (L 30
m· ID 0.32 mm) and film thickness 1 lm was used.
The metal concentrations in the samples were deter-
mined using Inductive Coupled Plasma (ICP) spectro-
photometer model LABTAM 8440, Australia. Porosity
and density of the soil samples were determined using
mercury porosimeter and specific gravity bottles res-
pectively. Sodium, and potassium were analyzed using
flame photometer from Elico. The samples of water/
wastewater/sludge were collected following the stan-
dard method of chemical analysis (APHA, 1998). Stock
solutions of the test regents were prepared in double
distilled water.
3.2. Quality assurance
Precision and accuracy of the data were assured
through repeated analysis of National Bureau of Stan-
dards No. 70 G for Cd and 42 G for the rest of the
metals and the results were found to be within ±2% of
certified values. Average values of five replicates were
taken for each determination. Operational conditions
were adjusted to yield optimal determination. Quanti-
fication of metals was based on calibration curves of
standard solutions of metals. The detection limit for
different metals were 4, 7, 6, 7, 2, 15, 40, and 2 lg l�1 for
Cd, Cr, Cu, Fe, Mn, Ni and Pb respectively. The pre-
cision of the analytical procedures expressed as the
relative standard deviation (rsd) ranged from 5% to
10%. The precision for the analysis of standard solution
was better than 5%. Recoveries of metals from the
samples were also studied for evaluation the matrix
effect by the standard addition technique and found to
be between 94% and 106%. In different experiments
blanks were run and corrections applied if necessary.
All the observations were recorded in triplicate and
average values and their standard deviations are re-
ported.
Pesticides residues were more than 99.8% pure.
Recoveries of residue undergoing the analytical regime
were greater than 92% and reliable sensitivity of detec-
tion was 1 ppb for pp-DDE and a-BHC and 2 ppb for
b-BHC, Lindane, Aldrin, Endosulfan, op-DDT and
pp-DDT. Data obtained for various pesticides in this
investigation were corrected accordingly. All samples
were run in duplicate. Levels of all compounds were well
above the detection limits.
Table
1
Meanmetalandpesticides
residuelevelsin
wastew
ater(m
g/l)
STP
Cd
Cr
Cu
Fe
Mn
Ni
Pb
Zn
a-BHC
b-BHC
c-BHC
T-BHC
pp-D
DT
pp-D
DD
pp-D
DE
T-D
DT
Jajm
au,Kanpur(UASB,5MLD)
Inlet
0.05
6.45
0.88
8.80
0.55
0.22
0.19
1.82
0.11
0.095
0.027
0.232
ND
0.02
2.25
2.51
Outlet
0.01
0.37
0.03
0.42
0.17
0.05
0.05
0.14
0.027
0.016
0.009
0.051
ND
0.002
0.55
0.56
Dinapur,Varanasi(STP,80MLD)
Inlet
0.16
8.12
0.16
3.32
0.47
0.14
0.15
1.58
0.098
0.038
0.030
0.166
ND
ND
0.121
0.132
Outlet
0.02
0.02
0.03
0.30
0.14
0.05
0.05
0.12
0.018
0.009
0.008
0.035
ND
ND
0.021
0.024
WQ
crit
irrigation
0.01
0.1
0.2
5.0
0.2
0.2
0.5
2.0
––
––
––
––
230 K.P. Singh et al. / Chemosphere 55 (2004) 227–255
4. Results and discussion
4.1. Characterization of untreated/treated wastewater/
sludge (STPs)
4.1.1. Wastewater (untreated/treated)
The raw (untreated) and treated wastewater samples
were collected from the inlet and outlet of both the
sewage treatment plants (STPs) in Jajmau, Kanpur (5
MLD) and Dinapur, Varanasi (80 MLD) during the
peak (morning and evening) and non-peak (noon) hours
and analyzed for metals and pesticides. The metals and
pesticides residue levels (mean) at the inlet and out let of
the two-sewage treatment plants (Kanpur and Varanasi)
are given in Table 1. The result of the physicochemical
analysis and bacteriological enumerations of the peak
and non-peak hours from the two STPs inlet and outlet
are presented in Figs. 1–11 while the range and mean
values of these parameters as observed during these
months are given in Table 2 along with standard devi-
ation. From the mean levels of metals and pesticides in
the treated (outlet) wastewaters of the two STPs, their
total input/discharge and loading of these pollutants can
be estimated as received in the respective disposal/
application areas and are given in Tables 3 and 4.
As far as the suitability of the treated wastewaters
with particular reference to the heavy metals for irriga-
tion of the agriculture land is concerned, from Table 1, it
may be noted that leaving apart the cadmium levels in
treated water from the two STPs and that of chromium
in Jajmau (Kanpur) STP, the levels of all the other
metals are within the permissible limits as prescribed for
the agricultural land irrigation purpose. Further, the
higher levels of nitrogen (N), phosphorous (P) and
potassium (K) in the treated wastewater result in posi-
tive impact on the crop productivity in the areas
receiving it.
4.1.2. STPs sludge
STPs sludge samples were also collected regularly
from both the treatment plants and analyzed for heavy
metals, pesticides residue, N, P, K, and organic C con-
tents. The results (mean values) are presented in Tables
5–7.
From Table 5, it is clear that sludge generated by
both the STPs have cadmium and nickel levels above
their tolerable amounts as prescribed for agriculture
land application. However in terms of fertilizer values
(N, P, K and organic content) as given in Table 7, it can
be estimated that about 14 kg nitrogen (N), 6.75 kg
phosphorus (P) and 4.25 kg potassium (K) would be
available per ton of the generated sludge and in terms of
its economic value at existing market rates as given in
Table 7. From this table, it may be noted that the cost of
fertilizer ingredients (NPK) per ton of the STPs sludge
generated is about Indian Rs. 486 (�US$10).

Fig. 1. Seasonal variation in TSS of treated and untreated wastewater from sludge treatment plants (STPs) at (a) Kanpur and
(b) Varanasi.
K.P. Singh et al. / Chemosphere 55 (2004) 227–255 231
4.2. Impact of wastewater toxicants (metals and pesti-
cides) on environmental quality of the disposal area
To assess the impact of wastewater/sludge disposal
(metals/pesticides) on the environmental quality around
the respective STPs, environmental samples (surface
water, ground water, soil, vegetables, crops, and food
grains) were collected from different villages both in the
receiving and non-receiving areas selected near UASB,
Jajmau, Kanpur and STP, Dianapur, Varanasi. Range
and mean levels of metals and pesticides in different
environmental media (surface water, ground water, soil,
veg./crops, and food grains) are provided in Tables 8–11
for Kanpur and Varanasi in receiving and non-receiving
areas. From these data, it may be noted that the levels of
heavy metals as well as pesticides (BHC and DDT) in
each of the environmental media are very much higher
in the area receiving the wastewater for irrigation pur-
pose as compared to the adjoining area where there is no
irrigation with this water. Further, it may be noted that

Fig. 2. Seasonal variation in pH of treated and untreated wastewater from sludge treatment plants (STPs) at (a) Kanpur and
(b) Varanasi.
232 K.P. Singh et al. / Chemosphere 55 (2004) 227–255
the concentrations in ground water are not much dif-
ferent, it may be due to common ground water aquifers
in both the areas. Surface water collected from only a
few available ponds shows higher levels of metals as well
as pesticides. This water is usually used as drinking
water for the cattle. Metal and pesticides levels in soils
from wastewater disposal area are also much higher
than those from the respective unexposed areas. This
might have resulted due to continued application of the
wastewater. Metals and pesticides residue levels in the
vegetation/crops, vegetables and food grains as con-
sumed by the cattle and human beings are also much
higher in the wastewater disposal areas over those not
receiving the wastewater. The soil samples were also
analyzed for their characteristic physiochemical para-
meters (pH, densities, pore space, electrical conductance,
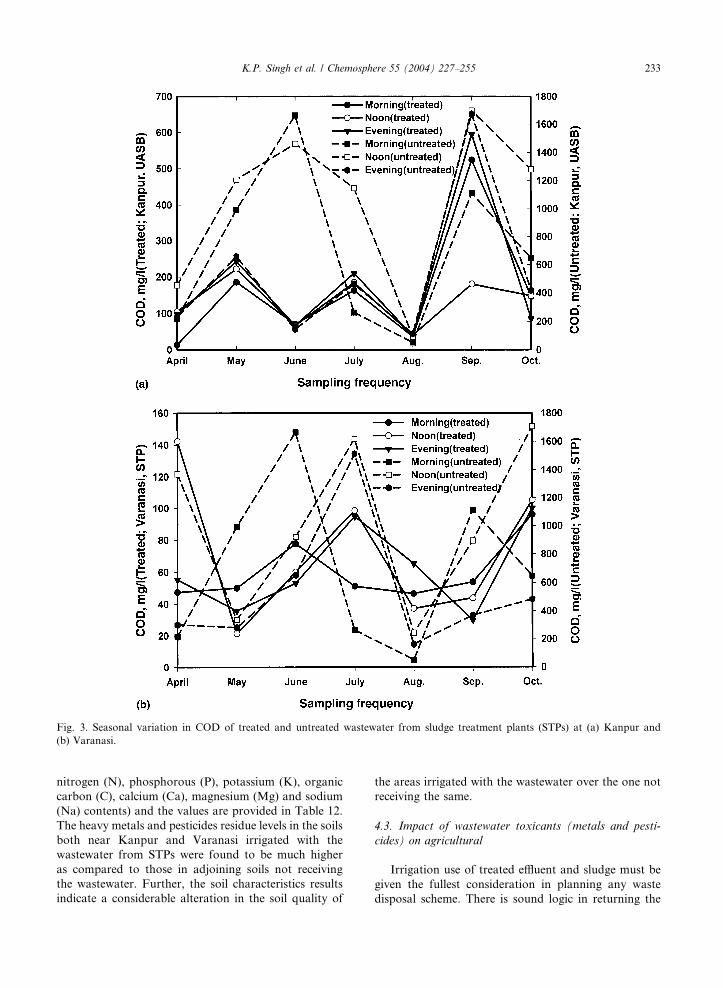
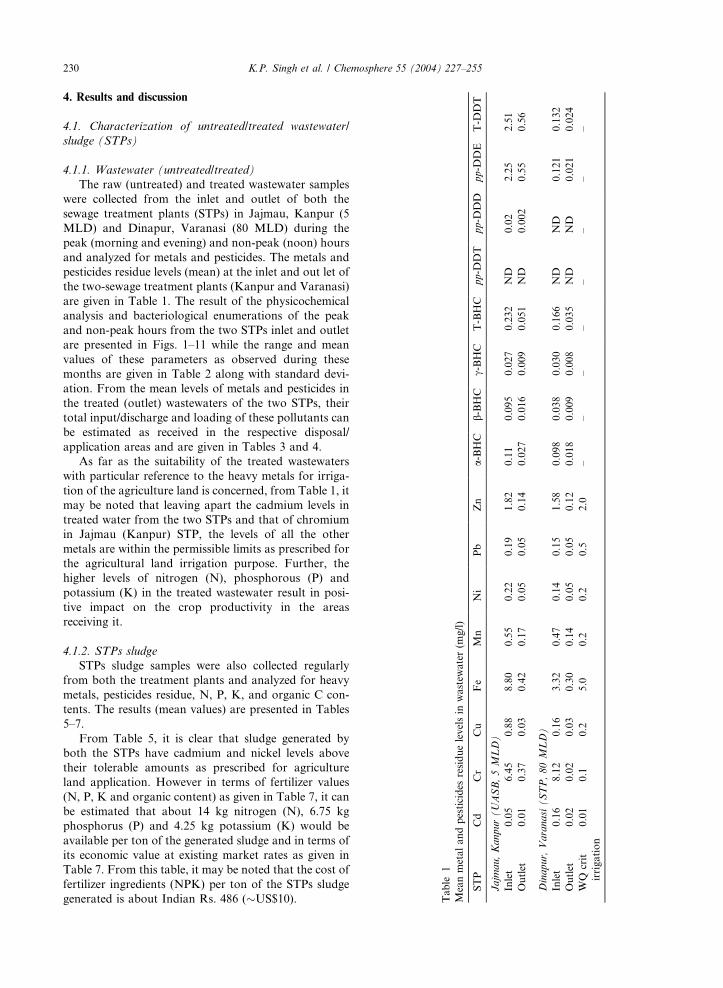
Fig. 3. Seasonal variation in COD of treated and untreated wastewater from sludge treatment plants (STPs) at (a) Kanpur and
(b) Varanasi.
K.P. Singh et al. / Chemosphere 55 (2004) 227–255 233
nitrogen (N), phosphorous (P), potassium (K), organic
carbon (C), calcium (Ca), magnesium (Mg) and sodium
(Na) contents) and the values are provided in Table 12.
The heavy metals and pesticides residue levels in the soils
both near Kanpur and Varanasi irrigated with the
wastewater from STPs were found to be much higher
as compared to those in adjoining soils not receiving
the wastewater. Further, the soil characteristics results
indicate a considerable alteration in the soil quality of
the areas irrigated with the wastewater over the one not
receiving the same.
4.3. Impact of wastewater toxicants (metals and pesti-
cides) on agricultural
Irrigation use of treated effluent and sludge must be
given the fullest consideration in planning any waste
disposal scheme. There is sound logic in returning the

Fig. 4. Seasonal variation in DOM of treated and untreated wastewater from sludge treatment plants (STPs) at (a) Kanpur and
(b) Varanasi.
234 K.P. Singh et al. / Chemosphere 55 (2004) 227–255
solids back to land and reusing the wastewater whenever
feasible.
The elevated levels of persistent type toxicants such
as metals and to some extent pesticides in long run
disposal of treated wastewater and sludge for irrigation
or amendment of the agricultural land may lead to build
higher concentrations in soils as a result of accumula-
tion. The higher metal levels in soil may cause negative
impact on crops, inhibiting the growth in one or other
way. However, one of the most important factors is the
pH of the soils. Alkaline pH of the soil would usually
restrict the mobilization of the metal in soil matrix and
consequently, the metal uptake by crop plant would be
controlled, obviously reducing the risk of metal toxicity.
From Tables 8 and 10 it may be noted that the mean
level of Cd and Cr are above their critical levels in

Fig. 5. Seasonal variation in TKN of treated and untreated wastewater from sludge treatment plants (STPs) at (a) Kanpur and
(b) Varanasi.
K.P. Singh et al. / Chemosphere 55 (2004) 227–255 235
agricultural soils of the area near Kanpur STP irrigated
with wastewater. The mean levels of Cd, Ni and Pb in
soils of treated wastewater irrigated area near Varanasi
STP are above their respective tolerable limits for agri-
cultural crops. However, the disposed wastewater in
both the areas has mean pH value of about 8 and the
mean pH value for the agricultural soils irrigated with
wastewater was found to be more than 8. Therefore,
even though, the level of a few metals in soils was above
their critical limits, their mobilization and plant uptake
might be restricted by alkaline pH. Further, it may be
mentioned that the critical levels of the heavy metals in
soils displaying negative impacts on agricultural crops
are considerably high as encountered in our study areas
irrigated with treated wastewater. Therefore, as yet,
there seems to be no adverse impact of metals and pes-
ticides on agricultural crops in these areas. However,
a questionnaire based individual farmer’s survey was
conducted in all the four exposed and unexposed areas
near Kanpur and Varanasi STPs collecting information

Fig. 6. Seasonal variation in NH3–N of treated and untreated wastewater from sludge treatment plants (STPs) at (a) Kanpur and
(b) Varanasi.
236 K.P. Singh et al. / Chemosphere 55 (2004) 227–255
on agricultural crops production trends during last few
years. In the exposed areas near Kanpur, the majority
(90%) reported that the crops yield has declined over
past few years due to some root disease infestation
causing the plant death or weakness leading to small
grain size. But in area near Varanasi irrigated with
treated wastewater, the response of the farmers was to-
tally reverse. The majority of farmers (65%) reported an
enhancement in crops yield over last few years. The
reason of declined productivity near Kanpur may not be
the toxic metals but it is principally due to irrigation
with mixed wastewater with high solids/bacterial bio-
mass resulting into deposition on soils as observed
during survey and making the soil–root interface more
susceptible to plant root diseases. However, the en-
hanced yield in area near Varanasi irrigated with treated
wastewater may be accounted for more irrigation water
availability with high nutrient/fertilizer value water to
the crops as discharged by the Dinapur STP. Soil sam-
ples in the area receiving (exposed) and non-receiving

Fig. 7. Seasonal variation in Org-N of treated and untreated wastewater from sludge treatment plants (STPs) at (a) Kanpur and
(b) Varanasi.
K.P. Singh et al. / Chemosphere 55 (2004) 227–255 237
(unexposed) wastewater were also characterized for their
physical properties such as pH, electric conductivity,
bulk density, particle density, porosity etc. and are give
in Table 12.
4.4. Impact of wastewater toxicants on health
Exposure to heavy metals and pesticides may be
exhibited by several signs and symptoms (Ramond et al.,
1991; Otto et al., 1994; Lili and Elsner, 1995; William,
1996) but they are only recognized when achieve chronic
and clinical levels. Since the pesticides and heavy metals
are both proven neurotoxic, there are several methods
developed and reported (Hanninen and Lindstrom, 1979;
Anger, 1989) to assess the exposure at very low concen-
tration of these substances (sub-clinical level). Since the
heavy metals and pesticides exposure of the population
may cause the neurobehavioral disorders such as fatigue,
insomnia, decreased concentration, depression, irritabil-
ity, gastric symptoms, sensory symptoms and motor
symptoms. A standard questionnaire based on chemical
(metal and pesticides) symptoms and comprised a total 35
items covering eight different functions (Hanninen and
Lindstrom, 1979) was modified and used for recording

Fig. 8. Seasonal variation in F. coli of treated and untreated wastewater from sludge treatment plants (STPs) at (a) Kanpur and
(b) Varanasi.
238 K.P. Singh et al. / Chemosphere 55 (2004) 227–255
information from the selected populations with regard to
any impact of these toxicants (Table 13) through personal
interviews. Neurobehavioral analysis was done on the
basis of the mean scores for each function of every indi-
vidual. Representative population groups in all the four
areas (near Kanpur and Varanasi) were surveyed for
general health status and neurobehavioral functions of
the population through questionnaire based personal
interviews. The collected information/response of the se-
lected individuals from the exposed and unexposed areas
are summarized in Tables 14 and 15.
The neurobehavioral information was analyzed sta-
tistically applying the �t’ test to see the significant dif-
ference in the mean of different parameters between
exposed and unexposed population groups near sewage
treatment plants (STPs) separately and the results indi-
cating level of significance (p) are given in Table 16. It
may be noted that overall and for the individual neu-
robehavioral function, the difference in the population
selected from the area receiving wastewater from the
UASB, Jajmau, Kanpur (exposed) were significant over
the respective unexposed population group selected

Fig. 9. Seasonal variation in T. coli of treated and untreated wastewater from sludge treatment plants (STPs) at (a) Kanpur and
(b) Varanasi.
K.P. Singh et al. / Chemosphere 55 (2004) 227–255 239
from the adjoining area receiving no wastewater. Fur-
ther, the difference among Varanasi population groups
was non-significant for all the functions. However, this
does not mean that there is no significant exposure near
the Varanasi area receiving treated wastewater from the
Dinapur STP (80 MLD). One of the possible reasons
seems to be the duration of disposal as the area near
Kanpur is receiving wastewater for several decades,
while the one near Varanasi has started receiving it only
for the last few years. This is further supported by ob-
served higher levels of metals and pesticides in different
environmental compartments in the disposal area near
Kanpur as compared with those near Varanasi.
4.5. Bio-monitoring of metals and pesticides levels (human
blood and urine) in exposed/unexposed population
In order to further assess the extent of the metals
and pesticides exposure to the population in the area
receiving the wastewater, the levels of various metals
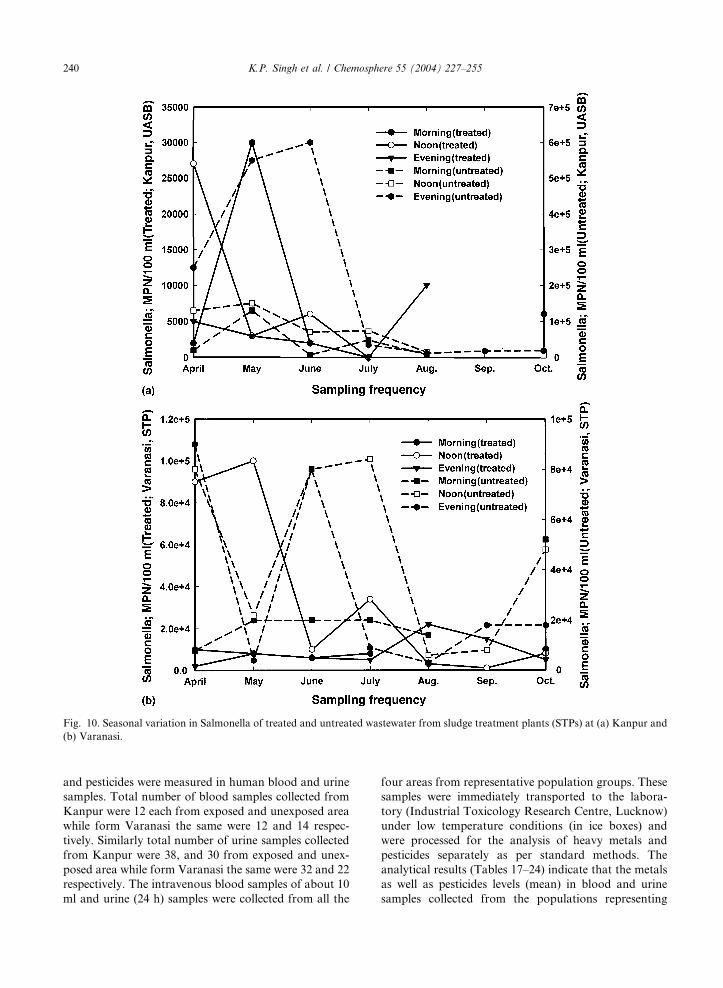
Fig. 10. Seasonal variation in Salmonella of treated and untreated wastewater from sludge treatment plants (STPs) at (a) Kanpur and
(b) Varanasi.
240 K.P. Singh et al. / Chemosphere 55 (2004) 227–255
and pesticides were measured in human blood and urine
samples. Total number of blood samples collected from
Kanpur were 12 each from exposed and unexposed area
while form Varanasi the same were 12 and 14 respec-
tively. Similarly total number of urine samples collected
from Kanpur were 38, and 30 from exposed and unex-
posed area while form Varanasi the same were 32 and 22
respectively. The intravenous blood samples of about 10
ml and urine (24 h) samples were collected from all the
four areas from representative population groups. These
samples were immediately transported to the labora-
tory (Industrial Toxicology Research Centre, Lucknow)
under low temperature conditions (in ice boxes) and
were processed for the analysis of heavy metals and
pesticides separately as per standard methods. The
analytical results (Tables 17–24) indicate that the metals
as well as pesticides levels (mean) in blood and urine
samples collected from the populations representing

Fig. 11. Seasonal variation in Streptococcus of treated and untreated wastewater from sludge treatment plants (STPs) at (a) Kanpur
and (b) Varanasi.
K.P. Singh et al. / Chemosphere 55 (2004) 227–255 241
wastewater irrigated areas were higher than those col-
lected from the areas not receiving the wastewater in
case of both the Kanpur and Varanasi. Further, it may
be noted that the residue levels of metals and pesticides
in human blood as well as in urine samples of the ex-
posed and unexposed population groups in Kanpur
were higher as compared to those of Varanasi exposed
and unexposed population groups, respectively. This
may again be due to the prolonged disposal of the
wastewater in the area near Kanpur over decades and
resulting in long time exposure of the population.
4.6. Environmental exposure risk assessment of metal and
pesticides
The environmental exposure risk to the populations
from these elevated levels of metals and pesticides in
different environmental media (water, food, vegetables,
crops/vegetation) in areas receiving wastewater over
those unexposed ones has been evaluated by first com-
puting the mean estimated total daily intake (TDI) of
each of these toxicants (individual metal and pesticides)
using Eq. (1)
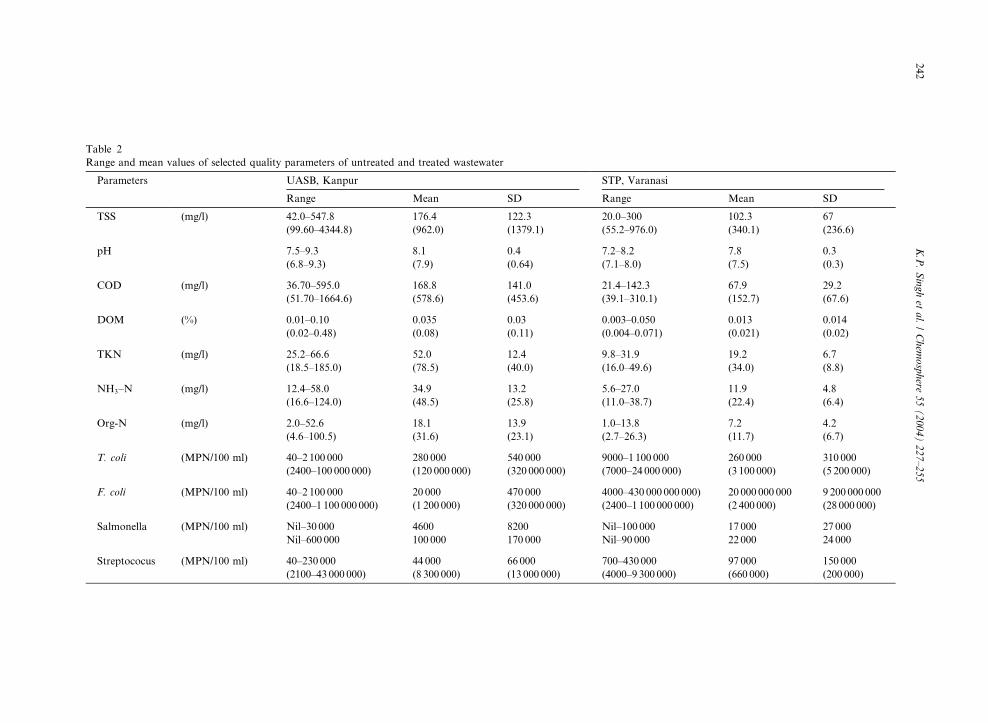
Table 2
Range and mean values of selected quality parameters of untreated and treated wastewater
Parameters UASB, Kanpur STP, Varanasi
Range Mean SD Range Mean SD
TSS (mg/l) 42.0–547.8 176.4 122.3 20.0–300 102.3 67
(99.60–4344.8) (962.0) (1379.1) (55.2–976.0) (340.1) (236.6)
pH 7.5–9.3 8.1 0.4 7.2–8.2 7.8 0.3
(6.8–9.3) (7.9) (0.64) (7.1–8.0) (7.5) (0.3)
COD (mg/l) 36.70–595.0 168.8 141.0 21.4–142.3 67.9 29.2
(51.70–1664.6) (578.6) (453.6) (39.1–310.1) (152.7) (67.6)
DOM (%) 0.01–0.10 0.035 0.03 0.003–0.050 0.013 0.014
(0.02–0.48) (0.08) (0.11) (0.004–0.071) (0.021) (0.02)
TKN (mg/l) 25.2–66.6 52.0 12.4 9.8–31.9 19.2 6.7
(18.5–185.0) (78.5) (40.0) (16.0–49.6) (34.0) (8.8)
NH3–N (mg/l) 12.4–58.0 34.9 13.2 5.6–27.0 11.9 4.8
(16.6–124.0) (48.5) (25.8) (11.0–38.7) (22.4) (6.4)
Org-N (mg/l) 2.0–52.6 18.1 13.9 1.0–13.8 7.2 4.2
(4.6–100.5) (31.6) (23.1) (2.7–26.3) (11.7) (6.7)
T. coli (MPN/100 ml) 40–2 100 000 280 000 540 000 9000–1 100 000 260 000 310 000
(2400–100 000 000) (120 000 000) (320 000 000) (7000–24 000 000) (3 100 000) (5 200 000)
F. coli (MPN/100 ml) 40–2 100 000 20 000 470 000 4000–430 000 000 000) 20 000 000 000 9 200 000 000
(2400–1 100 000 000) (1 200 000) (320 000 000) (2400–1 100 000 000) (2 400 000) (28 000 000)
Salmonella (MPN/100 ml) Nil–30 000 4600 8200 Nil–100 000 17 000 27 000
Nil–600 000 100 000 170 000 Nil–90 000 22 000 24 000
Streptococus (MPN/100 ml) 40–230 000 44 000 66 000 700–430 000 97 000 150 000
(2100–43 000 000) (8 300 000) (13 000 000) (4000–9 300 000) (660 000) (200 000)
242
K.P.Singhet
al./Chem
osphere
55(2004)227–255

Table 4
Pesticide discharge through treated wastewater
STP c-BHC
(Lindane)
Total
DDT
Kanpur
(5 MLD)
(g/day) 0.045 2.85
(kg/year) 0.016 1.04
Varanasi
(80 MLD)
(g/day) 0.760 2.28
(kg/year) 0.277 0.83
Table 3
Mean metal discharge through treated wastewater
STP Cd Cr Cu Fe Mn Ni Pb Zn
Jajmau, Kanpur (UASB, 5 MLD)
kg/day 0.06 1.84 0.16 2.08 0.83 0.25 0.27 0.67
kg/year 0.02 0.67 0.06 0.76 0.30 0.09 0.097 0.25
Dinapur, Varanasi (STP, 80 MLD)
kg/day 1.90 1.62 2.57 28.5 13.5 4.47 4.56 11.60
kg/year 0.694 0.59 0.94 10.4 4.92 1.63 1.66 4.23
Table 7
Mean NPK contents of STPs sludge and it cost economics
Parameters Kanpur Varanasi Rate per ton of
sludge (per kg)
Ingredient Cost
OC 661.12 552.28 – –
K 4.54 4.00 4.25 kg Rs. 136
P 7.25 6.32 6.75 kg Rs. 243
TKN 13.10 14.89 14.0 kg Rs. 107
K.P. Singh et al. / Chemosphere 55 (2004) 227–255 243
TDI ðmg=dayÞ ¼X
CiDi ð1Þ
where Ci is the mean concentration of individual toxi-
cant in the ith media and Di is the mean daily intake of
the same media by a person. The major intake routes
considered are: drinking water (2.5 l/d), food grains (600
g/d); vegetables (300 g/d) and milk (200 g/d).
The computed TDI (mg/d) values for each toxicant
are then compared with their respective acceptable daily
intake (ADI) values (mg/d), worked out from their
individual ADIs (mg/d/kg bw) as available in the litera-
ture for a person of 60 kg body weight.
The risk quotient (RQ) for each toxicant was com-
puted using Eq. (2)
RQ ¼ TDI=ADI ð2Þ
The computed results for the metals (only for which
ADI values are available) and pesticides for both the
Table 5
Mean metal levels in STPs sludge (g/kg)
STP Cd Cr Cu Fe
Kanpur 0.041 8.11 0.393 6.40
Varanasi 0.054 1.30 0.543 7.21
Table 6
Mean pesticide levels in STPs sludge (mg/kg)
STP a-BHC b-BHC c-BHC T-BHC
Kanpur 0.07 0.44 0.36 0.69
Varanasi 0.07 0.08 0.05 0.19
populations (exposed and unexposed) in both the se-
lected areas (Kanpur and Varanasi) are presented in
Tables 25–28.
As a general principle, the population exposed to
some particular toxicant (chemical) will be at risk with
respect to the toxicant, if the value of the respective risk
quotient (RQ) is above 1.0. However, if we compare the
two population groups for their relative risk with respect
to some common toxicant to which these are exposed,
their respective RQs may give an assessment of their
relative risk level for that particular toxicant.
The exposure risk levels of the exposed and unex-
posed population groups to heavy metals and pesticides
are given in Tables 25–28. It may be noted that for
any of these toxicants (metals and pesticides), none
of the populations is at significant exposure risk level,
as in none of the cases, the computed RQ value (TDI/
ADI) exceeded 1.0. However, it is very much clear
Mn Ni Pb Zn
0.22 0.214 0.091 1.18
0.31 0.293 0.129 1.51
pp-DDT pp-DDD pp-DDE T-DDT
0.09 0.05 0.12 0.24
0.09 0.03 0.02 0.11

Table 8
Range and mean of the metal levels in different environment media near Kanpur
Media Cd Cr Cu Fe Mn Ni Pb Zn
Kanpur exposed (receiving) area
Surface water (mg/l) 0.001–0.003 0.036–0.079 0.008–0.027 2.342–10.306 0.189–0.497 0.027–0.054 0.024–0.057 0.054–0.105
(0.006) (0.058) (0.018) (6.324) (0.343) (0.041) (0.041) (0.080)
Ground water (mg/l) ND–0.008 ND–0.011 0.002–0.035 0.047–3.235 0.014–0.494 0.013–0.029 0.014–0.061 0.037–0.614
(0.001) (0.003) (0.006) (0.767) (0.119) (0.021) (0.0216) (0.182)
Soil (lg/g) 2.663–5.18 106.759–477.4 31.60–135.0 1048.4–11 712.29 266.6–516.2 41.57–56.13 91.75–142.28 110.05–378.28
(3.03) (249.16) (60.59) (6700.25) (297.71) (38.01) (89.59) (169.92)
Veg./crops (lg/g) ND–0.011 ND–0.970 ND–ND ND–1.296 ND–2.61 ND–1.108 ND–0.988 ND–4.21
(0.002) (0.278) (ND) (0.449) (0.508) (0.479) (0.142) (1.402)
Food grains (lg/g) 0.04–0.45 ND–0.061 ND–5.502 14.20–109.84 10.98–55.58 0.841–1.432 ND–0.845 30.10–65.09
(0.17) (0.012) (2.472) (50.636) (41.032) (1.123) (0.207) (47.16)
Kanpur control (non-receiving) area
Ground water (mg/l) ND–0.001 ND–0.011 0.002–0.008 0.166–4.137 0.006–0.215 0.01–0.034 0.011–0.034 0.021–0.144
(0.001) (0.003) (0.004) (0.89) (0.083) (0.018) (0.022) (0.080)
Soil (lg/g) 1.406–3.881 18.874–39.72 13.0–28.7 6557.05–11356.1 171.54–385.13 20.383–47.71 38.246–101.58 46.03–79.68
(2.455) (29.361) (18.814) (8789.7) (248.24) (31.41) (61.41) (60.08)
Veg./crops (lg/g) ND–0.005 ND–0.245 ND–ND ND–0.762 ND–0.94 ND–0.055 ND–0.354 ND–2.85
(0.001) (0.076) (ND) (0.212) (0.222) (0.015) (0.058) (1.120)
Food grains (lg/g) ND–0.40 ND–ND ND–4.51 0.541–46.65 7.327–44.98 0.469–1.608 ND–0.464 19.858–49.37
0.10 (ND) (2.17) (25.89) (27.227) (1.002) (0.093) (32.892)
244
K.P.Singhet
al./Chem
osphere
55(2004)227–255

Table 9
Range and mean of the pesticide residue levels in different environment media near Kanpur
Media a-BHC b-BHC c-BHC T-BHC op-DDT pp-DDT pp-DDD pp-DDE T-DDT
Kanpur exposed (receiving) area
Surface water (mg/l) ND–0.004 ND–ND ND–ND ND–0.004 ND–ND ND–ND ND–ND ND–0.022 ND–0.025
(0.002) (ND) (ND) (0.002) (ND) (ND) (ND) (0.011) (0.013)
Ground water (mg/l) ND–0.148 ND–ND ND–0.07 ND–0.21 ND–ND ND–ND ND–ND ND–0.395 ND–0.44
(0.016) (ND) (0.0124) (0.028) (ND) (ND) (ND) (0.077) (0.086)
Soil (lg/g) ND–0.065 0.009–0.364 ND–0.035 0.016–0.464 ND–0.026 ND–0.084 ND–0.007 ND–0.031 0.002–0.114
(0.026) (0.11) (0.01) (0.142) (0.008) (0.019) (0.002) (0.008) (0.032)
Veg./crops (lg/g) ND–0.040 0.001–0.083 ND–0.08 0.01–0.20 ND–0.09 ND–ND ND–0.001 ND–0.04 ND–0.013
(0.01) (0.033) (0.020) (0.063) (0.011) (ND) (0.0001) (0.012) (0.023)
Food grains (lg/g) ND–0.012 ND–1.49 ND–0.140 ND–1.64 ND–0.031 ND–ND ND–ND ND–0.09 ND–0.099
(0.005) (0.312) (0.312) (0.35) (0.003) (ND) (ND) (0.021) (0.024)
Kanpur control (non-receiving) area
Ground water (mg/l) ND–0.008 ND–ND ND–0.004 ND–0.008 ND–ND ND–ND ND–ND ND–0.016 ND–0.018
(0.003) (ND) (0.001) (0.003) (ND) (ND) (ND) (0.005) (0.006)
Soil (lg/g) 0.0004–0.015 0.003–0.037 ND–ND 0.003–0.052 ND–0.003 ND–0.005 ND–ND ND–ND ND–0.005
(0.003) (0.019) (ND) (0.021) (0.0004) (0.001) (ND) (ND) (0.001)
Veg./crops (lg/g) ND–0.003 0.002–0.104 ND–0.003 0.002–0.11 ND–0.006 ND–ND ND–0.0003 ND–0.008 ND–0.013
(0.001) (0.028) (0.001) (0.029) (0.001) (ND) (0.0001) (0.003) (0.004)
Food grains (lg/g) ND–0.004 0.018–0.187 ND–0.009 0.021–0.199 ND–ND ND–0.002 ND–0.001 ND–ND ND–0.003
(0.002) (0.106) (0.005) (0.109) (ND) (0.0004) (0.0002) (ND) (0.001)
K.P.Singhet
al./Chem
osphere
55(2004)227–255
245

Table 10
Range and mean of the metal levels in different environment media near Varanasi
Media Cd Cr Cu Fe Mn Ni Pb Zn
Varanasi exposed (receiving) area
Ground water (mg/l) ND–0.006 ND–0.049 ND–0.203 0.02–17.90 0.008–0.559 0.01–0.22 0.012–0.088 0.023–1.17
(0.001) (0.009) (0.016) (1.951) (0.08) (0.04) (0.0290) (0.24)
Soil (lg/g) 3.05–5.82 40.95–72.2 52.7–107.0 9984.67–13 004.7 402.61–602.61 41.57–77.22 88.07–178.95 112.86–151.97
(4.61) (54.87) (74.48) (11 754.67) (502.36) (58.85) (133.86) (132.91)
Veg./crops (lg/g) ND–ND ND–0.345 ND–ND ND–1.35 ND–0.002 ND–1.391 ND–0.607 ND–3.936
(ND) (0.17) (ND) (45) (0.006) (0.70) (0.30) (1.312)
Food grains (lg/g) 0.03–0.26 ND–0.06 1.06–3.12 34.74–59.64 11.6–54.0 0.89–1.82 ND–1.04 18.11–59.43
(0.14) 0.01 (2.29) (42.77) (35.22) (1.19) (0.57) (37.61)
Varanasi control (non-receiving) area
Ground water (mg/l) ND–ND ND–0.036 ND–0.054 0.018–0.738 0.002–0.048 0.008–0.024 0.013–0.026 0.017–0.137
(ND) (ND) (0.005) (0.24) (0.011) (0.015) (0.019) (0.061)
Soil (lg/g) 3.64–4.64 37.66–63.64 43.6–64.2 1157.95–11 027.52 325.97–483.19 35.67–49.49 82.63–124.56 80.05–103.49
(4.16) (46.26) (53.09) (9132.14) (402.89) (43.34) (106.42) (93.98)
Veg./crops (lg/g) ND–ND ND–0.190 ND–ND ND–ND ND–ND ND–0.095 ND–0.38 ND–3.12
(ND) (0.065) (ND) (ND) (ND) (0.046) (0.095) (1.10)
Food grains (lg/g) 0.01–0.10 ND–0.02 0.02–1.40 8.02–40.40 5.40–43.20 0.54–1.04 ND–0.76 12.20–45.60
(0.06) (0.005) (0.85) (14.62) (22.80) (0.82) (0.32) (23.82)
246
K.P.Singhet
al./Chem
osphere
55(2004)227–255

Table 11
Range and mean of the pesticide residue levels in different environment media near Varanasi
Media a-BHC b-BHC c-BHC T-BHC op-DDT pp-DDT pp-DDD pp-DDE T-DDT
Varanasi exposed (receiving) area
Ground water (mg/l) ND–0.077 ND–0.215 ND–0.014 ND–0.301 ND–ND ND–ND ND–ND 0.033–0.158 0.036–0.176
(0.029) (0.1170) (0.005) (0.151) (ND) (ND) (ND) (0.0973) (0.109)
Soil (lg/g) ND–0.02 ND–0.024 ND–0.010 ND–0.054 ND–0.002 ND–0.008 ND–ND ND–0.006 ND–0.016
(0.006) (0.007) (0.003) (0.016) (0.001) (0.002) (ND) (0.001) (0.004)
Veg./crops (lg/g) ND–0.004 0.001–0.083 ND–0.04 0.002–0.095 ND–ND ND–ND ND–0.001 ND–0.08 ND–0.081
(0.001) (0.033) (0.009) (0.036) (ND) (ND) (0.0001) (0.03) (0.03)
Food grains (lg/g) ND–ND ND–0.103 ND–0.055 ND–0.158 ND–ND ND–ND ND–ND ND–0.085 ND–0.095
(ND) (0.035) (0.017) (0.046) (ND) (ND) (ND) (0.021) (0.0234)
Varanasi control (non-receiving) area
Ground water (mg/l) 0.002–0.064 ND–ND ND–0.009 0.002–0.064 ND–ND ND–ND ND–ND ND–0.011 ND–0.012
(0.013) (ND) (0.003) (0.013) (ND) (ND) (ND) (0.0008) (0.0009)
Soil (lg/g) ND–ND ND–0.013 ND–ND ND–0.013 ND–ND ND–ND ND–ND ND–0.002 ND–0.003
(ND) (0.003) (ND) (0.003) (ND) (ND) (ND) (0.0005) (0.0008)
Veg./crops (lg/g) ND–ND 0.004–0.059 ND–0.006 0.004–0.065 ND–0.001 ND–ND ND–0.005 ND–0.002 0.0001–0.009
(ND) (0.02) (0.002) (0.022) (0.001) (ND) (0.001) (0.001) (0.003)
Food grains (lg/g) ND–ND ND–0.020 ND–0.008 ND–0.024 ND–ND ND–ND ND–ND ND–0.004 ND–0.004
(ND) (0.011) (0.004) (0.015) (ND) (ND) (ND) (0.002) (0.002)
K.P.Singhet
al./Chem
osphere
55(2004)227–255
247

Table 13
Neurobehavioral functions covered in questionnaire
Function No. of
items
Possible score
range
Fatigue 4 0–4
Insomnia 3 0–3
Decreased concentration 4 0–4
Depression 5 0–5
Irritability 6 0–6
Gastric symptoms 4 0–4
Sensory symptoms 4 0–4
Motor symptoms 5 0–5
Table
12
Characteristics
ofsoilin
theareareceiving(exposed)andnon-receiving(unexposed)wastew
ater
Identification
pH
(1:5)
EC
(1:10)
(lmho/cm)
Bulk
density
(g/cc)
Particle
density
(g/cc)
Porosity
(%)
Organic
carbon
(%)
Total
nitrogen
(lg/g)
P (lg/g)
Na
(lg/g)
K (lg/g)
Ca
(lg/g)
Mg
(lg/g)
Kanpurexposedarea
Range
7.5–8.9
1050–1250
0.96–1.63
1.54–2.50
19.44–50.74
1.12–2.36
392–1120.0
4.95–7.95
58.80–305.6
38.4–130.0
0.89–4.60
0.34–1.77
Mean
8.1
1160
1.22
1.88
35.56
1.50
738.5
5.96
148.3
93.7
3.36
0.81
Kanpurunexposedarea
Range
7.9–9.0
1050–1250
0.93–1.35
1.82–2.22
31.32
0.62–1.49
56.0–1120.0
1.74–8.47
26.6–137.2
28.8–49.6
1.39–3.39
0.31–1.36
Mean
8.71
1130
1.19
1.97
39.63
1.05
556.0
4.16
50.6
34.86
2.47
0.80
Varanasiexposedarea
Range
7.0–8.5
900–1150
0.88–1.48
0.92–2.0
3.94–41.85
0.14–0.51
765.0–1228.0
3.45–10.94
58.8–104.0
52.8–114.0
––
Mean
8.09
1030
1.21
1.72
26.65
0.35
1108.0
6.36
78.8
83.74
––
Varanasiunexposedarea
Range
8.2–8.55
825–1050
1.01–1.25
1.79–2.0
29.86–49.7
0.29–0.47
840.0–1400.0
8.21–13.56
70.4–99.4
76.0–114.0
––
Mean
8.43
995
1.16
1.9
38.51
0.37
1071.0
10.76
87.65
97.6
––
248 K.P. Singh et al. / Chemosphere 55 (2004) 227–255
that the exposure risk level of the exposed population
groups (Kanpur and Varanasi) with respect to each of
these metals and pesticides is much higher (2–4 times)
as compared to the respective unexposed population
groups.
5. Conclusions
5.1. Impact of wastewater toxicants (metals and pesti-
cides)
The conventional type STPs are basically to reduce the
organic load, these are not very effective in reducing the
levels of metals and pesticides except that a large fraction
of these toxicants present in the wastewater is retained
with the sludge generated by STPs while the remaining
part getting out with the treated wastewater/effluents.
5.1.1. On environmental quality
The impact of these treated wastewater toxicants
(metals and pesticides) on the environmental quality of
the disposal areas as assessed in terms of their elevated
levels in different media samples viz., water, soil, crops,
vegetation, food grains, and biological samples collected
from exposed areas over the respective unexposed areas
near Kanpur and Varanasi STPs, indicate that as a re-
sult of long run disposal of these toxicants, their high
levels built up and obviously will be hazardous to the
population exposed to these. Since both metals and
organo-chlorine pesticides are of persistent type staying
for long in the environment, their higher levels built up
in long run are well understood. The analytical data
generated on metals and pesticides levels in various
environmental media in both the exposed as well as
unexposed areas shows their elevated levels in all the
environmental compartments. Therefore, these toxicants
have definite adverse impact on the environmental
quality of the disposal areas.
5.1.2. On health
Impact of the wastewater toxicants (metals and pes-
ticides) on human health in the areas receiving waste-

Table 14
Survey of health status in rural population (exposed and control) near Kanpur
Name Exposed Control
Total Male Female Total Male Female
Nos % Nos % Nos % Nos % Nos % Nos %
Total 53 37 16 52 45 7
Literate 36 67.92 28 75.67 8 50 36 69.23 33 73.33 3 42.85
Illiterate 17 32.07 9 24.32 8 50 6 11.53 4 8.88 4 57.14
Vegetarian 36 67.92 22 59.45 14 87.50 31 59.61 24 53.33 7 100.0
Non-vegetarian 11 20.75 10 27.02 1 6.25 19 36.54 19 42.22 0 0.00
Smoker 8 15.09 7 18.91 1 6.25 23 44.23 23 51.11 0 0.00
No-smoker 45 84.90 30 81.08 15 93.75 29 55.76 22 48.88 7 100.0
Addiction 13 24.52 13 35.13 0 0.00 11 21.15 11 24.44 0 0.00
Non-addict 40 75.47 24 64.86 16 100 41 78.84 34 75.55 7 100.0
Eyes (+) 19 35.84 11 29.72 8 50.00 12 23.07 9 20.00 3 42.85
()) 33 62.26 25 67.56 8 50.00 40 76.92 36 80.00 4 57.14
Ears (+) 4 7.54 4 10.81 0 0.00 4 7.69 4 8.88 1 14.29
()) 49 92.45 33 89.18 16 100.0 47 90.38 42 93.33 6 85.71
Cardiovasc. (+) 6 11.32 2 5.40 4 25.00 3 5.76 3 6.66 1 14.29
()) 47 88.67 35 94.59 12 75.00 48 92.30 42 93.33 6 85.71
Respiratory (+) 8 15.09 4 10.81 4 25.00 6 11.53 5 11.11 0 0.00
()) 43 81.13 31 83.78 12 75.00 43 82.69 40 88.88 7 100.0
Teeth (+) 20 37.73 11 29.72 9 56.25 4 7.69 4 8.88 1 14.29
()) 33 62.26 26 70.27 7 43.75 47 90.38 41 91.11 6 85.71
Gums (+) 15 28.30 9 24.32 6 37.50 8 15.38 7 15.55 2 28.57
()) 38 71.69 28 75.67 10 62.50 43 82.69 38 84.44 5 71.43
Gastriinst. (+) 13 24.52 8 21.62 5 31.25 9 17.30 8 17.77 2 28.57
()) 40 75.47 29 78.37 11 68.75 42 80.77 37 82.22 5 71.43
Muscular (+) 10 18.86 5 13.51 5 31.25 5 9.61 3 6.66 3 42.85
()) 33 62.26 32 86.48 11 68.75 46 88.46 42 93.33 4 57.14
Nervous (+) 11 20.75 4 10.81 7 43.75 2 3.84 1 2.22 5 71.43
()) 42 79.24 33 89.18 9 56.25 49 94.23 44 97.77 2 28.57
Genito ()) 53 100 37 100 16 100 51 98.07 45 100 7 100
(+) with problem and ()) without problem.
K.P. Singh et al. / Chemosphere 55 (2004) 227–255 249
water was assessed through a standard questionnaire
based survey of the exposed and unexposed population
groups near Kanpur and Varanasi STPs. The ques-
tionnaire contained total 35 items, which cover eight
neurobehavioral functions established to be affected by
the chemicals (heavy metals and pesticides) exposures.
Neurobehavioral analysis was done on the basis of mean
scores for each function of every individual. This sta-
tistical analysis for overall and function-wise difference
between the unexposed and exposed population groups
indicated a significant difference between the two groups
near Kanpur. Therefore, there has been a considerable
impact of these toxicants (metals and pesticides) on
human health in the exposed area.
Further the environmental exposure risk analysis for
these four population groups (two exposed and two
unexposed) was carried out for each of these toxicants
and individually. The approach based on evaluation of
the risk quotient (RQ) for each individual toxicant by
first computing the total daily intake (TDI) of each one
through the major routes (drinking water, food grains,
vegetables, milk etc.) and then comparing with respec-
tive acceptable daily intake (ADI). The final values of
RQs indicated that although, in none of these cases, the
RQ values exceeded 1.0 (positive risk), however the RQ
values for all the metals and pesticides for the two ex-
posed areas were 2–4 times higher over their respective
unexposed population groups. This also supports that
there is considerable risk of the metals and pesticides
exposure on the human health.
The impact was further confirmed through bio-
monitoring of the metals and pesticides levels in the

Table 16
Analysis of the neurobehavioral functions in population groups
(exposed and unexposed) near Kanpur and Varanasi STPs
Functions Kanpur Varanasi
Fatigue + )Insomnia + )Decreased concentration +++ )Depression ++ )Irritability ++ )Gastric symptoms +++ )Sensory symptoms ++ )Motor symptoms + )
(+) Significant at p < 0:05.
(++) at p < 0:01.
(+++) at p < 0:001.
()) non-significant.
Table 15
Survey of health status in rural population (exposed and control) near Varanasi
Name Exposed Control
Total Male Female Total Male Female
Nos % Nos % Nos % Nos % Nos % Nos %
Total 51 50 50 45 5
Literate 27 52.94 27 54.00 Not Available 27 54.00 26 57.77 1 20.00
Illiterate 23 45.09 22 44.00 19 38.00 16 35.55 3 60.00
Vegetarian 14 27.45 13 26.00 17 34.00 14 31.11 5 100.0
Non-vegetarian 34 66.66 34 68.00 30 60.00 27 60.00 0 0.00
Smoker 20 39.21 20 40.00 10 20.00 9 20.00 2 40.00
No-smoker 31 60.78 30 60.00 40 80.00 35 77.77 3 60.00
Addiction 27 52.94 26 52.00 15 30.00 15 33.33 0 0.00
Non-addict 24 47.05 24 48.00 Not Available 35 70.00 30 66.66 5 100.0
Eyes (+) 14 27.45 13 26.00 16 32.00 13 28.88 3 60.00
()) 36 70.58 36 72.00 34 68.00 32 71.11 2 40.00
Ears (+) 6 11.76 5 10.00 2 4.00 2 4.44 0 0.00
()) 46 90.19 45 90.00 48 96.00 43 95.55 5 100.0
Cardiovasc. (+) 4 7.84 3 6.00 6 12.00 4 8.88 2 40.00
()) 47 92.15 47 94.00 44 88.00 41 91.11 3 60.00
Respiratory (+) 5 9.80 5 10.00 6 12.00 4 8.88 2 40.00
()) 46 90.19 45 90.00 44 88.00 41 91.11 3 60.00
Teeth (+) 15 29.41 14 28.00 17 34.00 11 24.44 3 60.00
()) 37 72.54 36 72.00 33 66.00 31 68.88 2 40.00
Gums (+) 5 9.80 5 10.00 12 24.00 9 20.00 3 60.00
()) 46 90.19 45 90.00 38 76.00 35 77.77 2 40.00
Gastriinst. (+) 13 25.49 13 26.00 18 36.00 15 33.33 0 0.00
()) 38 74.50 37 74.00 32 64.00 30 66.66 5 100.0
Muscular (+) 7 13.72 6 12.00 3 6.00 1 2.22 2 40.00
()) 44 86.27 44 88.00 47 94.00 44 97.77 3 60.00
Nervous (+) 9 17.64 8 16.00 6 12.00 4 8.88 2 40.00
()) 43 84.31 42 84.00 44 88.00 41 91.11 3 60.00
Genito (+) 3 6.00 3 6.66
()) 51 100 100 100 47 94.00 42 93.33 5 100
(+) with problem and ()) without problem.
250 K.P. Singh et al. / Chemosphere 55 (2004) 227–255
human blood and urine of the different population
groups under study. The levels of both the metals as well
as pesticides in the human blood and urine samples of
the two exposed population groups (Kanpur and
Varanasi) were considerably higher than those of the
respective unexposed population groups.
Thus all the three different kind of approaches indi-
cated a considerable risk and impact of the heavy metals
and pesticides on the human health in the exposed areas
receiving the wastewater from STPs.
5.1.3. On agricultural
The mean level of Cd and Cr in soils near Kanpur
and Cd, Ni, and Pb near Varanasi are above their
respective tolerable limits for agricultural crops.

Table 17
Range and mean of the metal levels in human blood samples (Varanasi)
Human blood (lg/ml) Age Cd Cr Cu Fe Mn Ni Pb Zn
Exposed area 20–60 0.103–0.283 0.657–2.905 0.440–1.101 341.05–852.75 0.717–2.135 0.677–2.595 1.077–6.00 4.13–45.73
Exposed area
mean±SD
39±14 0.184± 0.06 1.082± 0.59 0.846± 0.15 491.11± 123.5 1.134± 0.34 1.592± 0.62 3.512± 1.73 26.42± 8.87
Unexposed area 17–40 0.051–0.220 0.229–0.678 0.662–1.003 333.99–484.29 0.552–1.061 0.307–1.882 0.629–4.187 8.19–25.87
Unexposed area
mean±SD
27±9 0.101± 0.06 0.508± 0.16 0.781± 0.12 414.57± 56.64 0.830± 0.19 0.791± 0.53 1.0708±1.24 15.27± 5.62
Table 18
Range and mean of the metal levels in human blood samples (Kanpur)
Human blood (lg/ml) Age Cd Cr Cu Fe Mn Ni Pb Zn
Exposed area 20–60 0.061–1.23 1.415–2.503 0.570–1.210 279.58–630.60 0.541–1.570 0.570–1.148 ND–1.416 8.83–18.92
Exposed area
mean±SD
35± 9 0.094± 0.02 2.091± 0.35 0.845± 0.15 472.15± 109.79 0.841± 0.34 0.851± 0.15 0.176± 0.39 14.51± 3.312
Unexposed area 16–40 0.040–0.127 0.300–2.177 0.525–1.084 243.10–510.77 0.347–1.020 0.305–1.038 ND–0.862 7.08–24.30
Unexposed area
mean±SD
30± 8 0.078± 0.03 1.277± 0.57 0.810± 0.17 430.33± 88.29 0.829± 0.17 0.637± 0.24 0.087± 0.24 13.03± 5.41
Table 19
Range and mean of the metal levels in human urine samples (Varanasi)
Human blood
(lg/ml)
Age Cd Cr Cu Fe Mn Ni Pb Zn
Exposed area 22–74 0.003–0.009 0.049–0.599 0.005–0.283 0.064–2.453 0.002–0.111 0.041–0.115 0.032–0.095 0.153–0.663
Exposed area
mean±SD
45± 17 0.005± 0.002 0.107± 0.129 0.030±0.066 0.697± 0.717 0.032± 0.032 0.073± 0.022 0.06± 0.020 0.357± 0.152
Unexposed area 18–52 ND–0.008 0.142–0.138 0.009–0.033 0.066–0.65 0.002–0.026 0.025–0.094 0.011–0.08 0.062–1.515
Unexposed area
mean±SD
26± 13 0.002± 0.002 0.075± 0.032 0.016±0.006 0.214± 0.144 0.015± 0.006 0.048± 0.020 0.038± 0.017 0.326± 0.341
Table 20
Range and mean of the metal levels in human urine samples (Kanpur)
Human blood (lg/ml) Age Cd Cr Cu Fe Mn Ni Pb Zn
Exposed area 13–75 0.001–0.19 0.008–0.235 0.003–0.073 ND–6.741 0.012–0.083 0.039–0.136 0.061–0.166 0.173–1.202
Exposed area
mean±SD
46± 20 0.008± 0.004 0.102± 0.07 0.020± 0.014 0.671± 1.421 0.029±0.016 0.087± 0.027 0.116± 0.026 0.538± 0.277
Unexposed area 16–50 ND–0.013 0.004–0.060 0.004–0.026 0.103–1.581 0.007–0.135 0.039–0.107 0.069–0.164 0.152–1.262
Unexposed area
mean±SD
31± 10 0.007± 0.003 0.032± 0.015 0.016± 0.007 0.575± 0.391 0.029±0.03 0.071± 0.020 0.113± 0.026 0.542± 0.254
K.P.Singhet
al./Chem
osphere
55(2004)227–255
251

Table 21
Range and mean of the pesticide residue levels in human blood samples (Varanasi)
Human blood (ng/ml) Age a-BHC b-BHC c-BHC T-BHC op-DDT pp-DDT pp-DDD pp-DDE T-DDT
Exposed area 20–60 ND–8.61 ND–9.312 ND–3.954 1.643–13.266 ND–0.455 ND–ND ND–3.254 ND–6.311 ND–6.50
Exposed area
mean±SD
39± 14 2.89± 1.95 3.92± 2.17 1.05± 0.97 7.86±2.75 0.073± 0.11 ND 0.43± 0.80 1.64± 1.53 2.14±1.80
Unexposed area 17–40 0.122–6.882 0.522–6.424 ND–1.467 2.568–9.104 ND–2.206 ND–ND ND–1.885 ND–4.346 ND–4.362
Unexposed area
mean±SD
27± 9 2.05± 2.29 3.80± 1.90 0.72± 0.53 6.58±2.36 0.05± 0.07 ND 0.32± 0.70 1.08± 1.51 1.45±1.68
Table 22
Range and mean of the pesticide residue levels in human blood samples (Kanpur)
Human blood (ng/ml) Age a-BHC b-BHC c-BHC T-BHC op-DDT pp-DDT pp-DDD pp-DDE T-DDT
Exposed area 20–50 ND–8.912 ND–9.234 ND–4.315 ND–12.952 ND–0.567 ND–ND ND–3.876 ND–7.42 ND–7.497
Exposed area
mean±SD
35± 9 3.11± 2.01 3.99± 2.34 1.21± 1.07 8.31± 3.39 0.08± 0.16 ND 0.47± 1.04 1.91± 1.79 2.46± 2.16
Unexposed area 16–40 ND–7.344 ND–7.838 ND–1.888 ND–11.812 ND–0.32 ND–ND ND–1.956 ND–5.531 0.035–4.861
Unexposed area
mean±SD
30± 8 2.42± 1.98 3.22± 1.78 0.81± 0.58 6.45± 3.00 0.04± 0.09 ND 0.35± 0.62 1.19± 1.10 1.51± 1.28
Table 23
Range and mean of the pesticide residue levels in human urine samples (Varanasi)
Human blood (ng/ml) Age a-BHC b-BHC c-BHC T-BHC op-DDT pp-DDT pp-DDD pp-DDE T-DDT
Exposed area 22–74 ND–1.113 ND–6.921 ND–2.211 ND–8.697 ND–0.348 ND–ND ND–0.204 ND–3.34 ND–3.418
Exposed area
mean±SD
45± 17 0.37± 0.37 1.48± 1.36 0.49± 0.56 2.33± 2.02 0.02± 0.06 ND 0.04± 0.05 0.89±0.98 0.95± 1.01
Unexposed area 18–52 ND–0.406 ND–4.52 ND–0.779 ND–5.655 ND–0.048 ND–ND ND–0.056 ND–2.064 ND–2.12
Unexposed area
mean±SD
26± 13 0.11± 0.14 1.24± 1.49 0.23± 0.29 1.58± 1.87 0.01± 0.02 ND 0.02± 0.02 0.41±0.56 0.44± 0.57
Table 24
Range and mean of the pesticide residue levels in human urine samples (Kanpur)
Human blood (ng/ml) Age a-BHC b-BHC c-BHC T-BHC op-DDT pp-DDT pp-DDD pp-DDE T-DDT
Exposed area 13–75 ND–2.122 ND–7.328 ND–3.112 ND–9.858 ND–0.199 ND–ND ND–0.214 ND–3.745 ND–3.89
Exposed area
mean±SD
46±20 0.63± 0.77 2.23± 1.97 0.66± 0.69 3.34± 2.89 0.02± 0.05 ND 0.04± 0.07 0.92± 0.84 0.98± 0.87
Unexposed area 16–50 ND–1.445 ND–5.593 ND–1.225 ND–7.734 ND–0.06 ND–ND ND–0.054 ND–2.384 0.009–2.384
Unexposed area
mean±SD
31±10 0.26± 0.36 1.80± 1.63 0.41± 0.42 2.46± 2.27 0.02± 0.02 ND 0.02± 0.02 0.59± 0.66 0.63± 0.66
252
K.P.Singhet
al./Chem
osphere
55(2004)227–255
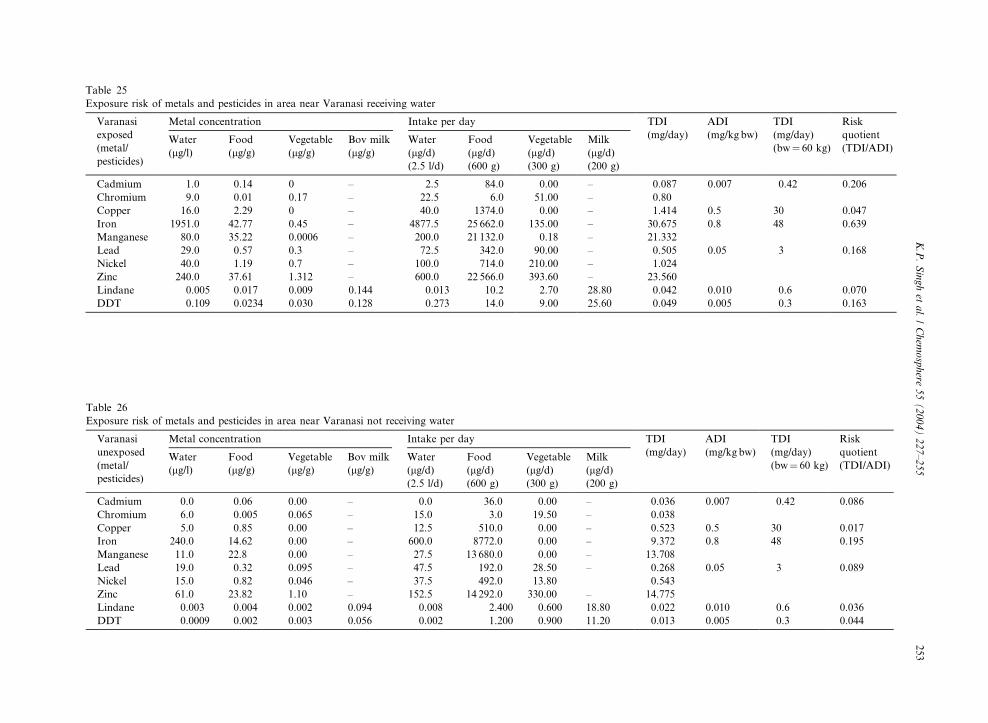
Table 25
Exposure risk of metals and pesticides in area near Varanasi receiving water
Varanasi
exposed
(metal/
pesticides)
Metal concentration Intake per day TDI
(mg/day)
ADI
(mg/kg bw)
TDI
(mg/day)
(bw¼ 60 kg)
Risk
quotient
(TDI/ADI)Water
(lg/l)Food
(lg/g)Vegetable
(lg/g)Bov milk
(lg/g)Water
(lg/d)(2.5 l/d)
Food
(lg/d)(600 g)
Vegetable
(lg/d)(300 g)
Milk
(lg/d)(200 g)
Cadmium 1.0 0.14 0 – 2.5 84.0 0.00 – 0.087 0.007 0.42 0.206
Chromium 9.0 0.01 0.17 – 22.5 6.0 51.00 – 0.80
Copper 16.0 2.29 0 – 40.0 1374.0 0.00 – 1.414 0.5 30 0.047
Iron 1951.0 42.77 0.45 – 4877.5 25 662.0 135.00 – 30.675 0.8 48 0.639
Manganese 80.0 35.22 0.0006 – 200.0 21 132.0 0.18 – 21.332
Lead 29.0 0.57 0.3 – 72.5 342.0 90.00 – 0.505 0.05 3 0.168
Nickel 40.0 1.19 0.7 – 100.0 714.0 210.00 – 1.024
Zinc 240.0 37.61 1.312 – 600.0 22 566.0 393.60 – 23.560
Lindane 0.005 0.017 0.009 0.144 0.013 10.2 2.70 28.80 0.042 0.010 0.6 0.070
DDT 0.109 0.0234 0.030 0.128 0.273 14.0 9.00 25.60 0.049 0.005 0.3 0.163
Table 26
Exposure risk of metals and pesticides in area near Varanasi not receiving water
Varanasi
unexposed
(metal/
pesticides)
Metal concentration Intake per day TDI
(mg/day)
ADI
(mg/kg bw)
TDI
(mg/day)
(bw¼ 60 kg)
Risk
quotient
(TDI/ADI)Water
(lg/l)Food
(lg/g)Vegetable
(lg/g)Bov milk
(lg/g)Water
(lg/d)(2.5 l/d)
Food
(lg/d)(600 g)
Vegetable
(lg/d)(300 g)
Milk
(lg/d)(200 g)
Cadmium 0.0 0.06 0.00 – 0.0 36.0 0.00 – 0.036 0.007 0.42 0.086
Chromium 6.0 0.005 0.065 – 15.0 3.0 19.50 – 0.038
Copper 5.0 0.85 0.00 – 12.5 510.0 0.00 – 0.523 0.5 30 0.017
Iron 240.0 14.62 0.00 – 600.0 8772.0 0.00 – 9.372 0.8 48 0.195
Manganese 11.0 22.8 0.00 – 27.5 13 680.0 0.00 – 13.708
Lead 19.0 0.32 0.095 – 47.5 192.0 28.50 – 0.268 0.05 3 0.089
Nickel 15.0 0.82 0.046 – 37.5 492.0 13.80 0.543
Zinc 61.0 23.82 1.10 – 152.5 14 292.0 330.00 – 14.775
Lindane 0.003 0.004 0.002 0.094 0.008 2.400 0.600 18.80 0.022 0.010 0.6 0.036
DDT 0.0009 0.002 0.003 0.056 0.002 1.200 0.900 11.20 0.013 0.005 0.3 0.044
K.P.Singhet
al./Chem
osphere
55(2004)227–255
253
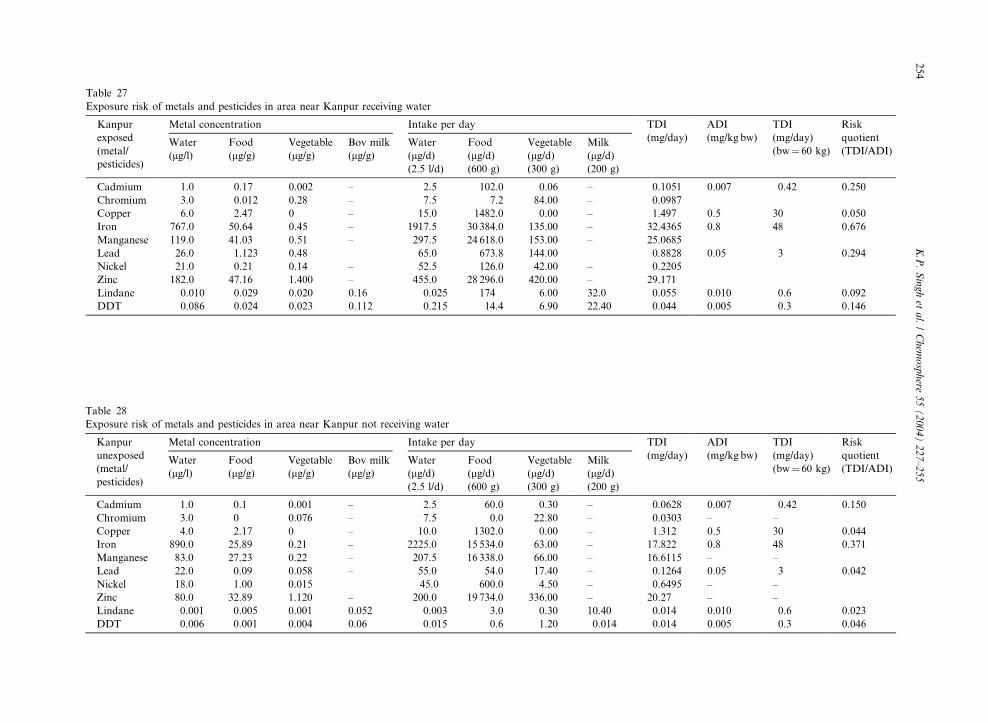
Table 27
Exposure risk of metals and pesticides in area near Kanpur receiving water
Kanpur
exposed
(metal/
pesticides)
Metal concentration Intake per day TDI
(mg/day)
ADI
(mg/kg bw)
TDI
(mg/day)
(bw¼ 60 kg)
Risk
quotient
(TDI/ADI)Water
(lg/l)Food
(lg/g)Vegetable
(lg/g)Bov milk
(lg/g)Water
(lg/d)(2.5 l/d)
Food
(lg/d)(600 g)
Vegetable
(lg/d)(300 g)
Milk
(lg/d)(200 g)
Cadmium 1.0 0.17 0.002 – 2.5 102.0 0.06 – 0.1051 0.007 0.42 0.250
Chromium 3.0 0.012 0.28 – 7.5 7.2 84.00 – 0.0987
Copper 6.0 2.47 0 – 15.0 1482.0 0.00 – 1.497 0.5 30 0.050
Iron 767.0 50.64 0.45 – 1917.5 30 384.0 135.00 – 32.4365 0.8 48 0.676
Manganese 119.0 41.03 0.51 – 297.5 24 618.0 153.00 – 25.0685
Lead 26.0 1.123 0.48 65.0 673.8 144.00 0.8828 0.05 3 0.294
Nickel 21.0 0.21 0.14 – 52.5 126.0 42.00 – 0.2205
Zinc 182.0 47.16 1.400 – 455.0 28 296.0 420.00 – 29.171
Lindane 0.010 0.029 0.020 0.16 0.025 174 6.00 32.0 0.055 0.010 0.6 0.092
DDT 0.086 0.024 0.023 0.112 0.215 14.4 6.90 22.40 0.044 0.005 0.3 0.146
Table 28
Exposure risk of metals and pesticides in area near Kanpur not receiving water
Kanpur
unexposed
(metal/
pesticides)
Metal concentration Intake per day TDI
(mg/day)
ADI
(mg/kg bw)
TDI
(mg/day)
(bw¼ 60 kg)
Risk
quotient
(TDI/ADI)Water
(lg/l)Food
(lg/g)Vegetable
(lg/g)Bov milk
(lg/g)Water
(lg/d)(2.5 l/d)
Food
(lg/d)(600 g)
Vegetable
(lg/d)(300 g)
Milk
(lg/d)(200 g)
Cadmium 1.0 0.1 0.001 – 2.5 60.0 0.30 – 0.0628 0.007 0.42 0.150
Chromium 3.0 0 0.076 – 7.5 0.0 22.80 – 0.0303 – –
Copper 4.0 2.17 0 – 10.0 1302.0 0.00 – 1.312 0.5 30 0.044
Iron 890.0 25.89 0.21 – 2225.0 15 534.0 63.00 – 17.822 0.8 48 0.371
Manganese 83.0 27.23 0.22 – 207.5 16 338.0 66.00 – 16.6115 – –
Lead 22.0 0.09 0.058 – 55.0 54.0 17.40 – 0.1264 0.05 3 0.042
Nickel 18.0 1.00 0.015 45.0 600.0 4.50 – 0.6495 – –
Zinc 80.0 32.89 1.120 – 200.0 19 734.0 336.00 – 20.27 – –
Lindane 0.001 0.005 0.001 0.052 0.003 3.0 0.30 10.40 0.014 0.010 0.6 0.023
DDT 0.006 0.001 0.004 0.06 0.015 0.6 1.20 0.014 0.014 0.005 0.3 0.046
254
K.P.Singhet
al./Chem
osphere
55(2004)227–255

K.P. Singh et al. / Chemosphere 55 (2004) 227–255 255
However, since, the pH of the wastewater as well as
receiving soils are more than 8, the metal mobilization
and plant uptake would be restricted by the alkaline pH.
Further, the critical levels of the heavy metals in soils for
agricultural crops are much higher than those observed
in our study areas irrigated with wastewater; there seems
no adverse impact of metals and pesticides on agricul-
tural crops in these areas. However, questionnaire based
information on agricultural crops yield during last few
years collected from these areas revealed that the crops
yield has declined (90% cases) over past few years.
While, an enhancement yield was reported (65%) in area
near Varanasi irrigated with treated wastewater. The
decreased productivity in previous case was due to high
soils/bacterial bio-mass making the soil–root interface
more susceptible to plant root diseases. However, the
enhanced yield in later case may be due to more irriga-
tion water availability with high nutrient/fertilizer (N, P,
K, and organic carbon) value water.
5.2. Impact of STPs sludge
The STPs sludge has both positive as well negative
impacts as it is enriched with high levels of toxic heavy
metals and pesticides and also with several useful ingre-
dients such as N, P, and K providing fertilizer value. The
STPs sludge studied here has cadmium, chromium and
nickel levels above their tolerable levels as prescribed for
agricultural land application. However, the soil pH
(mean) in alkaline range (>8.0) encounters with metal
mobilization and restrict their uptake by the crops to
much extent and thus reducing the expected toxicity.
However, in terms of the fertilizer value (N, P, K etc.)
it has been estimated that about 14 kg nitrogen (N), 6.67
kg phosphorous (P) and 4.25 kg potassium (K) would be
available per ton of the generated sludge and its value at
existing rates will be about Rs. 486.
Acknowledgements
The authors are thankful to the Director, Industrial
Toxicology Research Centre, Lucknow for providing all
necessary facilities for this work and consistent encour-
agement and guidance throughout the studies.
References
Anger, W.K., 1989. Human neurobehavioral toxicity testing:
current perspective. Toxicol. Ind. Health 5 (2), 165–180.
APHA, 1998. Standard Methods for the Examination of Water
and Wastewater, 20th ed. American Public Health Associ-
ation, Washington.
Boehm, A.B., Grant, S.B., Kim, J.H., Mowbray, S.L., Mcgee,
C.D., Clark, C.D., Foley, D.M., Wellman, D.E., 2002.
Decadal and shorter period variability of surf zone water
quality at Huntington beach California. Environ. Sci.
Technol. 36 (18), 3685–3692.
Brezonic, P., Hatch, K., Mulla, L., Perry, D., 1999. Manage-
ment of diffuse pollution in agricultural watersheds lessons
from Minnesota river basin. Water Sci. Technol. 39, 323–
330.
Campolo, M., Andreussi, P., Soldati, A., 2002. Water quality
control in the river Arno. Water Res. 36, 2673–2680.
Duda, A.M., 1993. Addressing non-point sources of water
pollution must become an international priority. Water Res.
28 (3–5), 1–11.
Hannah, S.A., Austern, B.M., Eralp, A.E., Wise, R.H., 1986.
Comparative removal of toxic pollutants by six wastewater
treatment processes. J. Water Pollut. Control Fed. 58, 27–
34.
Hanninen, H., Lindstrom, H., 1979. Behavioral Test Battery for
Toxic Psychological Studies used at the Institute of Occu-
pational Health in Helsinki. Institute of Occupational
Health, Helsinki.
Jain, C.K., 2002. A hydro-chemical study of a mountainous
watershed. Ganga India Water Res. 36, 1262–1274.
Lili, G., Elsner, J., 1995. Review of multiple chemical exposure
factors which may disturb human behavioral development.
SOZ Praventiv Med. 40 (4), 209–217.
Markantonatos, P., Bacals, N., Angelidis, M., 1995. Pollution
control in the catchments basin of the river Evrotas Greece.
Water Sci. Technol. 32, 227–255.
Marttinen, S.K., Kettunen, R.H., Rintala, J.A., 2003. Occur-
rence and removal of organic pollutants in sewage and
landfill leachates. Sci. Total Environ. 301 (1–3), 1–12.
Nobukawa, T., Sanukida, S., 2002. Contributions of genotoxic
precursors from tributary rivers and sewage effluents to the
Yodo River in Japan. Water Res. 36, 989–995.
Otto, D., Shalik, I., Hudnell, H.K., Rateliffe, J., House, D.,
1994. Association of mercury exposure with neurobehav-
ioral performance of children in Bohemia. Neurotoxicology
15 (4), 962.
Ramond, N., Jane, L., Kenneth, S., Dennis, S., 1991. Hypoth-
eses to explain the higher symptoms rate observed around
hazardous waste sites. Environ. Health Perspect. 94, 31–
38.
Rogers, H.R., 1996. Sources, behavior and fate of organic
contaminants during sewage treatment and in sewage
sludges. Sci. Total Environ. 185, 3–26.
Tara, V., Yadav, A.V.S., Bose, P., 2003. Analysis of photo-
synthetic activity in the most polluted stretch of river
Ganga. Water Res. 37, 67–77.
William, P.L., 1996. Environmental and occupational health
affects of pesticides and other chemicals. USDA/cooperative
State Res. SER FEDRIP DATABASE, NITS.