Embed Size (px)
Citation preview

Immunotherapy for Metastatic
Renal Cell Carcinoma
ICLIO 1st Annual National Conference
10.2.15
Philadelphia, Pa.
Timothy M. Kuzel, MD
Professor of Medicine and
Dermatology
Feinberg School of Medicine
Northwestern University
Chicago, Ilinois
Financial Disclosures
• I currently have or have the following
relevant financial relationships to disclose: •Advisory Board: Genentech
•Consultant: Merck
•Grant/Research Support: Bristol-Myers Squibb,
Genentech, MedImmune, Merck
•Speakers Bureau: Genentech

Off-Label Use Disclosures
• I do intend to discuss off-label uses of
products during this activity.

Slide 15
Presented By Cora Sternberg at 2015 ASCO Annual Meeting

Everolimus
Biological Pathways in RCC and
Targets of Therapeutic Agents
5 Rini BI et al. Lancet. 2009;373:1119-1132.

Metastatic RCC: Treatment Results Prior to
the Targeted Therapy Era Therapy Trials
(N)
Patients
(N)
ORR
(%)
Survival
Median (Months)
Observation 7 1139 0.3 6
Hormonal 68 754 6-10 6
Chemotherapy 83 4093 5-10 < 9
INF*
INF + Nephrectomy 1
123
123
8.1
12.5
INF
INF + Nephrectomy 1
42
41
12
20
7
17
Yagoda et al. Semin Oncol 1993; Amato RJ. Semin Oncol 2000; Flanigan, NEJM 2001; Mickisch, Lancet 2001. *Off label

Interleukin-2 : Background • Discovered in 1976 and described as a
protein that stimulates growth of T cells.1
• Recombinant (r) IL-2 first cloned in 1983.1
• First given to cancer patients in 1983.2
• First phase I studies of rIL-2 in malignant disease in 1984.4
• Jurkat cell line-derived IL-2 first used to treat cancer patients in 1985.3
• Phase II clinical trials began in 1985.1
• FDA approval in 1992. 3. Lotze MT, et al. J Immunol 1985; 134:157-166. 4. Atkins MB, et al. J Clin Oncol 1986; 4:1380-1391.
1. Atkins MB, et al. J Clin Oncol 1999; 17:2105-2116. 2. Bindon C, et al. Br J Cancer 1983; 47:123-133.

Interleukin-2: Immunologic Background
• Natural biologic immunomodulatory agent
• Autocrine T-cell growth factor
– Produced exclusively by activated T cells
– Predominantly CD-4+ (T-helper) lymphocytes
• Immunomodulatory actions:
– Proliferation and activation of T cells
– Immune response amplification
– Enhanced antibody production by B cells
– NK cell expansion and activation
• Stimulates T-cell secretion
– Tumor necrosis factor (TNF)
– Other cytokines (ie, IL-4, interferon-gamma)
• Stimulates proliferation and activation of:
– All T cells, including cytotoxic
T lymphocytes (CTLs) but also Regulatory T cell (Tregs)
– Natural killer and Lymphokine-activated Killer (LAK) cells
Abbas AK and Lichtman AH. Cellular and Molecular Immunology. 2003

• 600,000 IU/kg (0.037 mg/kg) delivered by 15-min bolus i.v. infusion q8h for 14 doses
• 720,000 IU/kg delivered by 15-min bolus i. v. infusion q8h for 12 doses
• Additional courses of treatment are given if there is some shrinkage following the last course.
• Each treatment course should be separated by a rest period of at least 7 weeks from the date of hospital discharge.
Cycle 1:
Proleukin
q8h
High-dose IL-2 (HD IL-2) has the potential to induce durable complete responses in a
small number of patients
.
Cycle 2:
Proleukin
q8h
Resume Normal Activities
Days 1-5 Days 6-14 Days 15-19 About 4 Weeks ~Day 47
NO TREATMENT
Treatment Course Recovery Period
AS
SE
SM
EN
T
Typical Proleukin® Treatment Schedule
Schedule for HD-Interleukin-2 Therapy
Proleukin PI

Therapy Trials
N
Patients
N
ORR (CR),
%
Survival
Median, Months Trial Phase
Observation 7 1139 0.3 6
LD IL-2 + IFN
HD IL-2 1
91
95
10 (3)
23 (8)
13
17 III
HD IL-2 7 255 14 (7) 16 II
HD IL-2
LD IL-2 1
156
150
21 (7)
13 (4)
17
18 III
HD IL-2 IV
LD IL-2 IV
LD IL-2 SC
1
96
92
93
21 (7)
11 (1)
10 (2)
17
17
17
III
Yagoda, Semin Oncol 1993; McDermott, J Clin Oncol 2005;
Fisher, Cancer J 2000; Yang, J Clin Oncol 2003
Interleukin-2: Treatment Results in Metastatic RCC

Response in metastatic RCC to High Dose Interleukin-2
• 15% response rate (7% CR, 8% PR).1
• Median duration of response was 54 months for all
responders, 20 months for partial responders, and has not
yet been reached for complete responders.1
• 38% of responders began therapy with tumor burdens > 50
cm2 on pretreatment scans.
• 60% of partial responders had > 90% regression of all
measurable disease.1
• 60% of complete responders remain in remission after 30
months.
• Residual disease from some partial responders could be
resected.
– Patients remain alive and disease-free at a minimum of
65+ months
Response Duration for Patients
receiving HD IL-22
1. McDermott, Med Oncol 2009; 26:S13-S17; 2. Atkins, Kidney Int 2005; 67:2069-2083.

Renal Cell Cancer
Northwestern Experience with Various Regimens
Pamar S,et al. Medical Oncology 22:399, 2005

Response by Baseline Characteristics-Select Study Mcdermott D, et al Baseline Characteristics RR (95% CI) P Value*
All Patients (n = 120) 28% (20%-37%) 0.0016
Tumor Type
Clear Cell (n = 115) 30% (21%-39%) 0.31
Non-Clear Cell (n = 5) 0% (0%-52%)
MSKCC Risk Group
Favorable (n = 31) 32% (17%-51%) 0.08
Intermediate (n = 83) 24% (15%-35%)
Poor (n = 6) 67% (22%-96%)
UCLA Risk Group
Low (n = 10) 30% (7%-65%) 0.22
Intermediate (n = 101) 30% (21%-40%)
High (n = 8) 0% (0%-37%)
McDermott DF et al. ASCO 2010. Abstract # 4514
Newer Immunotherapy
Approaches in Development
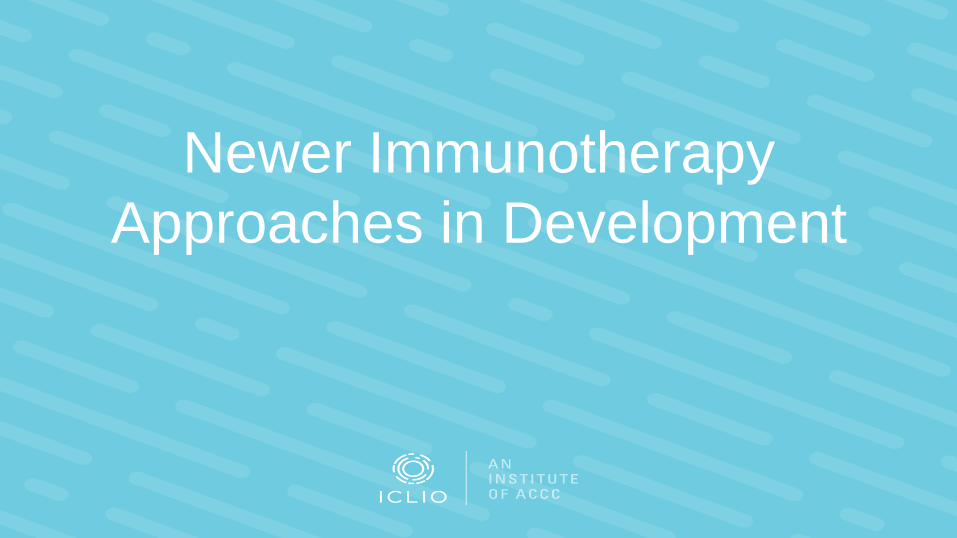
Anti-PD-1: Blocking T cell Suppression<br />
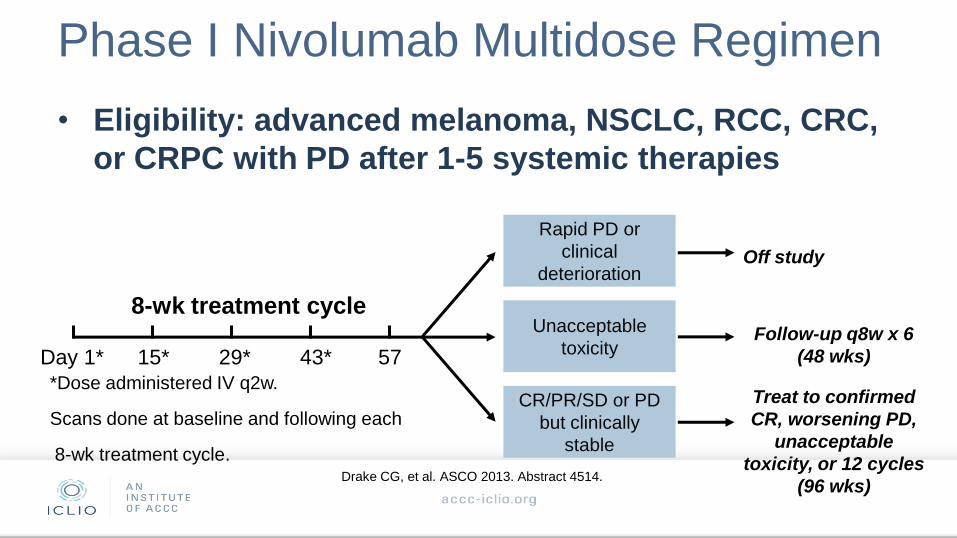
Phase I Nivolumab Multidose Regimen
• Eligibility: advanced melanoma, NSCLC, RCC, CRC,
or CRPC with PD after 1-5 systemic therapies
Day 1* 15* 29* 43* 57 Follow-up q8w x 6
(48 wks)
Treat to confirmed
CR, worsening PD,
unacceptable
toxicity, or 12 cycles
(96 wks)
Off study
*Dose administered IV q2w.
Scans done at baseline and following each
8-wk treatment cycle.
Rapid PD or
clinical
deterioration
Unacceptable
toxicity
CR/PR/SD or PD
but clinically
stable
8-wk treatment cycle
Drake CG, et al. ASCO 2013. Abstract 4514.

Nivolumab: Outcomes in Patients With
Metastatic RCC Dose, mg/kg Objective Response
Rate, % (n/N)
Median DoR,
Wks (Range)
SD Rate,
% (n/N)
24 Wks 48 Wks
All doses 29.4 (10/34) 56.1
(36.6-126.7+)
26.5 (9/34) 5.9 (2/34)
1 27.8 (5/18) 56.1
(40.1-76.1+)
22.2 (4/18) 5.6 (1/18)
10 31.3 (5/16) 56.1
(36.6-126.7+)
31.3 (5/16) 6.3 (1/16)
Drake CG, et al. ASCO 2013. Abstract 4514.

Patients with mRCC treated with nivolumab 1 or 10 mg/kg
Change in Target Lesions From Baseline After
Nivolumab Therapy
Ch
an
ge
in
Ta
rge
t L
es
ion
s
Fro
m B
as
eli
ne
, %
100
80
60
40
20
0
-20
-40
-60
-80
-100
144%
0 10 20 30 40 50 60 70 80 90 100 110 120 130 140 150 160
Weeks Since Treatment Initiation
1 mg/kg nivolumab
10 mg/kg nivolumab
First occurrence of new lesion
Hodi FS, et al. 12th International Congress on Targeted Anticancer Therapies. Abstract O2.3.

Phase II study design
Arm 1
0.3 mg/kg nivolumab IV Q3weeks
Arm 2
2 mg/kg nivolumab IV Q3weeks
Arm 3
10 mg/kg nivolumab IV Q3weeks
Randomizea
1:1:1 (treatment arms
blinded)
Screen for
eligibility
19
ClinTrials.gov NCT01354431
aStratified by MSKCC prognostic score (0 vs 1 vs 2/3) and number of prior lines of therapy in the metastatic setting (1 vs >1).
Treat until
progression
or
intolerable
toxicity

Patient demographics Nivolumab, mg/kg
0.3
(n=60)
2.0
(n=54)
10
(n=54)
Total
(N=168)
MSKCC risk factors, %a
0 33 33 33 33
1 43 41 41 42
2-3 23 26 26 25
Number of metastatic sites, %
1 22 9 22 18
≥2 78 91 78 82
Prior antiangiogenic regimens, %a
1 57 65 65 62
2 37 30 33 33
3 7 6 2 5
aTotal 100% due to rounding. 20

Prior treatment in metastatic setting Nivolumab, mg/kg
0.3
(n=60)
2.0
(n=54)
10
(n=54)
Total
(N=168)
Prior lines of therapy, %
1 27 30 33 30
2 33 35 43 37
3 40a 35 24 33
Common prior agentsb, %
Sunitinib 77 78 69 74
Everolimus 35 33 33 34
Pazopanib 25 33 24 27
Interleukin-2 25 20 22 23
a1 patient (2%) in the 0.3 mg/kg group received >3 prior systemic therapies in the metastatic setting. b > 20% of patients. 21

22
Objective responses
-100
100
50
25
0
-25
-50
-75
Best change in t
um
or
volu
me fro
m b
aselin
e (
%)
0.3 mg/kg (n=60) 2 mg/kg (n=54) 10 mg/kg (n=54)
75
0
Best response %
CR 2
PR 18
Stable 37
PD 40
NE 3
Best response %
CR 2
PR 20
Stable 43
PD 33
NE 2
Best response %
CR 0
PR 20
Stable 44
PD 32
NE 4
ORRa = 20% ORRa = 22% ORRa = 20%
aORR defined by RECIST v1.1; data cutoff May 15, 2013.
CR, complete response; PR, partial response; PD, progressive disease; NE, not evaluable.
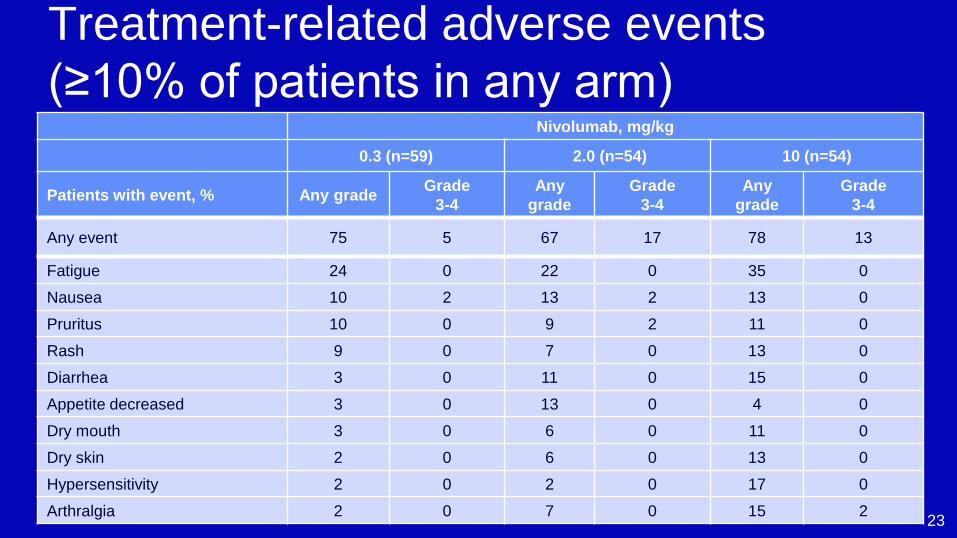
Treatment-related adverse events
(≥10% of patients in any arm) Nivolumab, mg/kg
0.3 (n=59) 2.0 (n=54) 10 (n=54)
Patients with event, % Any grade Grade
3-4
Any
grade
Grade
3-4
Any
grade
Grade
3-4
Any event 75 5 67 17 78 13
Fatigue 24 0 22 0 35 0
Nausea 10 2 13 2 13 0
Pruritus 10 0 9 2 11 0
Rash 9 0 7 0 13 0
Diarrhea 3 0 11 0 15 0
Appetite decreased 3 0 13 0 4 0
Dry mouth 3 0 6 0 11 0
Dry skin 2 0 6 0 13 0
Hypersensitivity 2 0 2 0 17 0
Arthralgia 2 0 7 0 15 2 23

Overall survival
Based on data cutoff of March 5, 2014; Symbols represent censored observations. 24
Number of patients at risk
0.3 mg/kg 60 56 50 41 37 35 31 27 24 13 0 0
2 mg/kg 54 52 45 42 38 35 32 28 26 12 0 0
10 mg/kg 54 50 47 45 38 32 29 29 26 8 1 0
0
10
20
30
40
50
60
70
80
90
100
3 6 9 12 15 18 21 33 Time (months)
0
Overa
ll surv
ival (%
) 0.3 mg/kg (events: 36/60)
2 mg/kg (events: 29/54)
10 mg/kg (events: 32/54)
24 27 30
Median OS, months (80%
CI)
0.3 mg/kg 18.2 (16.2, 24.0)
2 mg/kg 25.5 (19.8, 28.8)
10 mg/kg 24.7 (15.3, 26.0)

25
Overall survival in phase III trials
and nivolumab phase II study AXIS1,a INTORSECT2 RECORD-13 GOLD4 Nivolumab study
Drug Axitinib;
sorafenib
Temsirolimus;
sorafenib Everolimus; placebo
Dovitinib;
sorafenib
Nivolumab;
0.3; 2; 10 mg/kg
Patients, n 389 512 416 570 168
Risk group, %b
Favorable
Not stated
19 29 20 33
Intermediate 69 56 58 42
Poor 12 14 22 25
Prior therapy Sunitinib Sunitinib VEGF VEGF + mTOR VEGF ± mTOR
Line of therapy 2nd 2nd 2nd or higher 3rd or higher 2nd to 4th
Median OS, months 15.2; 16.5 12.3; 16.6 14.8; 14.4 11.1; 11.0 18.2; 25.5; 24.7
CI 12.8, 18.3c
13.7, 19.2c
10.1,14.8c
13.6, 18.7c Not stated 9.5, 13.4c
8.6, 13.5c
16.2, 24.0d
19.8, 28.8d
15.3, 26.0d
aPost TKI subset; bTotal 100% due to rounding; c95% CI; d80% CI.
1. Motzer R, et al. Lancet Oncol. 2013;14:552-62; 2. Hutson TE, et al. J Clin Oncol. 2014;32:760-7; 3. Motzer R, et al. Cancer. 2010;116:4256-65;
4. Motzer R, et al. Lancet Oncol. 2014;15:286-96.

Phase III Study of Nivolumab vs Everolimus
in Pts With mRCC A randomized, open-label phase III trial
Primary endpoint: OS
Secondary endpoints: PFS, ORR, DoR, OS in PD-L1 subgroup, safety
Advanced or
metastatic clear-cell
RCC after previous
antiangiogenic tx;
≤ 3 previous tx and
progression ≤ 6 mos
prior to enrollment;
Karnofsky PS ≥ 70
Nivolumab 3 mg/kg IV
every 2 wks
Everolimus 10 mg/day PO
Treat until:
Progression
Unacceptable toxicity
Withdrawal of consent
ClinicalTrials.gov NCT01668784.

Motzer RJ et al. N Engl J Med 2015. DOI: 10.1056/NEJMoa1510665
Kaplan–Meier Curve for Overall Survival

Motzer RJ et al. N Engl J Med 2015. DOI: 10.1056/NEJMoa1510665
Overall Survival in Subgroup Analyses and Kaplan–Meier Curve for Progression-free Survival.
RR favored
Nivo
25% vs 5%
Slide 7
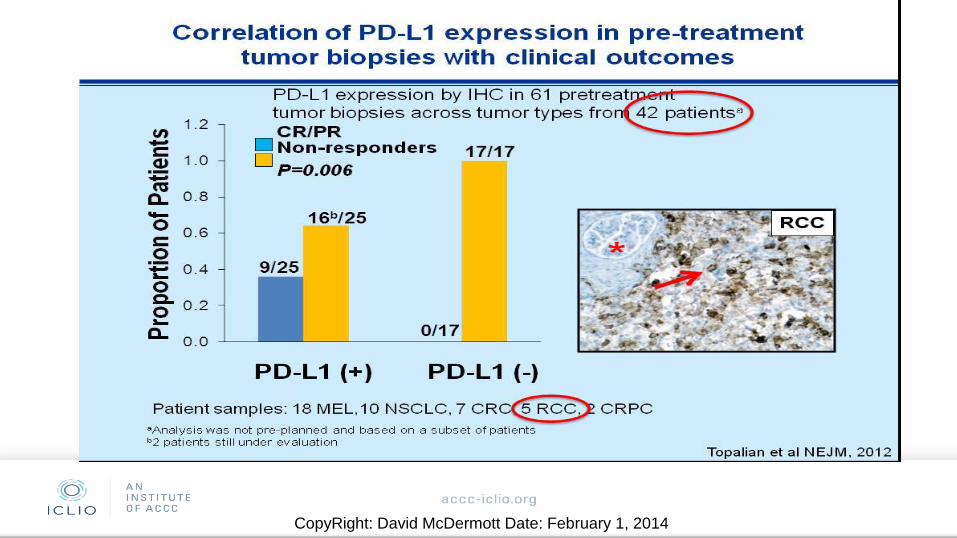
CopyRight: David McDermott Date: February 1, 2014
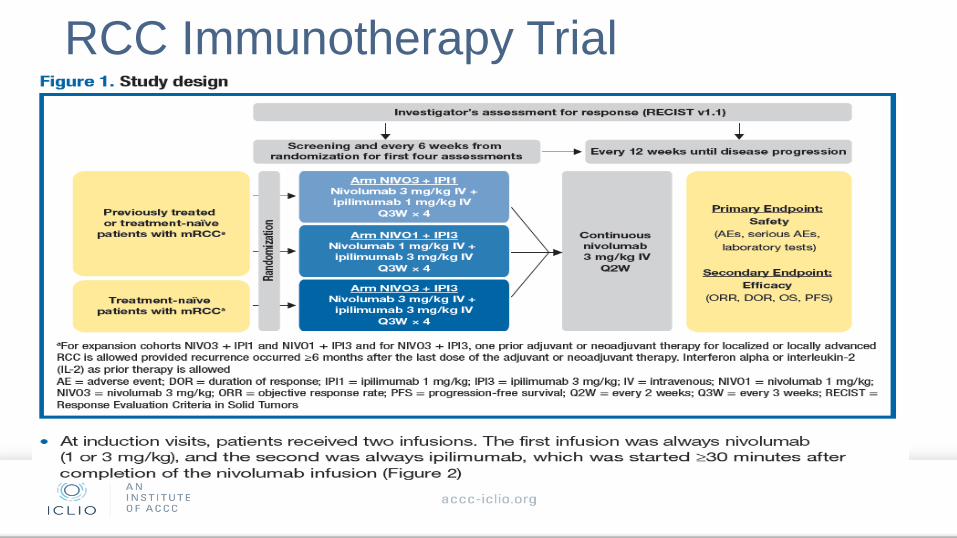
RCC Immunotherapy Trial

Ipilimumab/Nivolumab in RCC Efficacy

Duration of Responses

Toxicity of Ipi/Nivo Rx in RCC

Conclusions of Immunotherapy Approaches to
mRCC
• High Dose Interleukin-2 offers for pts with clear cell mRCC high
objective response rates and opportunities for durable remissions
• Single agent anti PD-1 therapy shows activity in relapsed setting
with improved median OS compared to historical controls-
randomized trial completed and reported positive in press release
• Combination CTLA-4 inhibition and anti PD-1 inhibition associated
with impressive response rates, with significant 60% ongoing
responses
• Toxicity appears consistent with prior reports of these
combinations
• Phase III trial of combination vs sunitinib underway

Audience
Questions