Embed Size (px)
Citation preview

A-Z
� �� � �� �� �� �� � ������ �
1. Highlights2. Our Strategy4. Sites and Acquisitions6. Our Products and Target Markets8. Chairman’s Statement10. Managing Director’s Review14. Financial Review16. Board of Directors’18. Senior Management and Advisers19. Directors’ Report22. Corporate Governance Report
25. Directors’ Responsibilities in Preparation of Financial Statements26. Independent Auditor’s Report to the Members of Immunodiagnostic Systems Holdings plc27. Consolidated Balance Sheet28. Consolidated Income Statement29. Consolidated Cash Flow Statement30. Consolidated Statement of Changes in Equity31. Notes to Consolidated Financial Statements63. Company Balance Sheet64. Notes to the Company Financial Statements72. GlossaryIBC. Shareholder Information
Immunodiagnostic Systems Holdings plc is a dynamic SME, dedicated to the developmentand provision of innovative assays for use in clinical and research laboratories worldwide.
The Company is focused on creating and sustaining its position as a leading specialist in in vitro diagnostics, building an enviable capability in de novo product design, development, manufacture and global marketing.
From its establishment in 1977 simply as a distributor of diagnostic products, IDS has become a fully integrated diagnostics company developing specialist analytical tools from concept to market-leading products.
With direct sales and marketing presence in the UK, USA, Germany, France, Belgium and Scandinavia, and an additional research and development resource in Finland, the Company is now acknowledged as being a global force in specialist immunoassays.
DIRECTORS
Mr D E Evans Non-Executive ChairmanDr R T Duggan Managing DirectorMr P Hailes Finance DirectorMr A Wilks Sales & Marketing DirectorDr M Garrity Technical DirectorMr C I Cookson Operations DirectorMr A Rousseau Engineering DirectorMr W M Dracup Non-Executive DirectorDr E D Blair Non-Executive Director
SECRETARY
Mr P Hailes
REGISTERED OFFICE
10 Didcot WayBoldon Business ParkBoldonTyne & WearNE35 9PD
AUDITORS
Baker Tilly UK Audit LLPRegistered AuditorChartered Accountants1 St James’ GateNewcastle upon TyneNE1 4AD
REGISTRARS
Computershare Investor Services plcCorporate Actions PO Box 859The PavilionsBridgwater RoadBristolBS99 1XZ
BANKERS
Barclays Bank plcPO Box 37871 Grey StreetNewcastle Upon TyneNE99 7JP
NOMINATED ADVISORS AND BROKER
Oriel Securities Limited125 Wood StreetLondonEC2V 7AN
SOLICITORS
Watson Burton LLP1 St James’ GateNewcastle upon TyneNE99 1YQ
Shepherd + Wedderburn155 St Vincent StreetGlasgowG2 5NR
Ward HadawaySandgate House102 QuaysideNewcastle upon TyneNE1 3DX

Turnover up 88.1% to £18.66m (2007: £9.92m). >
Organic revenue up 17.7% to £11.68m (2007: £9.92m). >
Gross profit up 75.8% to £11.43m (2007: £6.50m). >
EBITDA up 113% to £5.28m (2007: £2.48m). >
Pre-tax profit up 73% to £3.79m (2007: £2.19m). >
Diluted earnings per share up 23.1% to 13.49p (2007: 10.96p). >
Two acquisitions made during the year. >
The appointments of Alain Rousseau as Engineering Director >and Ian Cookson as Operations Director.
� � �� � � � �� � � � � � � �
Turnover £000 (to 31 March)
20082007200620052004 2003 2002 2001
8,1335,435
4,4533,875
3,4012,815
9,92218,660

� � � � �� � �
� � � � ��� �
� �� �
Future strategy in detailThe Group continues to develop its strategy based upon increasing the range and novelty of new products to be introduced, whilst enhancing the ability to reach an expanding international research and clinical market by the further development of the IDS Sales and Marketing organisation. The three-pronged strategy is still:
to embrace growth by the acquisition of products and/or companies;to accelerate New Product Development; andto drive geographic market growth, increasing direct sales and those achieved through our distributor network.
The directors believe that each of these individual stratagems has the potential to grow the Company and generate revenues, and that collectively they will add significant shareholder value. Going forward, we expect to see an increase in both revenues and profitability from automation of our manual assays on the 3X3 instrument.
Strategic progress in the last yearThe last 12 months have seen two successful acquisitions and two new additional executive directors added to our main board of directors.
Our explicit strategy of niche identification and exploitation has been very successful, and resulted in IDS’ recognition as a world-leader in its chosen areas of focus, primarily Bone & Skeletal biomarkers.
In July 2007 we acquired Nordic Bioscience Diagnostics (NBD) and added eight highly complementary products, including CTX-I and CTX-II with strong IP, to our product range, extending our reach into the field of cartilage biomarkers. This opens a still further niche in our chosen area of expertise, and one that is capable of very significant growth. Our belief is that the use of biomarkers in cartilage is at the stage of bone biomarkers some 10-15 years ago. With enhanced understanding of disorders of cartilage metabolism, and the underlying causes of rheumatoid – and osteo-arthritis, pharma companies are investing heavily in potential therapeutic agents, with a concomitant increase in the need to measure formation and degradation markers.
In September we acquired Biocode Hycel (BCH) which delivered to us our own enabling technology, the instrument known as the 3X3, to fully automate our manual products. This also provided the wherewithal to invite other companies to join ‘The 3X3 Alliance’, to automate their products on this platform on terms attractive to both parties.
A-Z

A-Z
We will further develop the Alliance to provide rapid growth of product menu for the 3X3, and more products for our subsidiaries and distributors to sell worldwide.
Coincident with this acquisition, we appointed Mr. Alain Rousseau, inventor of the 3X3, as our Engineering Director, who will apply his creative skills to additional versions of the 3X3 designed to meet the needs of the biggest and highest throughput laboratories, in the USA and elsewhere.
This was closely followed by the appointment of Mr. Ian Cookson as our Operations Director, joining us from Axis-Shield plc. Given the increase in size and complexity of the IDS Group as a result of acquisitions, his appointment brought fresh skills and experience to IDS.
Both these appointments significantly strengthen our abilities to successfully implement our forward strategy growth programme.
AutomationWith our acquisitions behind us we look forward to entering into the fully-automated ‘Closed System’ specialist immunoassay market with our leading products. A Closed System ensures that end-users must use reagent sets that are instrument specific, produced only by IDS (or another member of the 3X3 Alliance), which provides for more consistent results between laboratories and generates stronger customer loyalty.
Advances in genomics and proteomics have accelerated the discovery of a wealth of new diagnostic biomarkers. Development of immunoassays for such novel biomarkers has the potential to change the dynamics of the industry, with the launch of more specific, higher sensitivity immunoassays capable of improved differential diagnosis.
With fully-automated instrumentation, we will also be able to compete more effectively for the larger accounts in reference laboratories and Clinical Research Organisations (CROs) in parallel with growing existing revenues from small to mid sized laboratories for our manual assays.
A-Z

A-Z
Our global presenceIDS has continued the strategy laid out in previous reports and this has seen new direct sales operations in Denmark (to service the Nordic region) and Belgium.
Our Nordic office covers the Scandinavian region, an area of interest due to the high incidence of bone and cartilage related disease and research.
The Belgian operation was gained with the acquisition of Biocode Hycel. A European manufacturing facility allows IDS to produce all of our automated reagents on mainland Europe and is an invaluable central distribution hub for rapid penetration into our key European markets. The site also manufactures several key immunoassays and exports them worldwide through their established distribution network.
The Group exists in a competitive environment and a changing technological landscape and it will continue to defend its position with improved versions of its existing products as well as developing its flagship products on automated instruments.
Pouilly
Arizona
Rennes
SBAMassy
Boldon
Nordic
Liège
Frankfurt
Paris

A-Z
� � � � � ��
� �� � � �
� � � � � ��
� � � � � �� � � �� �� �
� � � � � ��
� �
� � �� � � �
� � � � � ��
� � � � � ��
� � �
� � � � � ��
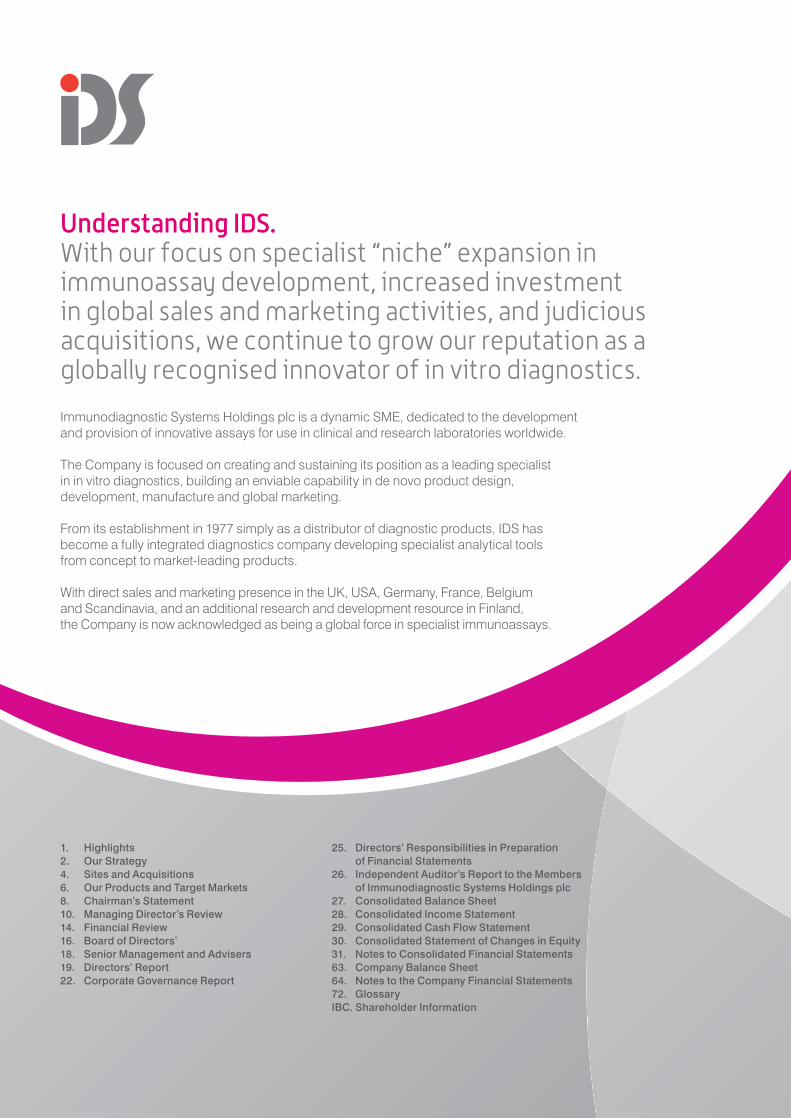
Our productsThe Company continues to be recognised for its range of bone and growth-related products, and is uniquely placed to exploit its enlarged panel of specialist products, and benefit from the increasing demand to study the fundamental mechanisms of growth and bone disorders, and to monitor response to therapy.
The flagship products of the Company continue to be kits for the determination of Vitamin D in human serum, an important marker in the control and disposition of the body’s calcium reserves. Calcium is vital in the development of healthy bones and teeth in the young, in the retention of calcium in the institutionalised, the elderly, and those with inadequate exposure to sunlight. Vitamin D, the ‘sunshine vitamin’ formed in the skin in response to ultra-violet light, is essential in calcium regulation. Fortunately, the market demand for Vitamin D testing is growing at an unprecedented rate, with 57% increase in France last year (SFRL statistics).
Market analysisIDS operates in the Immunoassay segment of the in vitro diagnostics (IVD) market. In 2007, the global IVD market was valued at approximately $42bn (with Immunoassay worth approximately $10bn). The market is expected to grow 6% annually in the next 5 years to reach more than $56 billion by 2012.
This forecast of significant growth for the industry is due in part to the projected rise in the 45 to 75 year-old population of many countries. Emerging markets will experience 10%–20% annual growth in IVD sales, compared with 3%–6% for the rest of the world.
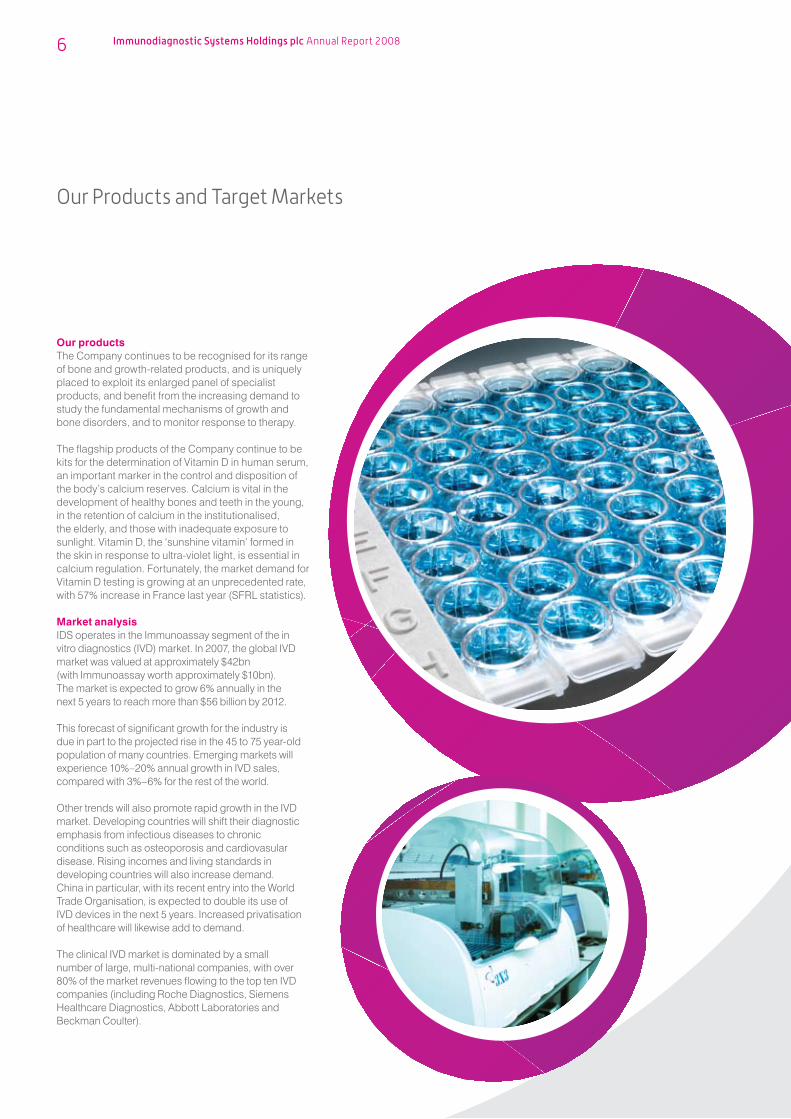
Other trends will also promote rapid growth in the IVD market. Developing countries will shift their diagnostic emphasis from infectious diseases to chronic conditions such as osteoporosis and cardiovasular disease. Rising incomes and living standards in developing countries will also increase demand. China in particular, with its recent entry into the World Trade Organisation, is expected to double its use of IVD devices in the next 5 years. Increased privatisation of healthcare will likewise add to demand.
The clinical IVD market is dominated by a small number of large, multi-national companies, with over 80% of the market revenues flowing to the top ten IVD companies (including Roche Diagnostics, Siemens Healthcare Diagnostics, Abbott Laboratories and Beckman Coulter).
A-Z
A-Z

A-Z
A-Z
� � �� ��� � � �� � ��� ���� � �
With our unique product offering, IDS will be in an excellent position to take a predominant market position in the important area of diagnosing and monitoring therapy in patients with osteoporosis and other bone diseases.
Geographical regionsNorth America (excluding Mexico), continues to be the largest geographic region by market value at 44%, followed by the European Union, which is 33%, Japan with 15% (a disproportionably high market share due to high levels of government healthcare expenditure) and then the ROW with 8%.
Market segmentationThe clinical IVD market is a high volume but low margin commodity priced market, with the large players selling fully automated, push button systems delivering results very similar to those of their competitors, addressing more of the higher volume ‘routine’ tests. These major players do not have complete test menus in the more “niche” or speciality market, where tests can command a higher price due to their complexity and the innovation required to develop the assays. These niche analytes are currently enjoying significant growth as more clinical applications are discovered for them.
In addition to the mainstream clinical IVD market, there is a substantial Research Use Only (RUO) market (worth approximately $2bn), comprising those laboratories working in drug discovery, clinical trials and academic research. The RUO market is essentially unregulated compared with the clinical IVD market (regulated in individual geographic territories by the FDA in the US, MHW in Japan, and IVDD in Europe). This makes RUO assay development considerably quicker and less onerous, with the key criteria for the launch of a successful assay being the customers’ view of the quality of the assay. This also results in the market being less price sensitive, making the RUO assay market low volume/high margin.
The RUO market is also considerably more fragmented, made up of a large number of players with different areas of strength. Companies selling Immunoassays into the RUO market have the potential to expand the market for their tests where clinical applicability can be demonstrated and regulatory approval gained. Where appropriate these assays can then be automated and used in clinical environments to optimise market penetration.
Dear Shareholder:I have pleasure in reporting on a further year of progress at Immunodiagnostic Systems.
This year has seen a stepped change in the development of the Group through the two major acquisitions of Nordic Bioscience Diagnostics (NBD) and Biocode Hycel (BCH) for £18.8m and £19.4m respectively and this is reflected in the results below.
ResultsTurnover has increased by 88.1% from £9.922m in 2007 to £18.660m in 2008 with the acquisitions of NBD and BCH accounting for £6.982m representing 79.9% of the overall increase.
Gross profit has increased from £6.502m in 2007 to £11.431m in 2008, an increase of 75.8%. Overall gross margin percentages have declined from 65.5% to 61.3% reflecting the impact of the lower margin products within the BCH portfolio – on a like for like basis within the core IDS business margin percentages increased from 65.5% to 67.1%.
Overall profits from operations increased by 93.3% from £2.214m to £4.280m with the acquisitions contributing £1.145m of that increase.
The Groups’ finance costs have increased from £39k to £614k primarily as a result of the debt finance taken on to facilitate the acquisition of NBD.
The Groups’ tax charge is £954k compared to £596k in the previous year. The overall percentage reduction is due to tax credits and utilisation of tax losses brought forward by some foreign subsidiaries.
Profit after tax increased by £1.239m, from £1.598m in 2007 to £2.837m: an increase of 77.5%.
Earnings per share have increased from 11.98p to 14.35p on an undiluted basis and from 10.96p to 13.49p on a fully diluted basis.
Additionally, the directors are pleased to announce that a dividend of 1.5p (2007: 1.25p) will be payable to all shareholders in September.
The key financial results are set out in the table opposite.
The imperative for the Board is to ensure the successful launch of the 3X3. The progress of the 3X3 project both in technical and commercial terms continues to exceed my own personal expectations given the challenges that instrumentation development place on a previously analyte driven company.David EvansNon-Executive Chairman

In terms of the Groups’ balance sheet, I would like to highlight the following significant movements:
Goodwill arising on the acquisition of NBD and BCH of £16.7m. The creation of Intangible assets arising on the acquisition of NBD and BCH of £21.9m as well as the capitalisation of development costs of the 3X3 in the year on the 3X3 of £2.3m as a result of adherence to IFRS. During the year the Group entered into a loan arrangement with Barclays plc to help fund the Nordic acquisition. This loan amounted to !14.9m and !14.1m was outstanding at the year end. Cash and cash equivalents at the year end amounted to £3.0m.
Strategic directionThe imperative for the Board is to ensure the successful launch of the 3X3. The progress of the 3X3 project both in technical and commercial terms continues to exceed my own personal expectations given the challenges that instrumentation development place on a previously analyte driven company. The reason that we have made such progress is down to the combined experience of the Groups’ personnel across all its Divisions.
Moving forward, the key drivers of our future growth are based on:
Having the most comprehensive panel of bone and growth markers supported where possible by IP rights that will imbue our offering with true uniqueness and give us significant competitive advantage.Not only adding our own analytes to the 3X3 menu but looking externally either through in-licensing or by acquisition for analytes that will enhance the strategic value of our offering. Seeking additional companies to partner with for the addition of their tests to the 3X3 menu. We already have both Technogenetics and Hyphen-Biomed covering the areas of Autoimmune, Infectious Disease and Coagulation and discussions continue with other potential ‘3X3 Alliance’ partners. Continuing to expand our direct selling capability. The current year saw expansion of our direct selling to the Nordic region and Austria as well as strengthening our capability in France. Other territories will be added in due course.
ManagementI am pleased to announce the appointment of Ian Cookson as Chief Operating Officer of the Group. Ian re-joined IDS as Operations Director in November 2007 after a thirteen year sojourn north of Hadrian’s Wall with Axis-Shield. The step-up to Chief Operating Officer reflects both Ian’s capabilities and the necessity to fill that position due to the increased complexity of our business as it has grown and will continue to grow.
During the year the Board was also strengthened with the appointment of Alain Rousseau as Engineering Director: his skills and experience have proved invaluable in the progress of the 3X3.
Additionally at management level we have appointedDr. Dagmar Kasper as Country Manager for the Nordic territory.
OutlookThe trading in the current year is in line with management expectations and our core business continues to prosper due to the growing recognition of Vitamin D as a valuable marker of well-being.
The key challenge for the Group this year will be the 3X3 launch and I am satisfied that the hurdles in front of us as we move to the point of launch are what one would determine as normal. I am confident that our first routine sales of 3X3 to end customers will be achieved by the end of this calendar year.
As well as reporting on the progress of the 3X3 I look forward to updating you on:
The divestment of our haematology division which has attracted interest from a number of different parties. Additional partnerships for the 3X3. Additions to our existing range of analytes either through in-licensing or by acquisition. Further expansion of our direct sales network.
Finally, the achievements over the past year would not have been possible had we not had both your support as a shareholder and the continued dedication of all employees within the enlarged Group, and I would like to formally record my gratitude for that support.
David EvansNon-Executive Chairman23 July 2008
Continuing Acquired Total 2008 Total 2007 Change £000 £000 £000 £000 %
Revenue 11,678 6,982 18,660 9,922 88.1Gross profit 7,831 3,600 11,431 6,502 75.8Profit from operations 3,135 1,145 4,280 2,214 93.3Profit before tax 2,657 1,134 3,791 2,194 72.8Profit after tax 1,988 849 2,837 1,598 77.5EPS 14.35p 11.98p 19.8Diluted EPS 13.49p 10.96p 23.1
The Financial Year 2007/8 was an extraordinary period for IDS, and will undoubtedly go down as a seminal year in the history of the IDS Group. The broad three-pronged strategy that I have depicted in my previous two Managing Director’s Reviews has stood us in good stead, namely:
To drive geographic sales growth, using our direct sales and marketing power;To accelerate New Product Development, organically and/or via licensing; and To embrace growth through acquisition of products or businesses.
We have progressed beyond our own expectations in pursuit of “The Strategy”, with highly satisfactory organic growth enhanced by two judicious acquisitions, one delivering enabling technology in the form of instrumentation. We are now well-positioned for a period of still more accelerated growth, and to this end are strengthening the Senior Team as we consolidate the enlarged IDS Group.
We started the year in high spirits, having obtained (in December 2006) an exclusive licence to put our well-established range of specialist assays on a fully-automated immunoanalyser designed and developed by the Franco-Belgian company, Biocode Hycel. Our history to date, and our £10 million sales last year, has been based upon manual products intended for use by skilled technicians at the laboratory bench. The prospect of automating our best-selling products such as Vitamin D is extremely attractive, paving the way to gaining higher echelon accounts in the largest hospitals, reference laboratories and clinical research organisations worldwide.
As a result, Dr Martha Garrity, IDS’ Technical Director, has made the major focus of an enlarged IDS product development group the creation of automated formats of our bone and skeletal markers, recruiting additional scientists, installing machines and delivering training for speediest product conversion. Her extensive background in assay development for more than a decade at Nichols Institute Diagnostics, using identical technology, makes her ideally suited to this task.
Just months into the new financial year, we were engaged in intense acquisition activities directed towards Nordic Bioscience Diagnostics (NBD) of Copenhagen, Denmark. NBD was a highly profitable company (an EBIT of £2.2 million on sales of £4.2 million) with strong IPR supporting a unique range of bone and cartilage biomarkers such as CTX-I and CTX-II. With the successful conclusion of this transaction, IDS gained eight highly complementary products to enhance our existing product range, with a further two products in the pipeline, and forward provision for participation in new biomarker discovery in collaboration with the vendor, Nordic Bioscience A/S. It also created the opportunity to establish a further subsidiary, IDS Nordic, and we were fortunate to entice Dr Dagmar Kasper, a PhD bone biologist and experienced marketer of diagnostic products, to take the position of Country Manager. Manufacture of the existing products has been transferred to the more automated production facilities at IDS Boldon, with significant cost reduction.
As this deal came to fruition, we were immersed in a competitive bid situation for Biocode Hycel (BCH), which had been put up for sale by its shareholders. Such is the importance we attach to the 3X3 automation strategy, we determined that success in this acquisition was a key objective. After several rounds of bidding, IDS emerged victorious, and we found ourselves to be a company of somewhat greater complexity, but with much-enhanced opportunities and resources. Alain Rousseau, creator of the 3X3, joined the main IDS board as Engineering Director, bringing many years of experience in in vitro diagnostics (IVD) automation to IDS. With ownership of the 3X3 instrument, IDS became head of what we now term “The 3X3 Alliance”, whereby selected, non-competing companies with their own specialisms within the immunoassay or IVD industry all develop products for use on the 3X3. This parallel development of products greatly accelerates “menu development”, important in the placement of capital equipment, and all such products will be marketed globally by IDS.
The 3X3 represents an enabling technology, as a remarkably flexible instrument capable of performing not only fully-automated immunoassays, but also able to deliver clinical biochemistry and coagulation (haemostasis) testing. This makes the instrument suitable not only for the specialist high-throughput

laboratory, but also for the small to medium sized laboratory wanting to perform testing “in-house” rather than incur the expense and inconvenience of sending samples out to a service laboratory. A further development of the instrument currently under way in Pouilly will address the requirement for higher throughput for the larger reference laboratory and pharma markets.
With the BCH acquisition came more than 100 employees and facilities in Paris, Pouilly and Rennes in France, and Liège in Belgium, and we are progressing integration and consolidation of the expanded IDS Group as a whole. The acquisition also brought us a running line of more than !10 million in sales, primarily in the fields of biochemistry and haematology. Whilst this has favourably boosted our revenues during the period, we have determined that haematology is not a core interest of IDS in the future, and we have accordingly put this sector up for sale as a stand-alone, coherent business unit based in Rennes. As this goes to press, we are in discussion with a number of interested parties.
Throughout this period of unprecedented activity, IDS continued to meet the needs of its customers and distributors throughout the world. Whilst we are reporting here an 88% increase in turnover for the year, which includes some contribution from the NBD and BCH acquisitions, we saw a healthy organic growth of ca 18% in sales of our existing market-leading products. IDS UK and each of our subsidiaries, IDS Inc (Fountain Hills, Phoenix, AZ, USA), IDS GmbH (Frankfurt, Germany) and IDS EURL (Paris, France) have experienced record sales, with buoyant market conditions led by a continued growth in demand for bone biomarkers in general and Vitamin D testing in particular. The European Diagnostics Manufacturers Association recently reported a 57% growth in Vitamin D testing in France to the year ended 31st March, 2008. IDS Vitamin D sales in France in the same period rose by 114% – and this with our existing manual product. We believe that the launch in Q4 of 2008 of an automated version of our market-leading Vitamin D test on the 3X3 will grow market share still more strongly in 2009.
We have progressed beyond our own expectations in pursuit of “The Strategy”, with highly satisfactory organic growth enhanced by two judicious acquisitions, one delivering enabling technology in the form of instrumentation. We are now well-positioned for a period of still more accelerated growth, and to this end are strengthening the Senior Team as we consolidate the enlarged IDS Group. Roger DugganManaging Director

A-Z
Geographically, the major IVD markets are in the USA (approximately 40% share), western Europe (30%) and Japan (15%). In every case, these markets are highly automated, and the advent of our proven specialist products in a bespoke automated format bodes well for increased competitiveness and future sales in these major markets. Tony Wilks, Sales and Marketing Director, placed several hundred automated immunoanalysers in Europe whilst head of the European division of his (then) US parent company, Nichols Institute Diagnostics, and this gives us great confidence in our ability to succeed with automated forms of prestigious products such as Vitamin D, Bioactive PTH and CTX-I. Just now, approximately 75% of our sales are achieved in Europe. In three to five years time, having geared-up to meet the needs of, and exploit the opportunities afforded by, each major market, it is likely that this will be reversed. The friendly rivalry that exists between our subsidiaries in Germany, France and the USA will ensure that a hot contest ensues!
In November, we were joined by Ian Cookson, who took the newly-created post of Operations Director. Ian was the Managing Director with Axis-Shield Diagnostics, with full responsibility for the Dundee site with a turnover of ca £17 million and a staff of 120 people. He brings abundant skills very pertinent to the IDS of today, growing as we are in almost every dimension of business. Ian will take a still greater role in IDS going forward, as we re-structure the Senior Team. With effect from the 1st of August, I will take on the mantle of Chief Executive Officer, and be able to devote my time to working on, as opposed to in, the Company, with responsibilities for Group direction and leadership, business development, licensing and acquisitions. Ian will take the role of Chief Operating Officer, and will excel at dovetailing the manifold elements of the enlarged, international IDS Group, directing the key functions of the Company as we enter a particularly intense and important phase of accelerated growth.
IDS will continue to focus on the selected areas we consider to be specialist niches capable of significant growth. Our concentration on bone and calcium metabolism for more than ten years has resulted in a position of strength in a highly competitive industry, with relatively little competition and with high margin products. The aging population, the growing socio-economic cost of osteoporosis and other skeletal disorders such as osteoarthritis and rheumatoid arthritis, and the increasing availability of effective (but costly) treatments all contribute to above-average market growth for IDS’ enhanced range of products.
With the acquisition of NBD, we enter fully into the realm of cartilage biology, an area with hitherto few convincing biomarkers available for the researcher and diagnostician. We believe that, in this respect, cartilage biology is in a similar state to that of bone biology a decade ago, and is therefore set for considerable growth. IDS intends to be at the forefront of this growth.
IDS continues to embrace change, an absolute necessity in a dynamic industry experiencing not only the ongoing technological revolution that is modern medicine, but also the commercial athleticism required to survive and thrive. You will see for the first time, within this Annual Report, the launch of a new corporate image for the IDS Group, introduced to reflect our commitment to change and the desire to embrace the more recent members of the IDS fold. We are, collectively, in excellent shape to meet the demands of the marketplace, and will pursue the same overall strategy of the last two years, but with larger weapons and more ammunition. I have little doubt that this time next year I will be regaling you with further accounts of opportunities identified, grasped, and converted to increased shareholder value.
Roger Duggan, PhDManaging Director23 July 2008
Financial highlightsA successful year for the Company with impressive growth in both sales and profitability.
TurnoverTurnover increased by 88% to £18,660,000 (2007: £9,922,000). Direct sales into the USA and mainland Europe experienced significant growth helped by the two acquisitions made during 2007.
Gross marginOur gross margin decreased for the twelve-month period to 61.26% (gross profit £11,431,000) from 65.53% in 2007 (gross profit £6,502,000). This decrease reflects the impact of one of our acquisitions (Biocode Hycel) which as a business currently experiences a significantly lower gross profit percentage than the rest of the Group. However, as can be seen from our Chairman’s statement, our gross profit percentage from our continuing operations actually increased by 1.5% to 67.1%. This increase is due to a better product mix and the strengthening of the Euro during the second half of 2007.
Operating costs and profitsOur R&D expenditure for 2008 increased as expected, with the acquisitions of Nordic Bioscience and Biocode Hycel to £2,246,000, (up from £706,000 in 2007). However, the majority of this expenditure is focused on product development (rather than research) relating to developing IDS manual products to the 3X3 automated platform and as a group our accounting treatment of this expenditure is as per IFRS.
Distribution and administrative expenses increased by £2,734,000 to £7,150,000 compared to £4,416,000 in 2007. This increase was entirely expected as we grow the business both organically and by acquisition.
The charge for depreciation and amortisation of intangibles was £933,000 compared to £253,000 in 2007, a direct result of our two acquisitions.
EBITDAThe Group reports an increase in earnings before interest, tax, depreciation and amortisation (EBITDA) from £2,477,000 in 2007 to £5,279,000, an increase of 113%.
This report shows the Group has had a very good year with record sales and profitability. A major contributor to this success has been the increase in both the number of orders received and the number of active customers who purchase product. As we develop and introduce new products we expect this growth to continue.Paul HailesFinance Director

Turnover by product area
Year ending 31 March: 2008 2007 Change £000 £000 %
Vitamin D 6,897 5,358 28.72%Octeia 1,378 1,416 (2.68%)Gamma B 213 182 17.03%Other 467 290 61.03%
Total of IDS products 8,955 7,246 23.59%
Distribution of third party sales 2,723 2,676 1.76%
Nordic Bioscience 2,614Biocode Hycel 4,368
Total turnover 18,660 9,922 88.07%
Cash flowThe Companys’ continued improvement at generating cash has once again provided resource to help grow the business:
Net cash flow from operating activities was 846,000Net of investments and servicing finance (490,000)Taxation (677,000)Capital expenditure etc. (20,590,000)Dividend (202,000)Financing 25,129,000Effect of foreign exchange movements (2,002,000)
This has led to an increase in cash and cash equivalents of £2,014,000 and net cash at bank of £2,973,000 as at 31 March 2008.
Dividend policy and dividendThe Board is proposing a dividend for the year of 1.50p (2007: 1.25p); subject to the approval of shareholders in the Annual General Meeting, the dividend per share will be paid on the 19th of September 2008 to shareholders on the register at the close of business on the 22nd of August 2008.
Balance sheetThe Groups’ fixed assets at 31 March 2008 were £50,517,000 (2007: £2,532,000), which consisted of tangible assets of £3,066,000, intangible assets of £47,447,000 and investments of £4,000. The intangible assets principally relate to the patents and goodwill acquired on acquisitions.
Stocks have increased to £6,222,000 (2007: £915,000) and debtors have increased to £4,763,000 (2007: £2,108,000), while current liabilities have increased to £8,807,000 (2007: £2,014,000). Creditors due after one year have increased to £18,678,000 (2007: £71,000) as a result of a loan taken out to finance one of the acquisitions, contingent consideration in respect of an acquisition and an increase in deferred tax liabilities.
Financial instrumentsThis report shows the Group has had a very good year with record sales and profitability. A major contributor to this success has been the increase in both the number of orders received and the number of active customers who purchase product. As we develop and introduce new products we expect this growth to continue.
There are of course always risks associated with a business and as the in vitro diagnostic market develops there is the possibility that increasing competition from larger companies with greater financial and other resources than those directly available to the Group will appear. The directors are aware of this and are looking to work closely with these larger companies in an attempt to make them customers for the Groups’ products rather than direct competitors.
Our progress on our strategic objectives is monitored by the Board of Directors by reference to six key performance indicators applied on a Group-wide basis. The Groups’ performance for 2008 and 2007 is shown below:
Financial KPI 2008 2007 Variance
Annual increase in sales: 88% 22% 66%Number of net invoices issued 10,399 8,898 1,501Gross margin 61.26% 65.53% (4.27)%Profit after tax 15.20% 16.11% (0.91)%Basic earnings per share 14.346p 11.975p 2.371pDiluted earnings per share 13.489p 10.955p 2.534p
Paul HailesFinance Director23 July 2008

BOARD OF DIRECTORS
1.David Evans BCom, CA, MBA (aged 48)Non-Executive ChairmanDavid has considerable expertise within the diagnostic industry. As Financial Director, he was a key member of the team that floated Shield Diagnostics Group plc in 1993, and was the Chief Executive Officer responsible for the merger of Shield Diagnostics Group plc with Axis Biochemicals ASA of Norway in 1999 to create Axis-Shield plc. He is currently involved in a non-executive capacity with several other companies.
2.Roger Duggan PhD (aged 59)Managing DirectorRoger joined RIA (UK), the forerunner of IDS, in 1981. Within IDS, he has held the positions of Development Scientist, Laboratory Manager, and Scientific Director, becoming Managing Director following the management buy-out in 1996. Roger also sits on the boards of PeriNatal Diagnostics Limited, PalindromX Limited, Pyrronostics Limited, Briefvision Limited, Phabia Limited and IDS Inc.
3.Paul Hailes FCCA (aged 45)Finance DirectorPaul gained experience with Bowater plc and Courtaulds plc before joining IDS in February 1993. Paul is also a Director and/or Company Secretary in PeriNatal Diagnostics Limited, PalindromX Limited, Pyrronostics Limited, Briefvision Limited and Phabia Limited.
4.Antony “Tony” Wilks (aged 47)Sales and Marketing DirectorLiving for more than twenty years in Germany and with eighteen years experience in European sales and marketing of diagnostic products, Tony brings a wealth of experience in international sales to IDS. Tony joined IDS in February 2005, from Nichols Institute Diagnostics GmbH, a wholly-owned subsidiary of Quest Diagnostics, the US parent where he acted as Managing Director of European Operations. Tony had been with Nichols Institute since 1997. In 1990 Tony started Tosoh Medics GmbH in Germany and successfully established Tosoh as a major diagnostic company in immunoassay automation. Prior to this Tony was Product Manager for Oxford Medical Systems GmbH, responsible for cardiovascular system, marketing and distribution sales.
5.Martha Garrity (aged 47)Technical Director Martha joined IDS in February 2007, after eleven years in Research and Development at Nichols Institute Diagnostics as a Senior Scientist, Manager and Director. She was a key member of the team created to convert the established immunoassays of NID into fully-automated formats for the Nichols Advantage. At NID she contributed to the development and launch of automated specialty assays in the areas of of bone, growth, thyroid, and hypertension, and gained expertise in chemiluminescent labels and magnetic particles, which are the specific technologies to be employed by IDS in the automation of its unique range of bone and skeletal biomarkers.
6.Alain Rousseau (aged 57)Engineering DirectorAlain gained his experience in both the high-tech sensors and automotive industries before turning his skills to the in vitro diagnostics market. He has filed for over 30 patents in these areas over the course of his career. As Head of Instrumentation for the well-known Diagnostica Stago, he created and developed the production of the entire instrumentation product line. Alain joined Biocode Hycel in mid 2003 as CEO, to develop a new innovative and multidisciplinary platform which is now the 3X3 automated system. As part of the Biocode acquisition, Alain joins the IDS Board to drive automation manufacture and system design going forward.
A-ZA-ZA-ZA-ZA-ZA-Z
1.
4.2.
5.3.
6.

A-Z
7.Ian Cookson (aged 54)Operations DirectorIan brings more than twenty years of experience gained in senior appointments within the in vitro diagnostics (IVD) industry both in the UK and overseas and a skill set of particular relevance to the forward strategic plans of IDS. Ian joined IDS from Axis-Shield plc, where he was Managing Director of their Dundee-based Laboratory Division. As well as his general management skills he has been heavily involved in facilities design, quality and regulatory requirements, manufacturing scale-up and manufacturing transfer during recent years. His extensive experience of automated immunoassay systems will be particularly relevant to his position as Operations Director of IDS as the Company brings its own automated system to the market.
8.Edward “Eddie” Blair PhD, MBA (aged 48)Non-Executive DirectorFollowing a research career in virology at the MRC National Institute for Medical Research (Mill Hill, London) and the University of California (Irvine CA, US), Eddie spent fifteen years in the pharmaceutical industry and held the positions of Programme Leader in Virology then later Clinical Therapeutic Adviser to the Predictive Medicine Group at GlaxoWellcome, before becoming a director of clinical diagnostics at GlaxoSmithKline plc. He is currently a director of Integrated Medicines Limited.
9.William “Will” Dracup (aged 43)Non-Executive DirectorWill founded Nonlinear Dynamics Limited in 1989. An Economics graduate and software engineer, Will became interested in the analysis of protein separations after working for a life science imaging company, Joyce-Loebl Limited. Deciding that the available technology was inadequate, Will went on to develop software that has since become the industry standard in its field. Nonlinear Dynamics Limited grew throughout the 1990s, and Will has overseen the successful diversification of the company into the US and Asia Pacific markets, with the company’s product line growing into a wide range of application areas within life sciences.
A-ZA-Z
7.
8.
9.

A-ZA-ZA-ZA-Z
10.
11.
12.
13.
SENIOR MANAGEMENT
10.Kenneth Gibbs (aged 63)CEO and Managing Director – IDS IncKenneth is a senior executive with more than thirty years’ professional experience in pharmaceutical, in vitro diagnostic and medical device marketing, sales, reimbursement, business development, and management. He has US and international experience with large multi-national corporations as well as emerging technology and start-up entrepreneurial companies. From 1994 until joining IDS in January 2003, he was employed by Metra Biosystems Inc, and later retained as marketing consultant by Quidel Corporation, a major competitor to IDS in bone and skeletal diagnostics, following Quidel’s acquisition of Metra Biosystems Inc.
11.Rudolf Schemer (aged 47)Country Manager – GermanyDr Schemer gained his doctorate (PhD) from the University of Hohenheim (Stuttgart, Germany) in 1991, before joining Nichols Institute Diagnostics in a technical sales position. His ensuing progression to Sales and Marketing, then European Marketing Manager, before becoming Country Manager (Germany, UK, Ireland, The Netherlands, Austria and Switzerland) followed his success in placing over 150 fully automated specialty immunoassay systems, and in maintaining and growing these high-value accounts.
12.Ed Coombes BSc (aged 37)Country Manager – FranceEd graduated with a First in International Management Science and Modern Languages at the University of Bath in 1994. After a year with Price Waterhouse in Paris, he settled in France permanently in 1995 where he worked in new technology companies for a number of years. Ed was behind the creation of Netlink in 1998 and Oxford Biosystems France in 2002, both of which went on to become acquired by larger international corporations, and founded IDS EURL in October 2005.
13.Dagmar Kasper (aged 42)Country Manager – Northern EuropeDr Kasper attended Philipps University, Marburg, Germany, where she studied human biology and medicine, before undertaking her doctoral studies in Biochemistry at the Georg-August University, Göttingen, Germany. After four years of post-doctoral research at the Centre for Neurobiology at the University of Hamburg, she joined Nordic Bioscience Diagnostics in 2002 as International Product Manager, later adding a business development role to her remit. In 2004, she became Head of Sales and Marketing. With increasing demand from major pharmaceutical and biotech companies in the United States, she moved to the USA where she took over Nordic Bioscience Diagnostics Inc in Virginia. She then went on to spearhead the direct sales of NBD products within the North American market and to develop business and strategic alliances.
ADVISERS
AuditorsBaker Tilly UK Audit LLPRegistered AuditorChartered Accountants1 St James’ GateNewcastle upon TyneNE1 4AD
RegistrarsComputershare Investor Services plcCorporate Actions PO Box 859The PavilionsBridgwater RoadBristolBS99 1XZ
BankersBarclays Bank plcPO Box 37871 Grey StreetNewcastle Upon TyneNE99 7JP
Nominated Advisors and BrokerOriel Securities Limited125 Wood StreetLondonEC2V 7AN
SolicitorsWatson Burton LLP1 St James’ GateNewcastle upon TyneNE99 1YQ
Shepherd + Wedderburn155 St Vincent StreetGlasgowG2 5NR
Ward HadawaySandgate House102 QuaysideNewcastle upon TyneNE1 3DX
The directors submit their report and audited Financial Statements of the Company and of the Group for the year ended 31 March 2008.
Principal activitiesThe principal activity of the Group during the year under review was that of manufacturing and distributing medical diagnostic products. The Group is also actively involved in research and development projects.
Review of the business and future developmentsThese are dealt with in the Chairman’s Statement, the Financial Review and the Managing Directors Review.
Results and dividendThe Groups’ profit on ordinary activities after tax for the year is £2,837,000. The directors have recommended a dividend of 1.50p per ordinary share.
Research and developmentResearch and development projects continue to concentrate in areas of bone and growth and the Group has increased the number of employees working within this area.
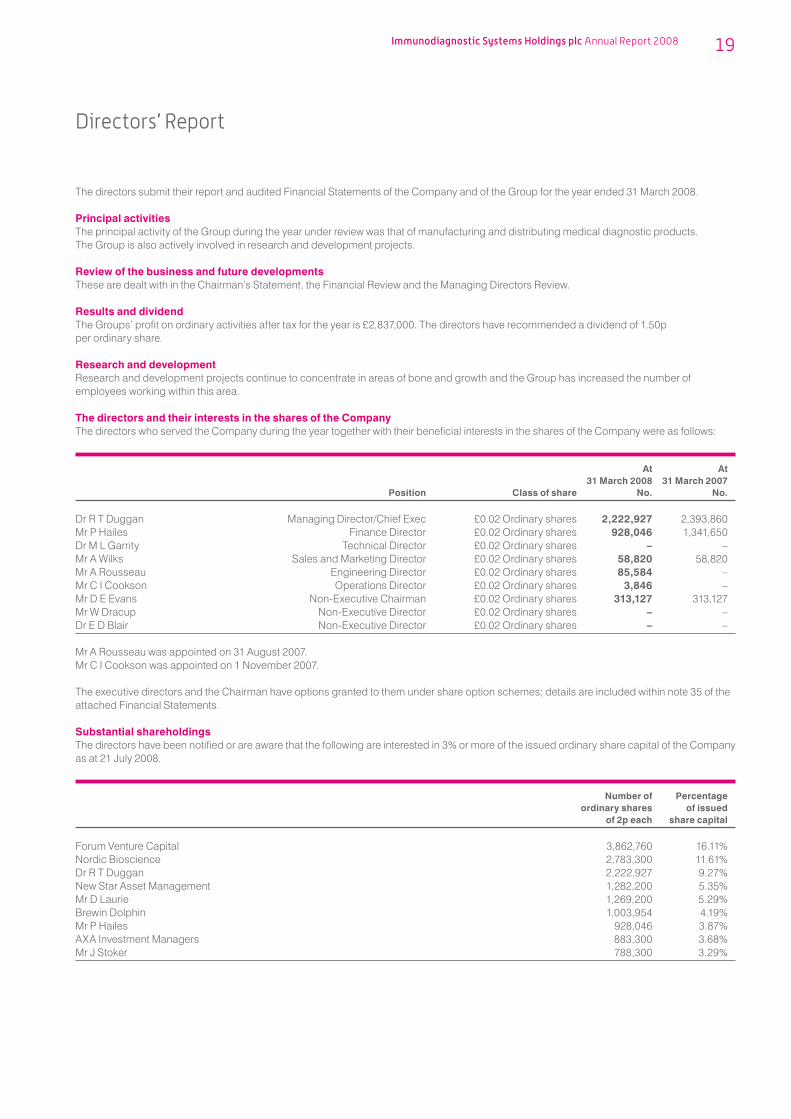
The directors and their interests in the shares of the CompanyThe directors who served the Company during the year together with their beneficial interests in the shares of the Company were as follows:
At At 31 March 2008 31 March 2007 Position Class of share No. No.
Dr R T Duggan Managing Director/Chief Exec £0.02 Ordinary shares 2,222,927 2,393,860Mr P Hailes Finance Director £0.02 Ordinary shares 928,046 1,341,650Dr M L Garrity Technical Director £0.02 Ordinary shares – –Mr A Wilks Sales and Marketing Director £0.02 Ordinary shares 58,820 58,820Mr A Rousseau Engineering Director £0.02 Ordinary shares 85,584 –Mr C I Cookson Operations Director £0.02 Ordinary shares 3,846 –Mr D E Evans Non-Executive Chairman £0.02 Ordinary shares 313,127 313,127Mr W Dracup Non-Executive Director £0.02 Ordinary shares – –Dr E D Blair Non-Executive Director £0.02 Ordinary shares – –
Mr A Rousseau was appointed on 31 August 2007.Mr C I Cookson was appointed on 1 November 2007.
The executive directors and the Chairman have options granted to them under share option schemes; details are included within note 35 of the attached Financial Statements.
Substantial shareholdingsThe directors have been notified or are aware that the following are interested in 3% or more of the issued ordinary share capital of the Company as at 21 July 2008.
Number of Percentage ordinary shares of issued of 2p each share capital
Forum Venture Capital 3,862,760 16.11%Nordic Bioscience 2,783,300 11.61%Dr R T Duggan 2,222,927 9.27%New Star Asset Management 1,282,200 5.35%Mr D Laurie 1,269,200 5.29%Brewin Dolphin 1,003,954 4.19%Mr P Hailes 928,046 3.87%AXA Investment Managers 883,300 3.68%Mr J Stoker 788,300 3.29%
Policy on the payment of creditorsIt is the Companys’ policy to ensure all creditors are paid in full within the agreed terms of business. Trade creditors of the Company at 31 March 2008 were equivalent to 53 days purchases, based on the average daily amount invoiced by suppliers to the Group during the year.
Disabled persons policyThe Company and the Group recognise and accept its responsibility to ensure that full and fair consideration is given to the employment of disabled persons. Where an individual’s abilities and aptitude are recognised as suitable, appropriate training will be arranged to develop the skills of the individual and further their career within the Company and the Group.
Employee involvementAn open forum within the Company and the Group is encouraged where staff may come forward with ideas, concerns and suggestions and where the Company and the Group can discuss matters concerning employees.
The Company has been credited with the Investors in People award.
Environmental policyOur environmental policy is summarised as follows:
The Groups’ main objective is to provide customers with products that meet their requirements with respect to fitness for use, reliability, delivery and value for money and ensuring that we comply with the pertinent regulatory standards associated with our industry. In particular:
The Group is committed to the development and sustainability of its business, whilst minimising any adverse impact on the environment caused by its operations.The Group will promote good practices to ensure that the organisation will comply with all regulatory and legislative requirements and at the same time look to continually improve on how we can reduce any adverse impact on the environment.The Group will continue to motivate staff to be environmentally aware.
The Group’s main operation is within the in vitro diagnostic (IVD) testing industry, supplying test kits to hospital and research laboratories. Most of our tests are carried out on blood or urine samples and are based upon immunoassays involving an antibody-antigen reaction and use antibodies and other well-established common reagents that can be readily acquired. Materials are sourced from the highest quality manufacturers and are handled according to their relevant instruction or legislation. All human biological and radioactive materials used at our premises are treated as hazardous waste which is collected and disposed of by specialist contractors.
We have a recognised Health and Safety Officer who undertakes regular audits of our compliance and chairs a health and safety committee which meets regularly throughout the year. We also produce products to the highest levels of Good Manufacturing Practice (GMP) as demanded by the FDA and European IVD Directive.
Impact of EuroThe Company recognises that to be competitive within the Euro-zone it must be able to offer for sale products priced in Euros as well as Sterling. Where possible the Company looks to off-set foreign currency liabilities.
Charitable contributionsContributions to charitable organisations amounted to £11,406 (2007: £8,905), and can be analysed as follows:
Gift of products to colleges and universities £10,553Other £853
Financial instrumentsAs sales through our subsidiary companies continue to positively impact on turnover, profitability and cash flow, we continue to monitor and manage our exposure to external pressures that may affect our performance by monitoring our customer and key supplier contracts as well as looking to off set any exchange risk through matching liabilities with corresponding assets. Pricing and credit issues do not appear to be a significant problem as the majority of sales income is generated through subsidiaries who deal directly with end users and are able to maintain very good relationships with respect to pricing and credit control. Note 36 gives information on foreign currency exposures.
Related party transactionsTransactions occurring with associated undertakings are detailed in note 27 of the Financial Statements.
Annual general meetingThe Companys’ Annual General Meeting will be held on Friday 29 August 2008 at 3:00pm at 10 Didcot Way, Boldon Business Park, Boldon, Tyne and Wear, NE35 9PD.

AuditorsA resolution to re-appoint Baker Tilly UK Audit LLP as auditors for the ensuing year will be proposed at the Annual General Meeting.
Statement as to disclosure of information to auditorsThe directors who were in office on the date of approval of these Financial Statements have confirmed, as far as they are aware, that there is no relevant audit information of which the auditors are unaware. Each of the directors has confirmed that they have taken all requisite steps to make themselves and their auditors aware of relevant audit information. This includes information which the directors are aware, but which the auditors have not specifically requested, or may indeed have no knowledge of.
By order of the Board
David EvansNon-Executive Chairman31 July 2008

The Combined Code is intended to promote the principles of openness, integrity and accountability. The Company fully supports these principles and although not required to do so, the directors have decided to provide Corporate Governance disclosures.
The Board formally adopted the principles of good governance set out in the Code. However, in view of the size and nature of the Group, the directors have taken into consideration the Guidance for Smaller Quoted Companies on the Code, produced by the Quoted Companies Alliance. The Companys’ governance policies already in place matched closely the position set out in the Combined Code.
Narrative statementDirectorsAs at the Groups’ year end 31 March 2008, the Board comprised of six executive, a non-executive Chairman and two other non-executive directors. Details of the current directors are set out on page 16. The composition of the Board is designed to provide an appropriate balance of executive, financial, technical and commercial experience and skills, and will be reviewed regularly. The Board looks to meet in a formal manner on a regular basis at the head office in Boldon, Tyne and Wear, with additional meetings held as required.
Summary of board meetings attended in the 12 months to 31 March 2008.
Eight board meetings were held in the year to 31 March 2008.
Meetings MeetingsDirector attended eligible Dr Roger Duggan 8 8Mr Paul Hailes 8 8Mr David Evans 8 8Mr Antony Wilks 8 8Dr Martha Garrity 8 8Mr Ian Cookson 4 4Mr Alain Rousseau 4 4Mr William Dracup 8 8Dr Eddie Blair 6 8
It is the responsibility of the Company Secretary to ensure that the directors receive all of the information necessary for the effective performance of their duties. In the furtherance of their duties, the directors have access to the advice and service of the Company Secretary and are permitted to take independent professional advice where necessary and to undertake any training considered appropriate, both at the Companys’ expense.
The Chairman, David Evans, does not meet the independence criteria required by paragraph A.3.1 of the Combined Code on appointment. The Chairman also has 10 other non-executive directorships, details of which are shown below. The Chairman is responsible for the running of the Board.
The executive directors are Paul Hailes, Antony Wilks, Martha Garrity, Ian Cookson, Alain Rousseau and Roger Duggan, who is also the Chief Executive. The Board considers William Dracup and Edward Blair to be independent.
The Board has overall responsibility for determining and directing the Groups’ corporate strategy. This is achieved through consideration and approval of the annual business plan and financial strategy and through the monitoring and discussion of financial results and corporate matters, including the exposure to key business risks and the results of individual trading subsidiaries, their annual budgets and financial strategy, at regular board meetings.
William Dracup has been identified as the senior independent director as required by the Code.

Chairman’s commitmentsThe Chairman has the following non-executive directorships:
Omega Diagnostics Group plc (succeeds Omega Diagnostics Limited) as of April 2007Quotient Diagnostics Limited Storyland Group plcMicrotest Matrices LimitedEpistem Holdings plc (succeeds Epistem Limited) as of April 2007Vinden Healthcare plcSecure Design KK Onyx Scientific LimitedDxS Genotyping LimitedScancell Limited – appointed November 2007
During the year the Chairman ceased to be a non-executive director of:
BBI Holdings plc – left office February 2008Chromogenex – left office April 2007Platform Diagnostics Limited – left office May 2007
All other non-executive directorships were held throughout the year.
Board committeesIn addition to the Audit Committee (see below) the following board committees were established in December 2004 under specific terms of reference:
1. The Remuneration CommitteeThe Remuneration Committee comprises William Dracup (Chairman), David Evans and Edward Blair. It reviews the performance of executive directors and sets the scale and structure of their remuneration and reviews the basis of their service agreements with due regard to the interests of shareholders. The Board itself determines the remuneration of the non-executive directors. The Remuneration Committee also makes recommendations to the directors concerning the allocation of share options to employees. No director is permitted to participate in discussions or decisions concerning his own remuneration. The details of directors’ remuneration are set out under note 5 and share options under note 35.
2. The Nominations CommitteeThe Nominations Committee comprises, David Evans (Chairman), William Dracup and Edward Blair. The Nomination Committee is responsible for reviewing the size, structure and composition of the Board, establishing appropriate succession plans for the executive directors and other senior executives in the Group and for the nomination of candidates to fill Board vacancies where required. The Committee will normally meet twice every year.
Relations with shareholdersThe Board recognises the importance of maintaining good communications with its shareholders. The Group engages a firm of financial PR consultants to provide another channel of communication to shareholders, potential investors and analysts.
Accountability and auditThe Board believes that the Annual Report and Accounts play an important part in presenting all shareholders with an assessment of the Groups’ position and prospects.
The Chairman’s statement contains a detailed consideration of the Groups’ position and prospects.

Internal controlsThe Board has designed the Groups’ systems of internal control in order to provide the directors with reasonable assurance that its assets are safeguarded, that transactions are authorised and properly recorded and that material errors and irregularities are either prevented or would be detected within a timely period. However, no system of internal control can eliminate the risk of failure to achieve business objectives or provide absolute assurance against misstatement or loss.
The Board has overall responsibility for the Groups’ systems of internal control and for reviewing its effectiveness. The Audit Committee which was established on flotation has been delegated responsibility for conducting this review.
The Groups’ systems of internal control include regular meetings of management to discuss operational, strategic and risk issues, designed to ensure that the possibility of misstatement is kept to a minimum.
The Board has not undertaken a formal review in the current period but shall endeavour do so in the next reporting period.
The system in place for financial reporting ensures the Board receives management accounts, forecast variance analysis and other ad hoc reports on a timely basis.
The Group has not implemented an internal audit function because the directors believe that the controls in place are appropriate for the size and complexity of the Groups’ activities.
There are no significant issues disclosed in the report and Financial Statements for the year ended 31 March 2008 and up to the date of approval of the report and Financial Statements that have required the Board to deal with any related material internal control issues.
Audit CommitteeThe Audit Committee is chaired by David Evans, a qualified chartered accountant, and the Board feels that this committee is independent, all members being non-executive directors. The Audit Committee is responsible for the relationship with the Groups’ external auditors and the review of the Groups’ financial reporting and the Groups’ internal controls.
The Committee also comprises William Dracup and Edward Blair, both independent non-executive directors. The Committee will normally meet four times a year and is responsible for monitoring the quality of internal control, ensuring that the financial performance of the Company is properly measured and reported on, meeting with the auditors and reviewing reports from the auditors. It meets with the auditors at least once a year.
The Audit Committee has undertaken an assessment of the auditor’s independence, including:a review of non-audit services provided to the Group and related fees; discussion with the auditors of a written report detailing all relationships with the Company and any other parties that could affect independence or the perception of independence; a review of the auditor’s own procedures for ensuring the independence of the audit firm and partners and staff involved in the audit, including regular rotation of the audit partner; and obtaining written confirmation from the auditors that in their professional judgement, they are independent.
An analysis of fees payable to the external audit firm in respect of both audit and non-audit services during the year is set out in note 3 to the Financial Statements.
The Company is satisfied that the external auditors remain independent in the discharge of their audit responsibilities.
Going concernThe Board has considered the applicability of the going concern basis in the preparation of these Financial Statements. This included the review of internal budgets and financial results. The directors have a reasonable expectation that the Company and the Group have adequate resources to continue in operation for the foreseeable future. For this reason they have adopted the going concern basis in the preparation of the Financial Statements.
Compliance statementThe Board has reviewed compliance with the Combined Code.
Throughout the year ended 31 March 2008 the Group has substantially complied with the provisions set out in Section 1 of the Combined Code.
By order of the Board
Paul HailesCompany Secretary23 July 2008

Directors’ responsibilitiesThe directors are responsible for preparing the Annual Report and the Financial Statements in accordance with applicable law and regulations. UK Company law requires the directors to prepare Group and Company Financial Statements for each financial year. Under that law the directors are required to prepare Group Financial Statements in accordance with International Financial Reporting Standards (‘IFRS’) as adopted by the EU and have elected to prepare the Company Financial Statements in accordance with United Kingdom Generally Accepted Accounting Practice (United Kingdom Accounting Standards and applicable law). The Group Financial Statements are required by law and IFRS adopted by the EU to present fairly the financial position and performance of the Group; the Companies Act 1985 provides in relation to such Financial Statements that references in the relevant part of that Act to Financial Statements giving a true and fair view are references to their achieving a fair presentation.
The Company Financial Statements are required by law to give a true and fair view of the state of affairs of the Company. In preparing each of the Group and Company Financial Statements, the directors are required to:a. select suitable accounting policies and then apply them consistently;b. make judgements and estimates that are reasonable and prudent;c. for the Group Financial Statements, state whether they have been prepared in accordance with IFRSs adopted by the EU; and for the
Company Financial Statements state whether applicable UK accounting standards have been followed, subject to any material departures disclosed and explained in the Company Financial Statements;
d. prepare the Financial Statements on the going concern basis unless it is inappropriate to presume that the Group and the Company will continue in business.
The directors are responsible for keeping proper accounting records which disclose with reasonable accuracy at any time the financial position of the Company and to enable them to ensure that the Financial Statements comply with the requirements of the Companies Act 1985. They are also responsible for safeguarding the assets of the Group and hence for taking reasonable steps for the prevention and detection of fraud and other irregularities. The directors are responsible for the maintenance and integrity of the corporate and financial information included on the Companys’ website. Legislation in the United Kingdom governing the preparation and dissemination of Financial Statements may differ from legislation in other jurisdictions.

We have audited the Group and Parent Company Financial Statements which comprise the Consolidated Income Statement, the Consolidated and Company Balance Sheets, the Consolidated Cash Flow Statement, the Consolidated Statement of Changes in Shareholders’ Equity and the related notes.
This report is made solely to the Companys’ members, as a body, in accordance with section 235 of the Companies Act 1985. Our audit work has been undertaken so that we might state to the Companys’ members those matters we are required to state to them in an auditor’s report and for no other purpose. To the fullest extent permitted by law, we do not accept or assume responsibility to anyone other than the Company and the Companys’ members as a body, for our audit work, for this report, or for the opinions we have formed.
Respective responsibilities of directors and auditorsThe directors’ responsibilities for preparing the Annual Report, and the Group Financial Statements in accordance with applicable law and International Financial Reporting Standards (IFRSs) as adopted by the European Union (‘EU’), and for preparing the Parent Company Financial Statements in accordance with applicable law and United Kingdom Accounting Standards (United Kingdom Generally Accepted Accounting Practice) are set out in the Statement of Directors’ Responsibilities.
Our responsibility is to audit the Financial Statements in accordance with relevant legal and regulatory requirements and International Standards on Auditing (UK and Ireland).
We report to you our opinion as to whether the Financial Statements give a true and fair view and whether the Financial Statements have been properly prepared in accordance with the Companies Act 1985. We also report to you whether in our opinion the information given in the Directors’ Report is consistent with the Financial Statements.
In addition we report to you if, in our opinion, the Company has not kept proper accounting records, if we have not received all the information and explanations we require for our audit, or if information specified by law regarding directors’ remuneration and other transactions is not disclosed.
We read other information contained in the Annual Report and consider whether it is consistent with the audited Financial Statements. The other information comprises only the Directors’ Report, the Non-executive Chairman’s Statement, the Managing Director’s Statement, the Financial Review and the Corporate Governance Statement. We consider the implications for our report if we become aware of any apparent misstatements or material inconsistencies with the Financial Statements. Our responsibilities do not extend to any other information.
Basis of audit opinionWe conducted our audit in accordance with International Standards on Auditing (UK and Ireland) issued by the Auditing Practices Board. An audit includes examination, on a test basis, of evidence relevant to the amounts and disclosures in the Financial Statements. It also includes an assessment of the significant estimates and judgements made by the directors in the preparation of the Financial Statements, and of whether the accounting policies are appropriate to the Groups’ and Companys’ circumstances, consistently applied and adequately disclosed.
We planned and performed our audit so as to obtain all the information and explanations which we considered necessary in order to provide us with sufficient evidence to give reasonable assurance that the Financial Statements are free from material misstatement, whether caused by fraud or other irregularity or error. In forming our opinion we also evaluated the overall adequacy of the presentation of information in the Financial Statements.
OpinionIn our opinion:
the Group Financial Statements give a true and fair view, in accordance with IFRSs as adopted by the European Union, of the state of the Groups’ affairs as at 31 March 2008 and of its profit for the year then ended;the Parent Company Financial Statements give a true and fair view, in accordance with United Kingdom Generally Accepted Accounting Practice, of the state of the Parent Companys’ affairs as at 31 March 2008;the Financial Statements have been properly prepared in accordance with the Companies Act 1985; andthe information given in the Directors’ Report is consistent with the Financial Statements.
BAKER TILLY UK AUDIT LLPRegistered AuditorChartered Accountants1 St James’ GateNewcastle upon TyneNE1 4AD31 July 2008
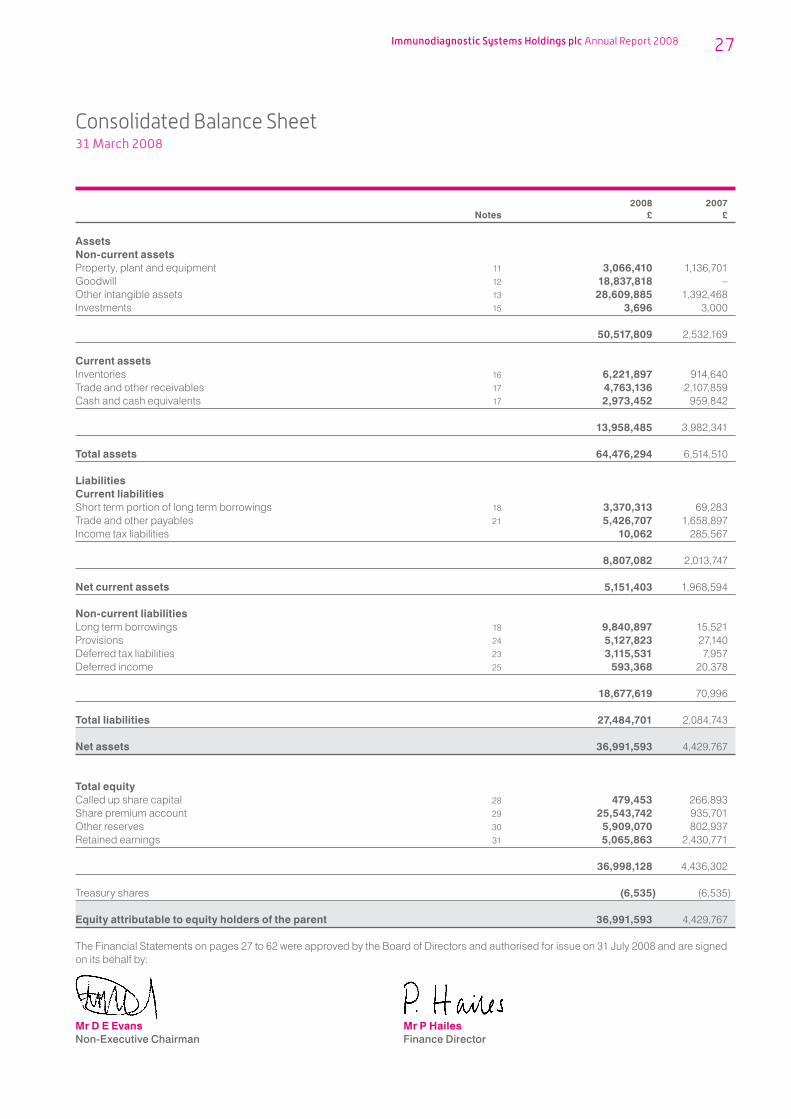
2008 2007 Notes £ £
AssetsNon-current assetsProperty, plant and equipment 11 3,066,410 1,136,701Goodwill 12 18,837,818 –Other intangible assets 13 28,609,885 1,392,468Investments 15 3,696 3,000
50,517,809 2,532,169
Current assetsInventories 16 6,221,897 914,640Trade and other receivables 17 4,763,136 2,107,859Cash and cash equivalents 17 2,973,452 959,842
13,958,485 3,982,341
Total assets 64,476,294 6,514,510
LiabilitiesCurrent liabilities Short term portion of long term borrowings 18 3,370,313 69,283Trade and other payables 21 5,426,707 1,658,897Income tax liabilities 10,062 285,567
8,807,082 2,013,747
Net current assets 5,151,403 1,968,594
Non-current liabilities Long term borrowings 18 9,840,897 15,521Provisions 24 5,127,823 27,140Deferred tax liabilities 23 3,115,531 7,957Deferred income 25 593,368 20,378
18,677,619 70,996
Total liabilities 27,484,701 2,084,743
Net assets 36,991,593 4,429,767
Total equityCalled up share capital 28 479,453 266,893Share premium account 29 25,543,742 935,701Other reserves 30 5,909,070 802,937Retained earnings 31 5,065,863 2,430,771
36,998,128 4,436,302
Treasury shares (6,535) (6,535)
Equity attributable to equity holders of the parent 36,991,593 4,429,767
The Financial Statements on pages 27 to 62 were approved by the Board of Directors and authorised for issue on 31 July 2008 and are signed on its behalf by:
Mr D E Evans Mr P HailesNon-Executive Chairman Finance Director
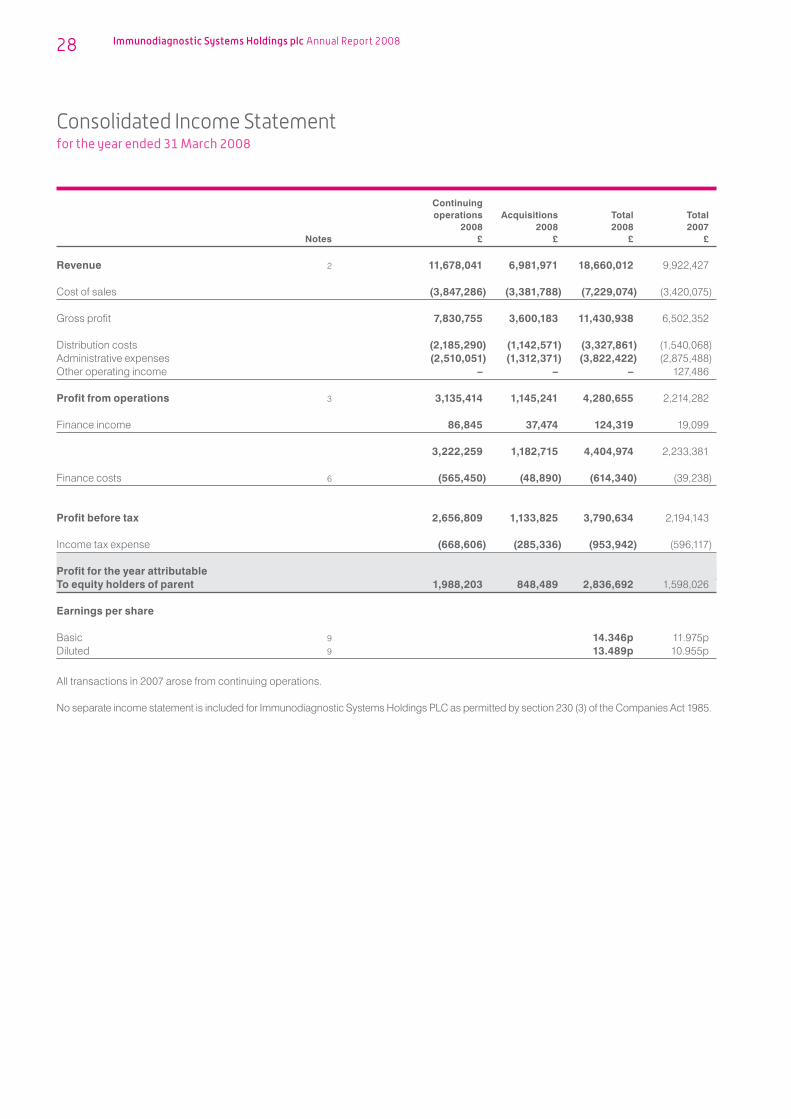
Continuing operations Acquisitions Total Total 2008 2008 2008 2007 Notes £ £ £ £
Revenue 2 11,678,041 6,981,971 18,660,012 9,922,427 Cost of sales (3,847,286) (3,381,788) (7,229,074) (3,420,075)
Gross profit 7,830,755 3,600,183 11,430,938 6,502,352
Distribution costs (2,185,290) (1,142,571) (3,327,861) (1,540,068)Administrative expenses (2,510,051) (1,312,371) (3,822,422) (2,875,488)Other operating income – – – 127,486
Profit from operations 3 3,135,414 1,145,241 4,280,655 2,214,282
Finance income 86,845 37,474 124,319 19,099
3,222,259 1,182,715 4,404,974 2,233,381
Finance costs 6 (565,450) (48,890) (614,340) (39,238)
Profit before tax 2,656,809 1,133,825 3,790,634 2,194,143
Income tax expense (668,606) (285,336) (953,942) (596,117)
Profit for the year attributable To equity holders of parent 1,988,203 848,489 2,836,692 1,598,026
Earnings per share Basic 9 14.346p 11.975pDiluted 9 13.489p 10.955p
All transactions in 2007 arose from continuing operations.
No separate income statement is included for Immunodiagnostic Systems Holdings PLC as permitted by section 230 (3) of the Companies Act 1985.
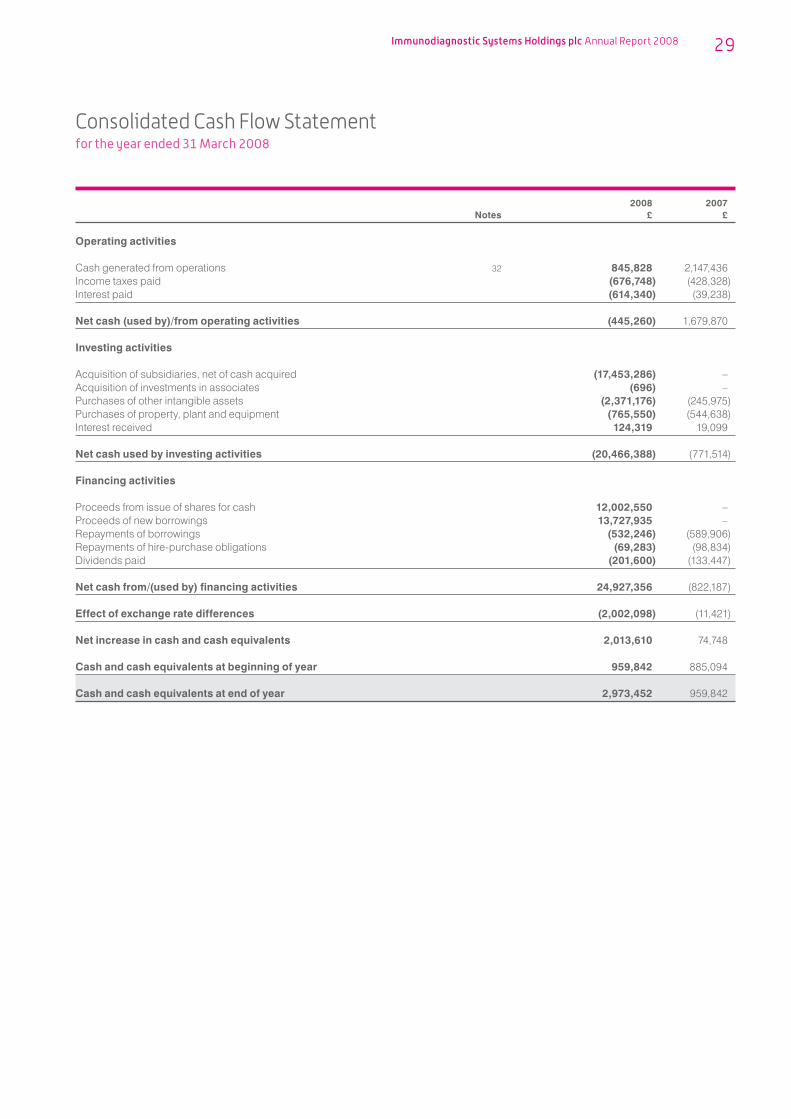
2008 2007 Notes £ £
Operating activities Cash generated from operations 32 845,828 2,147,436Income taxes paid (676,748) (428,328)Interest paid (614,340) (39,238)
Net cash (used by)/from operating activities (445,260) 1,679,870 Investing activities Acquisition of subsidiaries, net of cash acquired (17,453,286) –Acquisition of investments in associates (696) –Purchases of other intangible assets (2,371,176) (245,975)Purchases of property, plant and equipment (765,550) (544,638)Interest received 124,319 19,099
Net cash used by investing activities (20,466,388) (771,514)
Financing activities Proceeds from issue of shares for cash 12,002,550 –Proceeds of new borrowings 13,727,935 –Repayments of borrowings (532,246) (589,906)Repayments of hire-purchase obligations (69,283) (98,834)Dividends paid (201,600) (133,447)
Net cash from/(used by) financing activities 24,927,356 (822,187) Effect of exchange rate differences (2,002,098) (11,421) Net increase in cash and cash equivalents 2,013,610 74,748 Cash and cash equivalents at beginning of year 959,842 885,094
Cash and cash equivalents at end of year 2,973,452 959,842
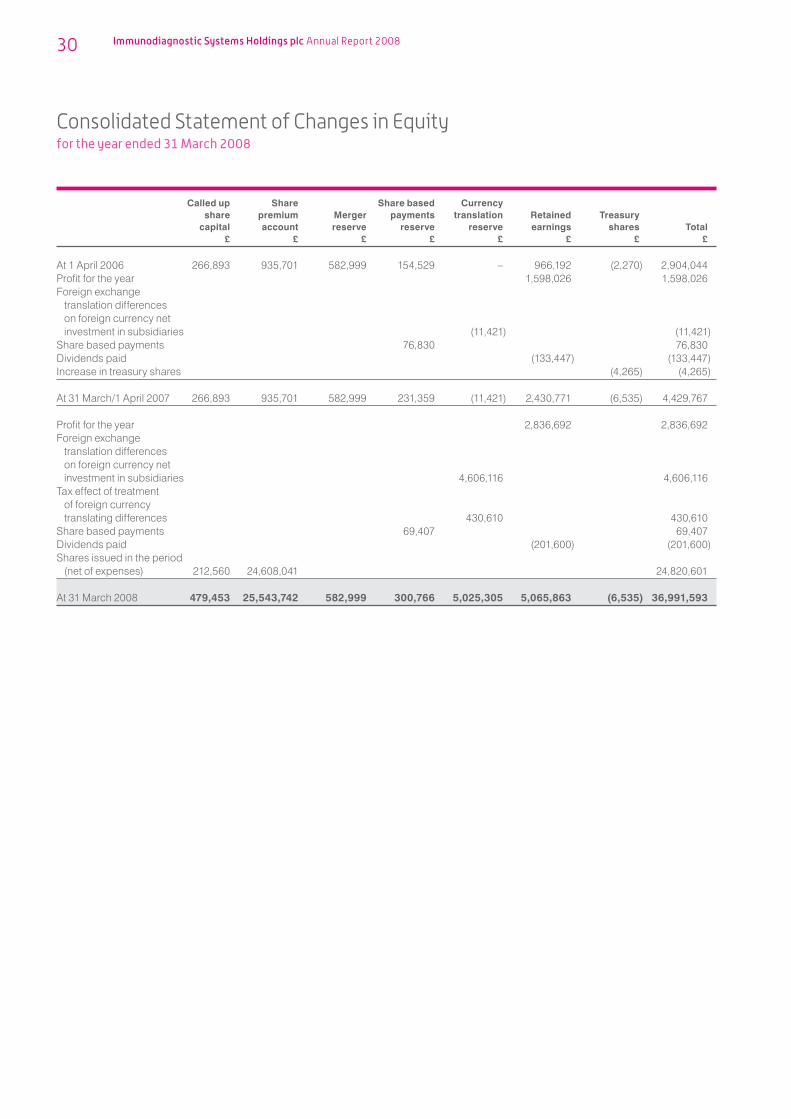
Called up Share Share based Currency share premium Merger payments translation Retained Treasury capital account reserve reserve reserve earnings shares Total £ £ £ £ £ £ £ £
At 1 April 2006 266,893 935,701 582,999 154,529 – 966,192 (2,270) 2,904,044Profit for the year 1,598,026 1,598,026Foreign exchange
translation differences on foreign currency net investment in subsidiaries (11,421) (11,421)
Share based payments 76,830 76,830Dividends paid (133,447) (133,447)Increase in treasury shares (4,265) (4,265)
At 31 March/1 April 2007 266,893 935,701 582,999 231,359 (11,421) 2,430,771 (6,535) 4,429,767
Profit for the year 2,836,692 2,836,692Foreign exchange
translation differences on foreign currency net investment in subsidiaries 4,606,116 4,606,116
Tax effect of treatment of foreign currency translating differences 430,610 430,610
Share based payments 69,407 69,407Dividends paid (201,600) (201,600)Shares issued in the period
(net of expenses) 212,560 24,608,041 24,820,601
At 31 March 2008 479,453 25,543,742 582,999 300,766 5,025,305 5,065,863 (6,535) 36,991,593

1 ACCOUNTING POLICIES
a) Basis of accountingThe Consolidated Financial Statements are prepared under the historical cost convention in accordance with applicable International Financial Reporting Standards (IFRS) as adopted by the European Union and issued by the International Accounting Standards Board (IASB). IFRS includes all IFRS, IAS, ISCs and IFRICs and the Financial Statements have been prepared in accordance with those parts of the Companies Act 1985 applicable to companies reporting under IFRS. The measurement basis and principal accounting policies are set out below.
The policies have changed from the previous year when the Financial Statements were prepared under applicable United Kingdom Generally Accepted Accounting Principles (UK GAAP). The comparative information has been restated in accordance with IFRS. The changes to accounting policies are explained in note 40, together with a reconciliation of opening balances. The date of transition to IFRS is 1 April 2006.
b) Basis of preparationThe Financial Statements are prepared on the historical cost basis except for certain financial assets which are stated at their fair values.
The preparation of Financial Statements in conformity with IFRS requires the directors to make judgements, estimates and assumptions that affect the application of policies and reported amounts of assets and liabilities, income and expense. The estimates and judgements are based on historical experience and various other factors that are believed to be reasonable under the circumstances, the results of which form the basis of making judgements about carrying amounts of assets and liabilities that are not readily apparent from other sources. Actual results may differ from these estimates. The accounting policies set out below have, unless otherwise stated, been applied consistently to all periods presented in these Financial Statements.
c) Application of IFRS 1Under the first time adoption procedures set out in IFRS1, the Company is required to establish IFRS accounting policies as at 31 March 2008 and to apply these retrospectively in the determination of prior period comparatives from 1 April 2006, the date of transition. The accounting policies set out below have been applied consistently to all of the periods covered in the Financial Statements.
There are a number of optional exemptions to this general principle, the most significant of which are set out below:
IFRS 3, Business CombinationsThe Group has elected not to restate business combinations prior to the date of transition. Accordingly, the balance sheet at 1 April 2006 incorporates the Financial Statements of its subsidiary undertaking Immunodiagnostic Systems Limited using the merger method of accounting and the subsidiary’s subsidiary undertakings using the acquisition method of accounting. Goodwill previously recognised on consolidation has been reviewed for impairment as at 1 April 2006 and has been fully written off as at that date. Associates have been deemed wholly immaterial and are treated as investments in the Group accounts.
IAS 32, Financial Instruments: Disclosure and Presentation and IAS 39, Financial Instruments: Recognition and Measurement
The Group has elected to adopt IAS 32 and IAS 39 from 1 April 2006 and not to restate prior period comparatives.
Tables setting out the reconciliation of opening UK GAAP balances to IFRS, together with the effect on the equity, net income and cash flows, are provided in note 40.
The results of businesses acquired or disposed of are consolidated from or to the effective dates of acquisition or disposal. On the acquisition of subsidiary undertakings or businesses, the acquisition cost is allocated against the fair value of net assets acquired, after adjustments to bring accounting policies into line with those of the Group.
d) Foreign currenciesThe results and financial position of the Group are expressed in pounds sterling, its functional currency. Transactions in currencies other than pounds sterling are recorded at the exchange rate ruling at the date of the transaction. Monetary assets and liabilities denominated in foreign currencies at the balance sheet date are translated to sterling at the foreign exchange rate ruling at that date. Exchange differences arising on translation are recognised in the consolidated income statement for the period.
Non-monetary assets and liabilities denominated in foreign currencies that are stated at fair value are translated at the rates prevailing at the dates when the fair value was determined. Non-monetary assets and liabilities that are measured at historical cost in a foreign currency (eg. property, plant and equipment purchased in a foreign currency) are translated using the exchange rate prevailing at the date of the transaction. Exchange differences arising on the translation of net assets are effected through the statement of recognised income and expense.
Where a non-monetary foreign currency loan forms part of the net investment in a foreign subsidiary, on consolidation the exchange differences are recognised directly in equity to the extent the loan qualifies as an effective hedge.

1 ACCOUNTING POLICIES (CONTINUED)
e) Business combinationsThe Financial Statements incorporate the Financial Statements of the Company and all its subsidiaries. Unrealised gains on transactions between the Group and its subsidiaries are eliminated. Unrealised losses are also eliminated unless the transaction provides evidence of an impairment of the asset transferred.
The purchase method of accounting is used to account for the acquisition of subsidiaries by the Group since date of transition. The cost of an acquisition is measured as the fair value of the assets given, equity instruments issued and liabilities incurred or assumed at the date of exchange, plus costs directly attributable to the acquisition.
Identifiable assets acquired and liabilities and contingent liabilities assumed in a business combination are measured initially at their fair values at the acquisition date. The excess of the cost of the acquisition over the fair value of assets and liabilities is recorded as goodwill. If the cost of the acquisition is less than the fair value of the net assets of the subsidiary acquired the difference is recognised directly in the income statement.
SubsidiariesSubsidiaries are entities controlled by the Company. Control exists when the Company has the power, directly or indirectly (but normally through voting rights granted through the Companys’ shareholdings), to govern the financial and operating policies of an entity to obtain benefits from its activities. The Financial Statements of subsidiaries are included in the consolidated Financial Statements. AcquisitionsOn acquisition, the assets and liabilities of a subsidiary, including identifiable intangible assets, are measured at their fair value at the date of acquisition. Any excess of the cost of acquisition over the fair value of the identifiable net assets acquired is recorded as goodwill. Goodwill is reviewed for impairment annually and any impairment is recognised immediately in the income statement. Any excess of fair value of the identifiable net assets acquired over the cost of acquisition is credited to the income statement on acquisition. Goodwill recorded on business combinations prior to IFRS transition has not been restated and has either been written off to reserves or capitalised according to the UK GAAP accounting standards then in force. On disposal or closure of a previously acquired business, the attributable goodwill previously written off to reserves is not included in determining the profit or loss on disposal.
The results and cash flows relating to the business are included in the consolidated accounts from the date of combination.
f) Revenue recognitionRevenue is measured by reference to the fair value of consideration received or receivable for goods and services provided in the normal course of business, excluding VAT. Revenue is recognised upon the performance of services or transfer of risk to the customer. Where services are based on performance or specific deliverables the income is accounted for as the right to consideration for performance is earned.
g) Goodwill and other intangible assetsGoodwill is measured at cost less any accumulated impairment losses. Goodwill is reviewed for impairment annually.
All research costs, which consist predominantly of salaries, are charged to the income statement as incurred.
Development costs, which consist predominantly of salaries and third party direct costs, are capitalised as an intangible asset when recognition criteria are met and, in particular, it is clear that the development expenditure will generate future economic benefit. Otherwise development costs are charged to the income statement as incurred. Capitalised costs are amortised over 5 years from the date the product commences commercial production.
All development expenditure incurred on automation of IDS products on the 3X3 will be capitalised and amortised over 5 years from the date the product commences commercial production. Development expenditure on research use only products will be expensed as incurred as there is uncertainty as to the magnitude of future revenues being sufficient to cover the development costs.
Research and development of clinical products – all expenditure incurred up to feasibility stage is expensed off – all expenditure post feasibility will be capitalised and amortised post product launch over 5 years.
Other intangible assets acquired as part of a business acquisition are capitalised at fair value at the date of acquisition. Purchased intangible assets acquired separately are capitalised at cost. After initial recognition, all intangible fixed assets are measured at cost less accumulated amortisation and any accumulated impairment losses.
The TRAP patent was recognised at fair value on the acquisition of a subsidiary. The amount capitalised is the consideration in excess of the book values of the assets and liabilities at the date of acquisition. The directors consider twenty years as a reasonable period of estimated useful life.
Where an intangible asset has been assigned an indefinite useful life, it is not amortised and is reviewed for impairment either annually or more frequently if events or changes in circumstances indicate a possible decline in the carrying value.
Intangible assets which have been assigned a finite life are amortised on a straight line basis over the assets’ useful life of up to twenty years and are tested for impairment if events or changes in circumstances indicate that the carrying value may have declined. Useful lives are examined every year and adjustments are made, where applicable, on a prospective basis. Amortisation of intangible assets is charged in the income statement under administrative expenses.

h) Tangible assetsProperty, plant and equipmentProperty, plant and equipment is shown at cost, net of depreciation and any provision for impairment. Depreciation is provided on all property, plant and equipment at varying rates calculated to write off cost to the expected current residual value by equal annual instalments over their estimated useful economic lives. The principal rates employed are:
Property – over the life of the leaseFixtures, Fittings & Equipment – over 5-7 yearsMotor Vehicles – over 4 years
Disposal of assets The gain or loss arising on the disposal of an asset is determined as the difference between the disposal proceeds and the carrying amount of the asset and is recognised in the income statement. The gain or loss arising from the sale is included in administrative expense in the income statement.
i) InvestmentsFixed asset investments are stated at cost after making provision for any impairment in their value.
j) ImpairmentImpairment is determined by comparing the recoverable amount of the cash-generating unit or Group of cash-generating units (‘CGU’) which are expected to benefit from the asset to its carrying value. The recoverable amount is the greater of an asset’s value in use and its fair value less costs to sell. Value in use is calculated by discounting the future cash flows expected to be derived from the asset or Group of assets in a CGU at an appropriate pre tax discount rate. Where the recoverable amount is less than the carrying value, the asset is considered impaired and is written down through the income statement to its recoverable amount.
k) InventoriesInventories are valued at the lower of cost and net realisable value, after making due allowance for obsolete and slow moving items. For inventories that are ordinarily interchangeable, cost is calculated using the weighted average method. Net realisable value is based on estimated selling price less estimated cost of disposal.
Work in progress is valued on the basis of direct costs plus attributable overheads based on normal level of activity. Provision is made for any foreseeable losses where appropriate. No element of profit is included in the valuation of the work in progress.
l) Lease and hire purchase commitmentsAssets held under hire purchase agreements are capitalised in the balance sheet at the fair value of the assets and are depreciated over their useful lives. The capital element of future obligations under the contract is included in liabilities in the balance sheet.
The interest element of the rental obligations is charged to the income statement over the period of the lease and represents a constant proportion of the balance of capital repayments outstanding.
All other leases are classified as operating leases and rentals are charged to the income statement on a straight line basis over the lease term.
m) PensionsTrading companies operate defined contribution pension schemes for employees. The assets of the schemes are held separately from those of the Company. The annual contributions payable are charged to the income statement.
n) Financial assetsTrade receivables Trade receivables are initially recognised at fair value and thereafter at amortised cost using the effective interest rate. A provision for impairment of trade receivables is established when there is objective evidence that the Company will not be able to collect all amounts due according to the original terms of these receivables. The amount of the provision is recognised in the income statement. Trade receivables do not carry any interest charge.
Cash Cash includes cash in hand, deposits held at call with banks, and bank overdrafts. Bank overdrafts are shown within current liabilities on the balance sheet.
o) Financial liabilitiesTrade payablesTrade payables are non-interest-bearing and are initially measured at fair value and thereafter at amortised cost using the effective interest rate.
BorrowingsInterest-bearing loans and bank overdrafts are initially carried at the fair value. Finance charges, including premia payable on settlement or redemption and direct issue costs, are accounted for on an accruals basis to the income statement using the effective interest method and are added to the carrying amount of the instrument to the extent that they are not settled in the period in which they arise.

1 ACCOUNTING POLICIES (CONTINUED)
p) Government grantsGovernment grants in respect of capital expenditure are treated as deferred income and are credited to the income statement over the estimated useful life of the assets to which they relate. Revenue grants are credited to the income statement in the period to which they relate.
q) Share-based paymentsAll goods and services received in exchange for the grant of any share-based payment are measured at their fair values. The Group issues equity-settled and cash-settled share-based payments to certain employees. Equity-settled share-based payments are measured at fair value at the date of grant. The fair value determined at the grant date of equity-settled share-based payments is expensed on a straight-line basis over the vesting period, based on the Groups’ estimate of shares that will eventually vest.
The fair value is measured by the use of the Black-Scholes option pricing model. The expected life used in the model has been adjusted, based on management’s best estimate, for the effect of non-transferability, exercise restrictions, and behavioural considerations.
A liability equal to the portion of the goods or services received is recognised at the current fair value determined at each balance sheet date for cash-settled share-based payments. Changes in fair value are recognised through the profit and loss account.
All equity-settled share-based payments are ultimately recognised as an expense in the income statement with a corresponding credit to reserves.
If vesting periods or other non-market vesting conditions apply, the expense is allocated over the vesting period, based on the best available estimate of the number of share options expected to vest. Estimates are subsequently revised if there is any indication that the number of share options expected to vest differs from previous estimates. Any cumulative adjustment prior to vesting is recognised in the current period. No adjustment is made to any expense recognised in prior periods if share options ultimately exercised are different to that estimated on vesting.
Upon exercise of share options the proceeds received net of attributable transaction costs are credited to share capital and, where appropriate, share premium.
r) TaxationCurrent tax is the tax currently payable based on taxable results for the year.
Deferred income taxes are calculated using the liability method on temporary differences. However, deferred tax is not provided on the initial recognition of an asset or a liability unless the related transaction is a business combination or affects tax or accounting profit. Deferred tax is generally provided on the difference between the carrying amounts of assets and liabilities and their tax bases. In addition, tax losses available to be carried forward as well as other income tax credits to the Company are assessed for recognition as deferred tax assets.
Deferred tax liabilities are provided in full, with no discounting. Deferred tax assets are recognised to the extent that it is probable that the underlying deductible temporary differences will be able to be offset against future taxable income. Current and deferred tax assets and liabilities are calculated at tax rates that are expected to apply to their respective period of realisation, provided they are enacted or substantively enacted at the balance sheet date.
s) Financial instrumentsFinancial assets and financial liabilities are recognised on the Groups’ balance sheet when the Group becomes a party to the contractual provisions of that instrument.
The Group uses foreign currency loans to hedge its overseas exposure and fixed rate interest swaps to hedge its term loan interest rate exposure. The Group does not use derivative financial instruments for speculative purposes.
Interest rate swaps are initially recognised at cost and are subsequently re-measured to fair value at each balance sheet date. Changes in the fair value of derivative financial instruments that do not qualify for hedge accounting are recognised in the income statement as they arise. These valuations are provided by the issuing financial institution.
Derivatives embedded in other financial instruments or other host contracts are treated as separate derivatives when their risks and characteristics are not closely related to those of the host contracts and the host contracts are not carried at fair value with unrealised gains or losses reported in the income statement. t) EquityEquity comprises the following:
Share capital represents the nominal value of equity shares. Share premium represents the excess over nominal value of the fair value of consideration received for equity shares, net of expenses of the share issue. Retained earnings include all current and prior period results as disclosed in the income statement. Merger reserve represents the share premium and capital redemption reserve in existence in the subsidiary at the date of merger. Share based payment reserve is the corresponding entry to the expense arising from equity-settled share-based payments.

u) Critical judgements in applying the Groups’ accounting policiesIn the process of applying the Groups’ accounting policies, management has made the following judgements that have the most significant effect on the amounts recognised in the Financial Statements.
Research and developmentResearch and development expenditure is capitalised as an intangible asset when recognition criteria are met and, in particular, it is clear that the development expenditure will generate future economic benefit. The development of the 3X3 instrument and a range of tests to be run on it are seen as development expenditure so relevant costs are capitalised and amortised over 5 years from the date the product commences commercial production.
Identification and valuation of intangible assets on acquisitionDuring the year the Group completed the acquisitions described in note 34. The Groups’ policies require that a fair value at the date of acquisition be attributed to the intangible assets owned by the acquired companies. The directors use their judgement to identify the separate intangible assets and then determine a fair value for each based upon the consideration paid, the nature of the asset, industry statistics, future potential and other relevant factors. These fair values will be reviewed for impairment annually.
Segmental analysis The Companys’ principal activity consists of manufacturing and distributing medical diagnostic products. The directors believe that these activities comprise one business unit and consequently segmental analysis by business segment is not considered necessary.
Contingent consideration The acquisition of Biocode Hycel SA during the year included a contingent consideration clause in the form of a commitment to pay the former shareholders of the acquired company 10,000 for each 3X3 instrument placed by the Group by 31 December 2010. In determining the fair value attributable to this commitment, the directors considered current sales forecasts and discounted, applying a discount factor of 8.9%, being the Groups’ weighted average cost of capital
v) Key sources of estimation uncertaintyThe key assumptions concerning the future, and other key sources of estimation uncertainty at the balance sheet date, that have a significant risk of causing a material adjustment to the carrying amounts of assets and liabilities within the next financial year, are discussed below.
Useful livesThe Group uses forecast cash flow information and estimates of future growth to assess whether goodwill and other intangible fixed assets are impaired, and to determine the useful economic lives of its goodwill and intangible assets. If the results of operations in a future period are adverse to the estimates used a reduction in useful economic life may be required.
w) Standards not yet effectiveThe directors do not expect any of the standards detailed below which are issued but not yet effective to have a material impact on the financial information.
IAS 23 Borrowing Costs (revised 2007) (effective 1 January 2009)IFRIC 12 Service Concession Arrangements (effective 1 January 2008)IFRIC 13 Customer Loyalty Programmes (effective 1 July 2008)IFRIC 14, IAS 19 Limit on a Defined Benefit Asset, Minimum Funding Requirements and their Interaction (effective 1 January 2008)
Although the following standards will not have a material effect on the results they will have a material effect on the disclosures:IAS 1 revised (effective 1 January 2009)IFRS 8 Operating Segments (effective 1 January 2009)

2 SEGMENTAL INFORMATION
For management purposes, the Group is currently organised into three geographical operating regions, UK, Europe and USA. These regions are the basis on which the Group reports, by origin, its primary segment information.
The main activity of the Group is the manufacturing and distributing of medical diagnostic products. No separate business segments have been identified for management purposes.
Inter-segment sales are priced based on the market selling price for the individual item obtainable by the purchasing segment, reduced by a margin equivalent to the gross margin that would be expected to have been achieved by purchasing the item on the local wholesale market.
Year ended 31 March 2008:
Revenue
UK Europe USA Adjustments Consolidated £000 £000 £000 £000 £000
External sales 6,932 8,866 2,862 – 18,660Inter-segment sales 3,770 1,894 – (5,664) –
Total revenue 10,702 10,760 2,862 (5,664) 18,660
ResultProfit from operations 3,467 552 432 (170) 4,281Investment income 82 328 4 (290) 124Finance costs (2,085) (344) – 1,815 (614)
Profit before tax 1,464 536 436 1,355 3,791Income tax expense (319) (42) (166) (427) (954)
Profit after tax 1,145 494 270 928 2,837
Balance sheet
UK Europe USA Adjustments Consolidated £000 £000 £000 £000 £000
Segment assets 57,702 30,795 681 (24,702) 64,476Segment liabilities (26,689) (18,810) (244) 18,259 (27,484)
31,013 11,985 437 (6,443) 36,992
Capital additions 1,190 25,332 10 – 26,532Depreciation and amortisation 285 643 5 – 933

Year ended 31 March 2007:
Revenue
UK Europe USA Adjustments Consolidated £000 £000 £000 £000 £000
External sales 5,736 2,658 1,528 – 9,922Inter-segment sales 2,341 225 – (2,566) –
Total revenue 8,077 2,883 1,528 (2,566) 9,922
ResultProfit from operations 2,082 (14) 164 (18) 2,214Investment income 16 – 3 – 19Finance costs (31) (8) – – (39)
Profit before tax 2,067 (22) 167 (18) 2,194Income tax expense (532) – (64) – (596)
Profit after tax 1,535 (22) 103 (18) 1,598
Balance sheet
UK Europe USA Adjustments Consolidated £000 £000 £000 £000 £000
Segment assets 8,320 865 295 (2,965) 6,515Segment liabilities (2,928) (966) (123) 1,932 (2,085)
5,392 (101) 172 (1,033) 4,430
Capital additions 906 38 7 – 951Depreciation and amortisation 212 38 3 – 253
3 PROFIT FROM OPERATIONS
Profit from operations is stated after charging/(crediting):
2008 2007 £ £
Amortisation of government grants re fixed assets (179,724) (3,939)Amortisation of other intangible assets 426,474 41,162Depreciation of owned plant, property and equipment 451,500 177,614Depreciation of assets held under hire purchase agreements 54,633 34,681Operating lease costs: 204,745 99,523Share-based payments 69,407 76,830Net (gain)/loss on foreign currency translation (17,877) 98,003Research and development 364,474 706,319Staff costs (note 4) 6,769,666 2,810,027Auditor’s remuneration (see below) 108,765 87,686
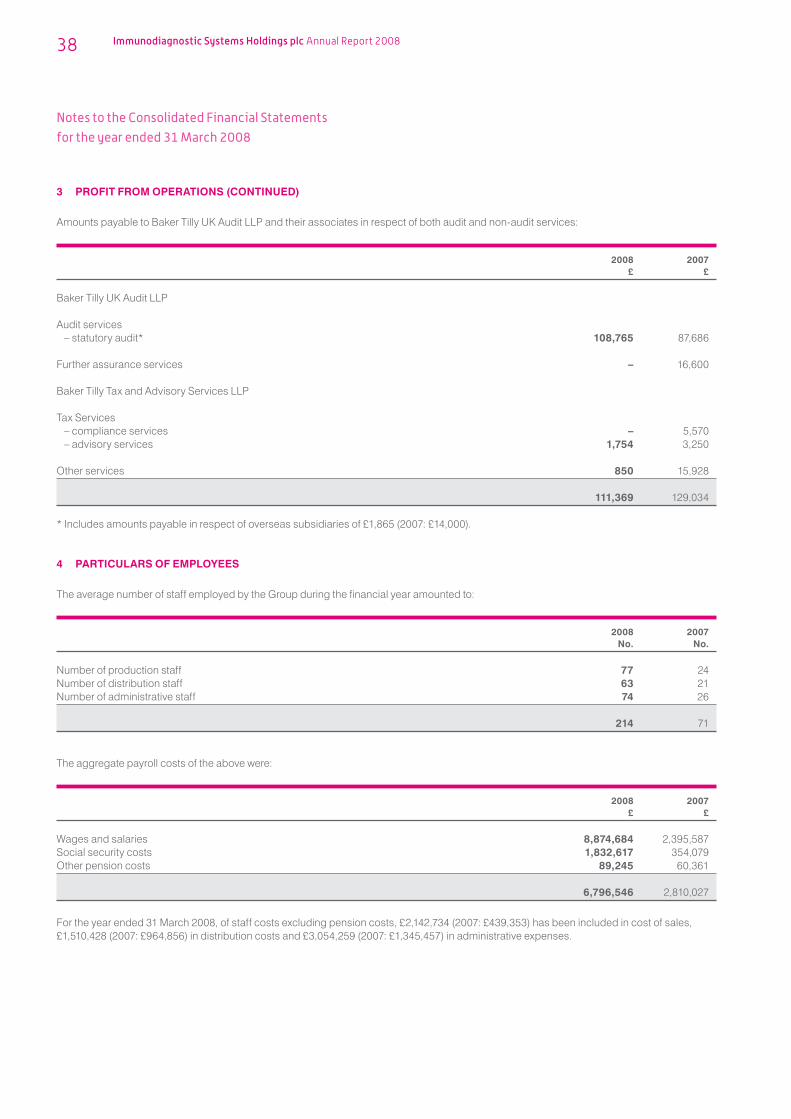
3 PROFIT FROM OPERATIONS (CONTINUED)
Amounts payable to Baker Tilly UK Audit LLP and their associates in respect of both audit and non-audit services:
2008 2007 £ £
Baker Tilly UK Audit LLP
Audit services– statutory audit* 108,765 87,686
Further assurance services – 16,600
Baker Tilly Tax and Advisory Services LLP
Tax Services– compliance services – 5,570– advisory services 1,754 3,250
Other services 850 15,928
111,369 129,034
* Includes amounts payable in respect of overseas subsidiaries of £1,865 (2007: £14,000).
4 PARTICULARS OF EMPLOYEES
The average number of staff employed by the Group during the financial year amounted to:
2008 2007 No. No.
Number of production staff 77 24Number of distribution staff 63 21Number of administrative staff 74 26
214 71
The aggregate payroll costs of the above were:
2008 2007 £ £
Wages and salaries 8,874,684 2,395,587Social security costs 1,832,617 354,079Other pension costs 89,245 60,361
6,796,546 2,810,027
For the year ended 31 March 2008, of staff costs excluding pension costs, £2,142,734 (2007: £439,353) has been included in cost of sales, £1,510,428 (2007: £964,856) in distribution costs and £3,054,259 (2007: £1,345,457) in administrative expenses.

5 DIRECTORS’ EMOLUMENTS
The Directors’ aggregate emoluments in respect of qualifying services were:
2008 2007 £ £
Emoluments receivable 801,242 533,527Value of Company pension contributions to money purchase schemes 8,573 8,573
809,815 542,100
Emoluments of highest paid Director:
2008 2007 £ £
Total emoluments (excluding pension contributions) 169,796 153,724Value of Company pension contributions to money purchase schemes – –
169,796 153,724
The number of Directors who accrued benefits under Company pension schemes was as follows:
2008 2007 No. No.
Money purchase schemes 2 2
2008
Comp. for Salary loss of office Bonuses Fees Benefits Total £ £ £ £ £ £
Dr R T Duggan 115,688 – 25,000 – 16,320 157,008Mr P Hailes 90,386 – 25,000 – 8,019 123,405Mr C I Cookson 43,750 – 40,000 – 4,920 88,670Mr A Wilks 120,531 – 38,947 – 10,318 169,796Dr M Garrity 91,755 – 5,000 – 15,588 112,343Mr A Rousseau 57,298 – 8,206 29,311 205 95,020Mr D E Evans (non-exec) – – – 25,000 – 25,000Mr W Dracup (non-exec) – – – 15,000 – 15,000Dr E D Blair (non-exec) – – – 15,000 – 15,000
519,408 – 142,153 84,311 55,370 801,242
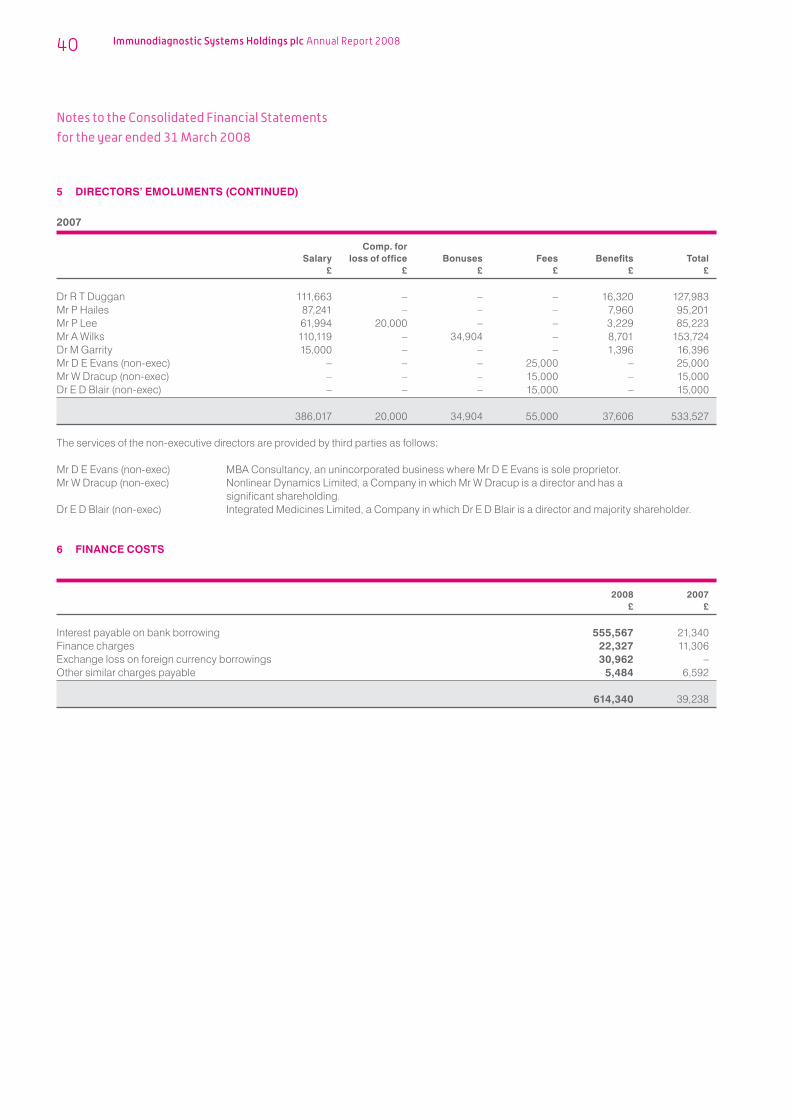
5 DIRECTORS’ EMOLUMENTS (CONTINUED)
2007
Comp. for Salary loss of office Bonuses Fees Benefits Total £ £ £ £ £ £
Dr R T Duggan 111,663 – – – 16,320 127,983Mr P Hailes 87,241 – – – 7,960 95,201Mr P Lee 61,994 20,000 – – 3,229 85,223Mr A Wilks 110,119 – 34,904 – 8,701 153,724Dr M Garrity 15,000 – – – 1,396 16,396Mr D E Evans (non-exec) – – – 25,000 – 25,000Mr W Dracup (non-exec) – – – 15,000 – 15,000Dr E D Blair (non-exec) – – – 15,000 – 15,000
386,017 20,000 34,904 55,000 37,606 533,527
The services of the non-executive directors are provided by third parties as follows:
Mr D E Evans (non-exec) MBA Consultancy, an unincorporated business where Mr D E Evans is sole proprietor.Mr W Dracup (non-exec) Nonlinear Dynamics Limited, a Company in which Mr W Dracup is a director and has a significant shareholding.Dr E D Blair (non-exec) Integrated Medicines Limited, a Company in which Dr E D Blair is a director and majority shareholder.
6 FINANCE COSTS
2008 2007 £ £
Interest payable on bank borrowing 555,567 21,340Finance charges 22,327 11,306Exchange loss on foreign currency borrowings 30,962 –Other similar charges payable 5,484 6,592
614,340 39,238

7 TAXATION ON ORDINARY ACTIVITIES
a) Analysis of charge in the year 2008 2007 £ £
Current tax:
UK Corporation tax based on the results for the year at 30% (2007 – 30%) 578,720 605,736Under/(over) provision in prior year – (11,850)Foreign tax on income 251,243 –
Total current tax 829,963 593,886
Deferred tax:
Origination and reversal of timing differencesCapital allowances 468,626 22,101Other (84,784) 3,089Tax losses carried forward (236,913) –Deferred tax on share based payments charge (22,950) (22,959)
Total deferred tax (note 23) 123,979 2,231
Tax on profit on ordinary activities 953,942 596,117
b) Factors affecting tax charge.
The tax assessed for the period is lower than the standard rate of corporation tax in the UK (30%). The differences are explained below:
2008 2007 £ £
Profit on ordinary activities before taxation 3,790,634 2,194,143
Profit on ordinary activities by rate of tax in the UK of 30% (2007 – 30%) 1,137,190 658,243Expenses not deductible for tax purposes 43,049 45,904Income not taxable for tax purposes (6,106) – Additional relief for R & D expenditure (447,463) (84,484)Foreign profits taxable at different rates 256,112 –Losses brought forward utilised (26,950) (11,696)Tax in respect of prior periods (1,890) (11,850)
Total tax charge at an effective rate of 25.2% (2007 – 27.2%) 953,942 596,117
8 DIVIDENDS
On 24 September 2007, a dividend of 1.25p (2007: 1p) per share was paid to shareholders. In respect of the current year, the directors propose that a dividend of 1.5p per share will be paid to the shareholders on 19 September 2008. This dividend is subject to approval by shareholders at the Annual General Meeting and has not been included as a liability in these Financial Statements.
The proposed dividend for 2008 is payable to all shareholders on the Register of Members on 22 August 2008. The total estimated dividend is £359,590.

9 EARNINGS PER ORDINARY SHARE
Basic earnings per share is calculated by dividing the earnings attributable to ordinary shareholders by the weighted average number of ordinary shares outstanding during the year.
For diluted earnings per share, the weighted average number of ordinary shares in issue is adjusted to assume conversion of all dilutive potential ordinary shares. The Group has two classes of dilutive potential ordinary shares: those share options granted to employees where the exercise price is less than the average market price of the Companys’ ordinary shares during the year and the contingently issuable shares under the Groups’ share option scheme. At 31 December 2007, the performance criteria for the vesting of the awards under the option scheme had been met and consequently the shares in question are included in the diluted EPS calculation.
The calculations of earnings per share are based on the following profits and numbers of shares.
2008 2007 £ £ Profit on ordinary activities after tax 2,836,692 1,598,026
No. No.
Weighted average no of shares: For basic earnings per share 19,773,787 13,344,667Effect of dilutive potential ordinary shares: – Share Options 1,256,494 1,242,392
For diluted earnings per share 21,030,281 14,587,059 Basic earnings per share 14.346p 11.975pDiluted earnings per share 13.489p 10.955p
10 FINANCIAL INSTRUMENTS RECOGNISED IN THE BALANCE SHEET
Year ended 31 March 2008
Assets at fair value through profit and loss
Held for Other Loans and trading investments receivables Total £ £ £ £
Non-current financial assets Financial asset investments – 3,696 – 3,696
Current financial assetsTrade and other receivables – – 4,763,136 4,825,529Cash and cash equivalents 2,973,452 – – 2,973,452
2,973,452 – 4,763,136 7,736,588
Total 2,973,452 3,696 4,763,136 7,740,284

Other Derivatives financial used for liabilities hedging Total £ £ £
Current financial liabilities Trade and other payables 5,426,427 – 5,426,427Bank loans and overdrafts 814,225 2,470,733 3,284,958Obligations under hire purchase agreements 85,355 – 85,355
6,326,007 2,470,733 8,796,740 Non-current financial liabilities Bank loans and overdrafts 1,094,399 8,647,572 9,741,971Obligations under hire purchase agreements 98,926 – 98,926Other financial liabilities 593,368 – 593,368
1,786,693 8,647,572 10,434,265 Total 8,112,700 11,118,305 19,231,005
During the year, the Group entered into a loan agreement for !14,900,000 to fund the acquisition of Nordic Bioscience Diagnostics A/S. The currency loan was designated as a hedging instrument against the net investment in that subsidiary and, as such, the currency translation gains and losses arising from the loan are recognised in equity.
Year ended 31 March 2008
Assets at fair value through profit and loss
Held for Other Loans and trading investments receivables Total £ £ £ £
Non-current financial assets Financial asset investments – 3,000 – 3,000
Current financial assets Trade and other receivables – – 2,107,859 2,107,859Cash and cash equivalents 959,842 – – 959,842
959,842 – 2,107,859 3,067,701
Total 959,842 3,000 2,107,859 3,070,701
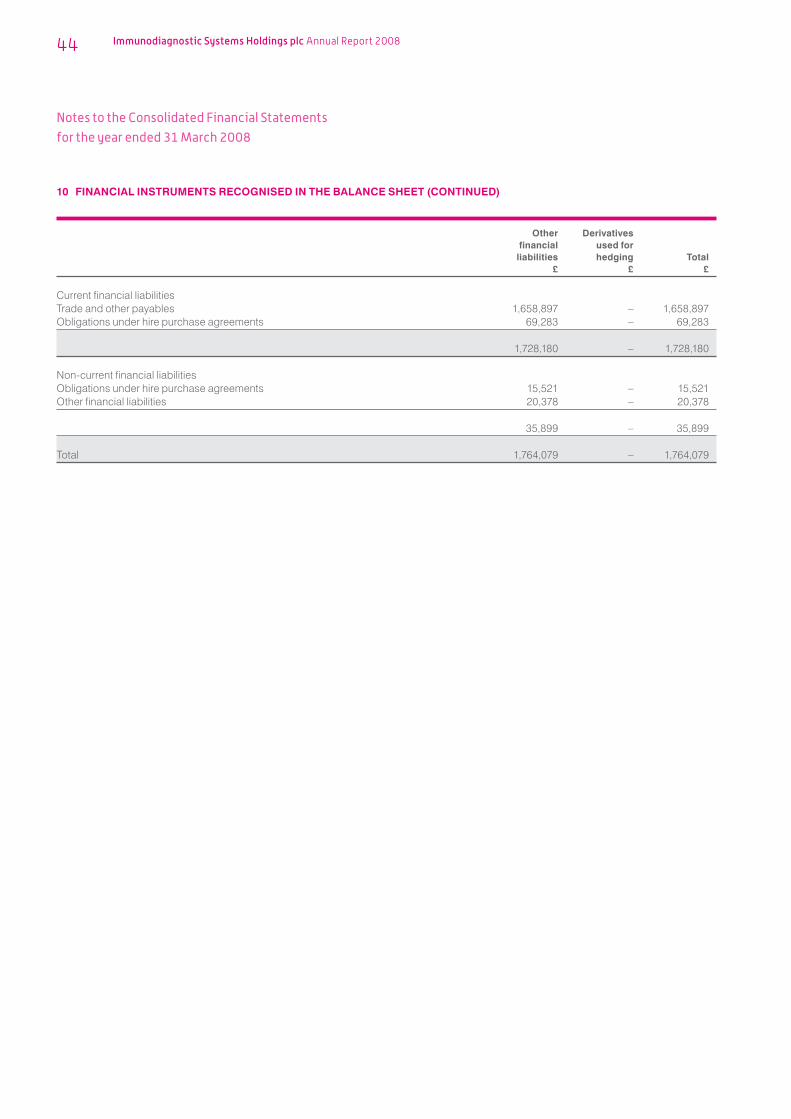
10 FINANCIAL INSTRUMENTS RECOGNISED IN THE BALANCE SHEET (CONTINUED)
Other Derivatives financial used for liabilities hedging Total £ £ £
Current financial liabilities Trade and other payables 1,658,897 – 1,658,897Obligations under hire purchase agreements 69,283 – 69,283
1,728,180 – 1,728,180 Non-current financial liabilities Obligations under hire purchase agreements 15,521 – 15,521Other financial liabilities 20,378 – 20,378
35,899 – 35,899 Total 1,764,079 – 1,764,079

11 PROPERTY, PLANT AND EQUIPMENT
Fixtures, fittings & Motor Property equipment vehicles Total £ £ £ £
CostAt 1 April 2006 377,545 1,751,163 53,125 2,181,833Additions 191,144 411,423 – 602,567Disposals (78,083) (875,831) (10,273) (964,187)
At 31 March/1 April 2007 490,606 1,286,755 42,852 1,820,213Additions on acquisition of subsidiaries 641,938 814,473 3,892 1,460,303Exchange differences 102,733 103,268 625 206,616Additions 4,487 761,063 – 765,550Disposals – (2,195) – (2,195)
At 31 March 2008 1,239,754 2,963,364 47,369 4,250,487
DepreciationAt 1 April 2006 155,007 1,257,417 22,980 1,435,404Charge for the year 42,494 161,283 8,518 212,295On disposals (78,114) (876,840) (9,233) (964,187)
At 31 March/1 April 2007 119,387 541,860 22,265 683,512Exchange differences (31) (5,218) – (5,249)Charge for the year 94,562 401,788 9,783 506,133On disposals – (319) – (319)
At 31 March 2008 213,918 938,111 32,048 1,184,077
Net book value
At 31 March 2008 1,025,836 2,025,253 15,321 3,066,410
At 31 March 2007 371,219 744,895 20,587 1,136,701
At 1 April 2006 222,538 493,746 30,145 746,429
Hire purchase agreementsIncluded within the net book value of £3,066,410 is £325,439 (2007: £170,582) relating to assets held under hire purchase agreements. The depreciation charged in the year in respect of such assets amounted to £54,633 (2007: £34,681).

12 GOODWILL
£
CostAt 1 April 2006 966,446Arising on acquisition of subsidiaries –
At 31 March/1 April 2007 966,446Arising on acquisition of subsidiaries 16,748,212Exchange differences 2,089,606
At 31 March 2008 19,804,264
AmortisationAt 1 April 2006 966,446Charge for the year –
At 31 March/1 April 2007 966,446Charge for the year –
At 31 March 2008 966,446
Net book value
At 31 March 2008 18,837,818 At 31 March 2007 –
At 1 April 2006 –
The directors have carried out an impairment review of goodwill carried forward on the balance sheet for the acquisitions of Nordic Bioscience Diagnostics and Biocode Hycel. The directors believe that the future revenues and profitability expected from sales of both manual assays and those products sold on the automated platform the 3X3 are such that no impairment is necessary.
Growth in demand for the Companies’ products can be seen in the managing director’s report where reference is made to an independent report stating that growth in Vitamin D testing in France alone increased by 57% last year.

13 OTHER INTANGIBLE ASSETS
Patents and Development product costs technology Total £ £ £
CostAt 1 April 2006 – 1,125,496 1,125,496Additions – 347,964 347,964
At 31 March/1 April 2007 – 1,473,460 1,473,460Additions on acquisition of subsidiaries 5,906,836 16,028,316 21,935,152Exchange differences 978,422 2,411,368 3,389,790Additions 2,327,900 43,276 2,371,176Disposals – (18,033) (18,033)
At 31 March 2008 9,213,158 19,938,387 29,151,545
AmortisationAt 1 April 2006 – 39,830 39,830Charge for the year – 41,162 41,162
At 31 March/1 April 2007 – 80,992 80,992Exchange differences – 34,194 34,194Charge for the year 148,030 278,444 426,474
At 31 March 2008 148,030 393,630 541,660
Net book value
At 31 March 2008 9,065,128 19,544,757 28,609,885
At 31 March 2007 – 1,392,468 1,392,468
At 1 April 2006 – 1,085,666 1,085,666

14 SUBSIDIARIES
Details of the Companys’ subsidiaries at 31 March 2008 are as follows:
Proportion Proportion Place of of ownership of voting incorporation interest power held PrincipalName of subsidiary and operation % % activity
Immunodiagnostic Systems Limited England 100 100 manufacturing and distributing medical diagnostic productsImmunodiagnostic Systems Inc (1) USA 100 100 distribution of Group productsIDS GmbH (1) Germany 100 100 distribution of Group productsIDS Eurl (1) France 100 100 distribution of Group productsSuomen Bioanalytiikka Oy (SBA Sciences Ltd) (1) (3) Finland 100 100 Research and developmentBriefvision Limited (1) England 100 100 non-tradingPhabia Limited England 100 100 non-tradingNordic Bioscience Diagnostics A/S Denmark 100 100 manufacturing and distributing bone and arthritic diagnostic test kitsBiocode Hycel SA Belgium 99.93 99.93 manufacturing and distributing diagnostic test kits and automated instrumentsBiocode Hycel France SA (2) France 99.93 99.93 manufacturing and distributing diagnostic test kits and automated instruments
(1) 100% subsidiary of Immunodiagnostic Systems Limited.(2) 100% subsidiary of Biocode Hycel SA.(3) The purchase agreement included contingent consideration of !600,000, payment of which will become due following the outcome of
certain future events. At present the directors believe the outcome cannot be reliably estimated.
!1. 300,000 following approval of 510k status from the US Federal Drug Administration for TRAP products.!2. 300,000 following receipt of reimbursement status from US Medicare for the TRAP products.
The net profit and assets of the subsidiaries for the year ended 31 March 2008 were as follows:
Net assets/ Net profit/(loss) (liabilities)Name of subsidiary £ £
Immunodiagnostic Systems Limited 692,974 4,338,225Immunodiagnostic Systems Inc 269,417 437,210IDS GmbH 10,880 (228,888)IDS Eurl 79,393 23,829Suomen Bioanalytiikka Oy (SBA Sciences Ltd) 24,391 206,490Briefvision Limited – 10,000Phabia Limited – –Nordic Bioscience Diagnostics A/S 765,933 3,527,087Biocode Hycel SA (28,615) 8,224,960Biocode Hycel France SA (680,742) (1,139,854)

The net profit and assets of the subsidiaries for the year ended 31 March 2007 were as follows:
Net assets/ Net profit/(loss) (liabilities)Name of subsidiary £ £
Immunodiagnostic Systems Limited 1,464,709 4,030,991Immunodiagnostic Systems Inc 103,184 184,147IDS GmbH (60,853) (210,216)IDS Eurl 17,515 (52,551)Suomen Bioanalytiikka Oy (SBA Sciences Ltd) 21,311 154,439Briefvision Limited – 10,000Phabia Limited – –
The figures for net profit/loss and net assets/liabilities for the subsidiaries are as stated under the local accounting principles (local GAAP) applicable to each entity before adjusting for inclusion in these Consolidated Financial Statements.
15 INVESTMENTS
2008 2007 £ £
At 1 April 3,000 3,000Acquired in the year 696 –
At 31 March 3,696 3,000
The subsidiary Immunodiagnostic Systems Limited owns 41% (2007: 30%) of the issued share capital of Perinatal Diagnostics Limited, a company incorporated in England. The company has not traded during the period. The ompanys’ loss for the period was £3,433 relating to patent and other non-trading expenses, with capital and reserves of Perinatal Diagnostics Limited at £2,891 as at 31 March 2008.
The subsidiary Immunodiagnostic Systems Limited also owns 33% of the issued share capital of Pyrronostics Limited, a company incorporated in England. The principal activity of Pyrronostics Limited is that of a biomarker discovery company. The loss for the year ended 31 March 2008 was £5,038. The deficiency in capital and reserves of Pyrronostics Limited is £12,464 as at 31 March 2008.
The subsidiary Immunodiagnostic Systems Limited also owns a 18.75% shareholding in Palindromx Limited, a company incorporated in England. The principal activity of Palindromx Limited is that of research and development. The loss for the year ended 31 March 2008 was £35,881. The deficiency in capital and reserves of Palindromx Limited is £20,879 as at 31 March 2008.
The above investments are not treated as associated undertakings as they are not considered to be material to the Group.
16 INVENTORIES
2008 2007 £ £
Raw materials 3,264,807 467,499Work in progress 1,187,116 129,971Finished goods 1,769,974 317,170
6,221,897 914,640
Inventories are stated after charging a total of £145,812 (2007: £0) for impairment of inventories held by a subsidiary company acquired during the year, of which £173,616 relates to finished goods whereas provisions for raw materials and work in progress have decreased by £24,636 and £3,168 respectively in the period since acquisition.

17 OTHER FINANCIAL ASSETS
Other financial assets are made up of trade and other receivables and cash and cash equivalents.
Trade and other receivables are as follows:
2008 2007 £ £
Trade receivables 4,095,547 1,595,550VAT recoverable 32,700 –Other receivables 40,316 190,824Prepayments and accrued income 701,840 328,647
4,870,403 2,115,021Allowance accounts for trade receivables (107,267) (7,162)
4,763,136 2,107,859
The average credit period taken on sale of goods is 59 days (2007: 59 days). An allowance has been made for estimated irrecoverable amounts from sale of goods of £107,267 (2007: £7,162). This allowance has been based on the knowledge of the financial circumstances of individual debtors at the balance sheet date. Credit terms are negotiated individually for major customers; at the balance sheet date there are no material receivables which can be classified as overdue, other than those for which an allowance has been made.
There are no significant credit risks arising from financial assets that are neither past due nor impaired.
At 31 March 2008 £1,001,277 (2007: £1,483,268) of receivables were denominated in Sterling, £2,955,169 (2007: £476,351) in Euros, £409,800 (2007: £148,240) in US Dollars and £396,890 (2007: £0) in Danish Kroner.
The directors consider that the carrying amount of trade and other receivables approximates to their fair value.
Cash and cash equivalents of £2,973,452 (2007: £959,842) comprise cash and short-term deposits held by the Group treasury function. The carrying amount of these assets approximates to their fair value.
18 BORROWINGS
2008 Current Non-current £ £
Bank loans 3,284,958 9,741,971Obligations under hire purchase agreements 85,355 98,926
3,370,313 9,840,897
2007
Current Non-current £ £
Bank loans – –Obligations under hire purchase agreements 69,283 15,521
69,283 15,521

19 BANK LOANS
This relates entirely to bank loans denominated in Euros.
Bank loans are arranged at floating rates, thus exposing the Group to cash flow interest rate risk. The weighted average period until maturity was 5 years.
The directors estimate that the fair value of the Groups’ borrowings is not significantly different to the carrying value.
The bank holds an unlimited multilateral guarantee in respect of all Group companies, together with a debenture and fixed and floating charges over all tangible and intangible assets and uncalled share capital of the Company, both present and future.
20 OBLIGATIONS UNDER HIRE PURCHASE AGREEMENTS
Amounts payable under hire purchase agreements:
2008 2007 £ £
Within one year 85,355 69,283In the second to fifth year inclusive 98,926 15,521
184,281 84,804
It is the Groups’ policy to finance certain of its fixtures and equipment under hire purchase agreements. The average contract term is 3-4 years. For the year ended 31 March 2008 the average effective borrowing rate was approximately 10%. Interest rates are fixed at the contract date. All contracts are on a fixed repayment basis and are denominated in Sterling.
Amounts due under hire purchase agreements are secured over the assets financed.
The directors estimate that the fair value of the Groups’ obligations under hire purchase agreements is not significantly different to the carrying value.
21 OTHER FINANCIAL LIABILITIES
Trade and other payables are as follow: 2008 2007 £ £
Trade payables 2.047,638 607,211Other taxation and social security 617,467 96,026Other payables 468,902 217,125Accruals and deferred income 2,292,700 738,535
5,426,707 1,658,897
Trade and other payables principally comprise amounts outstanding for trade purchases and ongoing costs. The average credit period taken for trade purchases is 53 days (2007: 65 days).
At 31 March 2008 £1,101,356 (2007: £1,265,504) of payables were denominated in Sterling, £3,575,948 (2007: £327,999) in Euros, £241,346 (2007: £65,394) in US Dollars and £508,057 (2007: £0) in Danish Kroner.
The directors consider that the carrying amount of trade payables approximates to their fair value.

22 PENSIONS
The subsidiary Company operates a defined contribution scheme. The assets of the scheme are held separately from those of the Company in an independently administered fund. The pension cost charge represents contributions payable by the Company to the fund and amounted to £56,123 (2007: £46,609).
23 DEFERRED TAXATION
2008 2007 £ £ Provision brought forward 7,957 5,726
Profit and loss account movement arising during the year 146,929 25,190Deferred tax asset on share based payments charge (22,950) (22,959)
Total deferred tax 123,979 2,231
Deferred tax recognised on acquisition of subsidiaries 3,220,920 –Effect of exchange rate movements (237,325) –
Provision carried forward 3,115,531 7,957
The elements of deferred taxation are as follows:
2008 2007 £ £
Excess of taxation allowances over depreciation on fixed assets 6,313,456 22,101Other timing differences (93,102) 3,549Tax losses carried forward (3,104,823) –
3,115,531 25,650
24 PROVISIONS
Earn-out Other liability provisions total £ £ £
At 1 April 2006 – 27,140 27,140Movement in the year – – –
At 31 March/1 April 2007 – 27,140 27,140Movement in the year 5,100,683 – 5,100,683
At 31 March 2008 5,100,683 27,140 5,127,823
The earn-out liability relates to a commitment to pay the former shareholders of Biocode Hycel SA !10,000 for each 3X3 instrument placed by the Group by 31 December 2010. The provision is calculated using current sales forecasts and discounted using a discount rate of 8.9%. The directors have reviewed the assumptions at the balance sheet date and do not consider the current best estimate of the present value of the amount payable to be materially different to the amount in the Financial Statements.
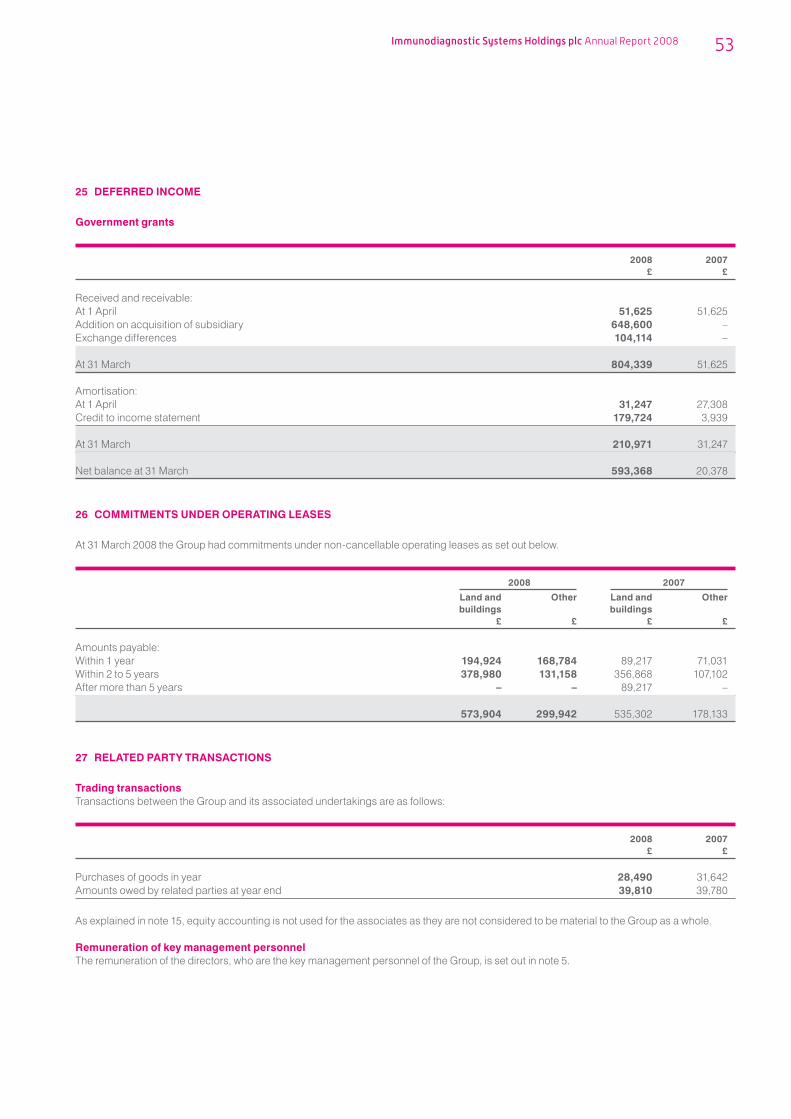
25 DEFERRED INCOME
Government grants
2008 2007 £ £
Received and receivable: At 1 April 51,625 51,625Addition on acquisition of subsidiary 648,600 –Exchange differences 104,114 –
At 31 March 804,339 51,625 Amortisation: At 1 April 31,247 27,308Credit to income statement 179,724 3,939
At 31 March 210,971 31,247 Net balance at 31 March 593,368 20,378
26 COMMITMENTS UNDER OPERATING LEASES
At 31 March 2008 the Group had commitments under non-cancellable operating leases as set out below.
2008 2007
Land and Other Land and Other buildings buildings £ £ £ £
Amounts payable: Within 1 year 194,924 168,784 89,217 71,031Within 2 to 5 years 378,980 131,158 356,868 107,102After more than 5 years – – 89,217 –
573,904 299,942 535,302 178,133
27 RELATED PARTY TRANSACTIONS
Trading transactionsTransactions between the Group and its associated undertakings are as follows:
2008 2007 £ £
Purchases of goods in year 28,490 31,642Amounts owed by related parties at year end 39,810 39,780
As explained in note 15, equity accounting is not used for the associates as they are not considered to be material to the Group as a whole.
Remuneration of key management personnelThe remuneration of the directors, who are the key management personnel of the Group, is set out in note 5.

28 SHARE CAPITAL
2008 2007 £ £
Equity Shares Authorised:75,000,000 (2007: 50,000,000) ordinary shares of £0.02 each 1,500,000 1,000,000
1,500,000 1,000,000
2008 2007 £ £
Allotted, called up and fully paid:Ordinary shares of £0.02 each 13,344,667 in issue at 1 April 266,893 266,8935,000,000 issued for cash at 240p 100,000 –2,783,300 issued in part consideration for shares in Nordic Bioscience Diagnostics A/S at 251.5p 55,666 –2,839,719 issued in part consideration for shares in Biocode Hycel SA at 216p 56,794 –5,000 were issued at 51p on the exercise of a share option 100 –
23,972,686 (2007: 13,344,667) in issue at 31 March 479,453 266,893
The total premium received on the issue of shares during the year was £24,608,041, after deducting expenses of £530,695.
29 SHARE PREMIUM
2008 2007 £ £ Balance brought forward 935,701 935,701Premium on shares issued during the year (net of expenses) 24,608,041
At 31 March 25,543,742 935,701
30 OTHER RESERVES
2008 2007 £ £
Merger reserve 582,999 582,999 Share based payments reserve: Balance brought forward 231,359 154,529Charge for the year 69,407 76,830
At 31 March 300,766 231,359 Currency translation reserve Balance brought forward (11,421) –Movement in the year 5,036,726 (11,421)
At 31 March 5,025,305 (11,421)
5,909,070 802,937
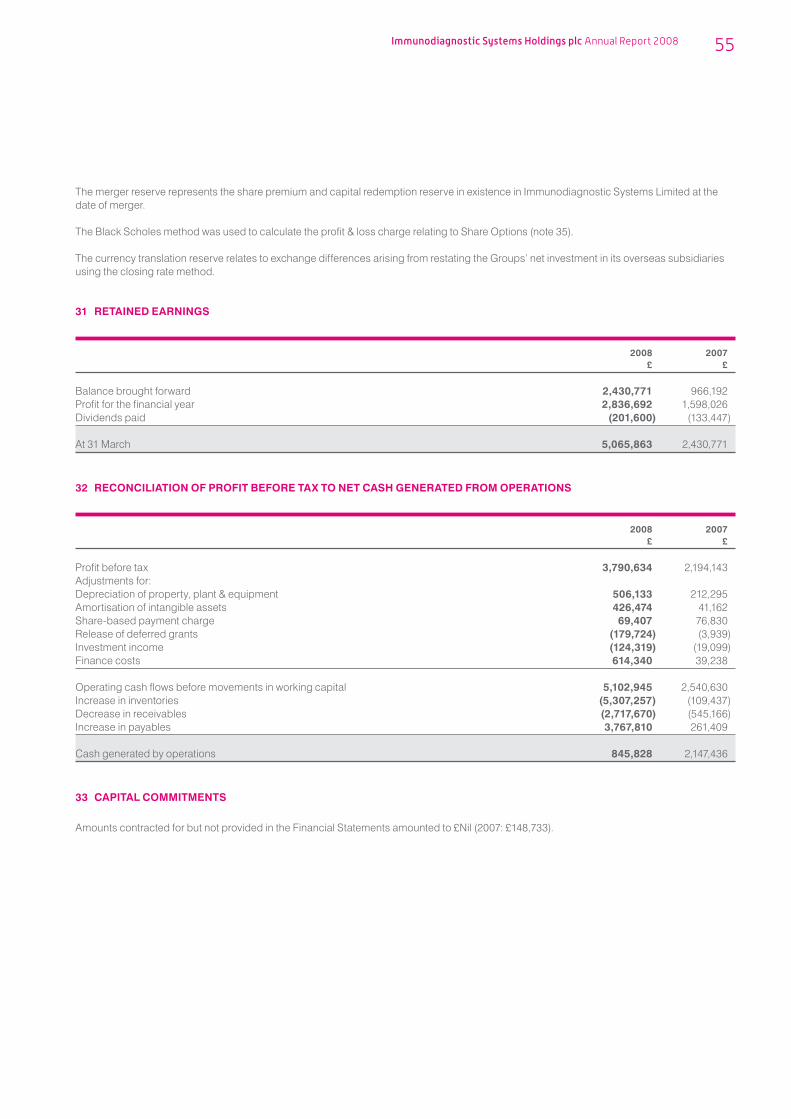
The merger reserve represents the share premium and capital redemption reserve in existence in Immunodiagnostic Systems Limited at the date of merger.
The Black Scholes method was used to calculate the profit & loss charge relating to Share Options (note 35).
The currency translation reserve relates to exchange differences arising from restating the Groups’ net investment in its overseas subsidiaries using the closing rate method.
31 RETAINED EARNINGS
2008 2007 £ £
Balance brought forward 2,430,771 966,192Profit for the financial year 2,836,692 1,598,026Dividends paid (201,600) (133,447)
At 31 March 5,065,863 2,430,771
32 RECONCILIATION OF PROFIT BEFORE TAX TO NET CASH GENERATED FROM OPERATIONS
2008 2007 £ £
Profit before tax 3,790,634 2,194,143Adjustments for: Depreciation of property, plant & equipment 506,133 212,295Amortisation of intangible assets 426,474 41,162Share-based payment charge 69,407 76,830Release of deferred grants (179,724) (3,939)Investment income (124,319) (19,099)Finance costs 614,340 39,238
Operating cash flows before movements in working capital 5,102,945 2,540,630Increase in inventories (5,307,257) (109,437)Decrease in receivables (2,717,670) (545,166)Increase in payables 3,767,810 261,409
Cash generated by operations 845,828 2,147,436
33 CAPITAL COMMITMENTS
Amounts contracted for but not provided in the Financial Statements amounted to £Nil (2007: £148,733).

34 ACQUISITIONS
The Group acquired 100% of the share capital of Nordic Bioscience Diagnostics A/S (NBD) and 99.93% of the share capital of Biocode Hycel S.A. (BCH) during the year. The book and fair values acquired were as follows:
NBD BCH
Fair value Fair value Book value adjustment Fair value Book value adjustment Fair value Total £ £ £ £ £ £ £
Intangible assets – 5,711,786 5,711,786 4,518,175 11,705,191 16,223,366 21,935,152Property, plant and equipment 14,497 – 14,497 1,380,845 64,961 1,445,806 1,460,303Inventories 596,364 329,951 926,315 3,659,866 – 3,659,866 4,586,181Receivables 1,173,528 – 1,173,528 6,071,827 – 6,071,827 7,245,355Cash and cash equivalents 1,228,156 – 1,228,156 (16,722) – (16,722) 1,211,434Payables (726,935) – (726,935) (12,325,708) 1,220,637 (11,105,071) (11,832,006)Deferred tax – (1,359,182) (1,359,182) – (1,861,738) (1,861,738) (3,220,920)
2,285,610 4,682,555 6,968,165 3,288,283 11,129,051 14,417,334 21,385,499
Goodwill 11,790,789 4,957,423 16,748,212
Consideration 18,758,954 19,374,757 38,133,711
Consideration satisfied by Shares 6,902,584 7,465,725 14,368,309Cash (including expenses) 11,856,370 6,808,349 18,664,719Earn-out provision – 5,100,683 5,100,683
18,758,954 19,374,757 38,133,711
The consideration for the acquisition of NBD was partially satisfied by the issue of 2,783,000 ordinary shares of 2p each and the consideration for the acquisition of BCH was partially satisfied by the issue of 2,839,719 ordinary shares of 2p each, the shares being valued at the market bid price on the date of acquisition, being 248p and 227p respectively.
The earn-out provision (see note 24) represents consideration contingent on future sales of the automated instrument being developed by BCH in the period to 31 December 2010. This amount represents the best estimate at the date of acquisition of the present value of the consideration payable.
The fair values of the individual assets and liabilities acquired have been determined on the basis of market values as at the respective acquisition date.
Nordic Bioscience Diagnostics A/S contributed £2,556,292 of revenue and £1,596,108 of net profit for the period between the date of acquisition, 30 June 2007, and the balance sheet date. If this acquisition had occurred on 1 April 2007, the contribution to Group revenue would have been £2,518,014 and net profit £2,177,603.
The goodwill is attributable to the synergies that arise in the post acquisition period and access to the acquired Companys’ market and product range. The value of these benefits was not recognised as a separable intangible asset on the basis that it could not be separated from the value generated by the business as a whole.
Biocode Hycel S.A and its subsidiary Biocode Hycel France S.A contributed £4,454,090 of revenue and £650,156 of net loss for the period between the date of acquisition, 31 August 2007, and the balance sheet date. If this acquisition had occurred on 1 April 2007, the contribution to Group revenue would have been £7,845,901 and net loss £2,187,866.

35 SHARE BASED PAYMENTS
The Group has granted options, which remain exercisable, to subscribe for ordinary shares of £0.02 each, as follows:
Period within Number of shares which options for which rights are exercisable are exercisable
Grant Date Exercise Price From To 2007 2008
Share Options Agreements 2005 51p 22.12.07 22.12.14 346,962 341,962Unapproved Scheme 2005 51p 22.12.07 22.12.14 541,970 541,970 2007 241.5p 03.09.10 03.09.17 – 90,970 2008 189.5p 25.03.11 25.03.18 – 814,631EMI Share Scheme 2005 51p 22.12.07 22.12.14 625,685 558,962 2007 116.5p 29.09.09 29.09.16 40,000 40,000 2007 241.5p 03.09.10 03.09.17 – 41,407 2008 189.5p 25.03.11 25.03.18 – 52,770SAYE 2006 65p 01.07.08 01.01.11 158,998 158,998 2007 212p 01.02.10 01.08.10 37,166 37,166Total 1,750,781 2,678,836
The market price of the shares at 31 March 2008 was 173p and the range during the year was 173p to 300p.
Options may normally be exercised in whole or part within the period of three to ten years after the date of the grant, and then only if the performance conditions attached to the options have been satisfied. The share options granted will only be exercisable upon the achievement of the performance criteria.
Share Option AgreementsThe following share options are held by directors of the Company:
Exercise Date from Options Options price which at 01.04.07 at 31.03.08 (pence) exercisable Expiry date
D. Evans 333,617 333,617 51p 22.12.07 22.12.14
Enterprise Management Initiative SchemeThe Company operates a share option scheme under the Enterprise Management Initiative Scheme (‘EMI’). The following share options are held by directors of the Company:
Options Exercise Date from Options granted Options price which at 01.04.07 in year at 31.03.08 (pence) exercisable Expiry date
R Duggan 196,078 – 196,078 51p 22.12.07 22.12.14P Hailes 196,078 – 196,078 51p 22.12.07 22.12.14M Garrity – 41,407 41,407 241.5p 03.09.10 03.09.17I Cookson – 52,770 52,770 189.5p 25.03.11 25.03.18
Approved Share Option SchemeOptions are granted at the discretion of the Board to employees and full time directors of the Group, save that options will not be granted to individuals due to retire within six months or those individuals who have a material interest in a Company within the Group. No share options were granted under this scheme during the year.

35 SHARE BASED PAYMENTS (CONTINUED)
Unapproved Share Option Scheme
Options Exercise Date from Options granted Options price which at 01.04.07 in year at 31.03.08 (pence) exercisable Expiry date
R Duggan 137,539 – 137,539 51p 22.12.07 22.12.14P Hailes 137,539 – 137,539 51p 22.12.07 22.12.14A Wilks 133,446 – 133,446 51p 22.12.07 22.12.14M Garrity – 90,970 90,970 241.5p 03.09.10 03.09.17I Cookson – 280,847 280,847 189.5p 25.03.11 25.03.18A Rousseau – 133,446 133,446 189.5p 25.03.11 25.03.18
Performance conditions in relation to the Share Option Agreements, the EMI scheme, the Approved Share Option Scheme and the Unapproved Share Option Scheme are:Exercise of an option will be dependent upon the achievement by the Company of a specified threshold of earnings per share (‘EPS’) growth (calculated after excluding amortisation of goodwill, gains and losses on the disposal of assets, changes resulting from the expensing of options through the profit and loss account and any extraordinary or exceptional items at the discretion of the Remuneration Committee) in excess of the growth in Retail Price Index over a three or more years performance period (the ‘Performance Period’). For an option to become exercisable in full, the growth in EPS of the Company over the Performance Period must exceed the growth in Retail Price Index over the same period by a specified percentage. If the excess is 15 percent or greater in respect of the first three years of the Performance Period then the performance condition is met. Where the performance condition is not met then the Performance Period is extended one financial year at a time and the growth in EPS is increased by five percent for each financial year while the options remain in existence until the performance condition as so increased has been met. As soon as the performance condition is met the options vest in their entirety and become exercisable in whole or in part at any time, subject to the rules of the IDS Approved Share Option Scheme.
SAYE Share Option SchemeThe SAYE Share Option Scheme is an all employee share scheme; no share options were granted under this scheme during the year.
All UK employees or full time UK directors of the Group who have worked for a minimum period as the Board determines are eligible to participate in the IDS SAYE Share Option Scheme, as long as they do not have a material interest in the Company or a participating Company.
Share Based PaymentsThe number of share options in existence during the year was as follows:
2008 2007
Weighted Weighted Number of average Number of average share options exercise price share options exercise price
At 1 April 1,750,781 57p 1,872,715 57pGranted during the year 999,778 196p 77,166 162pForfeited during the year 66,723 51p 199,100 95pExercised during the year 5,000 51p – –
Outstanding at 31 March 2,678,836 109p 1,750,781 57p
Exercisable at 31 March 1,442,894 51p – –

Options were valued using the Black-Scholes option pricing model. The fair value per option granted and the assumptions used in the calculation were as follows:
2008 2007 Risk free interest rate 6.0% 5.5% Expected volatility 45.7% 40.1%Expected option life in years 3 years 3 yearsExpected dividend yield 3% 3%Weighted average share price 195p 183pWeighted average exercise price 196p 162pWeighted average fair value of options granted 59p 59p
Expected volatility was determined by calculating the historical volatility of the Groups’ share price over the previous 3 years. The expected life used in the model has been adjusted, based on management’s best estimate, for the effects of non-transferability, exercise restrictions and behavioural considerations.
The weighted average fair value of options granted in the year was £594,819 (2007: £45,285).
During 2008, the Group recognised total share-based payment expenses of £69,407 (2007: £76,830) of which £69,407 (2007: £76,830) related to equity-settled share-based payment transactions. After deferred tax the charge was £49,973 (2007: £53,871).
36 FINANCIAL RISK MANAGEMENT
The Groups’ financial instruments comprise bank overdraft facility, cash and short-term deposits. The Group has various other financial instruments, such as trade debtors and creditors that arise directly from its operations, which have been excluded from the disclosures, other than the currency disclosures.
The main risks arising from the Groups’ financial instruments are interest rate risk, liquidity risk and foreign currency risk. The policies for managing these are regularly reviewed and agreed by the Board.
It is, and has been throughout the year under review, the Groups’ policy that no trading in financial instruments shall be undertaken.
Interest rate riskThe Group finances its operations by a mixture of retained profits and bank borrowings. The Groups’ policy on interest rate management is agreed at Board level and is reviewed on an ongoing basis. The interest rates applying to the existing hire purchase commitments of £184,281 is fixed at between 8% and 13%.
Interest rate profileThe Group has no financial assets, excluding short-term debtors, other than sterling cash deposits of £1,894,744 (2007: £72,637), euro cash deposits of £949,150 (2007: £208,183) and US dollar cash deposits of £129,558 (2007: £446,307) which are part of the financing arrangements of the Group.
The interest rate profile of the Groups’ financial liabilities at 31 March 2008 was as follows:
2008 2007
Total Floating Fixed Total Floating FixedCurrency £000 £000 £000 £000 £000 £000 Sterling – Borrowings 184 – 184 85 – 85 Euro – Borrowings 13,027 13,027 – – – –
13,211 13,027 184 85 – 85

36 FINANCIAL RISK MANAGEMENT (CONTINUED)
Liquidity riskAs regards liquidity, the Groups’ policy throughout the year has been to ensure continuity of funding by means of generated funds supported by the Groups’ bankers and raising capital. The Group is cash positive in its operations and is expected to be for the foreseeable future. Facilities are reviewed regularly by the Board, which will consider carefully liquidity risk for any future acquisitions.
Short term flexibility is achieved by overdraft facilities.
Foreign currency riskThe Group has subsidiaries, which operate in the USA and continental Europe. Their revenues and expenses are denominated substantially in US dollars and euros. In order to protect the Groups’ sterling balance sheet from the movements in these currencies and the sterling exchange rate, the Group finances its net investment in these subsidiaries by means of borrowings in their respective functional currencies.
At the balance sheet date the Group had a loan denominated in Euro’s of £11,118,297 (2007: £0) outstanding which has been designated as a hedge against the net investment in a subsidiary company. An exchange loss arising from the hedge during the year amounting to £1,537,878 has been deferred in equity and will be recognised in the income statement as and when the loan is repaid.
The table below shows the Groups’ currency exposure, being those transactional exposures that give rise to the net currency gains and losses recognised in the profit and loss account. Such exposures comprise the monetary assets and monetary liabilities of the Group that are not denominated in the operating (or ‘functional’) currency of the operating unit involved. At 31 March 2008 these exposures are as follows:
Net foreign currency monetary assets/(liabilities)
Functional currency of Group operation Sterling US Dollar Euro SEK Total £000 £000 £000 £000 £000 Sterling – 377 240 – 617DKK (22) 239 387 (5) 599
(22) 616 627 (5) 1,216
The exposures at 31 March 2007 for comparison purposes were as follows:
Net foreign currency monetary assets/(liabilities)
Functional currency of Group operation Sterling US Dollar Euro Total £000 £000 £000 £000 Sterling – 289 195 484 – 289 195 484
The maturity profile of the Groups’ financial liabilities at 31 March was as follows:
2008 2007 £ £
In one year or less 85,355 69,283In more than one years but not more than five years 98,926 15,521
184,281 84,804
Borrowing facilitiesThe Group had no undrawn committed borrowing facilities at 31 March 2008.
Fair valuesThere are no material differences between the fair value of financial instruments and the amount at which they are stated in the Financial Statements.

37 OTHER OPERATING INCOME
In the year ended 31 March 2007, Immunodiagnostic Systems Limited received non-recurring income of £127,486 in relation to product development.
38 CONTINGENT LIABILITIES
Biocode Hycel SA has received a grant from the Walloon Regional Government, which may become repayable in the future. The amount and timing of any repayment is dependent on the Companys’ future revenues and, at present, can not be reliably determined. The grant will become repayable if and when the product which is being developed and for which the grant was received enters commercial production, and will be repaid as a percentage of the revenue generated from the project. The maximum potential repayment is approximately £2.7m. Included in the net book value of deferred income of £593,368 (see note 25) is an amount of £576,929 (2007: £0) relating to the portion of this grant which has not yet been released to the income statement.
The subsidiary Biocode Hycel France SA is party to a collective agreement under which employees leaving the company to enter retirement are entitled to a payment equivalent to one-tenth of a month’s salary for each year of service with the company. No payment is made to employees leaving the companys’ employment for other reasons. The present value of the potential liability to current employees as at 31 March 2008 is approximately £300,000. No provision has been made for this amount in these Financial Statements as the directors consider retirement, a future event, to be the event giving rise to the obligation.
39 POST BALANCE SHEET EVENTS
There are no material events after the balance sheet date which are required to be disclosed in the Financial Statements.
40 TRANSITION TO INTERNATIONAL FINANCIAL REPORTING STANDARDS
Immunodiagnostic Systems PLC is adopting International Financial Reporting Standards (IFRS) for its Group accounts for the financial year ending 31 March 2008. Previously the Group has applied United Kingdom generally accepted accounting principles (UK GAAP). These Financial Statements are the Groups’ first published annual report and accounts under IFRS.
Summary of IFRS impactThe areas of accounting that are most significantly impacted are:
The treatment of purchased goodwill. Accounting for business combinations. Deferred taxation.
The following table summarises the impact of the adoption on the Groups’ profit for the year ended 31 March 2007.
2007 £
Profit before tax as reported under UK GAAP 2,189,006 IFRS adjustments Reversal of goodwill amortisation 8,053Holiday pay accrued (1,533)Treatment of associates as investments (1,383)
Profit before tax as reported under IFRS 2,194,143

40 TRANSITION TO INTERNATIONAL FINANCIAL REPORTING STANDARDS (CONTINUED)
The impact on total equity (and net assets) at 31 March 2006 and 31 March 2007 is shown in the table below:
2006 2007 £ £
Net assets as previously reported under UK GAAP 2,867,727 4,434,302Prior year adjustment in accounts to 31 March 2007 46,449 –
Net assets under UK GAAP as restated 2,914,176 4,434,302 IFRS adjustments Elimination of share of associates’ net liabilities 13,501 12,118Impairment of goodwill (8,053) –Holiday pay accrued (22,257) (23,790)Deferred tax 6,677 7,137
2,904,044 4,429,767
The treatment of associates under IFRS requires the Group to derecognise their share of net liabilities and the corresponding entry in the income statement. Based on the directors’ assessment of the resultant immaterial impact on the accounts and their expectations for the future activities of these investments, they consider they should be treated as simple investments, recorded in the balance sheet at their original cost less impairment.
The carrying value of the goodwill at transition of £8,053 was written off on transition as the directors considered that future cash flows could not be identified from the acquired business which would support the ongoing carrying value. The intangible asset acquired as part of the acquired business is considered to generate all the ongoing net cash inflows which supports the carrying value of that intangible asset.
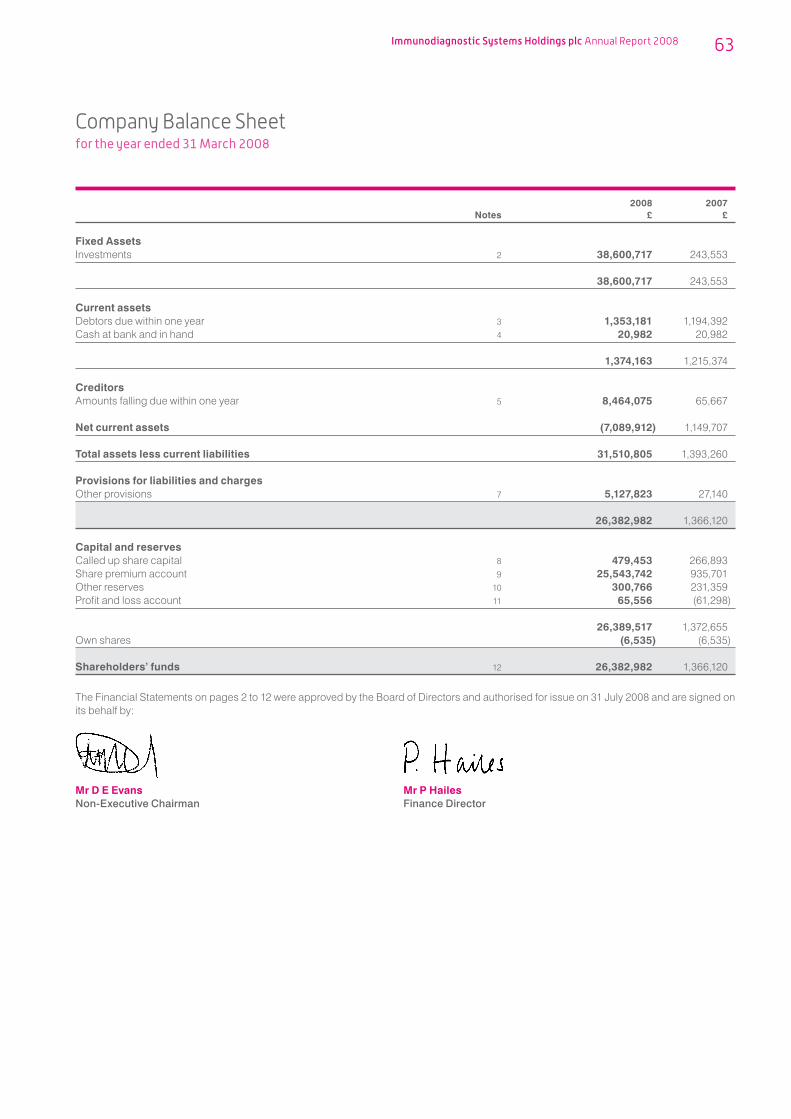
2008 2007 Notes £ £
Fixed AssetsInvestments 2 38,600,717 243,553
38,600,717 243,553
Current assetsDebtors due within one year 3 1,353,181 1,194,392Cash at bank and in hand 4 20,982 20,982
1,374,163 1,215,374
Creditors Amounts falling due within one year 5 8,464,075 65,667
Net current assets (7,089,912) 1,149,707
Total assets less current liabilities 31,510,805 1,393,260
Provisions for liabilities and chargesOther provisions 7 5,127,823 27,140
26,382,982 1,366,120
Capital and reservesCalled up share capital 8 479,453 266,893Share premium account 9 25,543,742 935,701Other reserves 10 300,766 231,359Profit and loss account 11 65,556 (61,298)
26,389,517 1,372,655Own shares (6,535) (6,535)
Shareholders’ funds 12 26,382,982 1,366,120
The Financial Statements on pages 2 to 12 were approved by the Board of Directors and authorised for issue on 31 July 2008 and are signed on its behalf by:
Mr D E Evans Mr P HailesNon-Executive Chairman Finance Director

1 ACCOUNTING POLICIES
a) Basis of accountingThe Financial Statements have been prepared under the historical cost convention and in accordance with applicable accounting standards generally accepted in the United Kingdom (UK GAAP). The Company Financial Statements are presented separately to the consolidated Financial Statements which have been prepared under International Financial Reporting Standards (IFRS) as adopted by the European Union.
b) InvestmentsFixed asset investments are stated at cost after making provision for any impairment in the value.
c) Pension costsA subsidiary operates a defined contribution pension scheme of which employees of the Companies are members. The assets of the scheme are held separately from those of the subsidiary. The annual contributions payable are charged to the profit and loss account.
d) Deferred taxationDeferred tax is recognised in respect of all timing differences that have originated but not reversed at the balance sheet date where transactions or events that result in an obligation to pay more tax in the future or a right to pay less tax in the future have occurred at the balance sheet date. Timing differences are differences between the Companys’ taxable profits and its results as stated in the Financial Statements that arise from the inclusion of gains and losses in tax assessments in periods different from those in which they are recognised in the Financial Statements.
Deferred tax is measured at the average tax rates that are expected to apply in the periods in which timing differences are expected to reverse, based on tax rates and laws that have been enacted or substantively enacted by the balance sheet date. Deferred tax is measured on a non-discounted basis.
e) Foreign currenciesAssets and liabilities in foreign currencies are translated into sterling at the rates of exchange ruling at the balance sheet date. Transactions in foreign currencies are translated into sterling at the rate of exchange ruling at the date of the transaction. Exchange differences are taken into account in arriving at the operating profit.
f) Employee benefit trustAssets held in the Employee Benefit Trust are recognised in the Financial Statements of the Company until they vest unconditionally in identified beneficiaries.
The consideration paid for the Companys’ own shares is deducted in arriving at shareholders funds, where the shares have not vested unconditionally in the employees. When unconditional awards are made to employees the cost recognised is the fair value of the shares at the date of the award, which is spread over the period to which the employee’s performance relates, in accordance with FRS 20.
g) Share-based paymentsThe Company has applied the requirements of FRS 20 Share-based Payments. In accordance with the transitional provisions, FRS 20 has been applied to all grants of equity instruments after 7 November 2002 that were unvested at 1 April 2006.
The Company issues equity-settled and cash-settled share-based payments to certain employees. Equity-settled share-based payments are measured at fair value at the date of grant. The fair value determined at the grant date of equity-settled share-based payments is expensed on a straight-line basis over the vested period, based on the Groups’ estimate of shares that will eventually vest.
The fair value is measured by the use of the Black-Scholes option price model. The expected life used in the model has been adjusted, based on management’s best estimate, for the effect of non-transferability, exercise restrictions, and behavioural considerations.
A liability equal to the portion of the goods or services received is recognised at the current fair value determined at each balance sheet date for cash-settled share-based payments. Changes in fair value are recognised through the profit and loss account.

2 INVESTMENTS
Investment in subsidiary undertakingsCost £ At 31 March 2007 243,553Acquisition of subsidiary undertakings 38,342,904Share options to subsidiaries’ employees 14,260
At 31 March 2008 38,600,717
Net book value
At 31 March 2008 38,600,717
At 31 March 2007 243,553
The Company owns 100% of the issued ordinary share capital and voting rights of Immunodiagnostic Systems Limited, a company incorporated in England. The Company is unlisted. The results of the subsidiary and its subsidiaries have been consolidated within the Group accounts. The principal activity of the Company during the year was that of manufacturing and distributing medical diagnostic products. The Company is also actively involved in research and development projects.
During the year, the Company acquired 100% of the share capital of Nordic Bioscience Diagnostics A/S, a company incorporated in Denmark The Company is unlisted. The results of the subsidiary have been consolidated within the Group accounts from the date of acquisition. The principal activity of the Company during the year was that of manufacturing and distributing bone and arthritic diagnostic test kits. The Company is also actively involved in research and development projects.
During the year, the Company acquired 99.93% of the share capital of Biocode Hycel SA, a company incorporated in Belgium. The Company is unlisted. The results of the subsidiary and its subsidiary have been consolidated within the Group accounts from the date of acquisition. The principal activity of the Company during the year was that of manufacturing and distributing diagnostic test kits and automated instruments. The Company is also actively involved in research and development projects.
3 DEBTORS
2008 2007 £ £
Amounts owed by Group undertakings 1,279,931 1,145,164Other debtors 500 500Prepayments and accrued income 10,357 9,285Deferred tax asset (see note 6) 62,393 39,443
1,353,181 1,194,392
Included within other debtors is £500 (2007: £500) held by the Employee Benefit Trust. These assets are for the benefit of qualifying employees only.
4 CASH AT BANK AND IN HAND
2008 2007 £ £
Bank deposit account 20,982 20,982
Included in the bank deposit account is £20,982 (2007: £20,982) held by the Employee Benefit Trust. These assets are for the benefit of qualifying employees only.
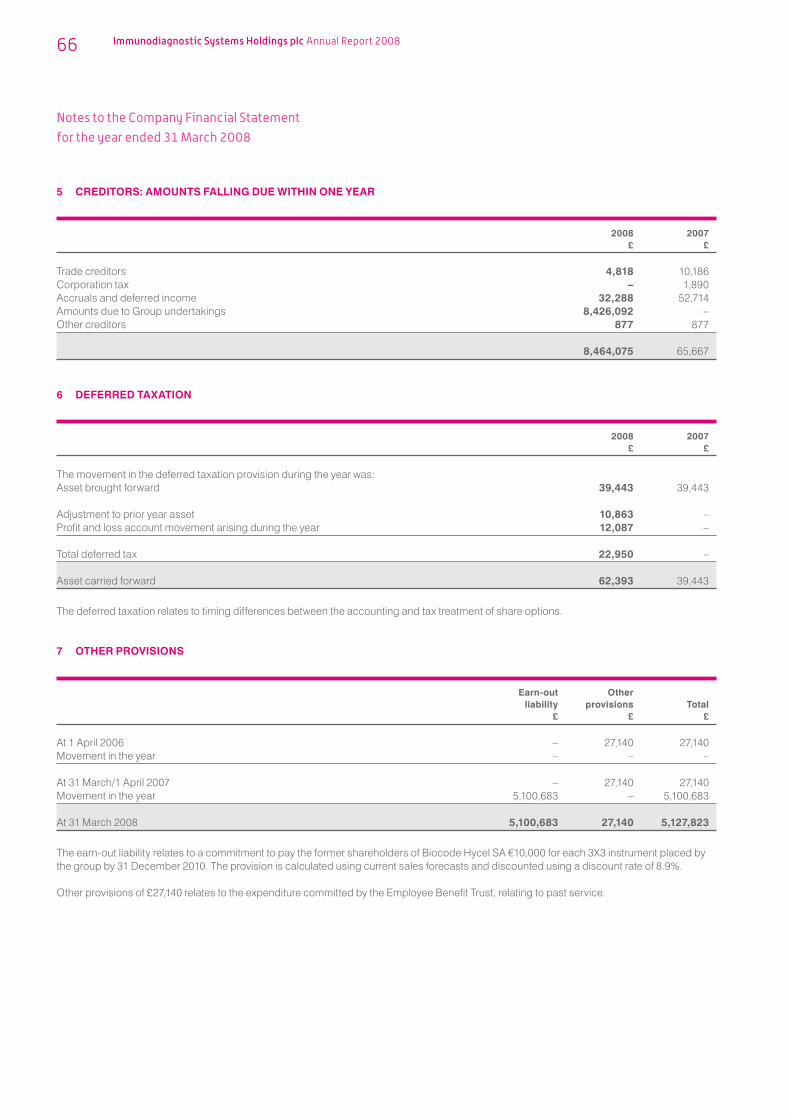
5 CREDITORS: AMOUNTS FALLING DUE WITHIN ONE YEAR
2008 2007 £ £
Trade creditors 4,818 10,186Corporation tax – 1,890Accruals and deferred income 32,288 52,714Amounts due to Group undertakings 8,426,092 –Other creditors 877 877
8,464,075 65,667
6 DEFERRED TAXATION
2008 2007 £ £
The movement in the deferred taxation provision during the year was:Asset brought forward 39,443 39,443
Adjustment to prior year asset 10,863 –Profit and loss account movement arising during the year 12,087 –
Total deferred tax 22,950 –
Asset carried forward 62,393 39,443
The deferred taxation relates to timing differences between the accounting and tax treatment of share options.
7 OTHER PROVISIONS
Earn-out Other liability provisions Total £ £ £
At 1 April 2006 – 27,140 27,140Movement in the year – – –
At 31 March/1 April 2007 – 27,140 27,140Movement in the year 5,100,683 – 5,100,683
At 31 March 2008 5,100,683 27,140 5,127,823
The earn-out liability relates to a commitment to pay the former shareholders of Biocode Hycel SA !10,000 for each 3X3 instrument placed by the group by 31 December 2010. The provision is calculated using current sales forecasts and discounted using a discount rate of 8.9%.
Other provisions of £27,140 relates to the expenditure committed by the Employee Benefit Trust, relating to past service.

8 SHARE CAPITAL
2008 2007 £ £
Equity Shares Authorised:75,000,000 (2007: 50,000,000) Ordinary shares of £0.02 each 1,500,000 1,000,000
1,500,000 1,000,000
2008 2007 £ £
Allotted, called up and fully paid:23,972,686 (2007: 13,344,667) Ordinary shares of £0.02 each 479,453 266,893
479,453 266,893
During the year the Company issued a total of 10,628,019 ordinary shares of 2p each, of which 5,000,000 were issued for cash at 240p, 2,783,300 were issued in part consideration for shares in Nordic Bioscience Diagnostics A/S at 251.5p, 2,839,719 were issued in part consideration for shares in Biocode Hycel SA at 216p and 5,000 were issued at 51p on the exercise of a share option. The total premium received on the issue of shares during the year was £24,608,041, after deducting share issue expenses of £530,695.
9 SHARE PREMIUM
2008 2007 £ £ Balance brought forward 935,701 935,701Premium on shares issued during the year 24,608,041 –
At 31 March 25,543,742 935,701
10 OTHER RESERVES
2008 2007 £ £
Shares to be issued Balance brought forward 231,359 154,529Charge for the year 69,407 76,830
At 31 March 300,766 231,359
The Black Scholes method was used to calculate the profit & loss charge relating to Share Options.

11 PROFIT AND LOSS ACCOUNT
2008 2007 £ £
Balance brought forward (61,298) (84,563)Profit for the financial year 328,454 156,712Dividends paid (201,600) (133,447)
At 31 March 65,556 (61,298)
12 RECONCILIATION OF MOVEMENTS IN SHAREHOLDERS’ FUNDS
2008 2007 £ £ Profit for the financial period 328,454 156,712Dividends Paid (201,600) (133,447)Share based payments charged to equity reserve 69,407 76,830
196,261 100,095
Issue of shares 24,820,601 –Gift of shares to employees by EBT – (4,265)
Net addition to shareholders’ funds 25,016,862 95,830Opening shareholders’ equity funds (as previously reported) 1,366,120 1,207,795Prior year adjustment – 62,495
Opening shareholders’ funds as restated 1,366,120 1,270,290 Closing shareholders’ funds 26,382,982 1,366,120
Total Shareholders’ Funds 26,382,982 1,366,120
13 ACQUISITIONS
Effective 30 June 2007, the Company acquired 100% of the share capital of Nordic Bioscience Diagnostics A/S, a company incorporated in Denmark, by means of a share exchange and a cash payment. The results of the subsidiary have been consolidated within the Group accounts from the date of acquisition.
Effective 31 August 2007, the Company acquired 99.93% of the share capital of Biocode Hycel SA, a company incorporated in Belgium, and its 100% subsidiary, Biocode Hycel France SA by means of a share exchange and a cash payment. The results of the subsidiary and its subsidiary have been consolidated within the Group accounts from the date of acquisition.

14 SHARE BASED PAYMENTS
The Company has granted options, which remain exercisable, to subscribe for ordinary shares of £0.02 each, as follows:
Period within Number of shares which options for which rights are exercisable are exercisable
Grant Date Exercise Price From To 2007 2008
Share Options Agreements 2005 51p 22.12.07 22.12.14 346,962 341,962Unapproved Scheme 2005 51p 22.12.07 22.12.14 541,970 541,970 2007 241.5p 03.09.10 03.09.17 – 90,970 2008 189.5p 25.03.11 25.03.18 – 814,631EMI Share Scheme 2005 51p 22.12.07 22.12.14 392,156 392,156 2007 241.5p 03.09.10 03.09.17 – 41,407 2008 189.5p 25.03.11 25.03.18 – 52,770SAYE 2006 65p 01.07.08 01.01.11 26,440 26,440
Total 1,307,528 2,302,306
The market price of the shares at 31 March 2008 was 173p and the range during the year was 173p to 300p.
Options may normally be exercised in whole or part within the period of three to ten years after the date of the grant, and then only if the performance conditions attached to the options have been satisfied.
The share options granted will only be exercisable upon the achievement of the performance criteria. Share Option AgreementsThe following share options are held by directors of the Company:
Exercise Date from Options Options price which at 01.04.07 at 31.03.08 (pence) exercisable Expiry date
D Evans 333,617 333,617 51p 22.12.07 22.12.14
Enterprise Management Initiative SchemeThe Company operated a share option scheme under the Enterprise Management Initiative Scheme (‘EMI’). The following share options are held by directors of the Company:
Options Exercise Date from Options granted Options price which at 01.04.07 in year at 31.03.08 (pence) exercisable Expiry date
R Duggan 196,078 – 196,078 51p 22.12.07 22.12.14P Hailes 196,078 – 196,078 51p 22.12.07 22.12.14M Garrity – 41,407 41,407 241.5p 03.09.10 03.09.17I Cookson – 52,770 52,770 189.5p 25.03.11 25.03.18
Approved Share Option SchemeOptions are granted at the discretion of the Board to employees and full time directors of the Group, save that options will not be granted to individuals due to retire within six months or those individuals who have a material interest in a Company within the Group. No share options were granted under this scheme during the year.

14 SHARE BASED PAYMENTS (CONTINUED)
Unapproved Share Option Scheme
Options Exercise Date from Options granted Options price which at 01.04.07 in year at 31.03.08 (pence) exercisable Expiry date
R Duggan 137,539 – 137,539 51p 22.12.07 22.12.14P Hailes 137,539 – 137,539 51p 22.12.07 22.12.14A Wilks 133,446 – 133,446 51p 22.12.07 22.12.14M Garrity 90,970 90,970 90,970 241.5p 03.09.10 03.09.17I Cookson 280,847 280,847 280,847 189.5p 25.03.11 25.03.18A Rousseau 133,446 133,446 133,446 189.5p 25.03.11 25.03.18
Performance conditions in relation to the Share Option Agreements, the EMI scheme, the Approved Share Option Scheme and the Unapproved Share Option Scheme are:Exercise of an option will be dependent upon the achievement by the Company of a specified threshold of earnings per share (‘EPS’) growth (calculated after excluding amortisation of goodwill, gains and losses on the disposal of assets, changes resulting from the expensing of options through the profit and loss account and any extraordinary or exceptional items at the discretion of the Remuneration Committee) in excess of the growth in Retail Price Index over a three or more years performance period (the ‘Performance Period’). For an option to become exercisable in full, the growth in EPS of the Company over the Performance Period must exceed the growth in Retail Price Index over the same period by a specified percentage. If the excess is 15 percent or greater in respect of the first three years of the Performance Period then the performance condition is met. Where the performance condition is not met then the Performance Period is extended one financial year at a time and the growth in EPS is increased by five percent for each financial year while the options remain in existence until the performance condition as so increased has been met. As soon as the performance condition is met the options vest in their entirety and become exercisable in whole or in part at any time, subject to the rules of the IDS Approved Share Option Scheme.
SAYE Share Option SchemeThe SAYE Share Option Scheme is an all employee share scheme.
All UK employees or full time UK directors of the Company who have worked for a minimum period as the Board determines are eligible to participate in the IDS SAYE Share Option Scheme, as long as they do not have a material interest in the Company or a participating Company.
The number of share options in existence during the year was as follows:
2008 2007
Weighted Weighted Number of average Number of average share options exercise price share options exercise price
At 1 April 1,439,905 57p 1,439,905 57pGranted during the year 999,778 196p – –Forfeited during the year – – 132,377 57pExercised during the year 5,000 51p – –
Outstanding at 31 March 2,302,306 109p 1,307,528 57p
Exercisable at 31 March 1,276,088 51p – –
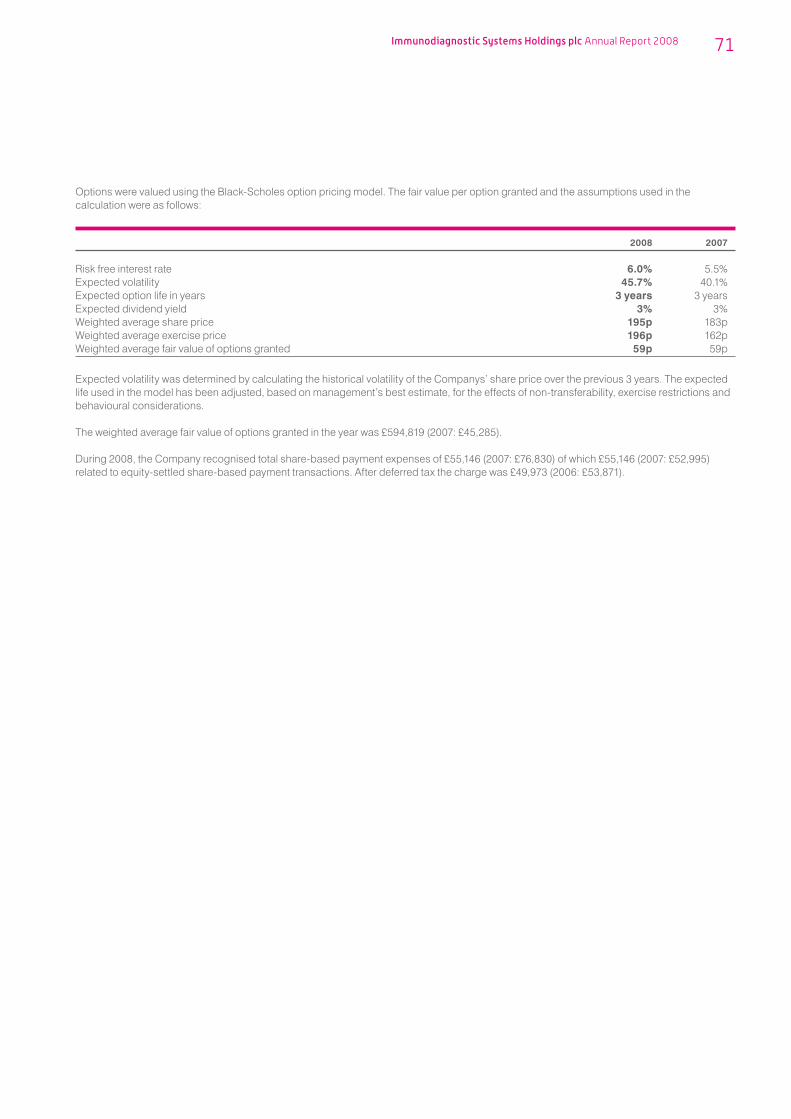
Options were valued using the Black-Scholes option pricing model. The fair value per option granted and the assumptions used in the calculation were as follows:
2008 2007 Risk free interest rate 6.0% 5.5% Expected volatility 45.7% 40.1%Expected option life in years 3 years 3 yearsExpected dividend yield 3% 3%Weighted average share price 195p 183pWeighted average exercise price 196p 162pWeighted average fair value of options granted 59p 59p
Expected volatility was determined by calculating the historical volatility of the Companys’ share price over the previous 3 years. The expected life used in the model has been adjusted, based on management’s best estimate, for the effects of non-transferability, exercise restrictions and behavioural considerations.
The weighted average fair value of options granted in the year was £594,819 (2007: £45,285).
During 2008, the Company recognised total share-based payment expenses of £55,146 (2007: £76,830) of which £55,146 (2007: £52,995) related to equity-settled share-based payment transactions. After deferred tax the charge was £49,973 (2006: £53,871).

3X3The name of IDS’ automated platform for testing blood samples. This instrument can run Immunology, Biochemistry and Coagulation tests.
AnalyteThe substance for which an assay is designed to measure. In the present context this will be in a sample taken from a patient or animal (such as blood) and its measurement will aid the diagnosis or monitoring of a disease or its treatment, or provide information for research studies.
AntibodiesAny of a large variety of immunoglobulins (or fragments thereof) which are part of the immune system, and are produced to help fight against infection. Antibodies are made by a type of blood cell called a lymphocyte, and are tailor-made in response to foreign material (antigen) entering the body. Antibodies are highly specific for their particular antigen, and will bind strongly to it. In immunoassays, antibodies are raised against the analyte and used as a receptor to bind the analyte.
AntigenA protein or part of a protein which provokes an immune response and will bind to the antibodies generated.
AssayA test to detect and/or quantitate a specific analyte in a sample.
BiomarkerAn analyte present in a biological sample whose presence or concentration is indicative of a disease state.
CoagulationA complex process by which blood forms clots. It is an important part of haemostasis (the cessation of blood loss from a damaged vessel) whereby a damaged blood vessel wall is covered by a platelet and fibrin containing clot to stop bleeding and begin repair of the damaged vessel. Disorders of coagulation can lead to an increased risk of bleeding (hemorrhage) and/or clotting (thrombosis).
ConjugateAn entity formed by coupling two substances together. In immunoassays the term generally refers to the labelled entity in the assay (e.g. enzyme-labelled antibody).
CTX-IAn abbreviation for C-terminal telopeptides of Type l collagen. Type I collagen accounts for more than 90% of the organic matrix of bone and is synthesised primarily in Bone. During renewal of the skeleton, Type I collagen is degraded, and small peptide fragments are excreted into the bloodstream. These CTX-I fragments can be measured and are useful for follow up of anti-resorptive treatment of patients with metabolic bone diseases.
CTX-IIAn abbreviation for C-terminal telopeptides of type II collagen. Type II collagen is the major organic constituent of cartilage and fragments of type II collagen (CTX-II) are being released into circulation and subsequently secreted into urine following degradation of cartilage. In urine, the CTX-II fragments can be measured and has been reported to be useful in prediction and progression of osteoarthritis and in other clinical and pre-clinical investigations.
EnzymeA catalytic protein which is necessary for a particular chemical process to take place in a living cell. In immunoassays, enzymes are frequently conjugated to antibodies, as part of the signal generation system.
Haematology The branch of biology that is concerned with the study of blood, the blood-forming organs, and blood diseases. Haematology includes the study of etiology, diagnosis, treatment, prognosis and prevention of blood diseases.
ImmunoassayAn assay which uses the specificity of the antibody-antigen binding to measure or detect an analyte.
In-vitroLiterally ‘in glass’. It refers to a process or biological reaction taking place outside a living system.
In-Vitro Diagnostics (IVD)Reagents, instruments and systems intended for use in the diagnosis of disease or other conditions, including a determination of the state of health, in order to cure, mitigate, treat or prevent disease. Tests are performed on samples removed from the body.
MarkerIn the present context, a synonym for Biomarker.
Monoclonal antibodiesMade by producing a single antibody cell line so that it will secrete large amounts of a specific antibody indefinitely. The antibodies produced are therefore all the same. Monoclonal antibodies are used in diagnostics and in purifying useful proteins from mixtures.
PharmaIn the present context, an abbreviation for Pharmaceutical company(s) or the Pharmaceutical Industry.
ProteinsProteins are one of the products that genes code for. They are made of chains of amino acids folded into complex three dimensional structures. It is this structure that helps determine their function.
ProteomeThe entire range of proteins present in a species.
ProteomicsThe study of the entire range of proteins which are produced by a particular gene, genome or cell.
Research-Use Only (RUO)In the present context, an immunoassay that does not have regulatory approval for use as an IVD and can only be used for research purposes.
SpecificityIn this context the ability of a measurement procedure to determine solely the measurable quantity it purports to measure.
TRAPTartrate-resistant acid phosphatases. This enzyme when measured effectively helps to find out the rate at which bone is broken down.

1. Highlights2. Our Strategy4. Sites and Acquisitions6. Our Products and Target Markets8. Chairman’s Statement10. Managing Director’s Review14. Financial Review16. Board of Directors’18. Senior Management and Advisers19. Directors’ Report22. Corporate Governance Report
25. Directors’ Responsibilities in Preparation of Financial Statements26. Independent Auditor’s Report to the Members of Immunodiagnostic Systems Holdings plc27. Consolidated Balance Sheet28. Consolidated Income Statement29. Consolidated Cash Flow Statement30. Consolidated Statement of Changes in Equity31. Notes to Consolidated Financial Statements63. Company Balance Sheet64. Notes to the Company Financial Statements72. GlossaryIBC. Shareholder Information
Immunodiagnostic Systems Holdings plc is a dynamic SME, dedicated to the developmentand provision of innovative assays for use in clinical and research laboratories worldwide.
The Company is focused on creating and sustaining its position as a leading specialist in in vitro diagnostics, building an enviable capability in de novo product design, development, manufacture and global marketing.
From its establishment in 1977 simply as a distributor of diagnostic products, IDS has become a fully integrated diagnostics company developing specialist analytical tools from concept to market-leading products.
With direct sales and marketing presence in the UK, USA, Germany, France, Belgium and Scandinavia, and an additional research and development resource in Finland, the Company is now acknowledged as being a global force in specialist immunoassays.
DIRECTORS
Mr D E Evans Non-Executive ChairmanDr R T Duggan Managing DirectorMr P Hailes Finance DirectorMr A Wilks Sales & Marketing DirectorDr M Garrity Technical DirectorMr C I Cookson Operations DirectorMr A Rousseau Engineering DirectorMr W M Dracup Non-Executive DirectorDr E D Blair Non-Executive Director
SECRETARY
Mr P Hailes
REGISTERED OFFICE
10 Didcot WayBoldon Business ParkBoldonTyne & WearNE35 9PD
AUDITORS
Baker Tilly UK Audit LLPRegistered AuditorChartered Accountants1 St James’ GateNewcastle upon TyneNE1 4AD
REGISTRARS
Computershare Investor Services plcCorporate Actions PO Box 859The PavilionsBridgwater RoadBristolBS99 1XZ
BANKERS
Barclays Bank plcPO Box 37871 Grey StreetNewcastle Upon TyneNE99 7JP
NOMINATED ADVISORS AND BROKER
Oriel Securities Limited125 Wood StreetLondonEC2V 7AN
SOLICITORS
Watson Burton LLP1 St James’ GateNewcastle upon TyneNE99 1YQ
Shepherd + Wedderburn155 St Vincent StreetGlasgowG2 5NR
Ward HadawaySandgate House102 QuaysideNewcastle upon TyneNE1 3DX

A-Z
� �� � �� �� �� �� � ������ �