Embed Size (px)
Citation preview

IMMIGRATION IN THE EU
Source: Eurostat 10/6/2015, unless otherwise indicated
Data refers to non-EU nationals who have established their usual residence in the territory of an EU State for a period of at least 12 months
Net immigration of non-EU nationals
Working age population (15-64 years)
Note: Data does not include asylum seekers or refugees
Emigration of non-EU nationals
1 455 953
1 391 147
1 352 027
1 372 789
2010
2011
2012
2013
2010
2011
2012
2013
748 026
693 660
598 352
539 059
2010
2011
2012
2013
Males Females
50%
85%
50%
707 927
697 487
753 675
833 730
Immigration of non-EU nationals
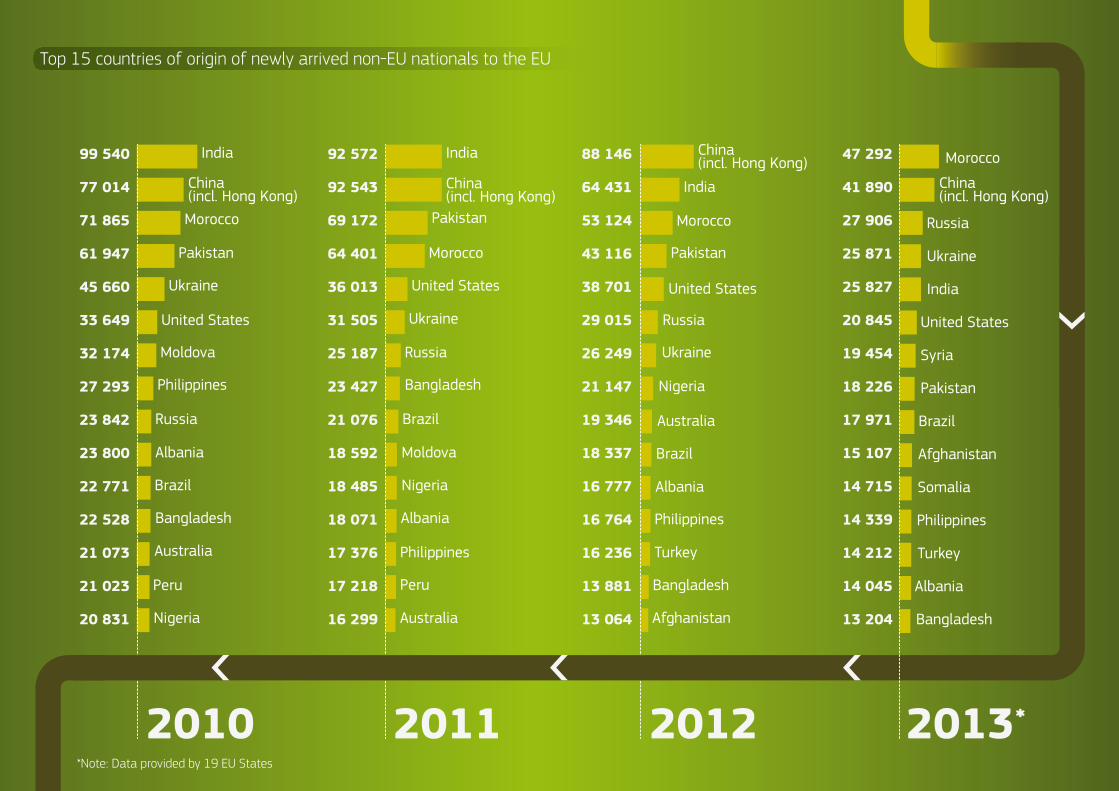
Top 15 countries of origin of newly arrived non-EU nationals to the EU
2013
47 292
41 890
27 906
25 871
25 827
20 845
19 454
18 226
17 971
15 107
14 715
14 339
14 212
14 045
13 204
Pakistan
Brazil
Afghanistan
Somalia
Philippines
Turkey
Albania
Bangladesh
Syria
Morocco
Russia
China(incl. Hong Kong)
India
Ukraine
United States
*2010
99 540
77 014
71 865
61 947
45 660
33 649
32 174
27 293
23 842
23 800
22 771
22 528
21 073
21 023
20 831
Philippines
India
China (incl. Hong Kong)Morocco
Pakistan
Ukraine
United States
Moldova
Russia
Albania
Brazil
Bangladesh
Australia
Peru
Nigeria
2011
92 572
92 543
69 172
64 401
36 013
31 505
25 187
23 427
21 076
18 592
18 485
18 071
17 376
17 218
16 299
Philippines
Bangladesh
Russia
Ukraine
United States
Morocco
Pakistan
China (incl. Hong Kong)
India
Brazil
Moldova
Nigeria
Albania
Peru
Australia
2012
China (incl. Hong Kong)88 146
64 431
53 124
43 116
38 701
29 015
26 249
21 147
19 346
18 337
16 777
16 764
16 236
13 881
13 064
Bangladesh
Nigeria
Ukraine
Russia
United States
Pakistan
Morocco
India
Australia
Brazil
Albania
Philippines
Turkey
Afghanistan
*Note: Data provided by 19 EU States

20 106 041
20 289 850
20 477 169
4%
4%
4%4%
2013
19 566 3322014
2011
2012
Males Females50%50%
of the total working age population in the EU
Working age population (15-64 years)
78%5%
of the totalEU population
Non-EU nationals residing in the EU
Turkey
Morocco
China (incl. Hong Kong)
India
Ukraine
Russia
Albania
Pakistan
United States
Ecuador
1 631 639
1 371 830
736 886
652 973
608 193
565 202
521 481
421 002
358 572
316 137
Top 10 countries of origin of non-EU nationals residing in the EU*
*Note: Data provided by 20 EU States

2014EU28
of the EU State’s total population
of the total number of non-EU nationals residing in the EU
Austria
Belgium
Bulgaria
Croatia
Cyprus
Czech Republic
Denmark
Estonia
Finland
France
Germany
Greece
Hungary
Ireland
Italy
Latvia
Lithuania
Luxembourg
Malta
Netherlands
Poland
Portugal
Romania
Slovakia
Slovenia
Spain
Sweden
United Kingdom
2,76%
2,22%
0,21%
0,11%
0,25%
1,34%
1,19%
0,96%
0,62%
13,83%
20,00%
3,31%
0,30%
0,87%
17,78%
1,53%
0,08%
0,18%
0,06%
1,69%
0,37%
1,54%
0,27%
0,06%
0,41%
13,72%
1,97%
12,39%
3,86%
6,34%
3,88%
0,56%
0,50%
5,65%
2,49%
4,14%
14,22%
2,24%
4,11%
4,84%
5,95%
0,60%
3,70%
5,72%
14,92%
0,54%
6,27%
2,66%
1,96%
0,19%
2,88%
0,26%
0,23%
3,90%
5,77%
3,99%
3,77%

Australia
Israel
New Zealand
27%
Canada
Switzerland
United States13%
27%
24%
24%
20%
32 715 912
33 321 109
34 101 524
of the totalEU population
2013
33 574 4232014
2011
2012
7%
7%
7%6%
Foreign-born population in selected countries
2011
Foreign-born population residing in the EU
Norway12%
Source: OECD (2014), OECD Factbook 2014: Economic, Environmental and Social Statistics, OECD Publishing, Paris.

For familyreasons
For education For otherreasons
28% 20% 29%For work23%
2013
Residence permits issued to non-EU nationals
R e s i d e n c e
p e r m i t
2 344 803
2 472 780
2 176 785
2 096 311
2 356 521
2009
2010
2011
2012
2013

86 541
48 266
46 478
42 008
41 668
40 371
31 903
23 846
22 157
20 485
Morocco
India
Turkey
Colombia
Albania
Ecuador
Pakistan
Iraq
Peru
Nigeria
Citizenship acquired by non-EU nationals in an EU State
Top 10 countries of origin of non-EU nationals who received citizenship
2013 871 293
PASS
EU STATE
PORT
EUROPEAN UNION

Demographic projections in the EUOld age dependency ratio
Population projections
2 people of working age to 1 person over 65
4 people of working age to 1 person over 65
20602012
Population change without migration
Population change with migration
in Mio
100
0
200
300
400
500
600
2020 2025 2030 2035 2040 2045 2050 2055 2060 2065 2070 2075 2080

Employment trends in the EU
Top occupations with labour shortages
Health
Engineering
Finance
IT
Source: European Vacancy and Recruitment Report 2014 Source: Cedefop, Skills forecasts, 2015
Teaching
Job openings in 2013-2025 stem from the change in the number of jobs available and the number of jobs that need to be filled as people leave the labour market
By qualification
By sector
107 784 440
Increase in number of jobs
Decrease in number of jobs
Number of people leavingthe labour market
Total job openings
High qualification49 880 290
Medium qualification44 460 320
Low qualification13 443 820
All qualifications107 784 440
19 897 770
98 030 640
-1 568 340
-1 637 980
318 170
3 467 030
7 370 600
1 804 320
9 753 800
24 080 320
23 452 030
23 106 590
98 030 640
8 249 340
10 477 560
Non-marketed services
Primary sector & utilities
Manufacturing
Construction
Distribution & transport
Business & other services
All industries
5 776 650
26 919 060
31 450 920
24 910 910
-798 110
-9 345 860
9 753 800
29 982 520
45 258 440
22 789 680
9 817 680
5 458 490
12 115 540

Asylum, Migration and Integration Fund (2014-20)
The Asylum, Migration and Integration Fund (AMIF) was set up for the period 2014-20, with a total of EUR 3.14 billion. It will promote the efficient management of migration flows and the implementation, strengthening and development of a common Union approach to asylum and immigration. In particular, the fund shall contribute to supporting legal migration to EU States in accordance with their economic and social needs and to promoting the effective integration of non-EU nationals. Concrete actions funded can include information measures and campaigns in non-EU countries on legal migration channels, education and language training for non-EU nationals, assistance to vulnerable persons in this target group and training for staff on relevant topics. The fund also covers: (a) asylum, (b) return and combating irregular migration, and (c) solidarity for the states which are most affected by migration and asylum flows.
2 392 million EUR
Allocations for national programmes (2014-20)
United KingdomSweden
SpainSloveniaSlovakiaRomaniaPortugal
PolandNetherlands
MaltaLuxembourg
LithuaniaLatvia
ItalyIreland
HungaryGreece
GermanyFranceFinlandEstonia
Czech RepublicCyprus
BulgariaBelgiumAustria
Croatia
64.53
89.25
10.01
17.13
32.31
26.19
10.16
23.49
265.57
208.42
259.35
23.71
19.52
310.36
13.75
9.63
7.16
17.18
94.42
63.41
32.78
21.92
10.98
14.73
257.10
118.54
%
370.43
161514131211109876543210
Info: in million EUR Source: DG Migration and Home Affairs, 2015
EU action

Blue Card Directive makes it easier for highly-qualified immigrant workers to access the EU labour market.
Single Permit Directive provides a single residence and work permit and a common set of rights for non-EU workers.
Family Reunification Directive gives legally residing immigrants the right to bring into the EU their close family members.
Directive on the entry and stay of students, interns and volunteers sets down common rules for these immigrants’ entry into the EU.
Researchers Directive provides a fast-track admission procedure for researchers.
Long-term Residents Directive grants immigrants who have legally resided in the EU for at least five years rights similar to those of EU citizens.
Seasonal Workers Directive ensures the rights of non-EU seasonal workers and helps to fight irregular migration.
Intra-Corporate Transferees Directive facilitates the transfer of key personnel to the EU and their mobility within the Union.
European Migration Network (EMN) provides up-to-date, objective, reliable and comparable information on migration and asylum to support policy-making.
EU Immigration Portal contains practical information about moving into the EU for potential immigrants. http://ec.europa.eu/immigration
European Web Site on Integration is an information-hub on integration for policy-makers and practitioners. http://ec.europa.eu/ewsi
http://ec.europa.eu/dgs/home-affairsDisclaimer: Information in this infographic is for reference purposes only and is not necessarily comprehensive or up to date.