Embed Size (px)
Citation preview

m i n n e s o ta e c o n o m i c TR E N D S d e c e m b e r 2 0 1 71 I M MIGRANTS AN D TH E ECO NOMY
Steve H i n e a n d Ca m e ro n M a ch t
Increasingly tight labor markets and a growing scarcity of
workers are now recognized as two of Minnesota’s most significant barriers to sustained economic growth. In the face of these constraints, it has become increasingly evident that
immigration has been and will continue to be a vital source of the workforce that employers need to succeed in the state.
After averaging a net gain of just over 40,000 additional labor force participants per
year between 1976 and 2000, Minnesota employers could easily tap into a large and growing pool of talented workers. From 2000 to 2016, however, our growth in available workers dropped to less than one-third that, at just over
In a tight labor market, immigrants are a vital source of talent for Minnesota employers. Foreign-born workers now account for 10 percent of the state’s labor pool.
Immigrants and the Economy

m i n n e s o ta e c o n o m i c TR E N D S d e c e m b e r 2 0 1 7 2I M MIGRANTS AN D TH E ECO NOMY
Steve H i n e a n d Ca m e ro n M a ch t
The primary data source for this article is the American Community Survey.
Getting Right to Work
Immigrants have become critical to Minnesota’s economy, providing a rapid stream of new workers in the face of an aging native-born workforce. Foreign-born workers now account for 10 percent of the total available labor force in Minnesota, up from 7.5 percent just one decade earlier. In sum, the number of foreign workers jumped from 216,409 in 2006 to 302,879 in 2016.
Minnesota’s labor force increased by just over 150,000 workers from 2006 to 2016, a steady 5.2
growth). This means that more than half of our recent labor force growth has been driven by immigrants. And this will certainly continue to be the case, with immigrants displaying a much younger age profile than the native-born population, which is aging rapidly and exhibiting lower labor force participation rates as retirement picks up.
This article reviews immigration trends to Minnesota, as well as the characteristics of these new Minnesotans. In light of possible restrictions on immigration to the U.S., it is important to understand historical trends and reflect on the possible consequences to Minnesota’s labor market and economy.
11,000 new workers per year (see Chart 1).
Recently released labor force projections from the Minnesota State Demographic Center suggest this growth will fall further in the years ahead, to an annual average of just over 7,000 additional labor force participants per year between now and 2030. This will make it more challenging for employers to grow, but will also shine a light on the importance of immigration.
Since 2010, the foreign-born labor force in Minnesota has increased by 56,200 people (23 percent growth), while the native-born labor force has increased by 44,400 (1.6 percent
-10,000
0
10,000
20,000
30,000
40,000
50,000
60,000
70,000
80,000
1977 1979 1981 1983 1985 1987 1989 1991 1993 1995 1997 1999 2001 2003 2005 2007 2009 2011 2013 2015
Source: DEED Local Area Unemployment Statistics (LAUS)
Aver
age C
hang
e in A
vaila
ble W
orke
rs
Annual Average Gain of ~40,000 Additional
Workers
Annual Average Gain of ~11,350 Additional
Workers
Chart 1. Annual Average Change in Minnesota’s Labor Force

m i n n e s o ta e c o n o m i c TR E N D S d e c e m b e r 2 0 1 73 I M MIGRANTS AN D TH E ECO NOMY
Steve H i n e a n d Ca m e ro n M a ch t
into a new culture is language, but many new Minnesotans have made headway. About 81 percent of foreign-born residents in Minnesota speak a language other than English, but many of them can also speak English. About 45.3 percent reported they speak English less than “very well,” compared with 49.1 percent of foreign-born residents nationwide.
Perhaps surprisingly, a notable portion of Minnesota’s foreign-born population is well educated, with about one-third (32.6 percent) of foreign-born adults age 25 and over holding a bachelor’s degree or higher, which is right in line with
Barriers to Entry
According to the American Community Survey, Minnesota is now home to more than 450,000 foreign-born residents, or about one in every 12 people. Of those, 43.7 percent entered the U.S. before 2000, 31.6 percent came between 2000 and 2009, and the remaining 24.6 percent settled in Minnesota since 2010. That made Minnesota’s foreign-born population “newer” than in the rest of the United States, where 54.7 percent entered prior to 2000 and just 18.6 percent entered since 2010 (see Chart 2).
One challenge to assimilating
percent expansion. More than half – 86,470 or 58 percent – of those workers were foreign born. Put another way, the foreign-born labor force expanded by 40 percent from 2006 to 2016, compared with 2.4 percent growth among the native-born workforce.
While labor force participation rates were declining for native-born workers, they were increasing for foreign-born workers. Participation rates were around 71 percent for both groups in 2006, but dropped to 69.1 percent for native-born workers by 2016 and rose to 72.7 percent for foreign-born workers (see Table 1).
Table 1. Labor Force Characteristics of the Native and Foreign Born Population in Minnesota2006-2016 Change 2011-2016 Change
2006 2011 2016 Number Percent Number PercentNative Born
Population 16 and Over 3,754,283 3,855,411 3,959,481 205,198 5.5% 104,070 2.7%
In Labor Force 2,673,049 2,702,643 2,736,001 62,952 2.4% 33,358 1.2%
Participation Rate 71.2% 70.0% 69.1% -2.1% -0.9%
Employed Workers 2,534,141 2,498,306 2,637,014 102,873 4.1% 138,708 5.6%
Unemployed 136,326 202,698 98,496 -37,830 -27.7% -104,202 -51.4%
Unemployment Rate 5.10% 7.50% 3.60% -1.5% -3.9%
Foreign Born
Population 16 and Over 304,802 355,053 416,042 111,240 36.5% 60,989 17.2%
In Labor Force 216,409 254,573 302,879 86,470 40.0% 48,306 19.0%
Participation Rate 71.0% 71.7% 72.7% 1.7% 1.0%
Employed Workers 202,693 229,719 285,405 82,712 40.8% 55,686 24.2%
Unemployed 13,417 25,203 17,264 3,847 28.7% -7,939 -31.5%
Unemployment Rate 6.2% 9.9% 5.7% -0.5% -4.2%
Source: U.S. Census Bureau, American Community Survey 1-Year Estimates
m i n n e s o ta e c o n o m i c TR E N D S d e c e m b e r 2 0 1 7 4I M MIGRANTS AN D TH E ECO NOMY
Steve H i n e a n d Ca m e ro n M a ch t
native-born Minnesotans (35 percent). In each case, Minnesota was above the comparable educational attainment levels for both foreign- (30 percent) and native- (31.6 percent) born residents nationwide.
It is equally important, however, to note that nearly half (45.8 percent) of foreign-born Minnesotans have a high school diploma or less, including 27.1 percent that are not high school graduates. That compared with just 30.8 and 4.9 percent of natives, respectively.
For foreign-born residents who were not U.S. citizens, this jumps to 52.7 percent with a high school diploma or less, including 34.4 percent without a high school diploma. This is a sizeable number and shows that many immigrants need access to education to be prepared for the workforce, where jobs for high school graduates are increasingly difficult to fill.
Another big gap between native- born and foreign-born is in the percentage of residents who have attended some college or earned an associate degree. Just over 34 percent of native-born Minnesotans have some college or an associate degree, compared with just 21.6 percent of foreign-born Minnesotans and just 15.5 percent of foreign-born non-citizens.
0%
10%
20%
30%
40%
50%
60%
70%
80%
90%
100%
18.6%
26.7%
54.7% 43.7%
31.6%
24.6%
Source: 2016 American Community Survey 1-Year Estimates
Entered before 2000
Entered 2000 to 2009
Entered 2010 or later
Chart 2. Year of Entry for the Foreign Born Population, 2016
U.S. Minnesota

m i n n e s o ta e c o n o m i c TR E N D S d e c e m b e r 2 0 1 75 I M MIGRANTS AN D TH E ECO NOMY
Steve H i n e a n d Ca m e ro n M a ch t
By industry, foreign-born workers were much more likely to be found working in manufacturing, administrative support and waste management services – which includes temporary staffing services – and leisure and hospitality. In contrast, immigrants were less likely to be employed in retail trade, public administration, construction, and finance, insurance and real estate.
Not surprisingly, some detailed occupations have very high shares of foreign-born workers
In contrast, foreign-born workers were found more often in service occupations, which include health care support, protective service, food preparation and serving, building and grounds cleaning, and personal care occupations. They were also much more concentrated in production, transportation and material moving occupations. These gaps are even more pronounced for foreign-born workers who are not citizens, who presumably have entered more recently (see Chart 3).
Service Specialization
Perhaps in part due to the language and educational barriers described, foreign-born workers were much more likely to work in certain occupational and industry groups than native-born workers. For example, native-born workers were 8.5 percentage points more likely to work in sales and office occupations than foreign-born workers, and 6.1 percentage points more concentrated in management, business, science and arts occupations.
m i n n e s o ta e c o n o m i c TR E N D S d e c e m b e r 2 0 1 7 6I M MIGRANTS AN D TH E ECO NOMY
Steve H i n e a n d Ca m e ro n M a ch t
take steps to reduce any barriers that our foreign-born residents face in fully participating in our labor markets. Only by doing so can we hope to continue the economic success that our state has been known for. ■T
the workers we have by removing frequent impediments to work.
Minnesota’s immigrant population has been a crucial source of the workforce our state needs to continue to grow, and this is only expected to intensify in the years ahead. It is critically important, therefore, that we
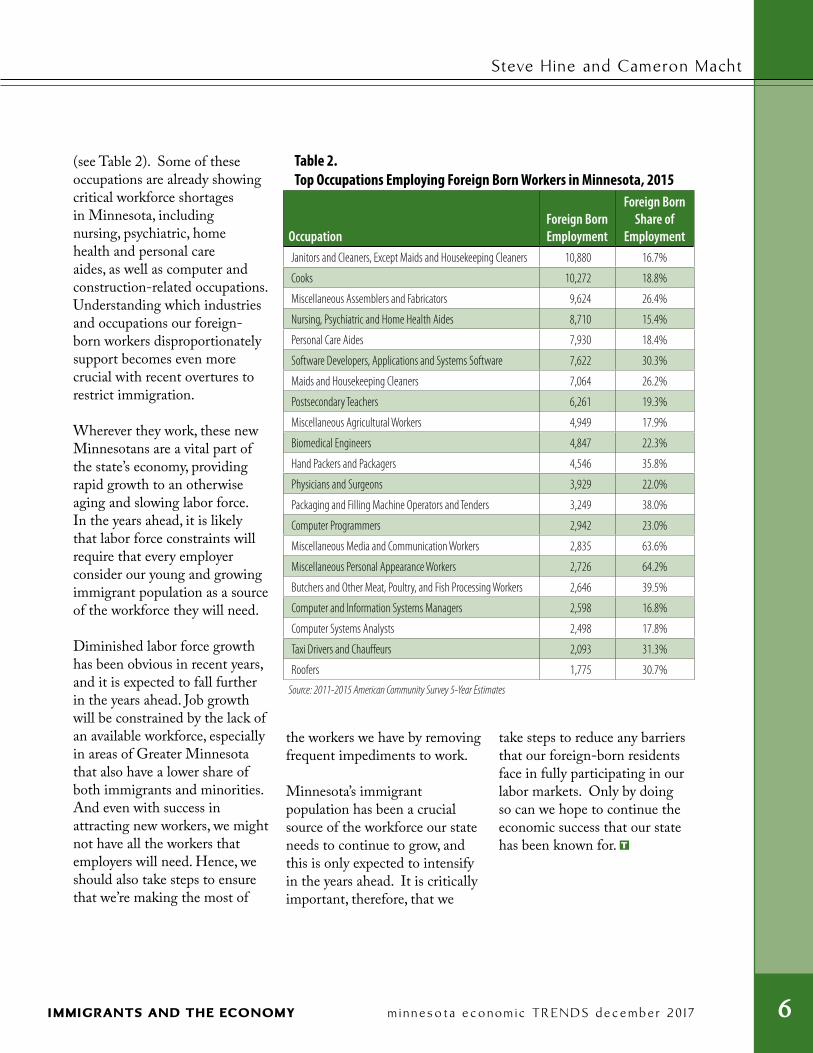
(see Table 2). Some of these occupations are already showing critical workforce shortages in Minnesota, including nursing, psychiatric, home health and personal care aides, as well as computer and construction-related occupations. Understanding which industries and occupations our foreign-born workers disproportionately support becomes even more crucial with recent overtures to restrict immigration.
Wherever they work, these new Minnesotans are a vital part of the state’s economy, providing rapid growth to an otherwise aging and slowing labor force. In the years ahead, it is likely that labor force constraints will require that every employer consider our young and growing immigrant population as a source of the workforce they will need.
Diminished labor force growth has been obvious in recent years, and it is expected to fall further in the years ahead. Job growth will be constrained by the lack of an available workforce, especially in areas of Greater Minnesota that also have a lower share of both immigrants and minorities. And even with success in attracting new workers, we might not have all the workers that employers will need. Hence, we should also take steps to ensure that we’re making the most of
Table 2. Top Occupations Employing Foreign Born Workers in Minnesota, 2015
OccupationForeign Born Employment
Foreign Born Share of
EmploymentJanitors and Cleaners, Except Maids and Housekeeping Cleaners 10,880 16.7%
Cooks 10,272 18.8%
Miscellaneous Assemblers and Fabricators 9,624 26.4%
Nursing, Psychiatric and Home Health Aides 8,710 15.4%
Personal Care Aides 7,930 18.4%
Software Developers, Applications and Systems Software 7,622 30.3%
Maids and Housekeeping Cleaners 7,064 26.2%
Postsecondary Teachers 6,261 19.3%
Miscellaneous Agricultural Workers 4,949 17.9%
Biomedical Engineers 4,847 22.3%
Hand Packers and Packagers 4,546 35.8%
Physicians and Surgeons 3,929 22.0%
Packaging and Filling Machine Operators and Tenders 3,249 38.0%
Computer Programmers 2,942 23.0%
Miscellaneous Media and Communication Workers 2,835 63.6%
Miscellaneous Personal Appearance Workers 2,726 64.2%
Butchers and Other Meat, Poultry, and Fish Processing Workers 2,646 39.5%
Computer and Information Systems Managers 2,598 16.8%
Computer Systems Analysts 2,498 17.8%
Taxi Drivers and Chauffeurs 2,093 31.3%
Roofers 1,775 30.7%
Source: 2011-2015 American Community Survey 5-Year Estimates