Embed Size (px)
Citation preview
The Labor Market Assimilation of Immigrants in the United States: The Role of Age at Arrival Rachel M. Friedberg Brown University December 1992 I am indebted to Joshua Angrist, George Borjas, David Card, Janet Currie, Henry Farber, Stanley Fischer, Claudia Goldin, Jonathan Gruber, Lawrence Katz, Thomas Lemieux, Lisa Lynch, Craig Olson, Michael Piore, David Weil, and seminar participants at MIT, Princeton, Brown, UCLA, Ohio State, The Federal Reserve Board, and the Hebrew University for helpful discussions and comments; to Michael Boozer, David Card, and David Rodda for help in obtaining data; and to the U.S. Department of Education and the MIT Economics Department for financial assistance.
2
Abstract This paper examines the earnings of immigrants to the United States, relative to those of comparable natives. I measure the impact of the age at which an immigrant arrived in the country on his relative earnings and on the rate at which his relative earnings rise with time since arrival. I demonstrate that age at arrival has a large negative effect on immigrant earnings. For example, I find that an immigrant who arrived in the United States at age 30 is at an 11.6% earnings disadvantage, relative to an otherwise comparable immigrant who arrived at age 10. I further show that, among labor force participants, there is a spurious negative correlation between age at arrival and years since arrival. This is because, among immigrants who have been in the United States for many years, those who immigrated later in life have already retired and are no longer in a sample of working people. Similarly, among immigrants who have been in the country only a few years, those who arrived as children have not yet joined the labor force, and thus are also excluded from a sample of working people. Since age at arrival has an adverse effect on immigrant earnings, previous studies that do not correct for this factor necessarily overstate the relative earnings gain that immigrants experience with time since migration. Taking into account age at immigration, I present corrected estimates of the rate at which the earnings of immigrants catch up to those of comparable natives with years since arrival. I find that the rate of earnings convergence is lower than uncorrected estimates would indicate, particularly for those who immigrated at a young age. Finally, in contrast to the general decline in cohort quality indicated by uncorrected estimates, once age at arrival is taken into account, there does not appear to be a common pattern of decline in the skill-corrected quality (e.g. ability or motivation) of recent cohorts of immigrants to the United States. While I do find a quality decline for certain groups, there is no evidence of a decline among recent Mexican or East Asian immigrants.
3
I. Introduction
Immigrants represent a large and increasing share of the labor force of the United States.
Currently, just under 10% of the U.S. labor force is foreign-born1. In October of 1991, a new
immigration policy took effect which increased the number of immigrants to be admitted into the
country each year from 560,000 to 700,000 people. Despite the magnitude of these numbers,
however, some of the most basic issues concerning the economic integration of immigrants into
the country remain unresolved. Do immigrants successfully assimilate into the labor market?
What factors affect their assimilation? Do immigrants ever catch up to natives, and if so, how long
does that process take? Finally, can immigration policy affect the answers to these questions?
Upon arrival in the country, immigrants can be expected to be at an earnings
disadvantage, relative to natives, because they lack certain U.S.-specific skills and information that
natives have. Over time, as they learn about American institutions, learn how to best apply the
skills they have in this country, improve their English, and gain other U.S.-specific human capital,
their earnings may catch up to, and possibly overtake, those of comparable natives. I examine
three aspects of immigrant assimilation: 1) the degree to which immigrant earnings are
comparable to the earnings of natives with similar demographic and skill characteristics; 2) the
rate at which the gap between immigrants and natives narrows with time since immigration; and 3)
changes in the skill-corrected quality of successive immigrant cohorts.
I focus on a particular determinant of immigrant earnings which has been largely
overlooked in the literature: the age at which an individual immigrated to the United States. There
are many reasons to expect that immigrants who arrive at young ages will assimilate more
successfully than immigrants who arrive at older ages. Using microdata from the 1970 and 1980
Public Use Samples of the U.S. Census, I demonstrate that age at arrival is indeed a very
1 Borjas, Freeman, and Katz (1991)

4
important factor affecting immigrant earnings.
There is a substantial amount of variation in the typical arrival age of different immigrant
groups. Furthermore, I show that, as a result of sample truncation at labor force entry and exit,
there is a systematic spurious negative correlation in the data between years since migration and
age at immigration. This is because, among immigrants who have been in the United States for
many years, those who immigrated later in life have already retired and are no longer in a sample
of working people. Similarly, among immigrants who have been in the country only a few years,
those who arrived as children have not yet joined the labor force, and thus are also excluded from
a sample of working people. Since age at immigration has a negative effect on immigrant
earnings, a failure to correct explicitly for age at immigration leads to omitted variable bias in
estimates of the relative earnings of different immigrant groups and of the same group over time.
In the next section of the paper, I discuss the importance of age at immigration for
immigrant earnings. Section Three briefly reviews previous work on assimilation and
demonstrates the bias implicit in these studies if age at arrival is important. I lay out the estimation
strategy to be used in Section Four, describe the data in Section Five, and present the empirical
results in Section Six. The final section concludes.
II. Age at Arrival
The age at which an individual migrates to the United States is a potentially important
determinant of how that immigrant will eventually do in the labor market. There are many reasons
why an immigrant who arrives as a youth might be expected to assimilate better than an immigrant
who arrives in adulthood. Immigrants who arrive as children attend school in the United States.
They also accumulate all of their labor market experience in this country. It is reasonable to
presume that, for most countries of origin, human capital acquired abroad receives lower returns in

5
the United States than that acquired here2. In addition, there may be less quantifiable barriers to
assimilation that result from labor market experience obtained abroad, for example, those faced by
an adult coming from a socialist country, who must adjust to a very different set of labor market
institutions. A second important issue is that children are more able to become fluent in a second
language than are adults. There is considerable evidence that English language skills are an
important determinant of earnings potential.3 Finally, younger people are more adept at becoming
socially assimilated than are older people. There are many cultural barriers important to labor
force assimilation that immigrants must overcome. To give an extreme example, for many of the
recent Ethiopian immigrants to Israel, indoor plumbing and electricity are completely new
concepts. The children among them are much more able to adapt to these new technologies and
to other aspects of life in an industrialized economy than are the adults. Given their shorter
expected work lives, older immigrants also have less of an incentive to invest in any of these forms
of new human capital (schooling, language, etc.). For all these reasons, people who immigrate at
young ages are less distinguishable from natives than are other immigrants. Despite the
plausibility of an effect of age at arrival on labor market outcomes, very little attention has been
paid to it in the literature on labor market assimilation.4
A crucial aspect of age at immigration, and one that has not been recognized, is that
immigrants of recent and early cohorts who are participating in the labor force differ substantially in
their average ages at migration. This difference may not be due to any true change in the age
distribution of immigrants coming to the United States, but simply to the following logic: When
2 In related work on immigration to Israel, I have found that in most cases, schooling completed abroad receives a much lower return than schooling completed in Israel (Friedberg 1991).
3 See Chiswick (1991) and McManus, Gould, and Welch (1983).
4 See Kossoudji (1989) and Smith (1991).
6
studying earnings, we sample only people currently in the labor market. An immigrant who came
to the United States a long time ago, say in 1930, and who is still working must have been quite
young when he arrived. Had he been relatively old when he came to this country, he would
already be retired. Similarly, an immigrant who arrived only recently, say last year, must have
already been an adult upon arrival to be observed in the labor force now. Someone who came
that recently as a child would still be in school. There is, therefore, a systematic truncation of the
ages at immigration we observe for cohorts which have been in the United States for different
amounts of time. In particular, age at immigration is negatively correlated with time since
immigration. Thus, if being young when you immigrate matters and is not accounted for,
immigrants who have been in the country a long time will appear to be of higher "quality" (i.e.,
earnings potential, correcting for observable skills) than immigrants who have only been in the
country a short amount of time. This relationship will hold, even in the absence of any true
difference in unobservable factors.
Table One illustrates the importance of this phenomenon. Using data from the 1980 U.S.
Census (which will be described below in more detail), the table presents the mean current age,
years since migration, and age at immigration for male immigrants from five arrival-year cohorts
and five country of origin categories, as well as the average for all origin groups. The first set of
columns presents these numbers for all male immigrants in the country-cohort cell. The second
set of columns presents these means for male labor force participants only.
As might be expected, for any origin group, the average current age is higher for cohorts
which have been in the United States for a long time than for more recent arrivals. For example,
the average current age for all immigrants who came between 1950-59 is 46.6, in contrast to 25.1
for those who came in 1975-79. The age distribution across cohorts is obviously more
compressed when only labor force participants are considered (i.e. 43.0 and 31.7 for these same
two groups).

7
An immigrant's age at arrival is computed by simply subtracting years since migration from
current age. Looking down the first set of columns for the entire population, we see the "true"
variation in age at arrival. For example, these numbers tell us that the average Mexican immigrant
to the United States is about 18 years old upon arrival, while the average Eastern European is
about 27 years old.
Looking within origin group, the variation is smaller than is the cross-group variation. As is
seen in the top set of rows, arrival age seems to have remained constant at about 22 years of age
over the thirty year period 1950-1980. The small upward drift in this number can probably be
attributed to higher mortality rates among older people, i.e. that some of the oldest people in the
earliest cohorts are no longer alive, somewhat reducing the average arrival age of earlier cohorts.
Examining the numbers for labor force participants, however, shows a strikingly different
picture. While the rise in average age at arrival across arrival cohorts in the "population" column is
at most about one year, that rise in the "labor force participants" sample is measured to be 11.1
years. East Asians are the only origin group for which there has been a very large rise in true age
at arrival across arrival cohorts. Looking at the population figures for East Asian immigrants, there
has been a true rise of about 6.6 years in mean arrival age. Looking at labor force participants
would lead one to believe that there had been a 16 year rise in that average.
The magnitude of spurious differences in the average age at migration among labor force
participants in early and recent cohorts is thus quite large. This relationship will be present in any
sample used to study immigrant earnings, since it is due only to the age truncation implicit in
limiting the sample to labor force participants.
To the extent that age at immigration affects relative earnings negatively, this spurious
negative correlation between years since arrival and age at arrival will lead to an overestimate of
the earnings of immigrants who have been in the United States for a long time, relative to those
who have been here a shorter time. This translates into an overestimate of the extent to which the

8
earnings of immigrants rise with time since immigration (i.e. earnings convergence). Omitted
variable bias will also result from failing to account for the "true" differences in the average age at
arrival of different immigrant groups. These will bias measures involving the relative earnings of
any two immigrant groups which have different distributions of arrival age, for example, changes in
the quality of immigrant cohorts over time, differences in the earnings of immigrants from different
countries of origin, and so on. The reasons for these biases are explained more precisely in the
next section.
III. Previous Work
One of the earlier papers studying assimilation is that by Chiswick (1978). Chiswick
examines a cross-section of the population, regressing earnings on the standard individual
characteristics5, a dummy for immigrant status and time since immigration. He finds a strong
positive coefficient on years since arrival, and concludes that assimilation is therefore very
important. His estimate is that white male immigrants overtake natives of similar characteristics in
15-20 years.
Borjas (1985) counters these findings with the argument that, in a single cross-section, a
positive effect of years since migration could be picking up not only assimilation, but changes in
cohort quality as well. The argument is that earlier cohorts may simply perform better at every
stage than recent ones, so that a difference in their earnings reflects not only a difference in the
time they have had to assimilate, but a "quality" difference as well. Borjas examines two cross-
sections of the population to separately identify these two effects. This is illustrated in Figure One.
Chiswick's measure, the difference between points B and C, can be decomposed into two parts.
5 schooling, experience, marital status, urban location, etc.
9
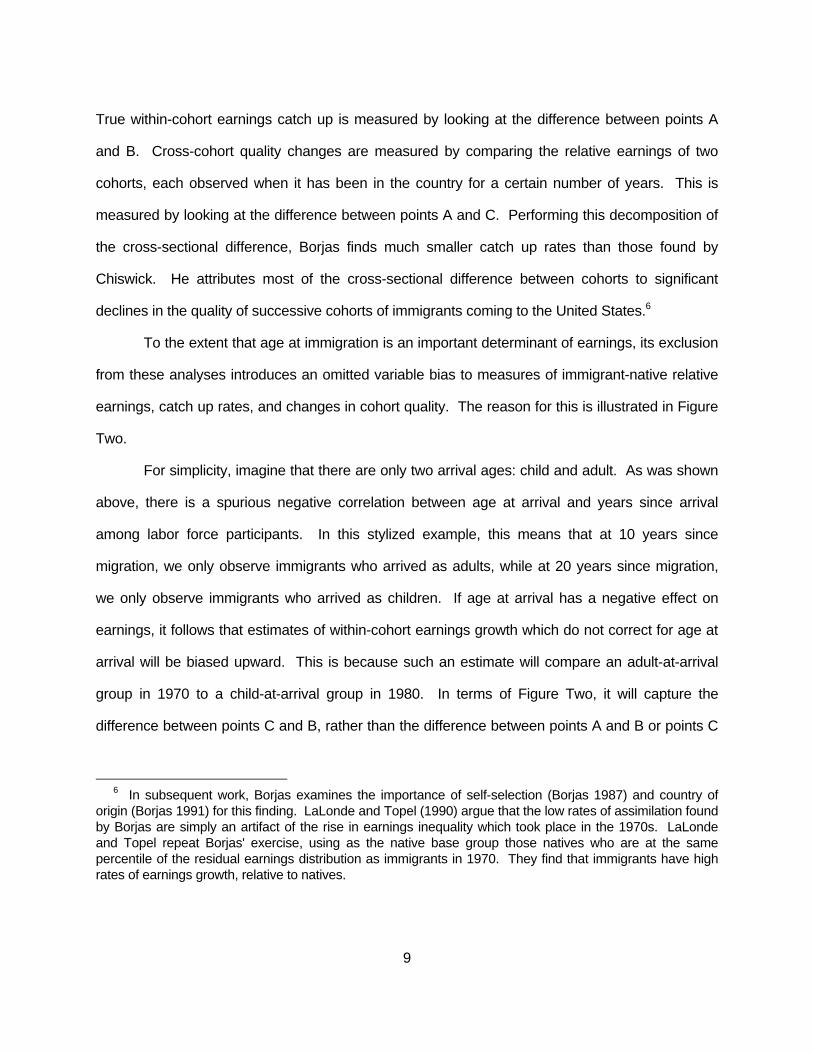
True within-cohort earnings catch up is measured by looking at the difference between points A
and B. Cross-cohort quality changes are measured by comparing the relative earnings of two
cohorts, each observed when it has been in the country for a certain number of years. This is
measured by looking at the difference between points A and C. Performing this decomposition of
the cross-sectional difference, Borjas finds much smaller catch up rates than those found by
Chiswick. He attributes most of the cross-sectional difference between cohorts to significant
declines in the quality of successive cohorts of immigrants coming to the United States.6
To the extent that age at immigration is an important determinant of earnings, its exclusion
from these analyses introduces an omitted variable bias to measures of immigrant-native relative
earnings, catch up rates, and changes in cohort quality. The reason for this is illustrated in Figure
Two.
For simplicity, imagine that there are only two arrival ages: child and adult. As was shown
above, there is a spurious negative correlation between age at arrival and years since arrival
among labor force participants. In this stylized example, this means that at 10 years since
migration, we only observe immigrants who arrived as adults, while at 20 years since migration,
we only observe immigrants who arrived as children. If age at arrival has a negative effect on
earnings, it follows that estimates of within-cohort earnings growth which do not correct for age at
arrival will be biased upward. This is because such an estimate will compare an adult-at-arrival
group in 1970 to a child-at-arrival group in 1980. In terms of Figure Two, it will capture the
difference between points C and B, rather than the difference between points A and B or points C
6 In subsequent work, Borjas examines the importance of self-selection (Borjas 1987) and country of origin (Borjas 1991) for this finding. LaLonde and Topel (1990) argue that the low rates of assimilation found by Borjas are simply an artifact of the rise in earnings inequality which took place in the 1970s. LaLonde and Topel repeat Borjas' exercise, using as the native base group those natives who are at the same percentile of the residual earnings distribution as immigrants in 1970. They find that immigrants have high rates of earnings growth, relative to natives.

10
and D.
In addition to this "spurious" variation in age at arrival, "true" variation in age at arrival may
bias any of these measures-- the level of the earnings gap for different origin groups, the rate of
earnings convergence, and the changes in cohort quality within origin group over time.
IV. Econometric Framework
In order to identify the effect that age at arrival has on immigrant earnings, we must
separate its impact from the impact of other related determinants of earnings. In particular, we
must partial out the effects on relative earnings of current year, current age (or labor market
experience), years since migration, and arrival cohort in order to isolate the effect of arrival age on
relative earnings.
To provide the intuition for how the return to age at arrival can be separately identified, I
present a simple numerical example in Table Two. This table presents hypothetical data from a
1980 cross-section for four people, two immigrants and two natives. The table shows the current
age and wage for each of these four people. For the immigrants, it also shows year of arrival,
years since arrival, and age at arrival.
The two immigrants in this example are a father and son who arrived in the United States
at the same time, in 1960. When they arrived, the father was 25 years old and the son was 5
years old. When we observe these two people in 1980, the father is 45 years old, and the son is
25 years old. The other two people in this table are the immigrants' native counterparts, a father
and son, who are of the same ages as the immigrant father and son. All other demographic
variables (education, marital status, etc.) are assumed to be the same for these four people. The
final column in the table gives the value of each immigrant's earnings, relative to the earnings of

11
his same-aged native counterpart.
The numbers in the table are constructed to illustrate a particular hypothesis: Controlling
for all other observable effects on earnings, an immigrant who comes to the United States as a
child will perform better in the labor market, relative to his native counterparts, than will an
immigrant who comes as an adult. In this example, the immigrant father earns 70% of what the
native father earns, while the immigrant son earns 90% of what the native son earns.
The key to the identification of the return to age at arrival lies in this difference in
differences. The difference, or earnings gap, is 90% for the son and 70% for the father. The
difference in these differences is thus 20%, and that 20% is the effect of age at arrival.
By looking at the difference in differences, the other effects that appear in Table Two are
partialled out: 1) By comparing immigrants to natives, we net out year fixed effects;
2) By comparing each immigrant to natives his own age, we partial out the effect of current age;
3) By comparing the relative wages of two immigrants who are members of the same arrival
cohort and have been in the United States for the same number of years, there is no variation in
years since migration or arrival cohort to explain the difference in relative earnings. The only
variation that is left to account for the 20% difference in differences is the different ages at arrival
of the father and son. In this example, arriving as a child yields a 20 percentage point return, in
terms of earnings relative to comparable natives.
Translating the above intuition into a regression framework, let earnings be determined by
the following "true" model: εβββ +A+X+=W Ax0
N (1)

12
Where WN and WM denote log earnings for natives and immigrants, respectively. X denotes
individual characteristics (e.g. demographics, education, etc.), "A" denotes current age (or
experience), and ε is an error term. Native earnings are thus determined according to the
standard human capital framework. In addition to these variables, there are three more factors
determining immigrant earnings: the number of years since arrival (Y), age at arrival (α)7, and an
arrival-cohort fixed effect (Ci, where i denotes year of arrival).
In any given cross-section, however, years since arrival and arrival cohort are
indistinguishable. These two effects are thus both absorbed by the set of arrival cohort dummy
variables, Ci. For the estimation, immigrants and natives are pooled and a joint equation is
estimated8:
where α=0 and Ci=0 for natives. The coefficient on the constant term in this regression, β0,
reflects the value of the constant for natives, who are the base group. The coefficients on the set
of immigrant arrival-cohort dummy variables therefore measure the earnings of immigrants in that
arrival-cohort, relative to the native base group (i.e., the immigrant-native earnings gap).
The key to the identification lies in the pooling of immigrants and natives. For immigrants,
there is a perfect linear relation among three of the variables of interest. In particular, A = α + Y.9
7 To the extent that the return to age at arrival changes with years since arrival, this specification will pick up the average effect.
8 In principle, βx could be allowed to differ for immigrants and natives.
9 or equivalently, A = α + (constant - Ci*Ti), where Ti equals arrival cohort Ci's year of arrival and the constant is the survey year.
εβαββββ α +C++Y+A+X+=W iiC,i
YAX0M ∑Β (2)
εβαββββ α +C++A+X+=W iiC,i
AX0 ∑ (3)
13
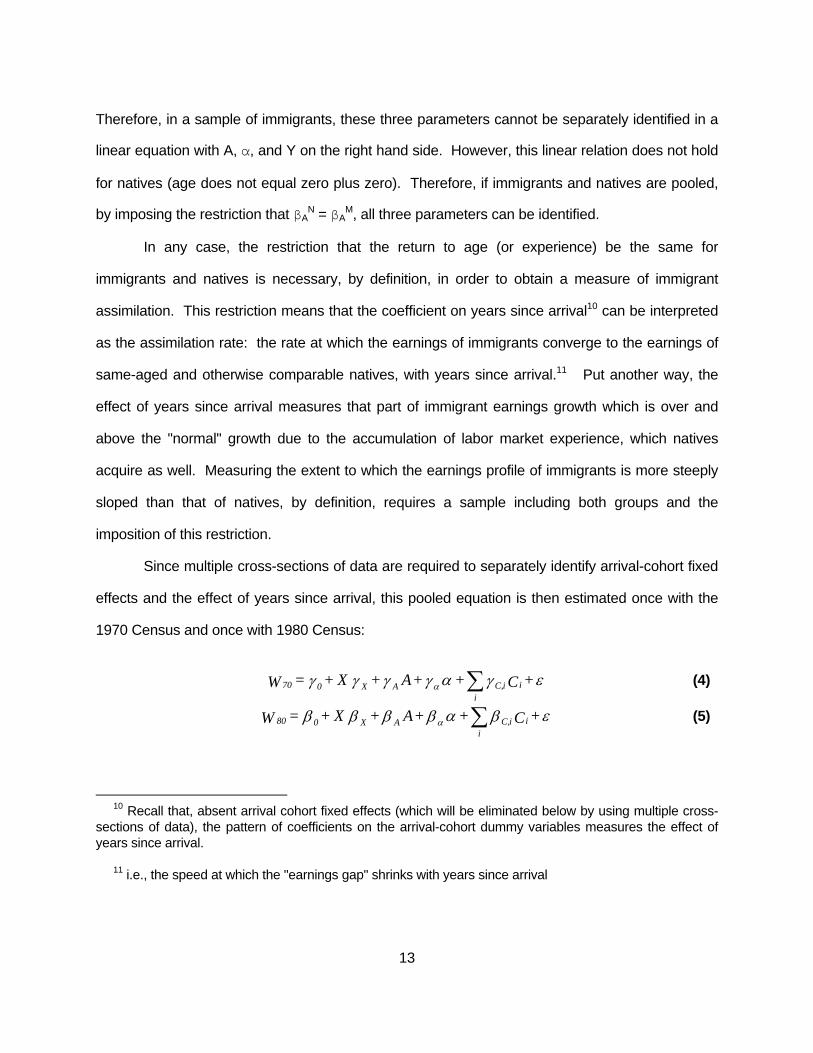
Therefore, in a sample of immigrants, these three parameters cannot be separately identified in a
linear equation with A, α, and Y on the right hand side. However, this linear relation does not hold
for natives (age does not equal zero plus zero). Therefore, if immigrants and natives are pooled,
by imposing the restriction that βAN = βA
M, all three parameters can be identified.
In any case, the restriction that the return to age (or experience) be the same for
immigrants and natives is necessary, by definition, in order to obtain a measure of immigrant
assimilation. This restriction means that the coefficient on years since arrival10 can be interpreted
as the assimilation rate: the rate at which the earnings of immigrants converge to the earnings of
same-aged and otherwise comparable natives, with years since arrival.11 Put another way, the
effect of years since arrival measures that part of immigrant earnings growth which is over and
above the "normal" growth due to the accumulation of labor market experience, which natives
acquire as well. Measuring the extent to which the earnings profile of immigrants is more steeply
sloped than that of natives, by definition, requires a sample including both groups and the
imposition of this restriction.
Since multiple cross-sections of data are required to separately identify arrival-cohort fixed
effects and the effect of years since arrival, this pooled equation is then estimated once with the
1970 Census and once with 1980 Census:
10 Recall that, absent arrival cohort fixed effects (which will be eliminated below by using multiple cross-sections of data), the pattern of coefficients on the arrival-cohort dummy variables measures the effect of years since arrival.
11 i.e., the speed at which the "earnings gap" shrinks with years since arrival
εγαγγγγ α +C++A+X+=W iiC,i
AX070 ∑ (4)
εβαββββ α +C++A+X+=W iiC,i
AX080 ∑ (5)

14
The rate at which immigrants catch up to natives with time since immigration can be measured by
observing the same arrival cohort of immigrants in 1970 and again in 1980 and measuring the
extent to which the size of the immigrant-native earnings gap has narrowed over those ten years.
This, again, can be seen as the difference between points A and B in Figure One. In terms of the
above regressions, this is computed as (βc,i-γc,i).
Changes in cohort quality can be measured by comparing the earnings of cohort i at a
given number of years since immigration to the earnings of cohort i-10 at that same number of
years since migration. For example, we can compare the 1980 earnings of immigrants who came
in 1960-69 (11-20 years after arrival) to the 1970 earnings of immigrants who came in 1950-59
(also 11-20 years after arrival). In Figure One, this is seen as the difference between points C and
A. In terms of the coefficients above, this measure can be expressed as (βc,i-γc,i-10).
V. Data
The data I use are taken from the Public Use Microdata Samples of the U.S. Census of
1970 and 1980. For 1970, I use the 1/100 (i.e. 1% of the U.S. population), county group, 5%
questionnaire sample. For 1980, I use the 1/100 B sample.
I group immigrants into eight categories, primarily according to geographic criteria,
but also on the basis of country similarity in terms of economic development, income distribution,
etc.: 1) W. Europe-- Western and Northern Europe 2) E. Europe-- Eastern Europe, the USSR, and Southern Europe 3) W. Asia-- North Africa and Asia outside of the Far East 4) E. Asia-- the Far East 5) Mexico

15
6) Other Hispanic-- South and Central America and the Caribbean 7) English Speaking countries-- Great Britain, Canada, Australia, New Zealand, and South Africa 8) Other-- primarily sub-Saharan Africa and the Pacific
The country breakdown of immigration to the U.S. can be seen in Table Three. Before
1950, over three quarters of all immigrants came from Europe and from English speaking
countries. In the subsequent thirty years, however, there was a dramatic change in the origin
country pattern of immigration. Approximately 40% of all immigrants in 1980 came from Mexico12
and other Hispanic countries, with another quarter coming from East Asia.
This study analyzes male immigrants only. This is because the labor market participation
patterns of women differ greatly across countries, making it much more complicated to assess the
U.S. labor market "performance" of female immigrants than is the case for men.
The full 1/100 census samples from 1970 and 1980 together contain approximately 4
million individuals. Sampling only males and only those for whom information on key variables is
not imputed reduces the sample to around 1.7 million. Of those males, 90,818 are immigrants.
For computational manageability, I randomly sample 1 in 4 natives, bringing the total number of
natives down to 415,253.
Because of small sample sizes for the West Asia and "Other" categories, I do not include
these groups in the analysis. I also do not include immigrants from English speaking countries.
This is because their assimilation behavior is qualitatively different from that of all the other groups.
The fact that their behavior is quite different provides evidence for the relative importance of
language for immigrant labor market performance. For the purposes of this analysis, however,
12 for a discussion of the number of illegal immigrants to the U.S., see Warren and Passel (1987), Passel and Woodrow (1987), Borjas, Freeman, and Lang (1991).

16
including them would only cloud the results for those from non-English speaking countries. Once
these groups are dropped and only full-time income-earning labor force participants are sampled,
there are 164,277 natives and 29,719 immigrants in the sample. For most of the analysis,
immigrants who arrived before 1950 are also excluded, reducing the number of immigrants by
about one-third. This is because their year of arrival is not reported more finely than "pre-1950",
so that key variables cannot be computed.
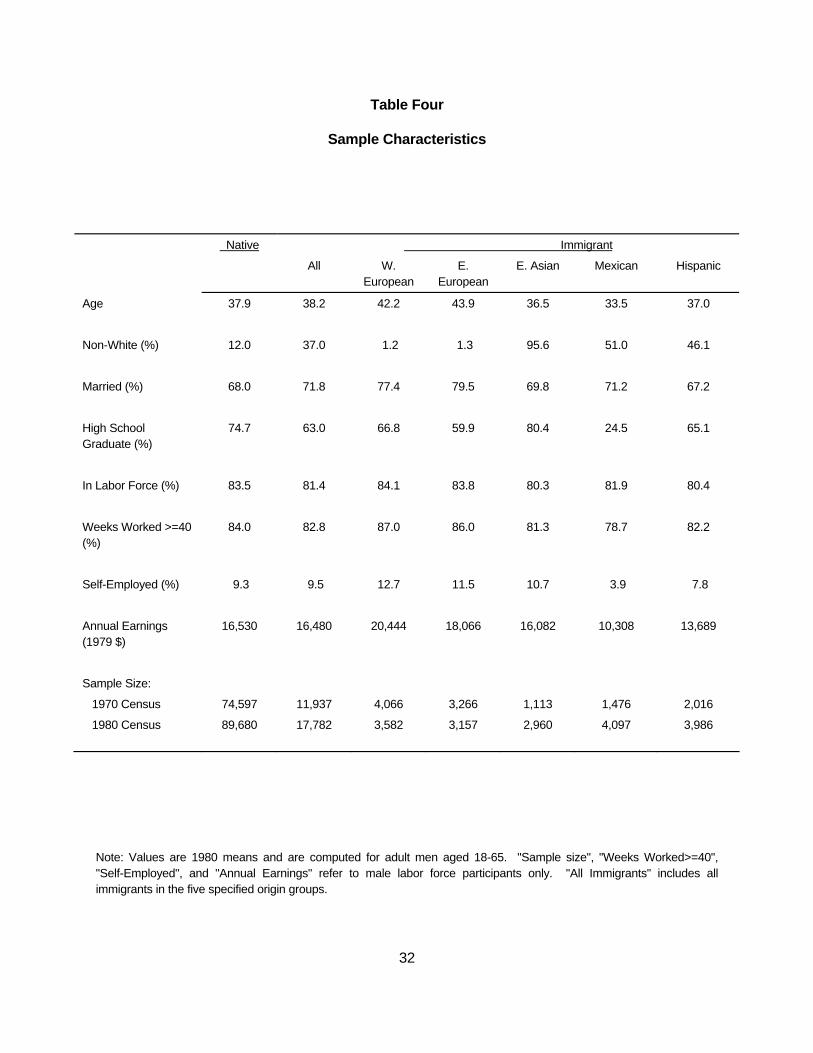
The sample characteristics of immigrant men in the remaining five country of origin groups
and native men are summarized in Table Four. European immigrants are the oldest group. The
most highly educated are East Asians and natives. Mexicans are the youngest and least
educated of the origin groups. Labor force participation is around 80% for the entire sample.
Contrary to popular conceptions, the self-employment rate of East Asians is not much higher than
the native rate. Finally, not correcting for any observable characteristics, Western Europeans
have the highest average annual earnings, with Mexicans earning only about half as much.
VI. Results
The dependent variable in all of the regressions run is the log of annual salary plus self-
employment earnings. The right hand side variables in all specifications include weeks worked,
four education categories, an experience13 quartic, race, and marital status. Dummy variables for
occupation and industry are not included in order to capture movements across these categories
as part of the process through which immigrants improve their earnings.14 Immigrants are pooled
with native men, who are the base group.
13 where experience is defined as potential labor market experience: age-education-6.
14 The classic example, of course, is the professional immigrant who works for a while as a taxi driver.

17
For immigrants, there is a dummy included for each of five arrival cohorts (1950-59, 1960-
64, 1965-69 in both the 1970 and 1980 regressions. In the 1980 regressions, there are also
dummies for the 1970-74 and 1975-79 arrival cohorts). When different immigrant groups are
included in the same regression, a set of dummy variables for country of origin categories is
included on the right hand side as well.
Results of the basic regression from 1980 appear in Table Five. For immigrants, all five
arrival-cohort dummies are included, so one country of origin dummy must be dropped. The
omitted origin group is Eastern Europeans. The country of origin dummies in this regression
therefore measure the earnings of various immigrant groups relative to the earnings of Eastern
Europeans. For example, the Western European dummy of .08 means that Western Europeans
earn 8% more than Eastern Europeans. East Asians also earn more, while Mexicans and
Hispanics earn less.
Turning to the arrival-cohort dummies, as in other studies, most immigrants are found to be
at an earnings disadvantage relative to natives. This disadvantage is greatest for the most recent
arrivals and becomes progressively smaller for those immigrants who have been in the country
longer. In the case of the Eastern European base group, those who have been in the U.S. for over
twenty years actually earn slightly more than comparable natives.
The pattern in the coefficients on the cohort dummies masks three separate effects: 1) the
true within-cohort rate of earnings catch up, 2) differences in cohort quality, and 3) differences in
average age at arrival. The following four sections of the paper provide estimates of the size of
these three effects, investigating the effect of age at arrival on immigrant earnings and the
importance of correcting for it in measures of immigrant catch up and cohort quality.

18
VI.1 The Effect of Age At Arrival on Immigrant Earnings
The regression in Table Five presented the standard results on immigrant earnings found
in cross-sections of U.S. data. Introducing the effect of age at arrival to this basic equation
produces the result shown in Figure Three.
On the horizontal axis in this graph is age at arrival. On the vertical axis are average
earnings of immigrants, relative to comparable natives. This measure hold constant observable
characteristics, country of origin, and years since arrival.15 The figure plots the values of individual
age-at-arrival dummy variables added to the specification just shown, so that each dummy
captures the earnings of immigrants who arrived at a particular age, relative to their native
counterparts.
Immigrating at a late age is seen to have a strong negative effect on the relative earnings
of an immigrant. Relative earnings are roughly the same for all those immigrating as children, but
become increasingly negative for adults.16
Table Six presents estimates of the effect of age at arrival on immigrant relative earnings.
In the top row, all immigrants are pooled together, with separate estimates for each of the five
origin groups shown in the rows below. The leftmost column contains the coefficient on age at
immigration, entered as a linear, continuous variable in the basic earnings regression, while the
effect is allowed to vary by arrival cohort in the set of columns to the right.
Looking at the upper left-hand corner of the table, the average coefficient on age at arrival
for all countries and cohorts is -.0058 per year of age at arrival. To put this in the context of the
example described earlier, holding all else constant, the relative wage of the immigrant who came
15 As explained above, this cannot be separated from cohort fixed effects in a single cross-section.
16 There are very few immigrants who arrived at high ages and are still participating in the labor force. These small cell sizes are the reason that the line in Figure Three jumps at higher arrival ages.

19
as a 5 year old will be 11.6 percentage points higher than that of an immigrant who came as an 25
year old.
The importance of this effect varies by country of origin. Age at arrival matters a great deal
for East Asians, and more than average for Mexicans and Hispanics. The effect for Western
Europeans, on the other hand, is virtually negligible. This could be because the negative effect of
arriving in adulthood is counteracted by strong positive self-selection among adult immigrants from
Western Europe. It would not be unreasonable to imagine that only those Western Europeans
who expect to do quite well in the United States immigrate.17 If the children such immigrants bring
with them are not subject to this positive selection, the selection and arrival age effects for this
group may well cancel each other out.18
When the effect of age at immigration is allowed to differ by cohort (columns 2-6), the
coefficients are again large, negative, and statistically significant (again, with the exception of the
Western Europeans). The effect appears to be most pronounced among recent arrivals, a point
which will be discussed in section VI.3 below.
VI.2 The Effect of Age at Arrival on Cross-Sectional Patterns
In the second section of the paper, it was demonstrated that the more recent the cohort,
the higher the average age at arrival of its members. Since it has also been shown that age at
arrival has a strong negative effect on earnings, it seems logical that adding a correction for age at
arrival will compress the large earnings difference between early and recent cohorts found in a
17 see Borjas 1987.
18 Another reason for a small effect of age at arrival for this group could be that human capital from Western Europe is more readily transferable to the U.S. labor market than human capital from other countries. In addition, many Western European immigrants may know English upon arrival to the United States.

20
cross-section.
To examine this effect, Table Seven presents estimates of the immigrant-native earnings
gap by arrival cohort, both with and without a correction for age at arrival.19 The results in each
column come from a separate regression. The coefficients presented are arrival-cohort fixed
effects from 1980 earnings equations, comparing the earnings of the specified cohort to those of
the omitted 1950-59 arrival cohort. These numbers show how far behind recent immigrants are
relative to earlier ones. In the first column, we see that, as in Table 5, the more recent the cohort,
the lower its earnings, compared to the 1950-59 base group. Those arriving in 1965-69 earn 7.6%
less and those arriving in 1975-79 earn 27.9 percentage points less.
We can now compare this cross-sectional difference in the earnings of different cohorts,
with and without a correction for age at arrival. In the two columns labelled "All Immigrants", the
earnings of the 1975-79 cohort, relative to 1950s immigrants, rises from -27.9% to -20.3% when
age at arrival is added to the regression. This means that the earnings difference between earlier
and more recent cohorts is not as large as it would have appeared. This compression takes place
for virtually all cohorts and origin groups (again excepting Western Europeans). It thus appears
that about one quarter of the cross-sectional difference between early and recent arrivals is simply
due to their artificially different ages at immigration. The remaining difference can be attributed
either to true within-cohort earnings convergence or to changes in cohort quality.
19 The numbers in the table are the estimated coefficients on arrival-cohort dummies from 1980 log earnings equations. The numbers in each column come from a separate regression. Two regressions are run for each origin group, one without and one with a correction for age at arrival.

21
VI.3 Immigrant-Native Earnings Convergence
Having established in Section VI.1 that the immigrant-native earnings gap is smaller for
those immigrants who arrive at younger ages, we now turn to measures of the rate at which that
gap narrows with time since migration, correcting for age at arrival.
Table Eight shows the extent to which immigrants improve their standing, relative to
natives, with time spent in the United States. Recall that to identify this parameter requires two
cross-secions of data. The measures in the table are the reduction in the immigrant-native
earnings gap for the specified arrival cohort over the ten years between 1970 and 1980.20 In
Figure One, this is seen as the difference between point A and point B. In terms of the regression
framework laid out in Section Four, this is (βc,i-γc,i). The "uncorrected" estimates in the table
correspond to the difference between points C and B in Figure Two. The "corrected" estimates
correspond to the difference between points A and B for children (those who migrated before age
19) and the difference between points C and D for adults (those who migrated at age 19 or older).
The results when all immigrants are pooled together are shown in the top three rows of
Table Eight. When arrival age is not corrected for (top row), the rate at which immigrants catch up
to natives is estimated at around 1.5% per year. This number is largest for the most recent
arrivals, implying that the rate of catch up is nonlinear, that is, quite steep in the first years after
immigration and levelling off subsequently.21
Rows 2 and 3 present the corrected estimates of earnings catch up by age at arrival,
where "Children" are defined as those who immigrated before age 19 and "Adults" are defined as
those who came at age 19 or older. As was predicted above, once age at arrival is corrected for,
20 Recall that the gap is the coefficient on an immigrant group dummy in a pooled earnings equation.
21 Earnings catch up is expressed in terms of a gain in relative earnings, not in terms of how much of the original gap has been eliminated. Thus, if the difference between immigrant and native earnings decays exponentially with years since migration, the rate of catch up measured here will fall over time.

22
estimates of relative earnings growth are much smaller, at least for those who immigrated as
children. For this group, relative earnings only rise by about .5% per year. The catch up rate for
immigrants who came as adults is still high, although it is smaller than the uncorrected version for
all groups, except Europeans.22 In any case, since one-third of the immigrants in this sample
came to the United States as children, failing to correct for age at arrival leads to a large
overestimate of the rate at which the immigrant-native earnings gap narrows over time for the
typical immigrant.23
The fact that high arrival-age immigrants catch up at a faster rate than low arrival-age
immigrants (with the exception of East Asians) should not be confused with the fact that the former
group still earns relatively less at every point in time. This result simply indicates that the
difference in the immigrant-native earnings gap of these two groups is reduced somewhat over
time.
VI.4 Changes in Cohort Quality
Much work has been done, primarily by Borjas (1985, 1987, 1990b), on changes in the
quality of recent immigrant cohorts. In particular, this work has argued that, as a result of changes
in U.S. immigration policy in 1964, emphasizing family ties over skill qualifications, immigrants to
the U.S. are now of lower "quality" than were earlier cohorts. This decline in quality is said to have
occurred not just in terms of observable skill levels, but also as a drop in earnings, once changes
in skill levels and demographic factors have been accounted for. This is interpreted as a decline in
22 Unfortunately, when convergence rates are estimated separately by origin category, small cell sizes prevent precise inferences about the cross-country differences in this pattern.
23 When the average is broken down into country categories, most of the estimates are statistically insignificant, due to small cell sizes (cells of origin group by cohort by age by year).

23
the unobserved ability or motivation of recent immigrants.
Measures of change in the skill-corrected quality of successive immigrant cohorts are
presented in Table Nine. The measures in the table are the difference in the level of immigrant-
native relative earnings (i.e. immigrant dummy variables), comparing two arrival cohorts at the
same number of years since immigration. For example, in the first column, the earnings of
immigrants in the 1960-69 cohort are observed in 1980 (11-20 years after migration) and
compared to the earning of immigrants in the 1950-59 cohort when it is observed in 1970 (also at
11-20 years after migration). This is the difference between points C and A in Figure One. In
terms of the regression framework laid out above, this is calculated as (βc,i-γc,i-10).
The middle column of this table compares the last cohort to come before the change in the
immigration law with the cohort that came five years after the new policy took effect. To the extent
that the law changed the quality of immigrants admitted to the country, it should be most apparent
in this column.
The averages in the top row, computed for all immigrant groups pooled, mask important
differences across country of origin groups. We thus look at the results by origin group, although
the standard errors are often too large for precise inferences to be made. When age at
immigration is not taken into account, there appears to have been a decline in the quality of
cohorts in all country of origin groups, except for Western Europe. Once age at arrival is corrected
for, however, the picture appears quite different. There does appear to have been a decline in
cohort quality for Hispanics and Europeans. There is no evidence, however, of a decline in the
quality of immigrants from Mexico or East Asia. If anything, the cohort that came after the family
reunification laws took effect seems to be doing relatively better than the earlier cohort did at the
same stage (i.e. years since arrival). Some of the previously measured decline in cohort quality
over this period can thus be attributed to differences in average ages at migration, rather than to a
decline in the underlying ability or motivation of the newer immigrants.

24
VII. Conclusion
In this paper, I show that age at arrival is an important determinant of immigrant earnings
in the United States. Holding constant other factors, immigrants who arrive at older ages earn
significantly less at every stage of their assimilation paths than do their younger arrival-age
counterparts. This is true for all of the country of origin groups examined, with the exception of
Western Europeans. For this group, I hypothesize that different selection mechanisms
determining the immigration of adults and children cancel out the negative effect of age at arrival.
Among labor force participants, age at arrival is shown to be spuriously negatively
correlated with time since immigration. This relationship is due to the fact that, among immigrants
who arrived a long time ago, only those who arrived at young ages are still in the labor force.
Similarly, among recent arrivals, only those who arrived as adults are already in the labor force.
Failing to explicitly account for the negative effect of age at immigration on earnings thus biases
measures of the relative earnings of different immigrant groups and the changes in those
differences over time. In particular, once age at arrival is taken into account, the cross-sectional
difference between early and recent arrivals is reduced by about 25%.
The extent to which the gap between immigrant and native earnings narrows with time
since migration is found to be smaller than the rate implied by uncorrected estimates. Although
they earn relatively more at every point, immigrants who arrive at young ages experience much
less relative earnings growth over time than do immigrants who arrive at older ages. The
advantage of low arrival age thus declines somewhat over time.
Finally, correcting for age at arrival has mixed effects on estimates of the change in the
skill-corrected quality of successive immigrant cohorts. The decline in cohort quality found in
previous studies is maintained in my results for European and non-Mexican Hispanic immigrants. I
find no evidence, however, of a quality decline among more recent immigrants from Mexico or
East Asia, who, in 1980, comprised just under half of all immigration to the United States.

25
Bibliography Abowd, John and Richard Freeman. Immigration, Trade, and the Labor Market. Chicago: University of Chicago Press, 1991. Altonji, Joseph and David Card. The Effect of Immigration on the Labor Market Outcomes of Less-Skilled Natives. NBER Working Paper #3123, September, 1989. Bailey, Thomas. Immigrant and Native Workers: Contrasts and Competition. Denver: Westview Press, 1987. Bartel, Ann. "Where Do the New U.S. Immigrants Live?" Journal of Labor Economics. October, 1989. Bartel, Ann and Marianne Koch. Internal Migration of Male U.S. Immigrants. in Abowd and Freeman (1991). Becker, Gary. Human Capital. Chicago: University of Chicago Press, 1975. Blau, Francine. The Fertility Behavior of Immigrant Women. NBER conference paper, January, 1990. Bloom, David and Morley Gunderson. An Analysis of the Earnings of Canadian Immigrants. in Abowd and Freeman (1991). Borjas, George. "Assimilation, Changes in Cohort Quality, and the Earnings of Immigrants." Journal of Labor Economics, October 1985. -----. Friends or Strangers: The Impact of Immigrants on the US Economy. New York: Basic Books, 1990. -----. The Intergenerational Mobility of Immigrants. unpublished manuscript, May 1990. -----. National Origin and the Skills of Immigrants in the Postwar Period. NBER Working Paper #3575, January, 1990. -----. "Self-Selection and the Earnings of Immigrants." American Economic Review, vol.77 no.4, September, 1987. Borjas, George and Stephen Bronars. Immigration and the Family. unpublished manuscript, January 1989. Borjas, George, Richard Freeman and Kevin Lang. Undocumented Mexican-Born Workers in the US: How Many, How Permanent? in Abowd and Freeman (1991). Borjas, George, Richard Freeman, and Lawrence Katz. On the Labor Market Effects of

26
Immigration and Trade. NBER Working Paper #3761, June, 1991. Bronars, Stephen. Immigration, Internal Migration, and Economic Growth 1940-80. NBER conference paper, January, 1990. Butcher, Kristin F. "Black Immigrants to the United States: A Comparison with Native Blacks and Other Immigrants." Princeton University Industrial Relations Section Working Paper #268. November, 1991. Card, David. The Impact of the Mariel Boatlift on the Miami Labor Market. Princeton University Industrial Relations Section Working Paper #253, May, 1989. Carliner, Geoffrey. "Wages, Earnings, and Hours of First, Second, and Third Generation American Males," Economic Inquiry, January, 1980. Chiswick, Barry. "The Effect of Americanization on the Earnings of Foreign-Born Men." Journal of Political Economy, October, 1978. Chiswick, Barry. "Is the New Immigration Less Skilled than the Old?" Journal of Labor Economics. April, 1986. Chiswick, Barry. "A Longitudinal Analysis of the Occupational Mobility of Immigrants." Proceedings of the 30th Annual Winter Meeting, Industrial Relations Research Association, 1978. Chiswick, Barry. "Speaking, Reading, and Earnings Among Low-Skilled Immigrants." Journal of Labor Economics, April, 1991. Eichengreen, Barry and Henry A. Gemery. "The Earnings of Skilled and Unskilled Immigrants at the End of the Nineteenth Century." Journal of Economic History. 1986. Filer, Randall. The Impact of Immigrant Arrivals on Migratory Patterns of Native Workers. NBER conference paper, January, 1990. Freeman, Richard and Lawrence Katz. Industrial Wage and Employment Determination in an Open Economy. Harvard mimeo, September, 1988. Friedberg, Rachel M. You Can't Take it With You? Immigration and the Returns to Human Capital: Evidence From Israel. MIT mimeo, May, 1991. Greenwood, Michael and John McDowell. "The Factor Market Consequences of U.S. Immigration." Journal of Economic Literature, vol. XXIV, November, 1986. Gregory, Robert, R. Anstie and E. Klug. Why Are Low-Skilled Immigrants in the US Poorly Paid Relative to their Australian Counterparts?. in Abowd and Freeman (1991). Jasso, Guillermina and Mark Rosenzweig. "How Well Do U.S. Immigrants Do? Vintage Effects,

27
Emigration Selectivity, and Occupational Mobility." Research in Human Capital and Development. 1988. Kossoudji, Sherrie. "Immigrant Worker Assimilation: Is It a Labor Market Phenomenon?" Journal of Human Resources, vol. 24, no.3, Summer, 1989. Kuhn, Peter and Ian Wooton. Immigration, International Trade, and the Wages of Native Workers. in Abowd and Freeman (1991). LaLonde, Robert and Robert Topel. Labor Market Adjustments to Increased Immigration. Chicago mimeo, March, 1989. LaLonde, Robert and Robert Topel. The Assimilation of Immigrants in the U.S. Labor Market, NBER Working Paper #3573, December, 1990. Leonard, Jonathan and Rachel McCulloch. Foreign-Owned Businesses in the US. in Abowd and Freeman (1991). McManus, Walter, William Gould and Finis Welch. "Earnings of Hispanic Men: The Role of English Language Proficiency." Journal of Labor Economics, April, 1983. Mincer, Jacob. Schooling, Experience, and Earnings. New York: Columbia University Press, 1974. Passel, Jeffrey and Karen Woodrow. "Change in Undocumented Alien Population in the United States, 1979-83." International Migration Review, vol. 21, 1987. Piore, Michael. Birds of Passage: Migrant Labor and Industrial Societies. New York: Cambridge University Press, 1979. Ramos, Fernando. Outmigration and Return Migration of Puerto Ricans. NBER conference paper, January, 1990. Sjaastad, Larry. "The Costs and Returns of Human Migration." Journal of Political Economy, October, 1962. Smith, James. Hispanics and the American Dream: An Analysis of Hispanic Male Labor Market Wages 1940-1980. Rand mimeo, 1991. U.S. Department of Commerce, Bureau of the Census. Census of Population and Housing, 1970: Public Use Microdata Sample (County Group Sample): 5% Questionnaire, 1/100 Sample. Washington D.C., 1970. U.S. Department of Commerce, Bureau of the Census. Census of Population and Housing, 1980: Public Use Microdata Sample (B Sample): 1-Percent Sample. Washington D.C., 1983. U.S. Department of Commerce, Bureau of the Census. Public Use Samples of Basic Records

28
From the 1970 Census: Description and Technical Documentation. Washington D.C.: Government Printing Office, 1977. U.S. Department of Commerce, Bureau of the Census. Census of Population and Housing, 1980: Public Use Microdata Samples Technical Documentation. Washington D.C.: Government Printing Office, 1983. Warren, Robert and Jeffrey Passel. "A Count of the Uncountable: Estimates of Undocumented Aliens Counted in the 1980 Census." Demography, vol.24, August, 1987.

29
Table One Average Age at Arrival
Population Labor Force Participants Country of Origin
Arrival Cohort
Age Years Since Arrival
Age at Arrival
Age Years Since Arrival
Age at Arrival
All 1950-59 46.6 25.5 21.2 43.0 25.5 17.6 Immigrants 1960-64 39.4 18.0 21.5 38.5 18.0 20.5 1965-69 35.0 13.0 22.1 37.4 13.0 24.4 1970-74 30.2 8.0 22.2 34.4 8.0 26.4 1975-79 25.1 3.0 22.2 31.7 3.0 28.7 W. European 1950-59 44.6 25.5 19.3 40.9 25.5 15.6 1960-64 38.4 18.0 20.5 37.3 18.0 19.3 1965-69 34.6 13.0 21.7 37.8 13.0 24.8 1970-74 31.3 8.0 23.4 37.1 8.0 29.1 1975-79 24.6 3.0 21.6 33.4 3.0 30.4 E. European 1950-59 53.8 25.5 28.4 48.6 25.5 23.2 1960-64 44.8 18.0 26.8 41.3 18.0 23.3 1965-69 38.7 13.0 25.7 38.9 13.0 25.9 1970-74 34.5 8.0 26.5 36.8 8.0 28.8 1975-79 30.9 3.0 28.0 35.0 3.0 32.0 E. Asian 1950-59 42.3 25.5 17.1 40.3 25.5 15.0 1960-64 38.4 18.0 20.4 37.9 18.0 19.9 1965-69 35.6 13.0 22.4 38.0 13.0 25.0 1970-74 30.8 8.0 22.9 35.9 8.0 27.9 1975-79 26.7 3.0 23.7 34.2 3.0 31.2 Mexican 1950-59 44.3 25.5 18.9 41.8 25.5 16.5 1960-64 36.9 18.0 19.0 36.7 18.0 18.7 1965-69 29.9 13.0 17.0 33.1 13.0 20.1 1970-74 26.6 8.0 18.6 30.8 8.0 22.8 1975-79 21.2 3.0 18.3 27.1 3.0 24.1 Hispanic 1950-59 46.1 25.5 20.6 44.4 25.5 18.9 1960-64 41.1 18.0 23.1 39.4 18.0 21.4 1965-69 37.8 13.0 24.8 38.8 13.0 25.8 1970-74 31.5 8.0 23.5 35.3 8.0 27.3 1975-79 25.3 3.0 22.3 31.5 3.0 28.5
Note: Values are means for male immigrants, tabulated using the 1980 U.S. Census 1/100 sample.

30
Table Two Identification Illustration
Current Year
Current Age
Current Wage
Year of Arrival
Years Since Arrival
Age at Arrival
Relative Wage
Immigrant Parent
1980 45 70 1960 20 25 .70
Native Parent
1980 45 100 -- -- -- --
ImmigrantChild
1980 25 45 1960 20 5 .90
Native Child
1980 25 50 -- -- -- --
Note: hypothetical data for the purpose of illustration.

31
Table Three The Sources of Immigration to the United States
Country of Origin pre-1950 1950-59 1960-64 1965-69 1970-74 1975-79
W. Europe 33.9 30.4 17.0 10.1 5.8 4.5
E. Europe 24.9 21.8 10.6 12.9 9.6 7.1
W. Asia 1.5 2.9 4.3 7.4 9.1 13.0
E. Asia 5.2 6.2 8.5 13.1 18.8 25.3
Mexico 7.6 13.2 14.9 17.7 25.7 22.5
Other Hispanic 3.1 7.7 26.4 27.0 22.7 16.5
English Speaking 20.5 15.5 15.2 8.8 4.6 6.6
Other 3.3 2.3 3.1 3.1 3.8 4.5
Total 100.0 100.0 100.0 100.0 100.0 100.0 Note: Figures are for males only, tabulated using the 1980 U.S. Census 1/100 sample. "Other" category includes primarily sub-Saharan Africa and the Pacific.
32
Table Four Sample Characteristics
Native Immigrant
All W. European
E. European
E. Asian Mexican Hispanic
Age 37.9 38.2 42.2 43.9 36.5 33.5 37.0
Non-White (%) 12.0 37.0 1.2 1.3 95.6 51.0 46.1
Married (%) 68.0 71.8 77.4 79.5 69.8 71.2 67.2
High School Graduate (%)
74.7 63.0 66.8 59.9 80.4 24.5 65.1
In Labor Force (%) 83.5 81.4 84.1 83.8 80.3 81.9 80.4
Weeks Worked >=40 (%)
84.0 82.8 87.0 86.0 81.3 78.7 82.2
Self-Employed (%) 9.3 9.5 12.7 11.5 10.7 3.9 7.8
Annual Earnings (1979 $)
16,530 16,480 20,444 18,066 16,082 10,308 13,689
Sample Size:
1970 Census 74,597 11,937 4,066 3,266 1,113 1,476 2,016
1980 Census
89,680 17,782 3,582 3,157 2,960 4,097 3,986
Note: Values are 1980 means and are computed for adult men aged 18-65. "Sample size", "Weeks Worked>=40", "Self-Employed", and "Annual Earnings" refer to male labor force participants only. "All Immigrants" includes all immigrants in the five specified origin groups.

33
Table Five Earnings Determination for Natives and Immigrants
Variable Coefficient Standard Error
constant
7.76
(.030)
weeks 48-49
.147
(.010)
weeks 50-52 .237 (.007)
education =12
.228
(.006)
education 13-15 .345 (.007)
education >=16 .641 (.006)
experience
.140
(.006)
experience2/100 -.519 (.033)
experience3/1000 .089 (.008)
experience4/10000 -.0061 (.0006)
non-white
-.171
(.006)
married .171 (.005)
Country of Origin:
W. European .080 (.017)
E. Asian .064 (.019)
Mexican -.138 (.017)
Hispanic -.097 (.016)
Arrival Cohort:
arrived 1950-59 .034 (.015)
arrived 1960-64 .033 (.018)
arrived 1965-69 -.042 (.016)
arrived 1970-74 -.135 (.016)
arrived 1975-79 -.245 (.017)
R2
.237
observations 98,447
Note: The dependent variable is the log of 1980 annual salary and self-employment earnings. Immigrant and native men are pooled. The base group is unmarried white natives with less than 12 years of schooling who worked 40-47 weeks in 1980. The omitted immigrant dummy is for the Eastern European category. Standard errors are in parentheses.

34
Table Six The Effect of Age at Arrival on Immigrant Earnings
Country of Origin
Arrival Cohort
All 1950-59 1960-64 1965-69 1970-74 1975-79 All Immigrants -.0058 -.0013 -.0045 -.0058 -.0102 -.0087 (.0005) (.0010) (.0012) (.0011) (.0011) (.0012) W. European .0009 .0008 .0043 -.0007 -.0035 .0005 (.0011) (.0015) (.0026) (.0031) (.0038) (.0045) E. European -.0052 .0000 -.0038 -.0032 -.0081 -.0177 (.0012) (.0022) (.0031) (.0024) (.0028) (.0033) E. Asian -.0111 -.0062 -.0093 -.0149 -.0123 -.0108 (.0013) (.0032) (.0040) (.0031) (.0024) (.0022) Mexican -.0090 -.0048 -.0089 -.0046 -.0147 -.0102 (.0016) (.0024) (.0029) (.0029) (.0023) (.0025) Hispanic -.0073 -.0048 -.0072 -.0057 -.0111 -.0059 (.0010) (.0029) (.0020) (.0018) (.0018) (.0026)
Note: Measures are the overall (column 1) and the cohort specific (remaining columns) return to age at arrival from 1980 earnings equations. Estimates for "All Immigrants" correct for area of origin. Standard errors are in parentheses.

35
Table Seven Earnings by Arrival Cohort Without and With a Correction for Age at Arrival Arrival Cohort
All Immigrants W. European E. European E. Asian Mexican Hispanic
1960-64 -.0011 .0239 -.0310 -.0357 -.0313 -.0214 .0504 .1196 -.0678 -.0429 .0594 .0892 (.0170) (.0171) (.0319) (.0325) (.0406) (.0406) (.0507) (.0513) (.0394) (.0395) (.0381) (.0383) 1965-69 -.0759 -.0304 -.0253 -.0339 -.0727 -.0510 -.0673 .0511 -.1260 -.0864 -.0671 -.0059 (.0159) (.0164) (.0356) (.0373) (.0335) (.0339) (.0439) (.0459) (.0352) (.0356) (.0367) (.0376) 1970-74 -.1689 -.1080 -.0086 -.0208 -.1941 -.1603 -.1890 -.0362 -.2487 -.1874 -.1147 -.0393 (.0157) (.0166) (.0427) (.0455) (.0345) (.0354) (.0411) (.0446) (.0313) (.0322) (.0373) (.0385) 1975-79 -.2785 -.2034 .0245 .0107 -.3962 -.3445 -.2899 -.0992 -.3633 -.2876 -.2085 -.1295 (.0165) (.0178) (.0454) (.0487) (.0397) (.0414) (.0407) (.0461) (.0321) (.0336) (.0401) (.0413) Age at -.00585 .00087 -.00521 -.01106 -.00898 -.00735 Arrival (.00053) (.00112) (.00121) (.00125) (.00116) (.00095) Note: The coefficients in this table are arrival-cohort fixed effects from 1980 earnings equations. They measure the earnings of the specified cohort, relative to the earnings of the omitted 1950-59 arrival cohort. Estimates for "All Immigrants" correct for area of origin. Standard errors are in parentheses.

36
Table Eight Within-Cohort Growth in Immigrant-Native Relative Earnings (over 10 years) Arrival Cohort Country of Origin Age at Immigration 1950-59 1960-64 1965-69 All Immigrants Uncorrected .092 .151 .210 (.017) (.023) (.022) Corrected: Child .069 .043 .043 (.026) (.042) (.059) Adult .095 .146 .198 (.021) (.025) (.023) W. European Uncorrected -.011 -.013 .072 (.022) (.039) (.043) Corrected: Child -.029 -.266 -.163 (.035) (.099) (.153) Adult .002 .029 .100 (.030) (.045) (.047) E. European Uncorrected .008 .043 .189 (.026) (.047) (.038) Corrected: Child -.024 -.016 -.131 (.053) (.110) (.135) Adult .013 .017 .189 (.030) (.054) (.042) E. Asian Uncorrected .046 .146 .117 (.051) (.055) (.042) Corrected: Child .086 .213 .211 (.085) (.146) (.230) Adult .021 .097 .084

37
Arrival Cohort Country of Origin Age at Immigration 1950-59 1960-64 1965-69 (.067) (.062) (.044)
Arrival Cohort Country of Origin Age at Immigration 1950-59 1960-64 1965-69 Mexican Uncorrected .159 .137 .232 (.036) (.045) (.041) Corrected: Child .184 .072 .167 (.057) (.081) (.095) Adult .116 .105 .201 (.048) (.056) (.048) Hispanic Uncorrected .000 .116 .112 (.042) (.030) (.028) Corrected: Child .013 .006 -.165 (.075) (.063) (.106) Adult -.034 .113 .102 (.052) (.035) (.031)
Note: The measures in this table are the rise in the value of immigrant-native relative earnings (i.e. the immigrant dummy) for a given arrival cohort between 1970 and 1980. The corrected estimate is computed once for immigrants who arrived before age 19 ("child") and once for those who arrived after age 19 ("adult"). Estimates for "All Immigrants" correct for area of origin. Standard errors on the differences are in parentheses.

38
Table Nine Cohort Quality Change
Arrival Cohort Country of Origin
Correction for Age at Arrival
1960-69 vs.
1950-59
1970-74 vs.
1960-64
1975-79 vs.
1965-69 All Immigrants Uncorrected .052 -.013 .012 (.018) (.023) (.023) Corrected .018 -.051 -.033 (.027) (.032) (.034) W. European Uncorrected -.040 .010 .122 (.026) (.048) (.051) Corrected -.170 -.150 -.051 (.046) (.067) (.072) E. European Uncorrected -.049 -.119 -.134 (.027) (.042) (.044) Corrected -.062 -.140 -.137 (.054) (.068) (.071) E. Asian Uncorrected .020 -.093 -.106 (.043) (.046) (.039) Corrected .232 .160 .175 (.075) (.086) (.091) Mexican Uncorrected .056 -.044 -.005 (.032) (.038) (.038) Corrected .126 .039 .084 (.057) (.065) (.069) Hispanic Uncorrected -.011 -.058 -.029 (.031) (.029) (.033) Corrected -.069 -.135 -.149 (.050) (.054) (.060)
Note: Values are the difference in the earnings, relative to natives, of the specified arrival cohorts when observed at the same number of years since arrival. A negative value corresponds to a decline in cohort quality. Estimates for "All Immigrants" correct for area of origin. Standard errors on the differences are in parentheses.
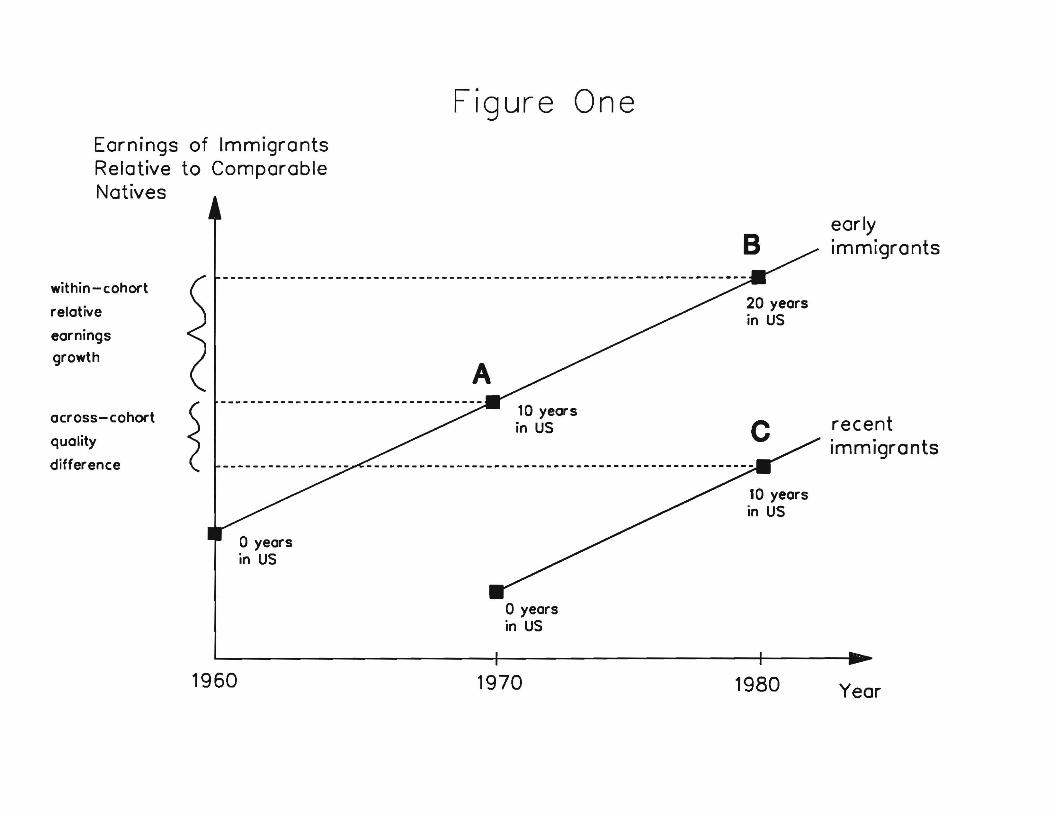
Figure One Earnings of Immigrants Relative to Comparable Natives
early immigrants
within - cohort
relative
earnings
growth
across-cohort recent quality immigrants difference
~ ----------------------------------- 10 years in US
B
20 years in US
c
10 years in US
o years in US
1960 1970 1980 Year

Fig ure Two uncorrectedEarnings of Immigrants estimate of
Relative to Comparable relative
Natives earnings growth ...B
_~ child at arrival A
adult at arrival
D 20 years
............ C in US ........ ......
10 years in USo years
in US
1960 1970 1980 Year

Figure Three
Earnings of Immigrants
Relative to Comparable
Natives
.33
o
-.33
o 10 20 30 40 50 60 Age at Arrival