Embed Size (px)
Citation preview

Immersive audiomotor game play enhances neural andperceptual salience of weak signals in noiseJonathon P. Whittona,b,1, Kenneth E. Hancocka,c, and Daniel B. Polleya,c,1
aEaton-Peabody Laboratories, Massachusetts Eye and Ear Infirmary, Boston, MA 02114; bProgram in Speech Hearing Bioscience and Technology,Harvard–Massachusetts Institute of Technology Division of Health, Sciences, and Technology, Cambridge, MA 02139; and cDepartment of Otologyand Laryngology, Harvard Medical School, Boston, MA 02115
Edited by Nancy J. Kopell, Boston University, Boston, MA, and approved May 13, 2014 (received for review December 3, 2013)
All sensory systems face the fundamental challenge of encodingweak signals in noisy backgrounds. Although discrimination abil-ities can improve with practice, these benefits rarely generalize tountrained stimulus dimensions. Inspired by recent findings thataction video game training can impart a broader spectrum ofbenefits than traditional perceptual learning paradigms, wetrained adult humans and mice in an immersive audio game thatchallenged them to forage for hidden auditory targets in a 2Dsoundscape. Both species learned to modulate their angular searchvectors and target approach velocities based on real-time changesin the level of a weak tone embedded in broadband noise. Inhumans, mastery of this tone in noise task generalized to animproved ability to comprehend spoken sentences in speechbabble noise. Neural plasticity in the auditory cortex of trainedmice supported improved decoding of low-intensity sounds at thetraining frequency and an enhanced resistance to interferencefrom background masking noise. These findings highlight thepotential to improve the neural and perceptual salience of de-graded sensory stimuli through immersive computerized games.
foraging | hearing | cortical | gradient search | noise suppression
Efficient search for resources is critical to the survival of mostspecies. As such, foraging represents a conserved, adaptive
behavior that drives decision making under the types of natu-ralistic contexts for which brains have evolved. Efficient foraginginvolves the dynamic integration of sensory cues, memory, andthe costs and values associated with foraging decisions (1–3). Thesensory cues used to guide foraging can be either discrete orgradient-based. For instance, moths, dogs, and humans navi-gate odor gradients using characteristic casting and zigzaggingbehaviors in response to dynamic somatosensory and olfactorycues (4–6). Although the successful execution of these behaviorswould be expected to strongly rely on the integration of rapidlychanging, weak and noisy sensory information, previous work hasprimarily focused on computations involved in cost/value deci-sions related to the exploration/exploitation trade-off (1, 2, 7–9),rather than whether and how foraging behavior is refined throughlearned associations between these dynamic sensory cues and re-inforcement signals (but see refs. 10–12).Accumulating evidence suggests that sensory learning in ma-
ture animals reflects the coordinated activation of sensory brainareas and neuromodulatory control nuclei (13). Of these neu-romodulatory systems, cholinergic and dopaminergic neurons inthe nucleus basalis and ventral tegmental area, respectively, havebeen observed to code cognitive operations of cue detection (14,15) and reward prediction (16) associated with behaviorallyrelevant sensory stimuli and to subserve learning in complexsensory-guided tasks (17). Theoretically, these learning systemsare maximally engaged by tasks that require the continuous in-terplay of sensory cues, dynamically updated motor action pro-grams, and neuromodulatory feedback as occurs during thenaturalistic process of sensory-guided foraging. This “closed-loop” approach to perceptual training has very little in commonwith traditional perceptual learning studies, wherein isolated and
unpredictable stimuli are presented at low rates with sparse,temporally distant feedback signals, and training improvementstypically do not generalize beyond the specific practice materials.By contrast, sensory-guided foraging shares many characteristicswith exploration-based, immersive sensorimotor learning taskssuch as musical training (18, 19) and action video game play (20–22), which appear to promote highly generalizable improvementsin sensory perception (18, 20, 21). Training protocols that engagelearning circuits at high rates and result in generalized im-provements in sensory perception offer appealing therapeuticoptions for perceptual disorders that have traditionally beenconsidered untreatable (23, 24), making the study of sensory-guided foraging behavior both theoretically interesting andclinically relevant.Much like our foraging ancestors, the modern urbanite faces
the challenge of guiding his/her behaviors using noisy, dynamicsensory cues. Examples of these conditions abound in the audi-tory domain, where distractors can impede communication withfriends at social gatherings, instruction from teachers in class-rooms, or transmission of information via a cellular phone. Asthe extraction of weak signals from background distractors rep-resents a universal perceptual problem, presenting in the hearingimpaired and typically hearing alike (25–30), it offers a good testcase for the malleability of perceptual skill following practice onan auditory foraging task.Using a combination of psychophysical measurements and in
vivo neurophysiological recordings in humans and mice, re-spectively, we examined (i) whether subjects could improve theirefficiency on a closed-loop auditory foraging task requiring them
Significance
All sensory systems face two fundamental limitations: (i) seg-regating partially overlapping sensory inputs into separateperceptual objects and (ii) raising sensory events that are ei-ther weak or noisy to perceptual awareness. The ability ofsensory systems to extract information from weak signals innoisy backgrounds can improve with practice, but learningdoes not typically generalize to untrained stimuli. By traininghumans and mice with an audio game inspired by sensoryforaging behavior, we show that learning to discriminatesimple, easily controlled sounds can generalize to improvedneural and perceptual processing of “real-world” complexsounds, including speech in noise. These findings suggest newtherapeutic options for clinical populations that receive littlebenefit from conventional sensory rehabilitation strategies.
Author contributions: J.P.W., K.E.H., and D.B.P. designed research; J.P.W. and D.B.P. per-formed research; K.E.H. contributed new reagents/analytic tools; J.P.W. analyzed data;and J.P.W. and D.B.P. wrote the paper.
The authors declare no conflict of interest.
This article is a PNAS Direct Submission.1To whom correspondence may be addressed. E-mail: [email protected] or [email protected].
This article contains supporting information online at www.pnas.org/lookup/suppl/doi:10.1073/pnas.1322184111/-/DCSupplemental.
www.pnas.org/cgi/doi/10.1073/pnas.1322184111 PNAS Early Edition | 1 of 10
NEU
ROSC
IENCE
PNASPL
US

to continuously discriminate changes in the level of a faint soundembedded in masking noise, (ii) the behavioral strategies used tosolve the foraging task, (iii) if, in humans, learning in the contextof foraging transferred to untrained tests of speech recognitionin the presence of distractors, and (iv) if, in mice, foraging ex-perience altered the neural representation of target signals anddistractors in primary sensory cortex. We found that, althoughboth humans and mice learned to improve their foraging effi-ciency with practice, disparate behavioral strategies were usedboth within and across species. Furthermore, behavioral im-provements on the foraging game were associated with improvedspeech perception in noise abilities in humans and enhancedneural representation of weak, noisy signals in primary auditorycortex of mice.
ResultsHumans and Mice Learn to Forage in a Soundscape for HiddenRewards. Human participants played an auditory foraging gamefor approximately one-half hour per day (33 ± 1 min) over thecourse of 1 mo. The objective of the game was to use a remote-controlled avatar to search a 2D, virtual soundscape for the lo-cation of a hidden target before time expired (Fig. 1A, Upper).The target location varied randomly from trial to trial. Visualsearch cues were not provided. The only available cue to locatethe hidden target came from the level of a 500-Hz tone pre-sented in a constant level of broadband masking noise. To makethe task perceptually demanding, the level of the tone relative todistractor [signal-to-noise ratio (SNR)] was decreased in realtime according to the Euclidean distance between the subjectand the hidden target location (Fig. 1A). Mice were engaged ina live-action version of the game played by humans, wherein theyalso foraged within a 2D soundscape to find the location of a lowSNR target and receive a water reward (Fig. 1A, Lower). Thus,mice and humans learned to develop adaptive movement strat-egies that would reveal subtle changes in SNR, allowing them tofind the virtual target location and receive reward.Consistent with observations in insects (4) and mammals (5,
31) (including humans) moving along odor gradients, we rarelyobserved direct paths to the target location. Rather, we typicallynoted sweeping initial searches that were ultimately refined asthe subjects closed on the target location. On some trials, thesepaths resembled the casting and zigzagging search strategies usedby insects operating on sporadic cues and partial information(4) (Fig. 1B). Over the course of training (humans, 1 mo; mice,3 mo), both species learned to find the auditory target locationmore successfully (n = 10 humans, P = 5 × 10⁻⁷; n = 4 mice, P =2.9 × 10⁻³, Friedman test; Fig. 1C) and to identify the target lo-cation more quickly (humans, P = 3 × 10⁻⁵; mice, P = 3 × 10⁻³,Friedman test; Fig. 1D). For humans, but not mice, the reducedtime to target was accompanied by a decrease in average traveldistance per trial (humans, P = 3 × 10⁻⁴; mice, P = 0.13,Friedman test; Fig. 1E). By contrast, in mice, but not humans,search speed progressively increased over training (humans, P =0.34; mice, P = 6 × 10⁻⁴, Friedman test; Fig. 1F). This doubledissociation between adaptive changes in path length and speedled us to hypothesize that the humans and mice solved the for-aging task differently.
Humans and Mice Use Different Strategies to Solve the AuditoryForaging Task. To delineate the strategies used by humans andmice in this task, we analyzed their moment-by-moment behav-ioral decisions by dividing behavioral traces from training trials(Fig. 2 A–C, Far Left in black) into movement vectors that weresampled every 0.3 s (Fig. 2 A–C, colored arrows). At any giventime point, the optimal bearing toward the target could be cal-culated between the forager’s current position and the targetlocation (Fig. 2D). By subtracting the forager’s movement vectorat each 0.3-s behavioral “moment” from the ideal bearing, we
Lowest SNRHighest SNR
Hum
ans
Mic
e
Success Prob
Chance Prob
Mice
100
50
0
50
40
30
115
90
65
6
4
2
12
9
6
0.18
0.16
0.14
0.18
0.14
0.10
100
50
0
Spe
edP
athl
engt
hTi
me
(s)
Suc
cess
(%)
Proportion of training completed0.2 0.4 0.6 0.8 1 0.2 0.4 0.6 0.8 1
Humans
A
B
C
D
E
F
**
**
*
*
Fig. 1. Humans and mice learn to use dynamic auditory cues to locate hiddentargets. (A,Upper) Humans played an audio gamewherein themovements of anavatar were controlled with a game pad, while (Lower) mice trained in a physicalbehavioral arena. The heat map corresponds to SNR. (B) A representative trial fora human and a mouse illustrates casting and zigzagging behaviors along thesound gradient. The filled and open circles indicate the center and perimeter ofthe target (red) and “dummy” (gray) zones. The green dots indicate position atthe start of the trial. (Scale bar: 10 and ∼3.5 cm for the mouse and human arena,respectively.) Time spent in “dummy” targets provides the basis for calculatingtarget identification by chance alone. (C) Percentage of trials in which humans(Left) and mice (Right) located the target within the time constraints across thetraining period. (D) Time and (E) length of path required to complete trial asa function of training time. Path length taken to reach the target was normal-ized by the diagonal distance of the training arena. (F) Likewise, running speed isreported as normalized distance per second and plotted as a function of trainingtime. The line plots reflect mean ± SEM. Significant learning effects are indicatedwith an asterisk in the upper right-hand corner of the plot.
2 of 10 | www.pnas.org/cgi/doi/10.1073/pnas.1322184111 Whitton et al.

Late
Ear
ly
C
Start
Start-20
-15
-10
-5
Start-20
-15
-10
-5
55-11S15515155
aa t Start-20
-15
-10
-5
55-11S1555155
a
-24-18
-12
-24-24-18
-12
Human 2
Mouse
Late
Ear
lyLa
teE
arly
Min MaxArrow Width
SpeedHuman 2
Early LateHuman 1
Early Late
Angleπ/2
3π/2
π
-20
-15
-5
StartSS-20
-15
-10
-5
StartSS a-2-2
Start-20
-15
-10
-5 Human 1
Speed
0.20
0.14
0.08
Targ
et b
ias
0.10
0.05
0.00
SN
R bias
Proportion of training completed
0.25
0.15
0.05
0.30
0.15
0.000.2 0.4 0.6 0.8 1 0.2 0.4 0.6 0.8 1 0.2 0.4 0.6 0.8 1
Angle
Speed
MouseEarly Late
Humans, strategy A
Humans, strategy B Mice
Ang
leS
peed
A
B
D
F G H
E
I J K
Start Start
-10
-24-18
-12
Fig. 2. Adaptive sensory-guided foraging strategies emerge with practice. (A–C , Far Left) Individual early and late training trials for two humans anda mouse. (Right) Movement speed and trajectory from sequential epochs of the corresponding “late” exemplar trial (time progresses from left to right). Theconcentric circles demarcate the mapping of auditory SNR onto the 2D training arena. Direction of arrowheads reflect trajectory, color of arrows representssearch speed normalized at the trial level, and arrow size reflects search speed normalized across all three examples. The gray arrows are superimposed fromthe previous time epoch(s). (Scale bar: 10 and ∼3.5 cm for the mouse and human arena, respectively.) The filled and open circles indicate the center andperimeter of the target (red) and “dummy” (gray) zones. The green dots indicate position at the start of the trial. (D) The difference between actual trajectoryand the ideal bearing is calculated every 0.3 s. Adaptive search strategies could emphasize movements toward the target (target bias, magenta) or along thesteepest slope of the SNR gradient (SNR bias, cyan). (E) Like angular target and SNR bias, normalized search speed can also be expressed across movementtrajectories. (F–H) Normalized distributions of (Upper) search trajectories and (Lower) speed modulation early vs. late in training for the two example humansubjects (F and G) and one mouse (H). [Speed axis bar: 0.13–0.19 d/s in humans and 0.09–0.21 d/s in the mouse; mean speed (white foreground); SEM (graybackground).] (I–K) Target and SNR bias in movement trajectories (Upper) or speed (Lower) for human subjects who used foraging strategy A (I; n = 4) or B(J; n = 6), and all trained mice (K; n = 4) plotted as a function of training time. Foraging strategy A is defined by an exclusive increase in toward target biaswith training (four subjects, including Human 1, used this strategy), while foraging strategy B is defined by increased SNR and toward target bias (six subjects,including Human 2, used this strategy). The line plots reflect mean ± SEM.
Whitton et al. PNAS Early Edition | 3 of 10
NEU
ROSC
IENCE
PNASPL
US

were able to represent, with search trajectories, how the forager’smovements deviated from the optimal trajectory. For both spe-cies, we found that search trajectories were fairly randomly dis-tributed early in training (Fig. 2 F–H, Upper). By later stages intraining, we found that search trajectories in humans were gen-erally biased toward the target (Fig. 2F) and, in many cases,along the most informative SNR vector within the sound gradi-ent (i.e., greatest increase or decrease in tone amplitude per unitdistance; Fig. 2G). We quantified target bias as the degree towhich subjects moved along any angle that took them closer to thetarget (Fig. 2D, magenta) and SNR bias as the degree to whichsubjects selected movement trajectories that provided thegreatest SNR change per unit distance (either directly toward oraway from the target; Fig. 2D, cyan). We found that all humanforagers were more likely to increase their angular target biasover the course of training (P = 2 × 10⁻⁶, Friedman test; Fig. 2 Iand J, Upper, and Fig. S1). This class of search strategy typicallybegan with high-speed, wide excursions and multiple turns tolikely reveal the general flow of the gradient, followed by awinding, slower local search that was most often directed to-ward the target (Fig. 2A). In addition, 6 of 10 human subjectsalso developed an SNR bias over the course of training (P = 5 ×10⁻³, Friedman test; Fig. 2J and Fig. S1). These subjects essen-tially performed coordinate descent optimization by creatingorthogonal excursions along the axes within the soundscape as-sociated with the steepest slopes in the SNR gradient (Fig. 2 Band G, Upper). Improved use of either strategy allowed humansubjects to identify the hidden target with a reduced path length(Fig. 1E). As befitting their relatively constant path length overtraining, mice did not exhibit an improvement in target or SNRbias. If anything, their search trajectories became more randomover the course of training (target bias, P = 0.31; reductionin SNR bias, P = 0.02, Friedman test; Fig. 2 H and K, Upper,and Fig. S1).Their improved success in the foraging task (Fig. 1C) and
overall increase in running speed (Fig. 1F) suggested that miceused an alternate gradient-based strategy to solve the foragingtask. When navigating a light gradient, Chlamydomonas nivalis,a species of green algae, has been observed to be directly pho-tokinetic, modulating its speed in a graded fashion relative to the“ideal” angle toward a light source (32). We tested whether micemight use a similar gradient-based strategy by calculating therunning speed of each mouse with respect to the angular de-viation from the optimal bearing (Fig. 2E). At early stages oftraining, running speed was not modulated by the mouse’s cho-sen angle. However, over the course of training, mice learned toincrease their running speed when moving toward the target andalong bearings associated with the most pronounced SNRchanges (target bias, P = 3 × 10⁻⁴; SNR bias, P = 5 × 10⁻⁴,Friedman test; Fig. 2 C, H, Lower, and K, Lower, as well as Fig.S1). Humans were not observed to modulate their running speedby either strategy (target bias, P = 0.79; SNR bias, P = 0.42,Friedman test; Fig. 2 I and J). These findings suggested thathumans and mice used different types of adaptive foragingstrategies; humans learned to bias their search trajectories to-ward the target and in most cases also along the steepest slopesin the SNR gradient, whereas mice continued to move alonga variety of angles but selectively increased their running speedaccording to real-time changes in SNR.
Foraging Strategies Depend on Local Sensory Environment.As a finalstep, we asked how foraging strategies learned over a period ofweeks were dynamically coordinated over the course of a singletrial. We first characterized whether target and SNR angularbiases observed in human foragers depended on sensory contextby measuring each type of bias according to position within theoverall SNR gradient (Fig. 3 A and B and Fig. S2). Well-trainedhuman subjects exhibited target bias at all SNRs (Fig. 3A, Up-
per). Human subjects who performed coordinate descent opti-mization in the soundscape (strategy B) demonstrated SNR biasin their search trajectories at low and high SNRs. There was adip in SNR bias at moderate SNRs that roughly coincided withthe peak of the angular target bias function, suggesting thatforagers who used gradient descent strategies may have flexiblyswitched between gradient orientation at the lowest and highestSNRs and target bias at intermediate SNRs (SNR effect, P =9.1 × 10⁻¹¹, ANOVA; Fig. 3 A and B, Upper). Contrasting trials inwhich subjects successfully located the target within the allottedtime (solid lines) vs. those where they did not (dashed lines),revealed that failures in successful foraging were distinguished bystrategic search differences within a region close to the low SNRtarget (enclosed by vertical, red lines, Target Bias, Correct vs.Failed by SNR interaction, P = 4.3 × 10⁻⁶; SNR bias, Correct vs.Failed by SNR interaction, P = 0.69, ANOVA; Fig. 3 A andB, Upper).
0.40
0.20
0.000.30
0.10
-0.10
Spe
ed (d
/s)
0.25
0.08
0.15
0.05
-0.05-10 -15 -20 -25
-0.10
Spe
ed
Target bias
Ang
le
SNR bias
Hum
ans
-12 -18 -24 -30
0.25
0.08
0.15
0.05
-0.05
-0.10
Spe
edA
ngle
0.40
0.20
0.000.30
0.10
-0.10
SNR re: trial maximum (dB)
Mice
E F
BA
DC
Successful TrialsFailed Trials
-10 -15 -20 -25
-12 -18 -24 -30SNR re: trial maximum (dB)
0.20
0.14
0.08
Humans
-10 -15 -20 -25SNR re: trial maximum (dB)
0.30
0.20
0.10
Mice
-12 -18 -24 -30
Fig. 3. Foraging strategy is modulated by local sensory context. This visu-alization breaks down the overall foraging biases plotted in Fig. 2 accordingto spatial position within the SNR training arena. For all plots, behavioraldata are shown from well-trained subjects (second half of training) accord-ing to spatial proximity to the target, expressed as SNR. The broken verticalred lines indicate target SNRs. The solid and broken lines reflect data fromsuccessful (i.e., rewarded) and failed trials, respectively. The broken hori-zontal black bars indicate unbiased foraging behavior. (A and C) Target biasin angular search trajectory (Upper) and speed (Lower) for all humans (A)and mice (C). (B and D) SNR bias in angular search trajectory (Upper) andspeed (Lower) for humans (B) and mice (D). SNR bias is plotted separately forsubjects using strategy B vs. those that did not (strategy A, Inset). (E and F)Overall search speed is plotted as a function of distance from target inhumans (E) and mice (F). The unit of measurement for speed (d/s) is distancetraveled, normalized to the diagonal length of the training arena, per sec-ond. Data are plotted as mean ± SEM.
4 of 10 | www.pnas.org/cgi/doi/10.1073/pnas.1322184111 Whitton et al.

Although our trial-level analysis suggested that mice did notuse angular target bias as a search strategy in the foraging task,our more detailed SNR-based analysis revealed that mice did, infact, use this strategy, albeit only at low SNRs that were local tothe target (n = 4, SNR effect, P < 3 × 10⁻¹⁶, ANOVA; Fig. 3C,Upper). At higher SNRs, we found that mouse running speed wasmodulated with a combination of angular target and SNR bias(Speed Target Bias; SNR effect, P < 3 × 10⁻¹⁶, Speed SNR bias;SNR effect, P < 3 × 10⁻¹⁶, ANOVA; Fig. 3 C and D, Lower).Similar to the human subjects, we noted that failures in foragingsuccess for mice were associated with strategic differences restrictedto a low SNR region local to the target (Target Bias, Correct vs.Failed by SNR interaction, P < 3 × 10⁻¹⁶; Speed Target Bias,Correct vs. Failed by SNR interaction, P = 1.2 × 10⁻¹⁰; Speed SNRbias, Correct vs. Failed by SNR interaction, P = 0.03, ANOVA).Finally, to further examine the dependence of foraging strat-
egy on sensory cues, we analyzed the overall search speed asa function of SNR (Fig. 3 E and F). Across both species, wefound that search speed decreased at the lowest SNRs on suc-cessful trials (humans, SNR effect, P < 3 × 10⁻¹⁶; mice, SNReffect, P < 3 × 10⁻¹⁶, ANOVA; Fig. 3 E and F). Importantly,unsuccessful trials were characterized by a failure to modulatesearch speed with sensory cues for these same SNRs (humans,Correct vs. Failed by SNR interaction, P = 0.04; mice, Correct vs.Failed by SNR interaction, P < 3 × 10⁻¹⁶, ANOVA; Fig. 3 Eand F).To summarize, across both species, we observed that at fa-
vorable SNRs, a high speed search was conducted, driven by
either choosing search trajectories that were biased toward thetarget and steepest changes in the SNR gradient (humans) ormodulating running speed with angular target and SNR bias(mice). As the foragers moved to lower SNRs (local to the tar-get), slower, systematic exploration dominated the search strat-egy, representing a strategy switch from speed modulation tochoosing more accurate search trajectories in mice. Across allforagers, the behavioral strategies used to successfully solve theforaging task were only disrupted at the lowest SNRs on failedtrials, suggesting that failures in slow, systematic, local explora-tion at locations providing the most degraded sensory feedbackaccounted for limitations in trial-level success.
Learning on the Auditory Foraging Task Transfers to an UntrainedSpeech Perception Task. We next asked whether increased pro-ficiency in the auditory foraging game generalized to othermeasures of auditory perception. Psychophysical tests were per-formed on human subjects who had been randomly assignedeither to train on the foraging game for 1 mo or had been pas-sively exposed to game stimuli for the same time period (Fig.4A). First, we assessed near transfer (Fig. 4A, Middle) by mea-suring detection thresholds for pure tones (250, 375, 500, and750 Hz) presented in the presence of a simple broadband maskerbefore and after foraging or passive listening. We observed in-creases in response thresholds for trained subjects comparedwith passively exposed controls that were specific to the fre-quency channels (based on peripheral excitation patterns) usedin the foraging task (Group by Test frequency interaction, P =0.05; 250 Hz, P = 1.38; 375 Hz, P = 0.24; 500 Hz, P = 0.17; and750 Hz, P = 0.04, ANOVA followed by post hoc two-samplet tests with Holm–Bonferroni correction for multiple compar-isons; Fig. 4B). This finding of stimulus-specific elevated de-tection thresholds following a task that relied primarily on stimulusdiscriminations is consistent with previous observations (33, 34).We next tested whether observed improvements in using weak
tones in noise to guide behavior in the auditory foraging task alsotransferred to more ethologically relevant situations such asunderstanding speech in noisy environments (Fig. 4 A and C, andFig. S3 A–C). Toward this goal, we administered the QuickSentence in Noise Test, a common clinical tool used to assessreal-world speech in noise perception. We found that subjectswho trained on the foraging task improved their word recogni-tion scores at the most difficult SNR tested (0 dB SNR) by anaverage of 12% (Fig. 4C). This represented a significant im-provement compared with the passive exposure group (Groupby SNR interaction, P = 8 × 10⁻⁴; 0 dB SNR, P = 1 × 10⁻³,ANOVA followed by post hoc two-sample t tests with Holm–
Bonferroni correction for multiple comparisons; Fig. 4C and Fig.S3 A and B) with large effect sizes measured at both +5 and 0 dBSNR (effect sizes, 0.8 and 1.9, respectively; Hedges’ g). The smallspeech in noise improvements demonstrated by the passivelyexposed group are expected based on learning that occurs duringthe pretest evaluation (35). Combined with the stimulus-specificmodulation of tone detection thresholds reported above, thesefar transfer findings demonstrate that training on an auditoryforaging task is associated with both stimulus-specific and gen-eralized learning effects.We then examined whether improved comprehension of the
most degraded speech in noise samples could be predicted fromindividual differences in game play strategy. Although moretraditional measures such as success rate or time to target werenot significantly predictive of learning transfer (Fig. S4), wefound that dynamic search behaviors, specifically in low SNRconditions close to the target, were significantly predictive ofimproved processing of highly degraded speech (0 dB SNR; Fig.4 D and E). Specifically, subjects who learned to slow theirsearch speeds and to move along the steepest slope of the SNRgradient when within 5dB of the target demonstrated the
∆ W
ords
(%)
-0.05 0.00 0.054
12
20
∆ Speed (d/s)
Speech in noise testp
∆ W
ords
cor
rect
(%)
20
10
0
-1025 20 15 10 5 0
SNR (dB)
TrainedPassive
∆Thr
esho
ld (d
B)
Tone frequency(Hz)
TrainedPassive
*
*
BA
CD
E
Tone
6
0
-6
Tone in noise test
Tran
sfer N
ear
Far
250 375 500 750
Noise
Gam
e Tr
aini
ng
∆ W
ords
(%)
-0.2 0.1 0.44
12
20
∆ SNR bias
Fig. 4. Learned improvements in auditory-guided foraging generalize todistinct listening tasks. (A) The physical stimulus waveform used in the for-aging task (Top) is similar to the stimulus used for the tone in noise task(Middle) but dissimilar to the test of speech perception in multitalker babble(Bottom). (B) Change in tone detection thresholds (Post – Pre) assessed atfour tone frequencies (training frequency indicated by arrow). (C) Change inwords correctly recognized for the speech in noise task (Post – Pre) plottedaccording to target speaker SNR. (D and E) Correlation between change insearch speed (D) and SNR bias (E) at locations between 0 and 5 dB SNR andimproved performance on the speech in noise test at 0 dB SNR. The hori-zontal lines in scatter plots reflect group means. The asterisks indicate sta-tistically significant differences between groups.
Whitton et al. PNAS Early Edition | 5 of 10
NEU
ROSC
IENCE
PNASPL
US
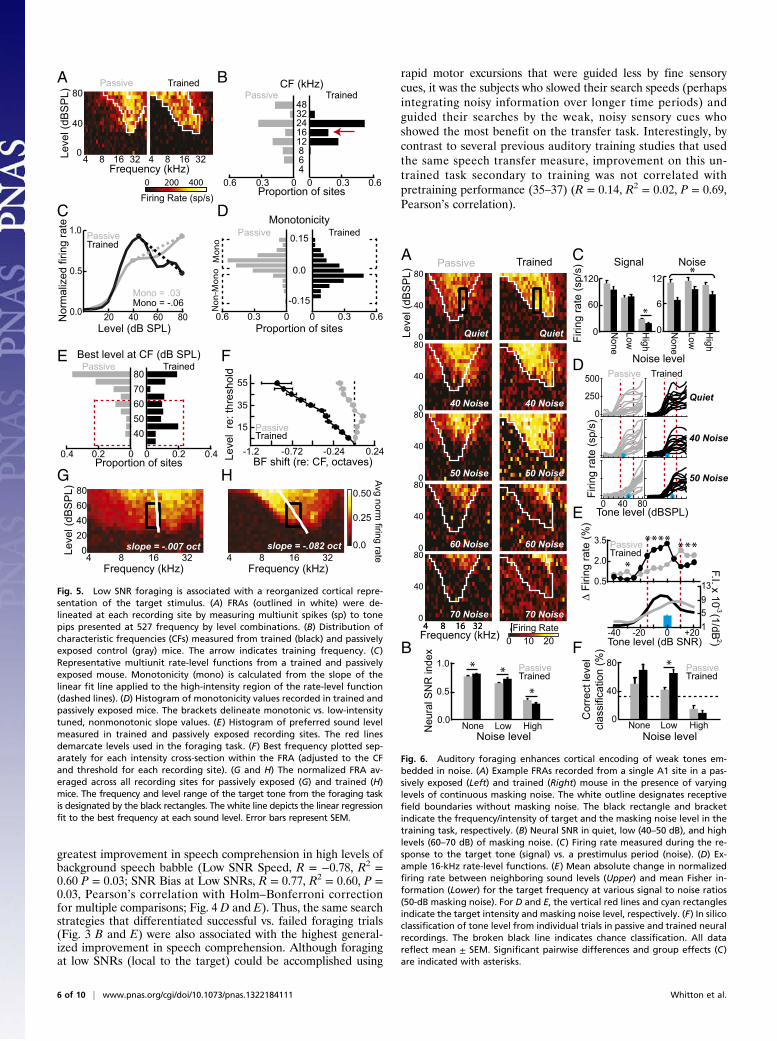
greatest improvement in speech comprehension in high levels ofbackground speech babble (Low SNR Speed, R = −0.78, R2 =0.60 P = 0.03; SNR Bias at Low SNRs, R = 0.77, R2 = 0.60, P =0.03, Pearson’s correlation with Holm–Bonferroni correctionfor multiple comparisons; Fig. 4 D and E). Thus, the same searchstrategies that differentiated successful vs. failed foraging trials(Fig. 3 B and E) were also associated with the highest general-ized improvement in speech comprehension. Although foragingat low SNRs (local to the target) could be accomplished using
rapid motor excursions that were guided less by fine sensorycues, it was the subjects who slowed their search speeds (perhapsintegrating noisy information over longer time periods) andguided their searches by the weak, noisy sensory cues whoshowed the most benefit on the transfer task. Interestingly, bycontrast to several previous auditory training studies that usedthe same speech transfer measure, improvement on this un-trained task secondary to training was not correlated withpretraining performance (35–37) (R = 0.14, R2 = 0.02, P = 0.69,Pearson’s correlation).
Level (dB SPL)20 40
TrainedPassive
Mono = .03Mono = -.06
Nor
mal
ized
firin
g ra
te 1.0
0.5
0.0 60 80 0.6 0.3 0 0 0.3 0.6
Monotonicity
Proportion of sites
TrainedPassive 0.15
-0.15
0.0
Mon
oN
on-M
ono
-1.2
55
35
15
0.24-0.24-0.72BF shift (re: CF, octaves)Le
vel
re: t
hres
hold
TrainedPassive
80
40506070
0.4 0.2 0 0 0.2 0.4
Best level at CF (dB SPL)
Proportion of sites
TrainedPassive
48
4681216
3224
CF (kHz)
Proportion of sites
TrainedPassive
0.6 0.3 0 0 0.3 0.6Frequency (kHz)
Leve
l (dB
SP
L)
4 8 16 32
80
40
04 8 16 32
TrainedPassive
slope = -.082 octslope = -.007 oct
806040200Le
vel (
dBS
PL)
4 8 16 32 4 8 16 32Frequency (kHz)Frequency (kHz)
Avg norm firing rate
0.0
0.25
0.50
A B
C D
E F
G H
200 4000
Firing Rate (sp/s)
Fig. 5. Low SNR foraging is associated with a reorganized cortical repre-sentation of the target stimulus. (A) FRAs (outlined in white) were de-lineated at each recording site by measuring multiunit spikes (sp) to tonepips presented at 527 frequency by level combinations. (B) Distribution ofcharacteristic frequencies (CFs) measured from trained (black) and passivelyexposed control (gray) mice. The arrow indicates training frequency. (C)Representative multiunit rate-level functions from a trained and passivelyexposed mouse. Monotonicity (mono) is calculated from the slope of thelinear fit line applied to the high-intensity region of the rate-level function(dashed lines). (D) Histogram of monotonicity values recorded in trained andpassively exposed mice. The brackets delineate monotonic vs. low-intensitytuned, nonmonotonic slope values. (E) Histogram of preferred sound levelmeasured in trained and passively exposed recording sites. The red linesdemarcate levels used in the foraging task. (F) Best frequency plotted sep-arately for each intensity cross-section within the FRA (adjusted to the CFand threshold for each recording site). (G and H) The normalized FRA av-eraged across all recording sites for passively exposed (G) and trained (H)mice. The frequency and level range of the target tone from the foraging taskis designated by the black rectangles. The white line depicts the linear regressionfit to the best frequency at each sound level. Error bars represent SEM.
TrainedPassive80
40
0Leve
l (dB
SP
L)
80
40
080
40
080
40
0
Firing Rate
40 Noise 40 Noise
Quiet Quiet
50 Noise 50 Noise
60 Noise 60 Noise
4 8 16 32Frequency (kHz)4 8 16 32
80
40
0 70 Noise 70 Noise
B
C
D
E
F0 10 20
Noise level Low
80
40
0 None High
*
Cor
rect
leve
lcl
assi
ficat
ion
(%)
Firin
g ra
te (s
p/s)
500
0
250
40 800Tone level (dBSPL)
40 Noise
Quiet
50 Noise
TrainedPassive
LowNeu
ral S
NR
inde
x
1.0
0.5
0.0 None High
* *
Noise level
*
Firin
g ra
te (s
p/s)
12
6
0
120
60
0 None
Low
High
Noise level
None
Low
High
Signal Noise
*
F.I. x 10 (1/dB ) 2
-3
∆ Fi
ring
rate
(%)
Tone level (dB SNR)0 +20
3.5
0.5
-40
2.0TrainedPassive
-20
13951
* **
*** * *
*
TrainedPassive
TrainedPassive
A
Fig. 6. Auditory foraging enhances cortical encoding of weak tones em-bedded in noise. (A) Example FRAs recorded from a single A1 site in a pas-sively exposed (Left) and trained (Right) mouse in the presence of varyinglevels of continuous masking noise. The white outline designates receptivefield boundaries without masking noise. The black rectangle and bracketindicate the frequency/intensity of target and the masking noise level in thetraining task, respectively. (B) Neural SNR in quiet, low (40–50 dB), and highlevels (60–70 dB) of masking noise. (C) Firing rate measured during the re-sponse to the target tone (signal) vs. a prestimulus period (noise). (D) Ex-ample 16-kHz rate-level functions. (E) Mean absolute change in normalizedfiring rate between neighboring sound levels (Upper) and mean Fisher in-formation (Lower) for the target frequency at various signal to noise ratios(50-dB masking noise). For D and E, the vertical red lines and cyan rectanglesindicate the target intensity and masking noise level, respectively. (F) In silicoclassification of tone level from individual trials in passive and trained neuralrecordings. The broken black line indicates chance classification. All datareflect mean ± SEM. Significant pairwise differences and group effects (C)are indicated with asterisks.
6 of 10 | www.pnas.org/cgi/doi/10.1073/pnas.1322184111 Whitton et al.

Improved Foraging Ability Is Associated with a Reorganized CorticalRepresentation of Weak Tones.We examined the neural correlatesof learning on the auditory foraging task by making unit re-cordings from the auditory cortex (A1) of mice that weretrained on the task or passively exposed to the same auditorystimuli but did not participate in the task. We hypothesized thattraining on the task would be associated with an altered repre-sentation of trained stimulus features, such that the representa-tional salience of weak, noisy inputs would be enhanced. We firstcollected frequency response areas (FRAs) in both groups ofmice by presenting pure tones with pseudorandomly varied fre-quencies between 4 and 48 kHz and intensity levels from 0 to 80dB sound pressure level (SPL) (Fig. 5A). Training was associatedwith a marked overrepresentation of characteristic frequencies(CFs) (the preferred frequency at threshold) near the 16-kHztraining frequency compared with passively exposed controls(n = 151 neural recording sites from four trained mice; n = 180neural recording sites from four passively exposed mice; P = 6 ×10⁻⁴, two-sample Kolmogorov–Smirnov test; Fig. 5B). Thisproportional increase in frequency tuning was not limited to 16kHz, but rather extended a half octave above and below thetraining frequency. Because the foraging task emphasized rec-ognition of subtle variations in tone level, we examined theencoding of sound frequency across the full range of levels en-countered in the task.In passively exposed control mice, increasing the tone level
above threshold was associated with a monotonic increasein firing rate and little change in best frequency, as has previ-ously been described in rodent A1 (38) (Fig. 5 A, C, and D). Intrained mice, we observed that many rate-level functions werenonmonotonic, decreasing their firing rate in response to high-level stimuli (P = 9 × 10⁻¹³, two-sample t test; Fig. 5 C and D)and, accordingly, were often best driven by relatively faint tonelevels, near the target intensity range in the foraging task (P =3 × 10⁻¹⁰, two-sample Kolmogorov–Smirnov test; Fig. 5E). Bycontrast to units recorded in passively exposed controls, manyFRAs recorded in trained mice “leaned,” such that best fre-quency shifted downward by nearly one octave across the rangeof sound levels tested here (Group effect, P < 3 × 10⁻¹⁶; Leveleffect, P < 3 × 10⁻¹⁶; Group by Level interaction, P < 3 × 10⁻¹⁶,ANOVA; Fig. 5 A and F). Finally, we plotted the mean nor-malized neural response across all recording sites to characterizehow the combination of the described distortion in frequencytuning, increase in nonmonotonicity in level tuning, and the in-teraction of frequency tuning with presentation level might alterthe representation of sounds in the absolute frequency/intensitycoordinates. We found that, in the trained animals, populationneural activity maximized responsiveness across the frequency–intensity range of the target (Fig. 5 G and H).
Neural Responses in Trained Animals Are Resistant to Suppression byContinuous Background Noise. The SNR foraging task places apremium on suppressing the distraction imposed by the maskingnoise as well as enhancing the representational salience of low-level tones at the target frequency. To better understand how A1responses were modified according to both of these perceptualdemands, we derived tonal receptive fields under a backgroundof continuous broadband masking noise ranging from 40 to 70dB SPL. In passively exposed mice, increasing masker amplitudesuppressed tone-evoked spiking, elevated thresholds, and re-stricted the range of frequency tuning (Fig. 6A and Fig. S5).However, FRAs measured in trained mice were more resistant tonoise degradation at levels matching the background distractorintensities encountered in the foraging task (40–50 dB SPL; Fig.6A and Fig. S5). We next asked whether this reduced suppressionof neural responses to tones in the presence of a continuousdistractor might also result in an improved neural SNR. Thus, ateach recording site, we calculated the ratio between the response
to the target signal (low level, 16-kHz tones) and the response tothe continuous distractor. We found that the neural SNR indexwas significantly higher in the trained than passively exposed ani-mals in the quiet condition and in the presence of low (40–50 dBSPL) but not high (60–70 dB SPL) noise levels (Group effect, P =0.18; Noise effect, P < 3 × 10⁻¹⁶; Group by Noise level interaction,P = 1 × 10⁻⁴; Quiet, P = 3 × 10⁻³; Low Noise, P = 9 × 10⁻⁴; HighNoise, P = 0.02, ANOVA followed by post hoc two-sample t testswith Holm–Bonferroni correction for multiple comparisons; Fig.6B). Further analysis revealed that this improvement in neural SNRwas largely due to a decrease of the neural response to the ongoingwhite-noise stimulus across noise levels, whereas the response totarget signals were equivalent between the groups (Noise Response,Group effect, P = 2 × 10⁻⁵; Noise level effect, P = 0.12; Group byNoise level interaction, P = 0.30; Signal Response, Group effect,P = 0.1; Noise level effect, P < 3 × 10⁻¹⁶; Group by Noise levelinteraction, P = 0.32; Fig. 6C).
SNR Foraging Enhances the Neural Coding of Weak Signals.As a finalstep to characterize changes in the cortical representation oftask-relevant acoustic parameters, we analyzed rate-level func-tions at the training frequency under varying levels of back-ground noise. In passively exposed mice, the steeply slopingregion of the rate-level functions shifted according to themasking noise level. Under levels of masking noise encounteredin the training task (50 dB), this shift reduced the availability ofdynamic firing rate cues for tone levels associated with the target(Fig. 6D and Fig. S6). By contrast, in trained mice, we found thatthe steepest slopes of the firing rate functions remained insidethe range of weak signal levels that served as targets in the for-aging task regardless of the masker level (Fig. 6D and Fig. S6).This relationship is captured by the first derivative of the rate-level function, which confirmed significantly steeper growth ofresponse across weak signal levels in trained mice compared withpassively exposed controls (Group effect, P = 1 × 10⁻³; SNReffect, P = 3 × 10⁻¹⁶; Group by SNR interaction, P = 0.3 × 10⁻¹⁶;−15–0 dB SNR, P < 3 × 10⁻⁶, ANOVA followed by post hoctwo-sample t tests with Holm–Bonferroni correction for multiplecomparisons; Fig. 6E, Upper, and Fig. S7). Often, the steeplysloping region of a growth function contains the most in-formation for coding differences between stimuli because thecontrast between neural responses to similar physical stimuli ishigh and the variability in trial-by-trial responses is low. This canbe expressed quantitatively using Fisher information (39) forneural responses obtained from trained and passively exposedmice. Under low-noise conditions, Fisher information was lowfor weak signals in passively exposed mice, reaching a maximumat levels just above the masker. By contrast, the Fisher in-formation function peaked at weak signal levels in the trainedmice, perhaps supporting the perceptual demands of the auditoryforaging task (Fig. 6E, Lower, and Fig. S7).To test whether task-related plasticity conferred any adaptive
benefit to sound coding, we used an in silico poststimulus timehistogram (PSTH)-based classifier (40) to decode tone stimulusintensity across the populations of neurons recorded in trainedor passively exposed mice. In this template matching model, theneural response is classified as belonging to the stimulus classto which its Euclidean distance is shortest. We found that theclassification of sound level using the neural data from thetrained animals was superior to that of the passive controlsunder low-noise conditions, indicating that the representationalplasticity in trained animals supported an improved neural codefor stimulus properties encountered in the foraging task (Quiet,P = 0.12; Low Noise, P = 6 × 10⁻³; High Noise, P = 0.14, boot-strapped permutation test for difference in means with Holm–
Bonferroni correction for multiple comparisons; Fig. 6F).
Whitton et al. PNAS Early Edition | 7 of 10
NEU
ROSC
IENCE
PNASPL
US

DiscussionBy tapping into an evolutionarily conserved behavior, we wereable to compare learning on a closed-loop audiomotor taskin two commonly used species for neuroscience research. Weexpected that movement trajectories would coalesce around thegeneral direction of the target as subjects learned to use sensorycues to guide foraging behavior. Although this “target bias” inforaging strategy was used to some degree by all human subjectsover the course of training, we also found that some subjects alsolearned to restrict their search trajectories to the steepest, mostinformative slope in the SNR gradient (both toward and awayfrom the target). A similar strategy has been described in theecholocating Egyptian fruit bat when “locking” to a target andhas been computationally shown to provide optimal discrimina-tory feedback for localization at the expense of detection (41).Employment of an SNR bias strategy suggests that, as sensoryinformation accumulated, most humans built a detailed model ofthe sensory search space. Evidence of similar modeling of thesearch space was not generally observed in mice. We found thatmice increased angular target bias only at low SNRs, during slowsearch on the foraging task. By contrast to humans, most of theirforaging efficiency improvements were attributable to an in-creased running speed when moving toward the target, a phe-nomenon that has previously been observed in green algaeduring phototaxis (32).Following 1 mo of training on an auditory foraging task with
simple acoustic stimuli, we observed significant transfer oflearning to an untrained task of speech recognition in the pres-ence of four-talker babble that was well predicted by gameperformance. Learning transfer to a more complex signal innoise task was surprising given that stimulus specificity has beenrepeatedly associated with sensory learning since the seminalreport of Fiorentini and Berardi (42) over 3 decades ago.However, recent studies have cast doubt on the inviolate speci-ficity of perceptual learning, suggesting that the particulartraining methodology may influence the degree of learningtransfer (43–48). For example, experience with action videogames has been associated with accelerated learning of non-native phonetic contrasts (49) and enhanced visual abilities ontasks ranging from useful field of view to contrast sensitivity (20,21, 23, 24). The key elements of action video game play that leadto appreciable transfer of visual learning are not yet clearly un-derstood. However, the varied perceptual demands in these tasksare congruent with many of the conditions that promote learningtransfer on traditional perceptual learning paradigms (45–47,50). Musicianship represents yet another form of sensorimotorlearning that shares a number of qualities with the auditoryforaging game (e.g., audiomotor feedback that is both immediateand directional) and has recently been associated with general-ized enhancement of auditory skills (18, 19, 51). Interestingly,musicians have been shown to outperform nonmusicians on thesame speech in noise perception test administered in the presentstudy, with years of experience positively correlating with betterperformance (ref. 18; but see ref. 52). Thus, it is plausible that,due to the dynamic nature of the discriminanda, which, likeroving reference paradigms, offers no “standard” reference stim-ulus, or because of the immersive game-based sensorimotor ap-proach, learning in this auditory foraging task transferred tochallenging listening contexts that were dissimilar, both acousti-cally and cognitively, from the conditions of the training task.Another possible explanation for the observed learning
transfer is that training to extract signals from noise might rep-resent a more generalizable skill than the fine feature discrimi-nation that is typically trained in perceptual learning studies.Evidence for this notion comes from a recent study in the visualsystem, which found that human participants who were trained todiscriminate the orientation, motion, or displacement of random
dot stereograms in the presence of visual distractor noise, dem-onstrated learning transfer to both untrained stimulus dimensions(53). Although distractor stimuli in that study were similar acrosstraining and transfer test conditions, our results indicate thattransfer effects can also be observed when both the stimulus anddistractor in the transfer tests are more complex than the trainingstimuli (speech and four-talker speech babble vs. a pure-toneand broadband continuous noise). By systematically varying thespectrotemporal and linguistic structure of untrained targets andmaskers in future studies, it may be possible to further elucidatethe limits of far transfer effects (52).Perceptual improvements conferred by both traditional
learning paradigms and action video game play are thought toarise from reductions of internal noise and filtering of externalnoise (54, 55), increased efficiency (24, 56), and improvedprobabilistic inference (57–59). Pertinent to the experimentsreported here, probabilistic inference was measured using a tonein noise lateralization task in the experiments reported by Greenet al. (57), demonstrating some cross-modal transfer of learningto auditory signal in noise perception following video game play.In many of these studies, neural plasticity associated with train-ing, expressed either as induced bias or increased connectionstrength, was localized to connections between higher corticalareas that update movement representations based on dynamicsensory information (54, 55, 57).We explored the neural correlates of training in A1, a com-
paratively early stage of cortical processing where unit responsesare known to be strongly modulated by auditory associativelearning (10, 11, 60–65). We noted that neural responses oftrained mice were globally suppressed relative to passive con-trols. However, response suppression was far more robust fortone frequencies far from the target or for broadband continuousmaskers (Fig. 6C), resulting in a relative enhancement of targetsignal representation. Differential suppression of neural activityin primary auditory cortex has also been observed in ferretsduring engagement in a signal in noise detection task (66), withsuppression scaling indirectly with SNR and directly with per-formance. Similar findings have been reported in early auditory(62, 67, 68), visual (69, 70), and somatosensory cortices (71) ofprimates trained to discriminate targets from distractors. Al-though the training studies mentioned here, as well as the cur-rently reported experiment, suggest that learning to extractsignals from noise alters the relative neural representation oftask-specific targets and distractors in primary auditory cortex(perhaps explaining behavioral improvements on trained tasksand stimulus-specific changes in tone-detection thresholds), thetransfer effects observed in our study as well as another (53)suggest an additional stimulus-general effect of training, perhapsvia response plasticity in sensory-motor brain areas (72, 73) orfrontoparietal networks involved in sensory distractor suppres-sion (22, 74–76). The latter possibility could be tested acrossspecies by making preforaging and postforaging training unitrecordings in the primary auditory cortex of awake, behavingmice and recording steady-state auditory evoked potentials inbehaving humans to examine attentional modulation of targetand distractor responses.The ability to improve generalized, auditory signal in noise per-
ception through a learning paradigm makes it an appealing thera-peutic for certain clinical populations. There are an estimated 48million individuals living with hearing impairment in the UnitedStates alone (77). Even after treatment with hearing aids or co-chlear implants, these individuals present with substantial deficitswhen attempting to extract target speech signals from backgroundtalkers. There are several potential factors that contribute to thisdifficultly, some of which are associated with peripheral pathology[e.g., reduced spectral resolution of auditory filters (78)], and otherswith impaired central processing (79–81). As the need to quicklyand reliably extract signals from background noise is ubiquitous in
8 of 10 | www.pnas.org/cgi/doi/10.1073/pnas.1322184111 Whitton et al.

work, educational, and social contexts, improved signal in noiseextraction in these listening environments may improve quality oflife for these individuals.
Materials and MethodsAuditory Foraging Task Procedures. All procedures performed with humanswere approved by the Human Studies Committees atMassachusetts Eye andEar Infirmary and theMassachusetts Institute of Technology. Twenty youngadult subjects with audiologically confirmed normal hearing sensitivitywere randomly assigned to train on the auditory foraging task for 1 mo (30min per day for 5 d per week) or to be passively exposed to the trainingstimuli over the same time period. Humans controlled the movements of anavatar in a 2D virtual arena using a game pad in the context of a customaudio game. The game was downloaded on the participants’ laptop PCsand circumaural headphones were provided. Humans used audio feedback(level of a continuous 500-Hz tone) to guide their avatar to a locationassociated with the lowest sound level. A broadband masker of ∼65 dB SPL(calibrated at their initial visit) was played continuously as a distractor.Like the mice, human subjects received no verbal instructions about thegoals of the game; rather, they learned to forage for rewards (points)through trial and error.
All procedures performed with mice were approved by the Animal Careand Use Committee at Massachusetts Eye and Ear Infirmary and followed theguidelines established by the National Institutes of Health for the care anduse of laboratory animals. Eight male CBA-CaJ mice, aged 6 wk, were waterrestricted and their light/dark cycles were reversed. Four mice were chosen totrain on the auditory foraging task, and the other four served as passivelyexposed controls. Passive exposure was implemented through yoking; whileone mouse was training, their yoked counterpart was placed in an elevatedlistening chamber situated inside the training arena. The auditory foragingtask for mice was similar to the game played by humans except that itoccurred in a physical (rather than virtual) space (40 × 65 cm, sound treated,training arena with overhead tweeter) and used a 16-kHz carrier frequencyfor the tone. The position of the mouse relative to the target was monitoredwith a webcam and custom software. If the mouse was able to navigate tothe target location (a 14-cm-diameter circle) and remain within this space for2 s, the auditory stimulus stopped, indicating that the mouse could return tothe water spout for a reward of variable magnitude.
Auditory Foraging Task Data Analysis. For the moment-by-moment behavioralanalysis, we divided behavioral traces from training trials into movementvectors thatwere subsampled every 0.3 s. At any given time point, the optimalbearing toward the target could be calculated between the forager’s currentposition and the target location. By subtracting the forager’s actual move-ment vector at each 0.3-s behavioral “moment” from the ideal bearing, wewere able to represent, with search trajectories, how the forager’s move-ments deviated from the optimal search vector. Toward target bias of searchtrajectories was quantified as the mean cosine of difference vectors acrosseach trial (max possible value, 1). SNR bias was quantified in a similar fashionusing the absolute value of the sine of the vectors subtracted from randomperformance, defined as the sine of an average vector angle of π/4 (maxi-mum possible value, 0.707). Speed target bias and SNR bias were quantifiedin the same manner as described for the angular measures. The differencebetween these two methods was that the length of each behavioral re-sponse vector was defined as the speed at which the animal or avatar wasmoving (rather than 1). All vectors were binned into 1 of 16 categories from
0 to 15π/8 rad in increments of π/8. The mean speed was calculated for allresponse vector categories and then normalized before the cosine or sine ofthe vectors was determined.
Tests of Learning Transfer. All testing was performed in a sound-treated re-search booth. We tested whether learning on the foraging task transferredoutside of the task demands bymaking preintervention and postinterventionmeasurements of signal in noise perception using both tonal and speechstimuli. Tone in noise detection thresholds were measured using a two-interval, two-alternative forced-choice procedure. Stimuli were generated andthe testing protocol was implemented using the SoundGen system (82) toadaptively identify the threshold for 79% response accuracy (83). Thresholdswere measured for tones with carrier frequencies of 250, 375, 500, and 750 Hz.Speech perception in noise was measured using a standard clinical assessmenttool called the Quick Sentence in Noise Test (84) that is meant to assess real-world hearing in noise abilities. This test requires that a listener extract andrepeat a sentence (with low predictability) spoken by a target female speakerin the presence of four-talker babble at increasingly difficult SNRs.
Neurophysiological Recording Procedures. Trained (n = 4) and passively ex-posed (n = 4) mice were anesthetized, and a scalpel was used to make a 4 × 3mm (rostrocaudal by mediolateral) craniotomy over the right auditory cor-tex. A 16-channel silicone probe (177-μm2 contact area, 50-μm contacts oneach of four shanks, 125 μm between shanks; NeuroNexus) was insertedorthogonal to the cortical surface to record multiunit responses from themiddle cortical layers (0.3–0.5 mm).
All acoustic stimuli were delivered to the left ear of the mouse via customminiature acoustic assemblies. FRAs were measured at each recording site bypseudorandomly presenting tone pips with carrier frequencies of 4–48.5 kHzin 0.12-oct steps at intensity levels from 0 to 80 dB SPL in 5-dB steps with andwithout continuous noise playing in the background.
Neurophysiological Data Analysis. The raw response traces were digitized andall subsequent analyses were performed in MATLAB (MathWorks) usingcustom scripts. Multiunit spikes were identified adaptively as voltage deflectionsthat exceeded 4.5 SDs from the mean recorded activity. The boundaries of theFRAs (FRA mask) were defined objectively in most cases (85).
CF, Best level, and monotonicity were objectively defined using stand-ard procedures. The index of neural signal-to-noise ratio was defined asðS−NÞ=ðS+NÞ, where S is the average response (spikes per second) of eachsite to tones presented at 16 kHz (±0.12 oct) and 35–60 dB SPL, and Nrepresents the average spike rate at that site recorded over a 0.1-s win-dow beginning 150 ms before stimulus onset. The first derivatives ofsmoothed rate level functions (5-point median filter) were approximatedusing a 5-point centered numerical algorithm. Fisher information func-tions were computed for each recording site using the methods describedby Dean et al. (39). The PSTH classifier model was implemented using theapproach described by Foffani and Moxon (40). Behavioral and neuro-physiologic methods are further elaborated in SI Materials and Methods.
ACKNOWLEDGMENTS. We thank R. Williamson for computational assistance,D. Barbour for discussion, and R. Froemke for comments. Animal research wassupported by National Institutes of Health Grants R01 DC009836 (to D.B.P.)and P30 DC5029. Human research was supported by a Mass Eye and Ear CuringKids Award (to D.B.P.).
1. Stephens D, Krebs J (1987) Foraging Theory (Princeton Univ Press, Princeton).2. Charnov EL (1976) Optimal foraging, the marginal value theorem. Theor Popul Biol
9(2):129–136.3. Greggers U, Menzel R (1993) Memory dynamics and foraging strategies of honeybees.
Behav Ecol Sociobiol 32(1):17–29.4. Kennedy JS (1983) Zigzagging and casting as a programmed response to wind-borne
odor—a review. Physiol Entomol 8(2):109–120.5. Porter J, et al. (2007) Mechanisms of scent-tracking in humans. Nat Neurosci 10(1):
27–29.6. Thesen A, Steen JB, Døving KB (1993) Behaviour of dogs during olfactory tracking.
J Exp Biol 180:247–251.7. Kolling N, Behrens TE, Mars RB, Rushworth MF (2012) Neural mechanisms of foraging.
Science 336(6077):95–98.8. Hayden BY, Pearson JM, Platt ML (2011) Neuronal basis of sequential foraging deci-
sions in a patchy environment. Nat Neurosci 14(7):933–939.9. Kvitsiani D, et al. (2013) Distinct behavioural and network correlates of two in-
terneuron types in prefrontal cortex. Nature 498(7454):363–366.10. Bao S, Chang EF, Woods J, Merzenich MM (2004) Temporal plasticity in the primary
auditory cortex induced by operant perceptual learning. Nat Neurosci 7(9):974–981.
11. Polley DB, Heiser MA, Blake DT, Schreiner CE, Merzenich MM (2004) Associative
learning shapes the neural code for stimulus magnitude in primary auditory cortex.
Proc Natl Acad Sci USA 101(46):16351–16356.12. Bergan JF, Ro P, Ro D, Knudsen EI (2005) Hunting increases adaptive auditory map
plasticity in adult barn owls. J Neurosci 25(42):9816–9820.13. Seitz A, Watanabe T (2005) A unified model for perceptual learning. Trends Cogn Sci
9(7):329–334.14. Parikh V, Kozak R, Martinez V, Sarter M (2007) Prefrontal acetylcholine release con-
trols cue detection on multiple timescales. Neuron 56(1):141–154.15. Froemke RC, et al. (2013) Long-term modification of cortical synapses improves sen-
sory perception. Nat Neurosci 16(1):79–88.16. Schultz W, Dayan P, Montague PR (1997) A neural substrate of prediction and reward.
Science 275(5306):1593–1599.17. Leach ND, Nodal FR, Cordery PM, King AJ, Bajo VM (2013) Cortical cholinergic input is
required for normal auditory perception and experience-dependent plasticity in adult
ferrets. J Neurosci 33(15):6659–6671.18. Parbery-Clark A, Skoe E, Lam C, Kraus N (2009) Musician enhancement for speech-in-
noise. Ear Hear 30(6):653–661.
Whitton et al. PNAS Early Edition | 9 of 10
NEU
ROSC
IENCE
PNASPL
US

19. Kraus N, Chandrasekaran B (2010) Music training for the development of auditoryskills. Nat Rev Neurosci 11(8):599–605.
20. Green CS, Bavelier D (2003) Action video game modifies visual selective attention.Nature 423(6939):534–537.
21. Li R, Polat U, Makous W, Bavelier D (2009) Enhancing the contrast sensitivity functionthrough action video game training. Nat Neurosci 12(5):549–551.
22. Anguera JA, et al. (2013) Video game training enhances cognitive control in olderadults. Nature 501(7465):97–101.
23. Li J, et al. (2013) Dichoptic training enables the adult amblyopic brain to learn. CurrBiol 23(8):R308–R309.
24. Li RW, Ngo C, Nguyen J, Levi DM (2011) Video-game play induces plasticity in thevisual system of adults with amblyopia. PLoS Biol 9(8):e1001135.
25. Sperling AJ, Lu ZL, Manis FR, Seidenberg MS (2005) Deficits in perceptual noise ex-clusion in developmental dyslexia. Nat Neurosci 8(7):862–863.
26. Ziegler JC, Pech-Georgel C, George F, Alario FX, Lorenzi C (2005) Deficits in speechperception predict language learning impairment. Proc Natl Acad Sci USA 102(39):14110–14115.
27. Kim SH, Frisina RD, Mapes FM, Hickman ED, Frisina DR (2006) Effect of age on bin-aural speech intelligibility in normal hearing adults. Speech Commun 48(6):591–597.
28. Ruggles D, Bharadwaj H, Shinn-Cunningham BG (2012) Why middle-aged listenershave trouble hearing in everyday settings. Curr Biol 22(15):1417–1422.
29. Kidd G, Jr., Arbogast TL, Mason CR, Walsh M (2002) Informational masking in listenerswith sensorineural hearing loss. J Assoc Res Otolaryngol 3(2):107–119.
30. Marrone N, Mason CR, Kidd G, Jr. (2008) The effects of hearing loss and age on thebenefit of spatial separation between multiple talkers in reverberant rooms. J AcoustSoc Am 124(5):3064–3075.
31. Khan AG, Sarangi M, Bhalla US (2012) Rats track odour trails accurately using a multi-layered strategy with near-optimal sampling. Nat Commun 3:703.
32. Hill NA, Hader DP (1997) A biased random walk model for the trajectories of swim-ming micro-organisms. J Theor Biol 186(4):503–526.
33. Sabin AT, Eddins DA, Wright BA (2012) Perceptual learning evidence for tuning tospectrotemporal modulation in the human auditory system. J Neurosci 32(19):6542–6549.
34. Fitzgerald MB, Wright BA (2005) A perceptual learning investigation of the pitchelicited by amplitude-modulated noise. J Acoust Soc Am 118(6):3794–3803.
35. Song JH, Skoe E, Banai K, Kraus N (2012) Training to improve hearing speech in noise:Biological mechanisms. Cereb Cortex 22(5):1180–1190.
36. Henderson Sabes J, Sweetow RW (2007) Variables predicting outcomes on listeningand communication enhancement (LACE) training. Int J Audiol 46(7):374–383.
37. Olson AD, Preminger JE, Shinn JB (2013) The effect of LACE DVD training in new andexperienced hearing aid users. J Am Acad Audiol 24(3):214–230.
38. Polley DB, Read HL, Storace DA, Merzenich MM (2007) Multiparametric auditory re-ceptive field organization across five cortical fields in the albino rat. J Neurophysiol97(5):3621–3638.
39. Dean I, Harper NS, McAlpine D (2005) Neural population coding of sound level adaptsto stimulus statistics. Nat Neurosci 8(12):1684–1689.
40. Foffani G, Moxon KA (2004) PSTH-based classification of sensory stimuli using en-sembles of single neurons. J Neurosci Methods 135(1-2):107–120.
41. Yovel Y, Falk B, Moss CF, Ulanovsky N (2010) Optimal localization by pointing off axis.Science 327(5966):701–704.
42. Fiorentini A, Berardi N (1980) Perceptual learning specific for orientation and spatialfrequency. Nature 287(5777):43–44.
43. Jeter PE, Dosher BA, Liu SH, Lu ZL (2010) Specificity of perceptual learning increaseswith increased training. Vision Res 50(19):1928–1940.
44. Ahissar M, Hochstein S (1997) Task difficulty and the specificity of perceptual learn-ing. Nature 387(6631):401–406.
45. Xiao LQ, et al. (2008) Complete transfer of perceptual learning across retinal locationsenabled by double training. Curr Biol 18(24):1922–1926.
46. Harris H, Gliksberg M, Sagi D (2012) Generalized perceptual learning in the absence ofsensory adaptation. Curr Biol 22(19):1813–1817.
47. Zhang JY, et al. (2010) Rule-based learning explains visual perceptual learning and itsspecificity and transfer. J Neurosci 30(37):12323–12328.
48. Resnik J, Sobel N, Paz R (2011) Auditory aversive learning increases discriminationthresholds. Nat Neurosci 14(6):791–796.
49. Lim SJ, Holt LL (2011) Learning foreign sounds in an alien world: Videogame trainingimproves non-native speech categorization. Cogn Sci 35(7):1390–1405.
50. Green CS, Bavelier D (2012) Learning, attentional control, and action video games.Curr Biol 22(6):R197–R206.
51. Wong PCM, Skoe E, Russo NM, Dees T, Kraus N (2007) Musical experience shapeshuman brainstem encoding of linguistic pitch patterns. Nat Neurosci 10(4):420–422.
52. Ruggles DR, Freyman RL, Oxenham AJ (2014) Influence of musical training on un-derstanding voiced and whispered speech in noise. PLoS One 9(1):e86980.
53. Chang DHF, Kourtzi Z, Welchman AE (2013) Mechanisms for extracting a signal fromnoise as revealed through the specificity and generality of task training. J Neurosci33(27):10962–10971.
54. Dosher BA, Lu ZL (1998) Perceptual learning reflects external noise filtering and in-ternal noise reduction through channel reweighting. Proc Natl Acad Sci USA 95(23):13988–13993.
55. Dosher BA, Lu ZL (1999) Mechanisms of perceptual learning. Vision Res 39(19):3197–3221.
56. Levi DM (2005) Perceptual learning in adults with amblyopia: A reevaluation ofcritical periods in human vision. Dev Psychobiol 46(3):222–232.
57. Green CS, Pouget A, Bavelier D (2010) Improved probabilistic inference as a generallearning mechanism with action video games. Curr Biol 20(17):1573–1579.
58. Bavelier D, Green CS, Pouget A, Schrater P (2012) Brain plasticity through the lifespan: Learning to learn and action video games. Annu Rev Neurosci 35(35):391–416.
59. Bejjanki VR, Beck JM, Lu ZL, Pouget A (2011) Perceptual learning as improved prob-abilistic inference in early sensory areas. Nat Neurosci 14(5):642–648.
60. Recanzone GH, Schreiner CE, Merzenich MM (1993) Plasticity in the frequency rep-resentation of primary auditory cortex following discrimination training in adult owlmonkeys. J Neurosci 13(1):87–103.
61. Polley DB, Steinberg EE, Merzenich MM (2006) Perceptual learning directs audi-tory cortical map reorganization through top-down influences. J Neurosci 26(18):4970–4982.
62. Blake DT, Heiser MA, Caywood M, Merzenich MM (2006) Experience-dependent adultcortical plasticity requires cognitive association between sensation and reward.Neuron 52(2):371–381.
63. Engineer CT, et al. (2014) Speech training alters tone frequency tuning in rat primaryauditory cortex. Behav Brain Res 258:166–178.
64. Edeline JM, Pham P, Weinberger NM (1993) Rapid development of learning-inducedreceptive field plasticity in the auditory cortex. Behav Neurosci 107(4):539–551.
65. David SV, Fritz JB, Shamma SA (2012) Task reward structure shapes rapid receptivefield plasticity in auditory cortex. Proc Natl Acad Sci USA 109(6):2144–2149.
66. Atiani S, Elhilali M, David SV, Fritz JB, Shamma SA (2009) Task difficulty and perfor-mance induce diverse adaptive patterns in gain and shape of primary auditory corticalreceptive fields. Neuron 61(3):467–480.
67. Blake DT, Strata F, Churchland AK, Merzenich MM (2002) Neural correlates of in-strumental learning in primary auditory cortex. Proc Natl Acad Sci USA 99(15):10114–10119.
68. Beitel RE, Schreiner CE, Cheung SW, Wang X, Merzenich MM (2003) Re-ward-dependent plasticity in the primary auditory cortex of adult monkeys trained todiscriminate temporally modulated signals. Proc Natl Acad Sci USA 100(19):11070–11075.
69. Chen Y, et al. (2008) Task difficulty modulates the activity of specific neuronal pop-ulations in primary visual cortex. Nat Neurosci 11(8):974–982.
70. Boudreau CE, Williford TH, Maunsell JHR (2006) Effects of task difficulty and targetlikelihood in area V4 of macaque monkeys. J Neurophysiol 96(5):2377–2387.
71. Spingath EY, Kang HS, Plummer T, Blake DT (2011) Different neuroplasticity for tasktargets and distractors. PLoS One 6(1):e15342.
72. Znamenskiy P, Zador AM (2013) Corticostriatal neurons in auditory cortex drive de-cisions during auditory discrimination. Nature 497(7450):482–485.
73. Law CT, Gold JI (2008) Neural correlates of perceptual learning in a sensory-motor,but not a sensory, cortical area. Nat Neurosci 11(4):505–513.
74. Zanto TP, Rubens MT, Thangavel A, Gazzaley A (2011) Causal role of the prefrontalcortex in top-down modulation of visual processing and working memory. NatNeurosci 14(5):656–661.
75. Bavelier D, Achtman RL, Mani M, Föcker J (2012) Neural bases of selective attention inaction video game players. Vision Res 61:132–143.
76. Mishra J, Zinni M, Bavelier D, Hillyard SA (2011) Neural basis of superior performanceof action videogame players in an attention-demanding task. J Neurosci 31(3):992–998.
77. Lin FR, Niparko JK, Ferrucci L (2011) Hearing loss prevalence in the United States. ArchIntern Med 171(20):1851–1852.
78. Florentine M, Buus S, Scharf B, Zwicker E (1980) Frequency selectivity in normally-hearing and hearing-impaired observers. J Speech Hear Res 23(3):646–669.
79. Doherty KA, Lutfi RA (1999) Level discrimination of single tones in a multitone complexby normal-hearing and hearing-impaired listeners. J Acoust Soc Am 105(3):1831–1840.
80. Buran BN, et al. (2014) A sensitive period for the impact of hearing loss on auditoryperception. J Neurosci 34(6):2276–2284.
81. de Villers-Sidani E, et al. (2010) Recovery of functional and structural age-relatedchanges in the rat primary auditory cortex with operant training. Proc Natl Acad SciUSA 107(31):13900–13905.
82. Naber M (2008) Soundgen: A Web services based sound generation system forthe psychoacoustics laboratory. MS thesis (Massachusetts Institute of Technology,Cambridge, MA).
83. Levitt H (1971) Transformed up-down methods in psychoacoustics. J Acoust Soc Am49(2):Suppl 2:467.
84. Killion MC, Niquette PA, Gudmundsen GI, Revit LJ, Banerjee S (2004) De-velopment of a quick speech-in-noise test for measuring signal-to-noise ratioloss in normal-hearing and hearing-impaired listeners. J Acoust Soc Am 116(4 Pt 1):2395–2405.
85. Guo W, et al. (2012) Robustness of cortical topography across fields, laminae, anes-thetic states, and neurophysiological signal types. J Neurosci 32(27):9159–9172.
10 of 10 | www.pnas.org/cgi/doi/10.1073/pnas.1322184111 Whitton et al.

Supporting InformationWhitton et al. 10.1073/pnas.1322184111SI Materials and MethodsAuditory Foraging Task. Mouse behavior. All procedures performedwith mice were approved by the Animal Care and Use Committeeat Massachusetts Eye and Ear Infirmary and followed theguidelines established by the National Institutes of Health for thecare and use of laboratory animals. One week before behavioraltraining, eight male CBA-CaJ mice, aged 6 wk, were water re-stricted and their light/dark cycles were reversed. Four mice werechosen to train on the auditory foraging task, and the other fourserved as passively exposed controls. All mice were maintainedabove 80% of their pretraining body weight. Passive exposure wasimplemented through yoking; while one mouse was training, theiryoked counterpart was placed in an elevated listening chambersituated inside the training arena. Trained mice received theirdaily water allowance through rewards during task performance;passive exposure mice were provided access to water for 30 mineither 1–2 h preceding or following their stimulus exposure. Theauditory foraging task required that mice use auditory feedbackcues to navigate to a randomly selected location in a 40 × 65-cm,sound-treated, training arena. Acoustic cues were deliveredthrough a tweeter positioned 55 cm above the floor of thetraining arena (Scan Speak; D3004). In this task, the level of a16-kHz tonal stimulus (5-Hz sinusoidal amplitude modulation)served as the informative auditory cue. Additionally, a broadbandnoise was continuously presented at 42–47 dB sound pressurelevel (SPL) as a distractor. The level of the stimulus varied di-rectly with the mouse’s Euclidean distance from the target loca-tion. The position of the mouse relative to the target wasmonitored with a webcam (Creative Labs) and custom software.The tone level was continuously updated such that colocation ofthe mouse in the target location corresponded to the lowest tonelevel (35–60 dB SPL) and distances further from the targetevoked higher stimulus levels. Thus, as the mouse moved towardthe target location under a constant level of masking noise, thesignal-to-noise ratio (SNR) decreased linearly. The stimulus levelgradient consisted of a 0.38-dB SPL level increase per centimeterdistance from the target (target levels, 35–60 dB SPL). In the mostextreme positioning of the mouse relative to the target (positionedin diagonally opposing corners of the arena), this resulted in a 30dB SPL gradient, although this condition was rarely realized. If themouse was able to navigate to the target location (a 14-cm-di-ameter circle) and remain within this space for 2 s, the auditorystimulus stopped, indicating that the mouse could return to thewater spout for a reward of variable magnitude. For the first 2 d,mice were placed in the training arena and allowed to explore.During this time, mice learned where the water spout was located.Task demands were then initially set such that the mouse wouldrandomly trip the reward often (i.e., large target diameter andshort wait time). As the mice learned to associate stimulus prop-erties with reward, the target diameter was reduced and the waittime was increased. Only data obtained with 14-cm-diametertargets and 2-s wait times are reported. Water rewards were de-livered according to a probability table. For the first half oftraining, the probability of a 10-μL reward was 1.0. During thesecond half of training, the probability of a 10-μL reward wasreduced to 0.6 and 0, 20, and 100-μL rewards were introduced atprobabilities of 0.1, 0.2, and 0.1, respectively. Mice generallycompleted 40–50 trials per day. If they received less than 1.5 mLof water via rewards, the difference was compensated. Mice weretrained on the foraging task for ∼3 mo.Human behavior. All procedures performed with humans wereapproved by theHuman Studies Committee atMassachusetts Eye
and Ear Infirmary and the Committee on the Use of Humans asExperimental Subjects at the Massachusetts Institute of Tech-nology. The research was conducted according to the principlesexpressed in the Declaration of Helsinki, and informed consentwas obtained from each participant. Twenty young adult subjectswith audiologically confirmed normal hearing sensitivity partic-ipated in this study. Subjects were randomly assigned to train onthe auditory foraging task (n = 10; eight females; mean age, 28 ±3 y) for 1 mo or to be passively exposed to the training stimuli(n = 10; six females; mean age, 26 ± 3 y) over the same time period.The overall goal of the human auditory foraging task was similarto that used with mice. Specifically, humans controlled themovements of an avatar in a 2D virtual arena using a game pad(Logitech F310) in the context of a custom video game. Thegame was downloaded on the participants’ laptop PCs. In thecase that the participant did not have a laptop PC, one wasloaned to them. Additionally, circumaural headphones (RazerCarcharias) were also provided to each participant for the de-livery of audio-game stimuli. Humans used audio feedback (levelof a continuous 500-Hz tone) to guide their avatar to a locationassociated with the lowest sound level. As in the mouse foragingtask, a broadband masker of ∼65 dB SPL (calibrated at theirinitial visit) was played continuously as a distractor. Also like themice, human subjects received no verbal instructions about thegoals of the game; rather they learned to forage for rewards(points) through trial and error. The subjects were required tokeep their avatar within the target area for 4 s to uncover thereward. If the subject failed to accomplish this within 60 s, thetrial timed out and was counted as a failure. One key differencebetween this task and the one used in the mouse training wasthat the minimum tone level decreased by 1 dB per game level asthe subjects achieved higher game levels. Importantly, subjectsstarted at level 1 of the game each day. Each game level (i.e.,SNR) had to be completed successfully three times to advance tothe next level. The first seven levels of the game representedtarget levels of +6–0 dB SNR and were reliably completed by allsubjects from the beginning to ending of training. The behavioraldata from these training SNRs are presented here. SNR wascalculated as the level of the target tone minus the level of themasker energy that fell within the equivalent rectangular band-width of the auditory filter surrounding the tone frequency (inthis case, 500 Hz). A second difference between the mouse andhuman training was that on two-thirds of training trials, an in-teraural phase difference of π radians was introduced to providea binaural cue for masking release. Nevertheless, we found thatsubjects performed equivalently with and without interauralphase cues on the foraging task for the lower training levels (i.e.,higher SNRs) analyzed here. Thus, the data obtained acrossthese two conditions are collapsed for this analysis.Subjects were asked to train for at least 30min per day for 5 d per
week over 4 wk (20 training sessions) in a quiet room. To unlock thegame each day, the subjects were required to enter a sound levelmeasurement of the ambient room noise (using a sound level meterthat we provided) into the training software. The average ambientnoise level in the training environments was 44 ± 1 dB A. Subjectstrained for an average of 33 min/d for 20 training days over thecourse of 1 mo. All data from training sessions were automaticallyuploaded to our servers at the Massachusetts Eye and Ear In-firmary using a secure file transfer protocol. All subjects werecompensated according to their performance (points scored) onthe game to encourage long-term motivation.
Whitton et al. www.pnas.org/cgi/content/short/1322184111 1 of 8

Participants in the passive exposure group were also asked toabide by the same schedule as the trained group except that theywere to listen to stimuli rather than play a game. We made digitalrecordings of the performances of a novice and an expert playeron the game. These recordings were edited into 30-min audiotracks, and participants who were randomized to the passiveexposure group listened to one of these tracks using the sameschedule described for the training participants. Each day, thepassive participants were required to fill in a listening log andsubmit it to us through a secure file transfer protocol. This logrecorded the ambient sound level (measured with a providedsound level meter), the track to which the participant listened,and the activity in which the participant engaged while listening.The participants were told that they could engage in quiet ac-tivities while listening to exposure tracks (reading, browsing theInternet, etc.). Data from the listening logs suggested that par-ticipants restricted their activities to this class of actions whilelistening to the tracks in quiet environments (mean ambient noiselevel, 45 ± 1 dB A; mean exposure days, 23). Participants werecompensated for their participation in the study.Auditory foraging behavioral analysis. Success rates on the foragingtask were quantified as the percentage of trials in which humansor mice located the target before time expired. When comparingsuccess vs. chance rates, a bias was introduced due to the fact thattrials ended upon trigger of the reward but not chance targets. Forthis reason, the reported success rates were corrected for chanceprobability by counting any trials where a chance target wastripped as a failure. For the moment-by-moment behavioralanalysis, we divided behavioral traces from training trials intomovement vectors that were subsampled every 0.3 s. At any giventime point, the optimal bearing toward the target could be cal-culated between the forager’s current position and the targetlocation. By subtracting the forager’s actual movement vector ateach 0.3-s behavioral “moment” from the ideal bearing, we wereable to represent, with search trajectories, how the forager’smovements deviated from the optimal search vector. Towardtarget bias of search trajectories was quantified as the meancosine of difference vectors across each trial (maximum possiblevalue, 1). SNR bias was quantified in a similar fashion using theabsolute value of the sine of the vectors subtracted from randomperformance, defined as the sine of an average vector angle ofπ/4 (maximum possible value, 0.707). Speed target bias and SNRbias were quantified in the same manner as described for theangular measures. The difference between these two methodswas that the length of each behavioral response vector was de-fined as the speed at which the animal or avatar was moving(rather than 1). All vectors were binned into 1 of 16 categoriesfrom 0 to 15π/8 rad in increments of π/8. The mean speed wascalculated for all response vector categories and then normalizedbefore the cosine or sine of the vectors was determined. Due tobinning effects, maximum possible speed SNR bias was 0.63.
Transfer of Learning. All testing was performed in a sound-treatedresearch booth. Auditory stimuli were generated using the soundcard of a Dell Precision AC40 desktop PC, routed through anInteracoustics AC40 clinical audiometer, where the signal wasamplified and then delivered through TDH-39 supra auralheadphones. Stimuli were calibrated using a Brüel and Kjær2231 sound-level meter coupled to an artificial ear of the samemake (model no. 4152). Both before and after intervention (i.e.,training or passive exposure), human subjects underwent pure-tone audiometric evaluation in a sound-treated booth using themodified Hughson–Westlake procedure to ensure normal hear-ing sensitivity (thresholds ≤ 20 dBHL). We then tested whetherlearning on the foraging task transferred outside of the taskdemands by making preintervention and postintervention mea-surements of signal in noise perception using both tonal andspeech stimuli. The presentation order of transfer tests was
randomized for each subject but kept consistent between thepreassessment and postassessment for an individual subject.Both pretest and posttest were prefaced with a practice block tofamiliarize the subject with the current task. The preassessmentoccurred 2 d before the onset of intervention (training or passiveexposure). The posttest was completed 2 d following the cessa-tion of the intervention. On average, the latencies from the preto post evaluations were 34 ± 6 d for the trained group and 36 ±8 d for the passively exposed group.Tone in noise detection. Tone in noise detection thresholds weremeasured using a two-interval, two-alternative forced-choiceprocedure. Stimuli were generated and the testing protocol wasimplemented using the SoundGen system (1). Subjects heard twostimulus intervals (both of which contained a noise sample andonly one of which also contained a tone sample) separated intime by a 0.4-s interstimulus interval. Subjects were asked toindicate which of the two samples contained a tone stimulus byusing a computer mouse to select the corresponding interval ona Dell flat panel monitor (2009 Wt) situated ∼60 cm from theparticipant’s nose on a small table. Detection thresholds weretracked using the 3-down, 1-up method to arrive at the stimu-lus level that afforded a correct response rate of 0.793 (2).Thresholds were measured for tones with carrier frequencies of250, 375, 500, and 750. The noise stimulus was created by high-pass filtering a Gaussian noise sample at 100 Hz with a second-order Butterworth filter and low-pass filtering with the samefilter order at 4,000 Hz. The tone and noise stimuli were rampedon and off simultaneously and persisted for a total of 0.3 s (25-msonset and offset with sin squared ramping). Following threeconsecutive correct responses, the tone level was decreased (thenoise level remained constant), whereas each incorrect responseresulted in an increase of the stimulus level. The initial step size(change in stimulus level) was 2 dB and decreased proportionallyto 0.2 dB by the 10th, and final, reversal. The mean of the last sixreversals was used to estimate threshold. A measurement wasrepeated if the SD of the last six reversals exceeded 1 dB SPL.Speech perception in babble noise. Speech perception in noise wasmeasured using a standard clinical assessment tool called theQuick Sentence in Noise Test (QuickSIN) (3) that is meant toassess real-world hearing in noise abilities. This test requires thata listener extract and repeat a sentence (with low predictability)spoken by a target female speaker in the presence of four-talkerbabble at increasingly difficult SNRs (target sentences fromMassachusetts Institute of Technology recordings of Institute ofElectrical and Electronics Engineers corpus and babble fromAuditec recordings). The QuickSIN consists of 15, six-sentencelist equivalents of similar difficulty level. Each sentence withina list was presented at a different SNR ranging from +25 to 0 dBand consisted of eight words on average; five of the total numberof words in a sentence were considered key words, and scoringwas restricted to these words. The babble noise was ramped onseveral seconds before the first target sentence in a block waspresented. After the target sentence was completed, the subjectwas given 5 s to repeat this sentence before the next targetsentence was presented. The subject was scored based on num-ber of key words correctly repeated. The babble was playedcontinuously throughout the testing block and increased in levelbetween target sentences to progressively reduce the SNR. Thepresentation level of the test was set to 70 dBHL (83 dB SPL)per the test instructions. Subjects were tested with seven listsbefore and after intervention. The mean scores across the pre-sented lists are reported here.
Neurophysiological Recordings. Surgical preparation. Trained (n = 4)and passively exposed (n = 4) mice were brought to a surgicalplane of anesthesia with an i.p. injection of ketamine/xylazine(120 kg/mg ketamine and 12 mg/kg xylazine). Throughout thesurgical procedures and subsequent neurophysiological recordings,
Whitton et al. www.pnas.org/cgi/content/short/1322184111 2 of 8

a state of areflexia was maintained with supplemental injections ofketamine (60–80 mg/kg ketamine). A scalpel was used to makea 4 × 3 mm (rostrocaudal by mediolateral) craniotomy over theright auditory cortex. The center of this rectangle was ∼2.8 mmposterior and 4.4 mm lateral to bregma. The dura mater was leftintact, and high viscosity silicone oil was applied to the brain sur-face. Throughout experimentation, the skin temperature of themouse was maintained at 36.5 °C via a homeothermic blanketsystem (Fine Science Tools).Recording procedures. A 16-channel silicone probe (177-μm2 con-tact area, 50-μm contacts on each of four shanks, 125 μm be-tween shanks; NeuroNexus) was inserted orthogonal to thecortical surface to record multiunit responses from the middlecortical layers (0.3–0.5 mm). To ensure cortical recordings wereperformed equivalently in passively exposed and trained mice,we first identified the caudal, low-frequency boundary, and thenproceeded to make three progressive recordings along the to-notopic axis of auditory cortex.All acoustic stimuli were generated using a 24-bit digital-to-
analog converter (National Instruments; model PXI-4461). Stimuliwere delivered to the left ear of the mouse via custom miniatureacoustic assemblies that contained twominiature dynamic speakers(CUI CDMG15008-03A) and an electret condenser microphone(Knowles FG-23339-PO7) coupled to a probe tube. Tone andnoise stimuli were generated through different speakers and thencombined in the sound delivery tube. In-ear acoustic calibrationwas performed immediately before each neurophysiology experi-ment. Additionally, normal function of the peripheral auditorysystem and accurate probe placement were confirmed by moni-toring the amplitude of distortion product otoacoustic emissionswith secondary (f2) stimulating frequencies of 8, 16, and 32 kHz(f2/f1 = 1.2, ratio of secondary to primary tone frequencies).Frequency response areas (FRAs) were measured at each
recording site by pseudorandomly presenting tone pips (50-msduration and 5-ms cosine squared onset and offset ramps) withcarrier frequencies of 4–48.5 kHz in 0.12-oct steps at intensitylevels from 0 to 80 dB SPL in 5-dB steps. This sampling of thestimulus space resulted in the presentation of 527 unique fre-quency/intensity combinations that were repeated twice at eachrecording site. Additionally, we also measured FRAs, usingthese same procedures, under four background noise conditions(noise, 40–70 dB SPL in 10-dB steps). The noise was ramped onsimultaneously with the first pseudorandomly presented tone pipand remained on at the specified level throughout the durationof all tonal stimuli used to measure the FRA. At each recordingsite, we randomly selected the order of noise conditions thatwould be presented (no noise, 40-, 50-, 60-, 70-dB noise) with thestipulation that the no-noise condition must have been selectedwithin the first four conditions.Data analysis.The raw response traces were digitized at 32 bit, 24.4kHz (RZ5 BioAmp Processor; Tucker-Davis Technologies) andstored in binary format. All subsequent analyses were performedinMATLAB (MathWorks) using custom scripts. The signals werefirst notch filtered at 60 Hz and bandpass filtered at 300–5,000Hz with a fifth-order Butterworth filter. Multiunit spikes wereidentified adaptively as voltage deflections that exceeded 4.5 SDsfrom the mean recorded activity (10-s running average). Post-stimulus time histograms (PSTHs) (1-ms bin widths) were con-structed for each responses site to collect stimulus spikingactivity. The onset of the response window was set at the timepoint at which spiking activity exceeded the spontaneous rate by4 SDs. Likewise, the offset of the response window coincidedwith the time point at which the spike rate fell below 5 SDsabove the spontaneous rate. The boundaries of the FRAs (FRAmask) were defined objectively in most cases. The FRA wassmoothed by a 3 × 3 point median filter, and the spike countswere collapsed across sound frequency or sound level to cre-ate spike level or frequency functions. These functions were
smoothed with a 5-point median filter and the spike frequencyfunction was inverted to create a V-shape. The tip of theV-shaped spike frequency function was set at the inflection pointof the spike level function. This objective strategy works well foridentifying the FRA boundaries of typical recordings in rodent,anesthetized primary auditory cortex (4); however, it did notaccurately depict the boundaries of the “leaning” FRAs observedin our trained mice. Accordingly, these boundaries were manu-ally described secondary to visual inspection.Characteristic frequency (CF) was defined as the tone fre-
quency that evoked the highest spike rate at the threshold level ofthe recording site (inflection point of the spike level function).Best frequency was defined as the frequency that evoked thehighest firing rate at suprathreshold sound levels. Likewise, bestlevel was defined as the stimulus level presented at the site’s CFthat evoked the highest spike rate. Monotonicity was quantifiedby first smoothing the normalized rate-level function at a re-cording site’s CF with a 5-point median filter. We then at-tempted to identify one of two inflection points in the curve. Ifthe best level of the curve was <65 dB, we used the second de-rivative of the function to find the most negative inflection be-tween 30 and 60 dB. If this inflection was less than −0.05, it wastreated as one end of a linear regression that was calculated overthe remaining points in the function (ending with response at80 dB). Rate-level functions whose slopes flattened slightly orcompletely at midlevels (still considered monotonic) and thosethat decreased in firing rates above this point (nonmonotonic)were captured using this method. If either of the two conditionswere not met, we searched for the inflection point around thethreshold response level by identifying the minimum point atwhich firing rate consistently exceeded spontaneous firing andthen calculated the maximum inflection in a range of levelssurrounding this point. The linear regression between this pointin the function and the function’s end was used to calculate itsmonotonicity. Rate-level functions that increased their firingrate at a consistent slope above threshold were captured usingthis approach.The index of neural SNR was defined as ðS−NÞ=ðS+NÞ,
where S is the average response (in spikes per second) of eachsite to tones presented at 16 kHz (±0.12 oct) and 35–60 dB SPL,and N represents the average spike rate at that site recorded overa 0.1-s window beginning 150 ms before stimulus onset. There-fore, “noise” is characterized by the spontaneous firing rate inquiet conditions and the steady-state response to continuousbroadband noise in the noise conditions.The first derivatives of smoothed rate-level functions (5-point
median filter) were approximated using a 5-point centered nu-merical algorithm:
F′ðxÞ=−Fðx+ 2hÞ+ 8Fðx+ hÞ− 8Fðx− hÞ+Fðx− 2hÞ12h
+O�h4�;
where x is the signal level and h is the change in signal level. Foreach signal level (10–70 dB SPL), the mean absolute value of theapproximate first derivative was calculated.
Fisher information. Fisher information functions were computedfor each recording site using the methods described by Dean et al.(5) to obtain the probability that, given a sound level of s, re-cording site a would generate r spikes Pa½rjs�. Intuitively, Fisherinformation of a rate-level function is maximal under conditionsof low intertrial variability and high slope:
faðsÞ=Xr
Pa½rjs��d lnPa½rjs�
ds
�2
;
where the differential in the rightmost term was performed usingthe same 5-point centered numerical algorithm described above.
Whitton et al. www.pnas.org/cgi/content/short/1322184111 3 of 8

The calculation was implemented by first obtaining the spikecount in response to a given stimulus level s of a 16-kHz tone(±0.12 oct) using a 50-ms window that began 5 ms following theonset of the stimulus. The responses to repetitions of the soundlevel s were then binned to create a histogram of spike counts.Using these data, a R × 17 matrix was constructed, with R reflectingthe highest spike count obtained for any of the stimulus repetitionsat each of the 17 sound levels that were presented. This matrix wasconvolved with a Gaussian kernel with SDs of 0.5 spikes and 10-dBSDs and then converted to a matrix of spike count given stimuluslevel Pa½rjs� by normalizing the sum of each column (sound level)to 1. Finally, the Fisher information of the neural population F(s)was then calculated by averaging the faðsÞ at all sites:
FðsÞ=Xa
faðsÞ:
PSTH-based classifier model.The PSTH classifier model comparesthe Euclidean distances between the population single-trial spiketrain elicited by a given stimulus level (5-dB range) of a 16 kHz(±0.24 oct) tonal stimulus to response templates created forthat level and neighboring stimulus levels (levels 10 dB higherand lower than the actual stimulus level). The spike train isclassified as being generated in response to the stimulus levelfrom which its distance is minimal.A response window of 0.1 s was aligned with stimulus onset.
Following the model presented by Foffani and Moxon (6), amatrix with T × S rows and B × N columns was constructed,where T is the number of times the stimulus was repeated (n =20), S is the number of stimuli (S = 3 sound levels for eachclassification), B is the number of bins that contain spikes (B =100), and N is the number of recording sites across the pop-ulation (N = 151 Experimental and 180 Passive Control).Let vi,j represent the spike count in ith row and jth column of
the matrix, where i goes from 1 to ST and j goes from 1 to NB.Templates for each stimulus were defined as vs = ½vs1; . . . ; vsNB�,where the jth element is calculated as follows:
vjy =1T
Xi∈s
vsij:
For each trial vi = ½vi;1; . . . ; vi;B�, the Euclidean distance betweenthat trial and each stimulus template vs = ½vs1; . . . ; vsB� was de-fined as follows:
dis =
ffiffiffiffiffiffiffiffiffiffiffiffiffiffiffiffiffiffiffiffiffiffiffiffiffiffiffiffiffiXNBj=1
�vi;j − vsj
�2
vuut :
Using these distances, the spike train is classified as being gener-ated by the stimulus class represented by the closest template,resulting in an outcome vector of c= ½c1; . . . ; cST �, where
ci = argmins
�dis�:
Therefore, c will be of the same length as ST (total number oftrials for all stimuli), and each element ci indicates to whichstimulus the ith trial is assigned. We report the mean classifica-tion probability across all trials.
Statistical Analysis. The Jarque–Bera test and visualization of his-tograms were used to characterize the normality of data samples.In the case of normal distributions, parametric tests were used totest for statistical significance. Two-sample t tests were primarilyused to compare between group differences. When comparingdata over multiple conditions, a two-way ANOVA was used todefine group, condition, and interaction terms followed by posthoc two-sample t tests that were corrected for multiple compar-isons (Holm–Bonferroni) when statistically significant group bycondition interactions were identified. The statistical significanceof nonnormally distributed training data was analyzed usingFriedman’s test. Between-group differences in distribution shapes(e.g., CF distribution) were examined using the two-sample Kol-mogorov–Smirnov test. All other between-group statistical com-parisons of nonnormally distributed data were made usingbootstrapped permutation tests (100,000 iterations) for differ-ences in means. Correlations were quantified using Pearson’slinear correlation coefficient and corrected for multiple compar-isons (Holm–Bonferroni).
1. Naber M (2008) Soundgen a web services based sound generation system for thepsychoacoustics laboratory. Master of Electrical Engineering and Computer Science(Massachusetts Institute of Technology, Cambridge).
2. Levitt H (1971) Transformed up-down methods in psychoacoustics. J Acoust Soc Am49(2):2, 467.
3. Killion MC, Niquette PA, Gudmundsen GI, Revit LJ, Banerjee S (2004) Development ofa quick speech-in-noise test for measuring signal-to-noise ratio loss in normal-hearingand hearing-impaired listeners. J Acoust Soc Am 116(4 Pt 1):2395–2405.
4. Guo W, et al. (2012) Robustness of cortical topography across fields, laminae, anestheticstates, and neurophysiological signal types. J Neurosci 32(27):9159–9172.
5. Dean I, Harper NS, McAlpine D (2005) Neural population coding of sound level adaptsto stimulus statistics. Nat Neurosci 8(12):1684–1689.
6. Foffani G, Moxon KA (2004) PSTH-based classification of sensory stimuli using ensemblesof single neurons. J Neurosci Methods 135(1-2):107–120.
Whitton et al. www.pnas.org/cgi/content/short/1322184111 4 of 8

0.1
0.2
0.3
0.4
0.5
0.6
0.7
0.8
0.9
1.0
Prop
ortio
n of
trai
ning
com
plet
ed
.11 d/s
MouseAngle Speed
.05 d/s
Human 1Angle Speed
Human 2
.05 d/s
Angle SpeedA B C
1 2 3 4 5 6 7 8 9 10
0.10
0.05
0.00
-0.05
∆ S
NR
bia
s
DSNR Strategy type
A B
1 2 3 4 5 6 7 8 9 10
0.10
0.05
0.00
Subjects (rank ordered by SNR bias)
∆ Ta
rget
bia
s
SNR Strategy typeA B
0.15E
Fig. S1. Tracking the development of distinct foraging strategies over the course of training. (A–C) Distributions of trajectories (filled bars) and speedmodulation (unfilled bars) at various stages of training in three example subjects. The gray outline reflects SEM. Human subjects 1 and 2 are representative offoraging strategy A (target bias) and B (SNR bias), respectively. (D) Foraging strategy for each human subject rank-ordered by the change (Late–Early) in SNRbias over the course of training. (E) Change in target bias based on the same subject ordering in D illustrates that change in target bias was unrelated to changein SNR bias, although subject 1 does show the largest negative change in SNR bias and positive change in target bias.
Whitton et al. www.pnas.org/cgi/content/short/1322184111 5 of 8
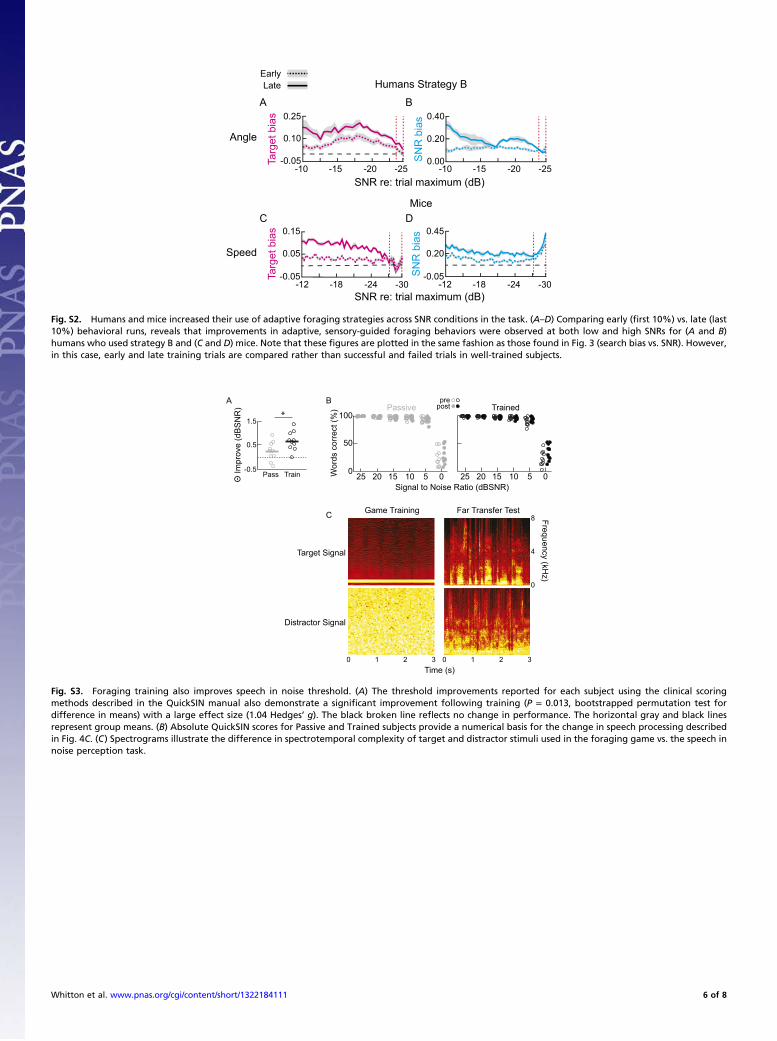
Targ
et b
ias
Mice
LateEarly
0.40
0.20
0.00
0.25
0.10
-0.05 SN
R b
ias
B
0.15
0.05
-0.05 SN
R b
ias 0.45
0.20
-0.05
A
DC
-10 -15 -20 -25SNR re: trial maximum (dB)
-10 -15 -20 -25
-12 -18 -24 -30 -12 -18 -24 -30SNR re: trial maximum (dB)
Targ
et b
ias
Speed
Angle
Humans Strategy B
Fig. S2. Humans and mice increased their use of adaptive foraging strategies across SNR conditions in the task. (A–D) Comparing early (first 10%) vs. late (last10%) behavioral runs, reveals that improvements in adaptive, sensory-guided foraging behaviors were observed at both low and high SNRs for (A and B)humans who used strategy B and (C and D) mice. Note that these figures are plotted in the same fashion as those found in Fig. 3 (search bias vs. SNR). However,in this case, early and late training trials are compared rather than successful and failed trials in well-trained subjects.
Θ Im
prov
e (d
BS
NR
)
-0.5
1.5
0.5
TrainPass
A
*
Wor
ds c
orre
ct (%
)
100
50
0 25 20 15 10 5 0
TrainedPassive
25 20 15 10 5 0
prepost
Signal to Noise Ratio (dBSNR)
B
Target Signal
Distractor Signal
Game Training Far Transfer Test8
4
Frequency (kHz)
Time (s)30 1 230 1 2
C
0
Fig. S3. Foraging training also improves speech in noise threshold. (A) The threshold improvements reported for each subject using the clinical scoringmethods described in the QuickSIN manual also demonstrate a significant improvement following training (P = 0.013, bootstrapped permutation test fordifference in means) with a large effect size (1.04 Hedges’ g). The black broken line reflects no change in performance. The horizontal gray and black linesrepresent group means. (B) Absolute QuickSIN scores for Passive and Trained subjects provide a numerical basis for the change in speech processing describedin Fig. 4C. (C) Spectrograms illustrate the difference in spectrotemporal complexity of target and distractor stimuli used in the foraging game vs. the speech innoise perception task.
Whitton et al. www.pnas.org/cgi/content/short/1322184111 6 of 8

A
1.2
0.6
0.0
Scree Plot
1 2 3 4 5 6
Eige
nval
ue
Factor number
95%
3%<1% each
Low SNR Speed (P = 0.008)
SNR bias (P = 0.01)Success (P = 0.06)
Pathlength
Time (P = 0.71)
Target bias
Factor 1
Fact
or 2
1.0
0.5
0.0
-1.0
-0.5
1.00.50.0-1.0 -0.5
Factor LoadingB
Fig. S4. Relationships between changes in foraging behaviors and the far transfer task. (A) The six behaviors that changed over training described in Figs. 1and 3 were subjected to dimensionality reduction using principal-components analysis. We found that the first two factors accounted for 98% of the variance.(B) Subsequent factor analysis revealed that two indices of learning, speed at low SNRs and time to solve the task, were nearly exclusively associated withFactors 1 and 2, respectively. We then found that behavioral markers that loaded primarily onto Factor 1 (e.g., speed at Low SNRs and SNR bias near the target)were significantly correlated with speech perception in noise (R = −0.77, R2 = 0.60, P = 0.008; R = 0.77, R2 = 0.60, P = 0.01, respectively), whereas markers thatloaded onto Factor 2 or a mixture of both factors were not (R = 0.14, R2 = 0.02, P = 0.71, and R = 0.62, R2 = 0.38, P = 0.06, for Time and Success, respectively). Insummary, this analysis revealed that, after Holm–Bonferroni correction for multiple (4) comparisons, the SNR bias and search speed at low SNRs were predictiveof transfer effects (P = 0.03 in both cases; Fig. 4 D and E).
50 7040 60
BW
Noise Level
1.52.0
1.0
0.5
1.0
0.0
Thre
sh ***
**
TrainedPassive
*
Pro
porti
onal
re: Q
uiet A
B
Fig. S5. (A and B) Threshold (thresh) elevation (A) and narrowing of (BW) frequency tuning (B) at 60 dB SPL with the addition of masking noise. Data pointscloser to the x axis indicate greater similarity to the response in quiet (i.e., enhanced resistance to masking noise interference). Data points reflect mean values,and error bars represent SEM. Group by Noise level interactions were statistically significant for the threshold and bandwidth data (P < 2 × 10⁻³). The asterisksindicate statistical significance assessed with post hoc two-sample t tests with Holm–Bonferroni correction for multiple comparisons (P < 0.05).
No noise
16 kHz level (dBSPL)
600
0
300
40 800
Firin
g ra
te (s
p/s)
40 dB 50 dB
Random #1
Random #2
Random #3
Random #4
Random #5
PassiveA
16 kHz level (dBSPL)
600
0
300
Firin
g ra
te (s
p/s)
No noise 40 dB 50 dBTrained
40 800
B
Fig. S6. Additional examples of 16-kHz rate-level functions from Passively exposed (A) and Trained (B) A1 recordings. Recording sites that were highly re-sponsive to 16-kHz tones (maximum firing rate, ≥100 sp/s) were randomly selected with replacement from each group under each noise conditions fiveconsecutive times. The top row of rate-level functions is replotted from Fig. 6D, to illustrate that the difference depicted in the main text was representative.The red broken lines enclose the stimulus levels associated with reward in the training task. The cyan rectangles on the x axes depict the level of the continuousnoise masker.
Whitton et al. www.pnas.org/cgi/content/short/1322184111 7 of 8

Firin
g ra
te c
hang
e (%
)
TrainedPassive
Tone Level (dBSPL)50 70
5
0 2010
2.5
30 40 60
70 Noise
5
0
2.5
Quiet*
5
0
2.5
40 Noise*
5
0
2.5
50 Noise
*
5
0
2.5
60 Noise
*
A 0.013
0.009
0.005
0.001
QuietB
40 Noise
50 Noise
60 Noise
Tone Level (dBSPL)50 702010 30 40 60
70 Noise
0.013
0.009
0.005
0.0010.013
0.009
0.005
0.0010.013
0.009
0.005
0.0010.013
0.009
0.005
0.001
**** ***
****
****
**
**
*
Fish
er in
form
atio
n (1
/dB
2 )
Fig. S7. Training increases coding information for weak signals presented in noise. (A) Change in absolute firing rate per unit change in signal magnitude wascalculated (Materials and Methods) for data collected in quiet and four levels of background noise. The red broken lines enclose the stimulus levels thatpredicted reward in the training task. The cyan rectangles on the x axes depict the level of the continuous noise masker. (B) Using the same color scheme, theaverage population Fisher information is plotted for quiet and noise conditions. Increases in masking level shifted peaks in rate-level function slopes and Fisherinformation to the right for the data collected from passively exposed mice. In general, the peaks of these functions were at or slightly above the maskinglevels (as functions flattened across weak signal levels). By contrast, at low masking levels, the peaks in firing rate function slopes as well as Fisher informationremained within the weak levels that predicted reward in the foraging task (i.e., below the masker level) for the data collected from trained mice. At highnoise levels (60–70 dB SPL), data from the trained and passively exposed mice were nearly identical. Data points reflect mean values, and error bars representSEM. Significance testing performed with post hoc two-sample t tests with Holm–Bonferroni correction for multiple comparisons; asterisks indicate P ≤ 0.05.
Whitton et al. www.pnas.org/cgi/content/short/1322184111 8 of 8