Embed Size (px)
Citation preview
© 2016 International Monetary Fund
IMF Country Report No. 16/301
PORTUGAL SELECTED ISSUES
This Selected Issues paper on Portugal was prepared by a staff team of the International
Monetary Fund as background documentation for the periodic consultation with the
member country. It is based on the information available at the time it was completed on
August 25, 2016.
Copies of this report are available to the public from
International Monetary Fund Publication Services
PO Box 92780 Washington, D.C. 20090
Telephone: (202) 623-7430 Fax: (202) 623-7201
E-mail: [email protected] Web: http://www.imf.org
Price: $18.00 per printed copy
International Monetary Fund
Washington, D.C.
September 2016
PORTUGAL SELECTED ISSUES
Approved By European Department
Prepared by M. Queyranne (FAD); M. Gaertner, I. Yackovlev (all EUR); A. Bouveret (MCM); with assistance from Y. Cai and V. Bezerra de Menezes (all EUR).
POLICY OPTIONS TO MITIGATE THE IMPACT OF ADVERSE DEMOGRAPHIC
DEVELOPMENTS ____________________________________________________________________ 4
A. Portugal’s Population is Projected to Shrink over the Medium and Long Run ____ 5
B. Adverse Demographic Changes Will Pose Significant Fiscal Challenges __________ 8
C. Policy Options to Mitigate the Fiscal Impact of Portugal’s Shrinking Population 12
D. Conclusions _____________________________________________________________________ 23
BOXES
1. Projection Methodology __________________________________________________________ 8
2. Differences with the European Commission 2015 Ageing Report _______________ 10
3. Decomposition of Age-Related Spending - Methodology for Sensitivity Tests _ 12
FIGURES
1. Demographic Developments ______________________________________________________ 6
2. Demographic Trends and Projections _____________________________________________ 7
3. Age-Related Public Spending in Portugal and the Euro Area _____________________ 8
4. Health Spending __________________________________________________________________ 9
5. Impact of Alternative Demographic Scenarios Relative to the Baseline _________ 11
6. Increase Fertility Rates __________________________________________________________ 14
7. Family Benefits __________________________________________________________________ 15
8. Share of Means-Tested Family and Child Benefits 2012 ________________________ 15
9. Higher Migration Risk Scenario _________________________________________________ 16
10. Increase Labor Force Participation of Women _________________________________ 18
CONTENTS
August 25, 2016

PORTUGAL
2 INTERNATIONAL MONETARY FUND
11. Increase Labor Force Participation of Elderly _________________________________________________ 18
12. Projected Reductions in Benefit Ratios and Pension Eligibility (2013-2060) and Projected
Reductions Achieved During 2013-2035 _________________________________________________________ 20
13. Lower Excess Cost Growth ___________________________________________________________________ 21
14. Health Spending _____________________________________________________________________________ 22 TABLES 1. Health Spending Increase _______________________________________________________________________ 9
2. Impact of Demographic Uncertainty on Aging and Age-Related Programs for Portugal, 2015-
2100________________________________________________________________________________________________11
3. Impact of Selected Policy Options on Aging and Age-Related Programs in Portugal, 2015-
2100________________________________________________________________________________________________13
REFERENCES _____________________________________________________________________________________ 24
CHALLENGES CONFRONTING PORTUGUESE BANKS: PROFITABILITY AND ASSET
QUALITY___________________ ______________________________________________________________________ 26
A. Introduction ___________________________________________________________________________________ 26
B. The Pre-Crisis Period (1995–2007): Build-up of Vulnerabilities ________________________________ 27
C. The Crisis Hits (2008–2013): Crystallization of Risks ___________________________________________ 29
D. The Post-Crisis (2014–16): More Constraints, Less Room for Maneuver ______________________ 33
E. The Medium Term: Remaining Challenges ____________________________________________________ 34 BOX
1. Portugal: An Empirical Analysis of Drivers of Bank Profitability, 2010–15 ______________________ 31
FIGURE
1. Bank Asset Structure, 1999–2007 ______________________________________________________________ 29
REFERENCES _____________________________________________________________________________________ 36
PORTUGAL THROUGH QUANTITATIVE EASING (QE) _________________________________________ 37
A. An Overview of the ECB’s Asset Purchase Program ___________________________________________ 37
B. Assessing the Impact on Portugal _____________________________________________________________ 38
C. Conclusion ____________________________________________________________________________________ 46
PORTUGAL
INTERNATIONAL MONETARY FUND 3
FIGURES 1. Fiscal Developments____________________________________________________________________________40
2. Financial Sector Developments ________________________________________________________________ 42
3. Macroeconomic Developments: Housing Prices and Consumption ___________________________ 44
4. Macroeconomic Developments: Consumption, Savings, and Investment _____________________ 45 REFERENCES _____________________________________________________________________________________ 47
PORTUGAL
4 INTERNATIONAL MONETARY FUND
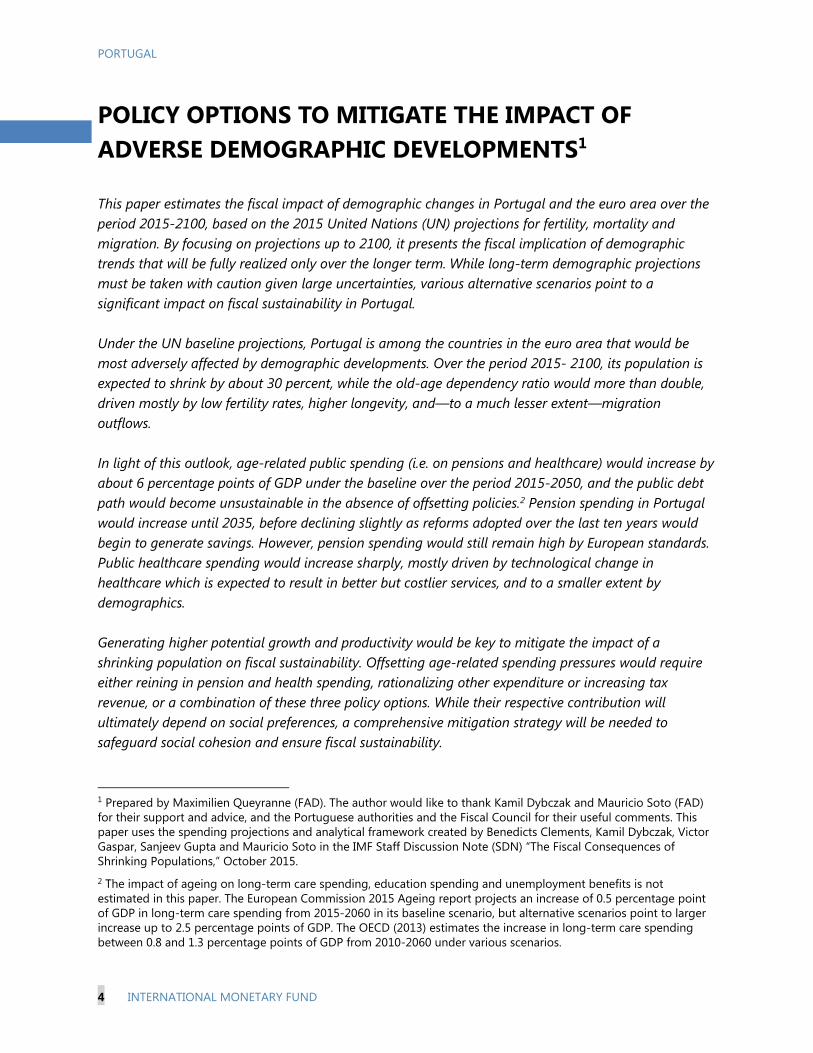
POLICY OPTIONS TO MITIGATE THE IMPACT OF ADVERSE DEMOGRAPHIC DEVELOPMENTS1 This paper estimates the fiscal impact of demographic changes in Portugal and the euro area over the period 2015-2100, based on the 2015 United Nations (UN) projections for fertility, mortality and migration. By focusing on projections up to 2100, it presents the fiscal implication of demographic trends that will be fully realized only over the longer term. While long-term demographic projections must be taken with caution given large uncertainties, various alternative scenarios point to a significant impact on fiscal sustainability in Portugal. Under the UN baseline projections, Portugal is among the countries in the euro area that would be most adversely affected by demographic developments. Over the period 2015- 2100, its population is expected to shrink by about 30 percent, while the old-age dependency ratio would more than double, driven mostly by low fertility rates, higher longevity, and—to a much lesser extent—migration outflows. In light of this outlook, age-related public spending (i.e. on pensions and healthcare) would increase by about 6 percentage points of GDP under the baseline over the period 2015-2050, and the public debt path would become unsustainable in the absence of offsetting policies.2 Pension spending in Portugal would increase until 2035, before declining slightly as reforms adopted over the last ten years would begin to generate savings. However, pension spending would still remain high by European standards. Public healthcare spending would increase sharply, mostly driven by technological change in healthcare which is expected to result in better but costlier services, and to a smaller extent by demographics. Generating higher potential growth and productivity would be key to mitigate the impact of a shrinking population on fiscal sustainability. Offsetting age-related spending pressures would require either reining in pension and health spending, rationalizing other expenditure or increasing tax revenue, or a combination of these three policy options. While their respective contribution will ultimately depend on social preferences, a comprehensive mitigation strategy will be needed to safeguard social cohesion and ensure fiscal sustainability.
1 Prepared by Maximilien Queyranne (FAD). The author would like to thank Kamil Dybczak and Mauricio Soto (FAD) for their support and advice, and the Portuguese authorities and the Fiscal Council for their useful comments. This paper uses the spending projections and analytical framework created by Benedicts Clements, Kamil Dybczak, Victor Gaspar, Sanjeev Gupta and Mauricio Soto in the IMF Staff Discussion Note (SDN) “The Fiscal Consequences of Shrinking Populations,” October 2015. 2 The impact of ageing on long-term care spending, education spending and unemployment benefits is not estimated in this paper. The European Commission 2015 Ageing report projects an increase of 0.5 percentage point of GDP in long-term care spending from 2015-2060 in its baseline scenario, but alternative scenarios point to larger increase up to 2.5 percentage points of GDP. The OECD (2013) estimates the increase in long-term care spending between 0.8 and 1.3 percentage points of GDP from 2010-2060 under various scenarios.
PORTUGAL
INTERNATIONAL MONETARY FUND 5
This paper focuses on measures that would help mitigate age-related spending pressure and minimize the impact on tax revenues and non-age-related public expenditure. A multi-pronged approach is proposed with policies that both affect demographics and labor markets, as well as entitlements reforms. Avoiding pension policy reversals and revisiting recent pension reforms to address inequities among generations and across pension schemes, reversing migration outflows, and reducing healthcare cost growth are critical to partially offset the adverse impact of demographics on public finances. The paper is structured as follows: The first section describes demographic developments and projections under the UN baseline scenario. The second section discusses the fiscal impact of projected demographic changes on age related-spending. The final section presents a set of policy options to mitigate the fiscal impact of Portugal’s shrinking population. The conclusion highlights key policy actions needed in the short and medium term. A. Portugal’s Population is Projected to Shrink over the Medium and Long Run
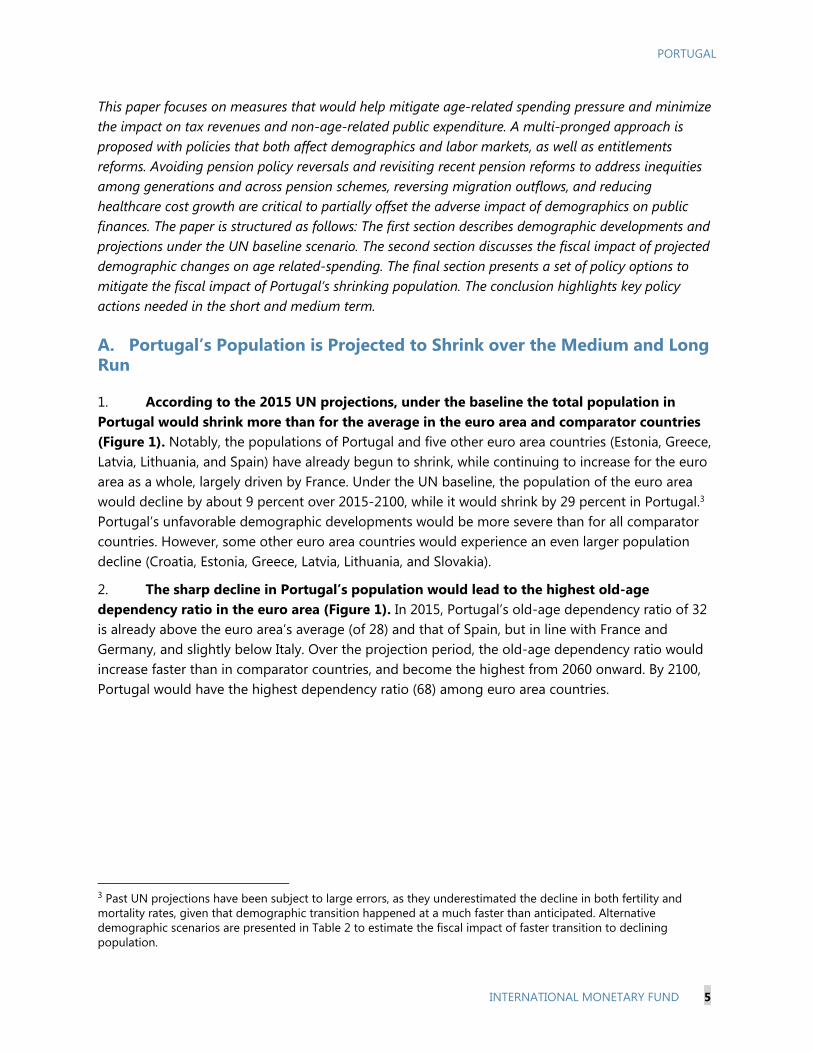
1. According to the 2015 UN projections, under the baseline the total population in Portugal would shrink more than for the average in the euro area and comparator countries (Figure 1). Notably, the populations of Portugal and five other euro area countries (Estonia, Greece, Latvia, Lithuania, and Spain) have already begun to shrink, while continuing to increase for the euro area as a whole, largely driven by France. Under the UN baseline, the population of the euro area would decline by about 9 percent over 2015-2100, while it would shrink by 29 percent in Portugal.3 Portugal’s unfavorable demographic developments would be more severe than for all comparator countries. However, some other euro area countries would experience an even larger population decline (Croatia, Estonia, Greece, Latvia, Lithuania, and Slovakia).
2. The sharp decline in Portugal’s population would lead to the highest old-age dependency ratio in the euro area (Figure 1). In 2015, Portugal’s old-age dependency ratio of 32 is already above the euro area’s average (of 28) and that of Spain, but in line with France and Germany, and slightly below Italy. Over the projection period, the old-age dependency ratio would increase faster than in comparator countries, and become the highest from 2060 onward. By 2100, Portugal would have the highest dependency ratio (68) among euro area countries.
3 Past UN projections have been subject to large errors, as they underestimated the decline in both fertility and mortality rates, given that demographic transition happened at a much faster than anticipated. Alternative demographic scenarios are presented in Table 2 to estimate the fiscal impact of faster transition to declining population.
PORTUGAL
6 INTERNATIONAL MONETARY FUND
Figure 1. Demographic Developments Population projections, 2015-2100
(Index, 2015=100) Old-Age Dependency Ratio
Source: IMF staff calculations using UN 2015.
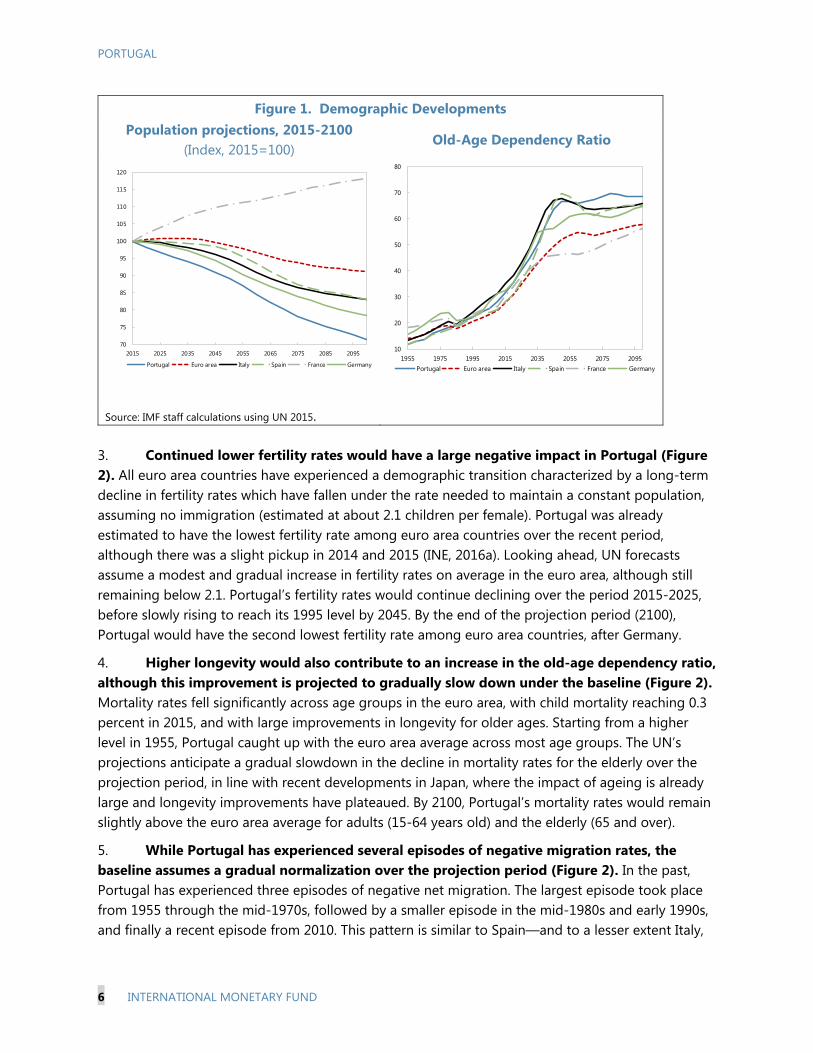
3. Continued lower fertility rates would have a large negative impact in Portugal (Figure 2). All euro area countries have experienced a demographic transition characterized by a long-term decline in fertility rates which have fallen under the rate needed to maintain a constant population, assuming no immigration (estimated at about 2.1 children per female). Portugal was already estimated to have the lowest fertility rate among euro area countries over the recent period, although there was a slight pickup in 2014 and 2015 (INE, 2016a). Looking ahead, UN forecasts assume a modest and gradual increase in fertility rates on average in the euro area, although still remaining below 2.1. Portugal’s fertility rates would continue declining over the period 2015-2025, before slowly rising to reach its 1995 level by 2045. By the end of the projection period (2100), Portugal would have the second lowest fertility rate among euro area countries, after Germany.
4. Higher longevity would also contribute to an increase in the old-age dependency ratio, although this improvement is projected to gradually slow down under the baseline (Figure 2). Mortality rates fell significantly across age groups in the euro area, with child mortality reaching 0.3 percent in 2015, and with large improvements in longevity for older ages. Starting from a higher level in 1955, Portugal caught up with the euro area average across most age groups. The UN’s projections anticipate a gradual slowdown in the decline in mortality rates for the elderly over the projection period, in line with recent developments in Japan, where the impact of ageing is already large and longevity improvements have plateaued. By 2100, Portugal’s mortality rates would remain slightly above the euro area average for adults (15-64 years old) and the elderly (65 and over).
5. While Portugal has experienced several episodes of negative migration rates, the baseline assumes a gradual normalization over the projection period (Figure 2). In the past, Portugal has experienced three episodes of negative net migration. The largest episode took place from 1955 through the mid-1970s, followed by a smaller episode in the mid-1980s and early 1990s, and finally a recent episode from 2010. This pattern is similar to Spain—and to a lesser extent Italy,
70
75
80
85
90
95
100
105
110
115
120
2015 2025 2035 2045 2055 2065 2075 2085 2095
Portugal Euro area Italy Spain France Germany
10
20
30
40
50
60
70
80
1955 1975 1995 2015 2035 2055 2075 2095Portugal Euro area Italy Spain France Germany

PORTUGAL
INTERNATIONAL MONETARY FUND 7
which has recently benefited from a positive migration rate.4 Recent data indicates a slowdown in net migration outflows in Portugal, as the number of permanent emigrants decreased in 2015, while permanent immigrants increased (INE, 2016). During 2010-2015, Greece, Ireland and Spain suffered also negative net migration flows. In Portugal, recent migration patterns have tracked economic developments (IMF, upcoming), with both a decline in migration inflows over the recent period, and an increase in migration outflows, particularly to other European countries following the economic crisis (INE, 2016b). Going forward, the UN assumption is that net migration inflows to developed countries would remain constant over the period 2015-2050, before steadily declining to half of the 2050 level by 2100.5 As a result, net migration rates would remain negative over the short term in Portugal, before becoming positive from 2025 and settling above most comparators (except Spain) from 2040 onward.
Figure 2. Demographic Trends and Projections
Fertility Rates, 1955-2015 (Children per woman)
Net Migration Rates (Migrants per 1,000 population)
Portugal Crude Mortality Rates
(In percent of population) Euro Area Crude Mortality Rates
(In percent of population)
Source: IMF staff calculations using UN 2015.
4 Baltic countries and Croatia have experienced more sustained negative net migration rates over the last 20 years. 5 The UN projections were established before the recent refugee crisis in Europe and the Middle East.
-20
-15
-10
-5
0
5
10
15
20
1955 1960 1965 1970 1975 1980 1985 1990 1995 2000 2005 2010 2015
Portugal Italy Spain France Germany
1.0
1.5
2.0
2.5
3.0
3.5
1955 1965 1975 1985 1995 2005 2015
Portugal Eurozone Italy Spain France Germany
0
10
20
30
40
50
60
70
80
0
2
4
6
8
10
12
14
1955 1975 1995 2015 2035 2055 2075 2095
0-14 15-64 65+ (right axis) Projections
0
10
20
30
40
50
60
70
80
0
1
2
3
4
5
6
1955 1975 1995 2015 2035 2055 2075 2095
0-14 15-64 65+ (right axis) Projections
PORTUGAL
8 INTERNATIONAL MONETARY FUND
B. Adverse Demographic Changes Will Pose Significant Fiscal Challenges
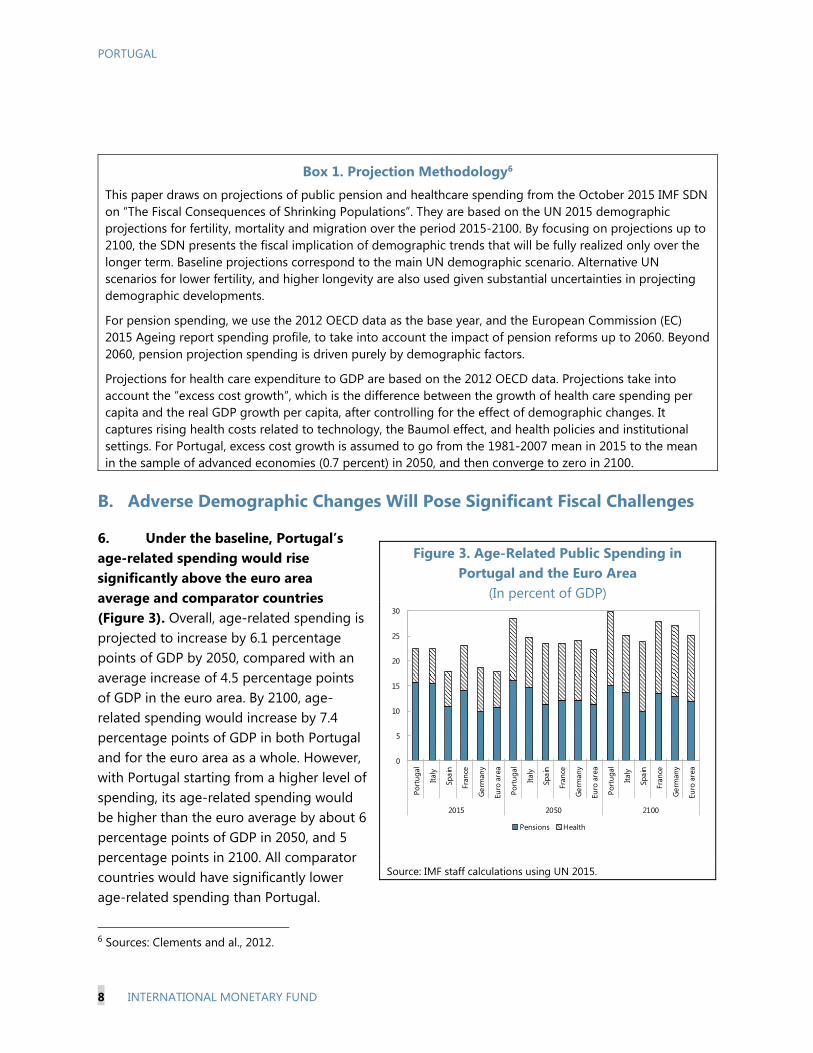
6. Under the baseline, Portugal’s age-related spending would rise significantly above the euro area average and comparator countries (Figure 3). Overall, age-related spending is projected to increase by 6.1 percentage points of GDP by 2050, compared with an average increase of 4.5 percentage points of GDP in the euro area. By 2100, age-related spending would increase by 7.4 percentage points of GDP in both Portugal and for the euro area as a whole. However, with Portugal starting from a higher level of spending, its age-related spending would be higher than the euro average by about 6 percentage points of GDP in 2050, and 5 percentage points in 2100. All comparator countries would have significantly lower age-related spending than Portugal.
6 Sources: Clements and al., 2012.
Box 1. Projection Methodology6 This paper draws on projections of public pension and healthcare spending from the October 2015 IMF SDN on “The Fiscal Consequences of Shrinking Populations”. They are based on the UN 2015 demographic projections for fertility, mortality and migration over the period 2015-2100. By focusing on projections up to 2100, the SDN presents the fiscal implication of demographic trends that will be fully realized only over the longer term. Baseline projections correspond to the main UN demographic scenario. Alternative UN scenarios for lower fertility, and higher longevity are also used given substantial uncertainties in projecting demographic developments.
For pension spending, we use the 2012 OECD data as the base year, and the European Commission (EC) 2015 Ageing report spending profile, to take into account the impact of pension reforms up to 2060. Beyond 2060, pension projection spending is driven purely by demographic factors.
Projections for health care expenditure to GDP are based on the 2012 OECD data. Projections take into account the “excess cost growth”, which is the difference between the growth of health care spending per capita and the real GDP growth per capita, after controlling for the effect of demographic changes. It captures rising health costs related to technology, the Baumol effect, and health policies and institutional settings. For Portugal, excess cost growth is assumed to go from the 1981-2007 mean in 2015 to the mean in the sample of advanced economies (0.7 percent) in 2050, and then converge to zero in 2100.
Figure 3. Age-Related Public Spending in Portugal and the Euro Area
(In percent of GDP)
Source: IMF staff calculations using UN 2015.
0
5
10
15
20
25
30
Port
ugal
Italy
Spai
n
Fran
ce
Ger
man
y
Euro
are
a
Port
ugal
Italy
Spai
n
Fran
ce
Ger
man
y
Euro
are
a
Port
ugal
Italy
Spai
n
Fran
ce
Ger
man
y
Euro
are
a
2015 2050 2100
Pensions Health
PORTUGAL
INTERNATIONAL MONETARY FUND 9
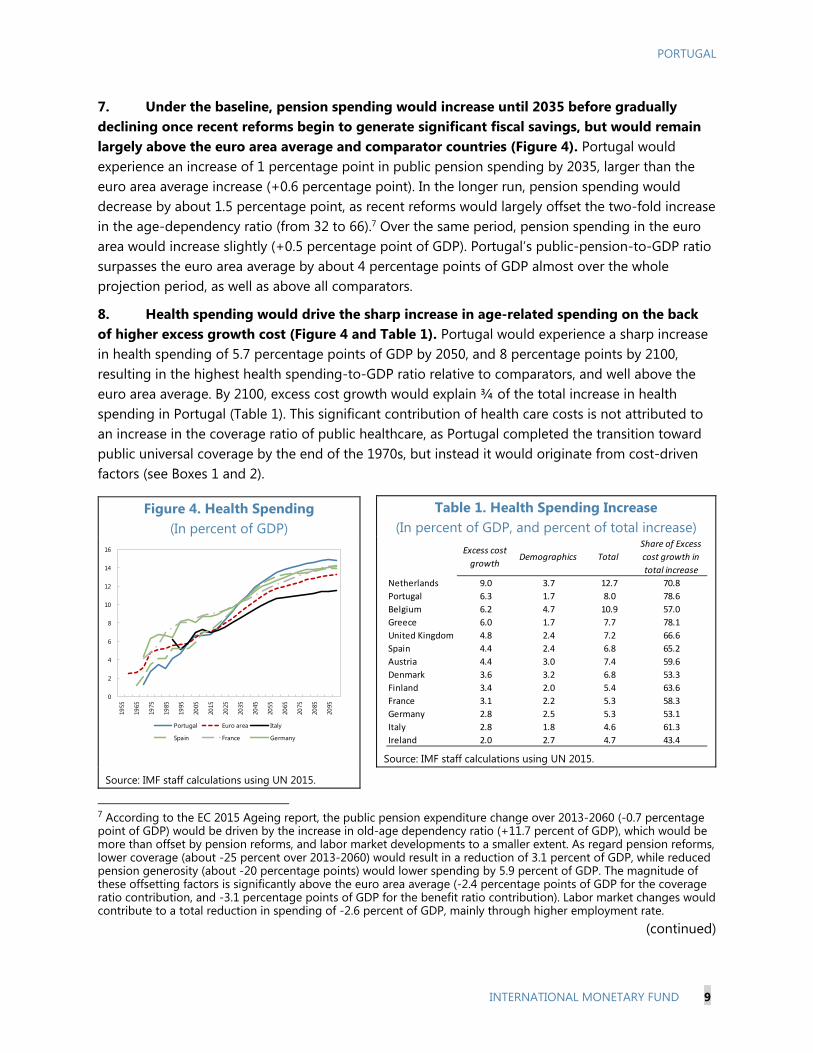
7. Under the baseline, pension spending would increase until 2035 before gradually declining once recent reforms begin to generate significant fiscal savings, but would remain largely above the euro area average and comparator countries (Figure 4). Portugal would experience an increase of 1 percentage point in public pension spending by 2035, larger than the euro area average increase (+0.6 percentage point). In the longer run, pension spending would decrease by about 1.5 percentage point, as recent reforms would largely offset the two-fold increase in the age-dependency ratio (from 32 to 66).7 Over the same period, pension spending in the euro area would increase slightly (+0.5 percentage point of GDP). Portugal’s public-pension-to-GDP ratio surpasses the euro area average by about 4 percentage points of GDP almost over the whole projection period, as well as above all comparators.
8. Health spending would drive the sharp increase in age-related spending on the back of higher excess growth cost (Figure 4 and Table 1). Portugal would experience a sharp increase in health spending of 5.7 percentage points of GDP by 2050, and 8 percentage points by 2100, resulting in the highest health spending-to-GDP ratio relative to comparators, and well above the euro area average. By 2100, excess cost growth would explain ¾ of the total increase in health spending in Portugal (Table 1). This significant contribution of health care costs is not attributed to an increase in the coverage ratio of public healthcare, as Portugal completed the transition toward public universal coverage by the end of the 1970s, but instead it would originate from cost-driven factors (see Boxes 1 and 2).
7 According to the EC 2015 Ageing report, the public pension expenditure change over 2013-2060 (-0.7 percentage point of GDP) would be driven by the increase in old-age dependency ratio (+11.7 percent of GDP), which would be more than offset by pension reforms, and labor market developments to a smaller extent. As regard pension reforms, lower coverage (about -25 percent over 2013-2060) would result in a reduction of 3.1 percent of GDP, while reduced pension generosity (about -20 percentage points) would lower spending by 5.9 percent of GDP. The magnitude of these offsetting factors is significantly above the euro area average (-2.4 percentage points of GDP for the coverage ratio contribution, and -3.1 percentage points of GDP for the benefit ratio contribution). Labor market changes would contribute to a total reduction in spending of -2.6 percent of GDP, mainly through higher employment rate.
(continued)
Figure 4. Health Spending (In percent of GDP)
Source: IMF staff calculations using UN 2015.
Table 1. Health Spending Increase (In percent of GDP, and percent of total increase)
Source: IMF staff calculations using UN 2015.
0
2
4
6
8
10
12
14
16
1955
1965
1975
1985
1995
2005
2015
2025
2035
2045
2055
2065
2075
2085
2095
Portugal Euro area Italy
Spain France Germany
Excess cost
growthDemographics Total
Share of Excess
cost growth in
total increase
Netherlands 9.0 3.7 12.7 70.8
Portugal 6.3 1.7 8.0 78.6
Belgium 6.2 4.7 10.9 57.0
Greece 6.0 1.7 7.7 78.1
United Kingdom 4.8 2.4 7.2 66.6
Spain 4.4 2.4 6.8 65.2
Austria 4.4 3.0 7.4 59.6
Denmark 3.6 3.2 6.8 53.3
Finland 3.4 2.0 5.4 63.6
France 3.1 2.2 5.3 58.3
Germany 2.8 2.5 5.3 53.1
Italy 2.8 1.8 4.6 61.3
Ireland 2.0 2.7 4.7 43.4
PORTUGAL
10 INTERNATIONAL MONETARY FUND
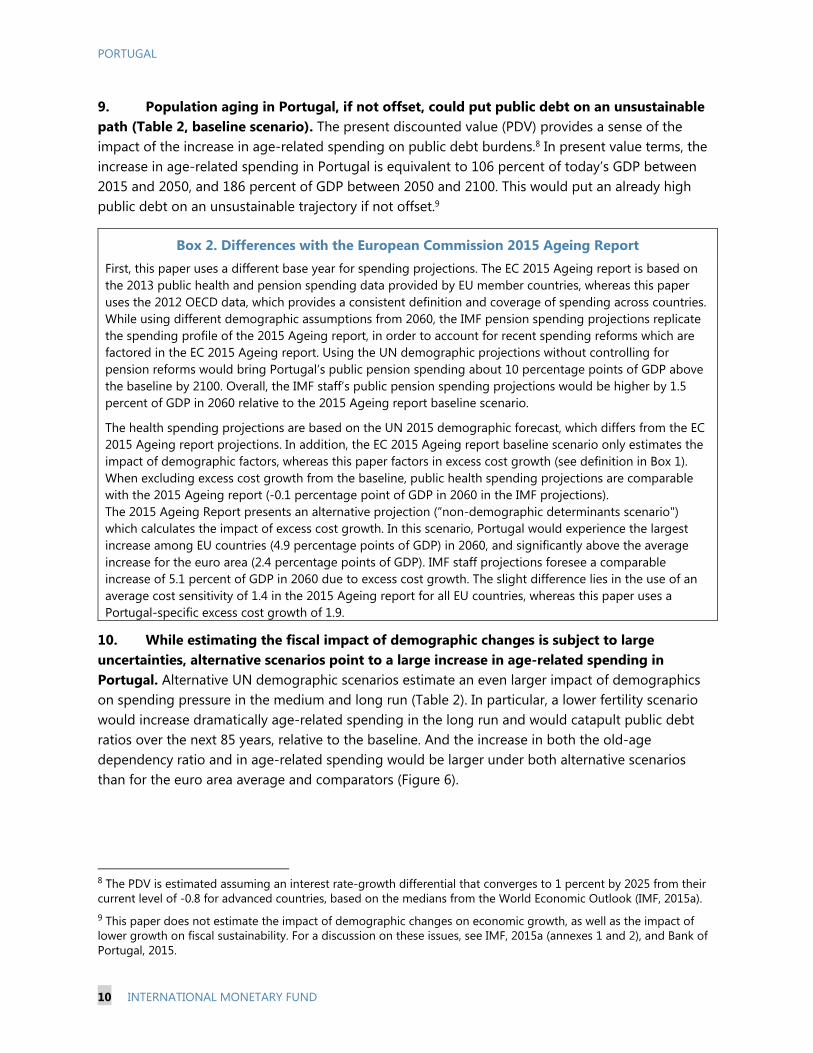
9. Population aging in Portugal, if not offset, could put public debt on an unsustainable path (Table 2, baseline scenario). The present discounted value (PDV) provides a sense of the impact of the increase in age-related spending on public debt burdens.8 In present value terms, the increase in age-related spending in Portugal is equivalent to 106 percent of today’s GDP between 2015 and 2050, and 186 percent of GDP between 2050 and 2100. This would put an already high public debt on an unsustainable trajectory if not offset.9
10. While estimating the fiscal impact of demographic changes is subject to large uncertainties, alternative scenarios point to a large increase in age-related spending in Portugal. Alternative UN demographic scenarios estimate an even larger impact of demographics on spending pressure in the medium and long run (Table 2). In particular, a lower fertility scenario would increase dramatically age-related spending in the long run and would catapult public debt ratios over the next 85 years, relative to the baseline. And the increase in both the old-age dependency ratio and in age-related spending would be larger under both alternative scenarios than for the euro area average and comparators (Figure 6).
8 The PDV is estimated assuming an interest rate-growth differential that converges to 1 percent by 2025 from their current level of -0.8 for advanced countries, based on the medians from the World Economic Outlook (IMF, 2015a). 9 This paper does not estimate the impact of demographic changes on economic growth, as well as the impact of lower growth on fiscal sustainability. For a discussion on these issues, see IMF, 2015a (annexes 1 and 2), and Bank of Portugal, 2015.
Box 2. Differences with the European Commission 2015 Ageing Report First, this paper uses a different base year for spending projections. The EC 2015 Ageing report is based on the 2013 public health and pension spending data provided by EU member countries, whereas this paper uses the 2012 OECD data, which provides a consistent definition and coverage of spending across countries. While using different demographic assumptions from 2060, the IMF pension spending projections replicate the spending profile of the 2015 Ageing report, in order to account for recent spending reforms which are factored in the EC 2015 Ageing report. Using the UN demographic projections without controlling for pension reforms would bring Portugal’s public pension spending about 10 percentage points of GDP above the baseline by 2100. Overall, the IMF staff’s public pension spending projections would be higher by 1.5 percent of GDP in 2060 relative to the 2015 Ageing report baseline scenario.
The health spending projections are based on the UN 2015 demographic forecast, which differs from the EC 2015 Ageing report projections. In addition, the EC 2015 Ageing report baseline scenario only estimates the impact of demographic factors, whereas this paper factors in excess cost growth (see definition in Box 1). When excluding excess cost growth from the baseline, public health spending projections are comparable with the 2015 Ageing report (-0.1 percentage point of GDP in 2060 in the IMF projections). The 2015 Ageing Report presents an alternative projection (“non-demographic determinants scenario") which calculates the impact of excess cost growth. In this scenario, Portugal would experience the largest increase among EU countries (4.9 percentage points of GDP) in 2060, and significantly above the average increase for the euro area (2.4 percentage points of GDP). IMF staff projections foresee a comparable increase of 5.1 percent of GDP in 2060 due to excess cost growth. The slight difference lies in the use of an average cost sensitivity of 1.4 in the 2015 Ageing report for all EU countries, whereas this paper uses a Portugal-specific excess cost growth of 1.9.
PORTUGAL
INTERNATIONAL MONETARY FUND 11
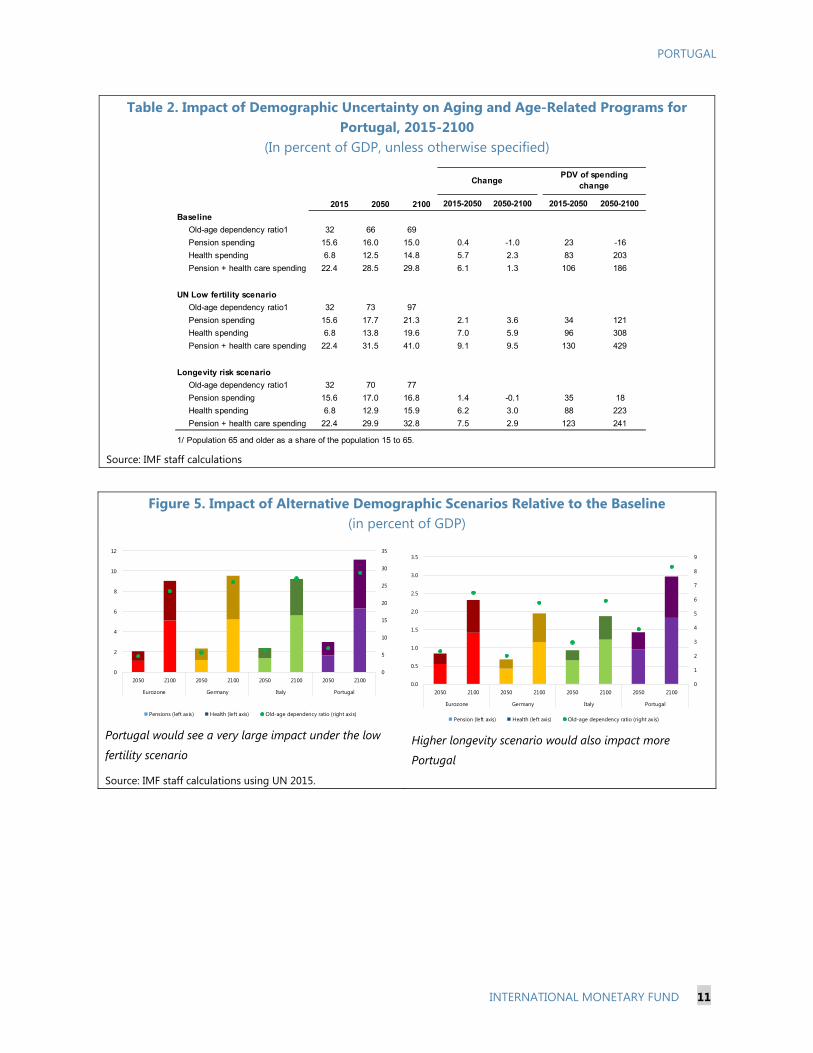
Table 2. Impact of Demographic Uncertainty on Aging and Age-Related Programs for Portugal, 2015-2100
(In percent of GDP, unless otherwise specified)
Source: IMF staff calculations
Figure 5. Impact of Alternative Demographic Scenarios Relative to the Baseline (in percent of GDP)
Portugal would see a very large impact under the low
fertility scenario Higher longevity scenario would also impact more
Portugal
Source: IMF staff calculations using UN 2015.
2015 2050 2100 2015-2050 2050-2100 2015-2050 2050-2100
Baseline
Old-age dependency ratio1 32 66 69
Pension spending 15.6 16.0 15.0 0.4 -1.0 23 -16
Health spending 6.8 12.5 14.8 5.7 2.3 83 203
Pension + health care spending 22.4 28.5 29.8 6.1 1.3 106 186
UN Low fertility scenario
Old-age dependency ratio1 32 73 97
Pension spending 15.6 17.7 21.3 2.1 3.6 34 121
Health spending 6.8 13.8 19.6 7.0 5.9 96 308
Pension + health care spending 22.4 31.5 41.0 9.1 9.5 130 429
Longevity risk scenario
Old-age dependency ratio1 32 70 77
Pension spending 15.6 17.0 16.8 1.4 -0.1 35 18
Health spending 6.8 12.9 15.9 6.2 3.0 88 223
Pension + health care spending 22.4 29.9 32.8 7.5 2.9 123 241
1/ Population 65 and older as a share of the population 15 to 65.
ChangePDV of spending
change
0
5
10
15
20
25
30
35
0
2
4
6
8
10
12
2050 2100 2050 2100 2050 2100 2050 2100
Eurozone Germany Italy Portugal
Pensions (left axis) Health (left axis) Old-age dependency ratio (right axis)
0
1
2
3
4
5
6
7
8
9
0.0
0.5
1.0
1.5
2.0
2.5
3.0
3.5
2050 2100 2050 2100 2050 2100 2050 2100
Eurozone Germany Italy Portugal
Pension (left axis) Health (left axis) Old-age dependency ratio (right axis)
PORTUGAL
12 INTERNATIONAL MONETARY FUND
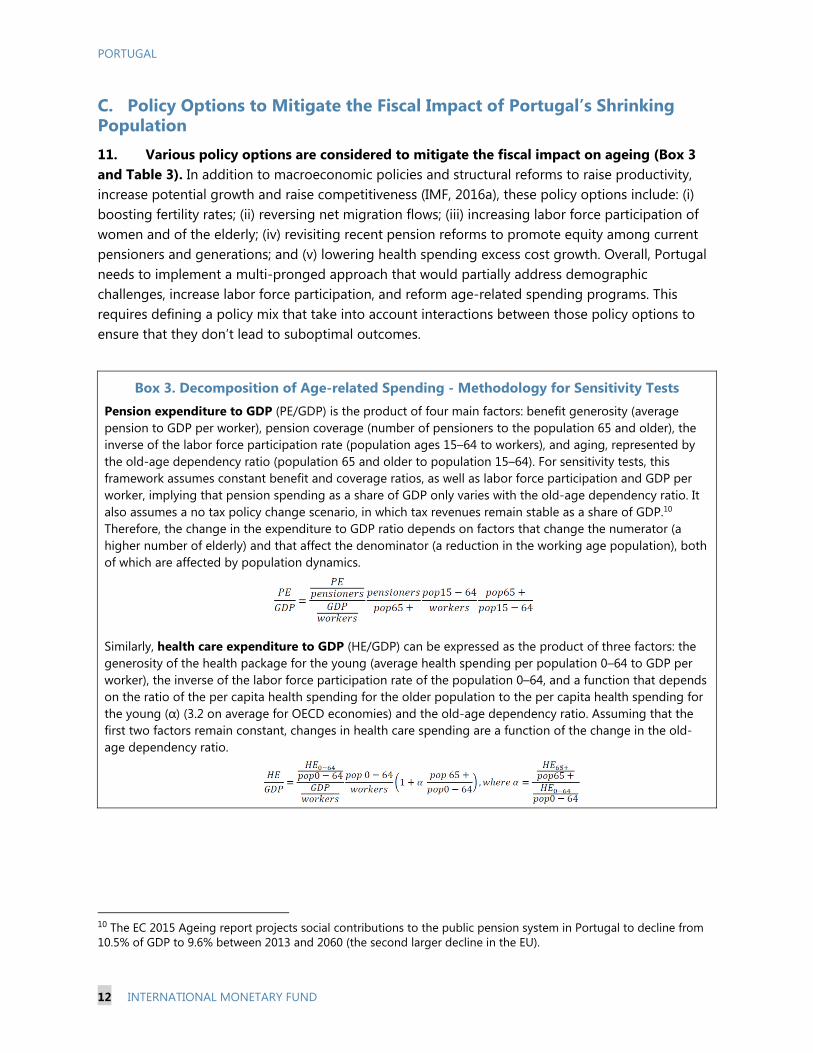
C. Policy Options to Mitigate the Fiscal Impact of Portugal’s Shrinking Population 11. Various policy options are considered to mitigate the fiscal impact on ageing (Box 3 and Table 3). In addition to macroeconomic policies and structural reforms to raise productivity, increase potential growth and raise competitiveness (IMF, 2016a), these policy options include: (i) boosting fertility rates; (ii) reversing net migration flows; (iii) increasing labor force participation of women and of the elderly; (iv) revisiting recent pension reforms to promote equity among current pensioners and generations; and (v) lowering health spending excess cost growth. Overall, Portugal needs to implement a multi-pronged approach that would partially address demographic challenges, increase labor force participation, and reform age-related spending programs. This requires defining a policy mix that take into account interactions between those policy options to ensure that they don’t lead to suboptimal outcomes.
Box 3. Decomposition of Age-related Spending - Methodology for Sensitivity Tests Pension expenditure to GDP (PE/GDP) is the product of four main factors: benefit generosity (average pension to GDP per worker), pension coverage (number of pensioners to the population 65 and older), the inverse of the labor force participation rate (population ages 15–64 to workers), and aging, represented by the old-age dependency ratio (population 65 and older to population 15–64). For sensitivity tests, this framework assumes constant benefit and coverage ratios, as well as labor force participation and GDP per worker, implying that pension spending as a share of GDP only varies with the old-age dependency ratio. It also assumes a no tax policy change scenario, in which tax revenues remain stable as a share of GDP.10 Therefore, the change in the expenditure to GDP ratio depends on factors that change the numerator (a higher number of elderly) and that affect the denominator (a reduction in the working age population), both of which are affected by population dynamics.
Similarly, health care expenditure to GDP (HE/GDP) can be expressed as the product of three factors: the generosity of the health package for the young (average health spending per population 0–64 to GDP per worker), the inverse of the labor force participation rate of the population 0–64, and a function that depends on the ratio of the per capita health spending for the older population to the per capita health spending for the young (α) (3.2 on average for OECD economies) and the old-age dependency ratio. Assuming that the first two factors remain constant, changes in health care spending are a function of the change in the old-age dependency ratio.
10 The EC 2015 Ageing report projects social contributions to the public pension system in Portugal to decline from 10.5% of GDP to 9.6% between 2013 and 2060 (the second larger decline in the EU).
PORTUGAL
INTERNATIONAL MONETARY FUND 13
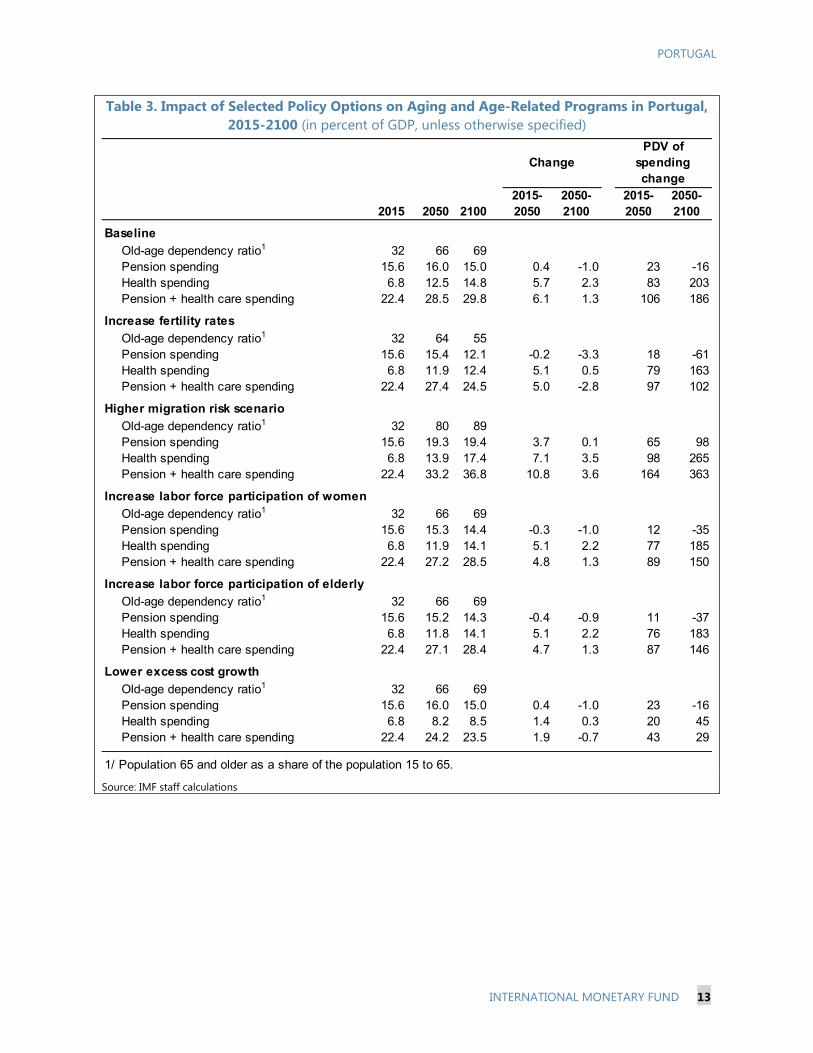
Table 3. Impact of Selected Policy Options on Aging and Age-Related Programs in Portugal, 2015-2100 (in percent of GDP, unless otherwise specified)
Source: IMF staff calculations
2015 2050 21002015-2050
2050-2100
2015-2050
2050-2100
Baseline
Old-age dependency ratio1 32 66 69Pension spending 15.6 16.0 15.0 0.4 -1.0 23 -16Health spending 6.8 12.5 14.8 5.7 2.3 83 203Pension + health care spending 22.4 28.5 29.8 6.1 1.3 106 186
Increase fertility rates
Old-age dependency ratio1 32 64 55Pension spending 15.6 15.4 12.1 -0.2 -3.3 18 -61Health spending 6.8 11.9 12.4 5.1 0.5 79 163Pension + health care spending 22.4 27.4 24.5 5.0 -2.8 97 102
Higher migration risk scenario
Old-age dependency ratio1 32 80 89Pension spending 15.6 19.3 19.4 3.7 0.1 65 98Health spending 6.8 13.9 17.4 7.1 3.5 98 265Pension + health care spending 22.4 33.2 36.8 10.8 3.6 164 363
Increase labor force participation of women
Old-age dependency ratio1 32 66 69Pension spending 15.6 15.3 14.4 -0.3 -1.0 12 -35Health spending 6.8 11.9 14.1 5.1 2.2 77 185Pension + health care spending 22.4 27.2 28.5 4.8 1.3 89 150
Increase labor force participation of elderly
Old-age dependency ratio1 32 66 69Pension spending 15.6 15.2 14.3 -0.4 -0.9 11 -37Health spending 6.8 11.8 14.1 5.1 2.2 76 183Pension + health care spending 22.4 27.1 28.4 4.7 1.3 87 146
Lower excess cost growth
Old-age dependency ratio1 32 66 69Pension spending 15.6 16.0 15.0 0.4 -1.0 23 -16Health spending 6.8 8.2 8.5 1.4 0.3 20 45Pension + health care spending 22.4 24.2 23.5 1.9 -0.7 43 29
1/ Population 65 and older as a share of the population 15 to 65.
ChangePDV of
spending change
PORTUGAL
14 INTERNATIONAL MONETARY FUND
Policies that Affect Demographics
Boosting Fertility Rates
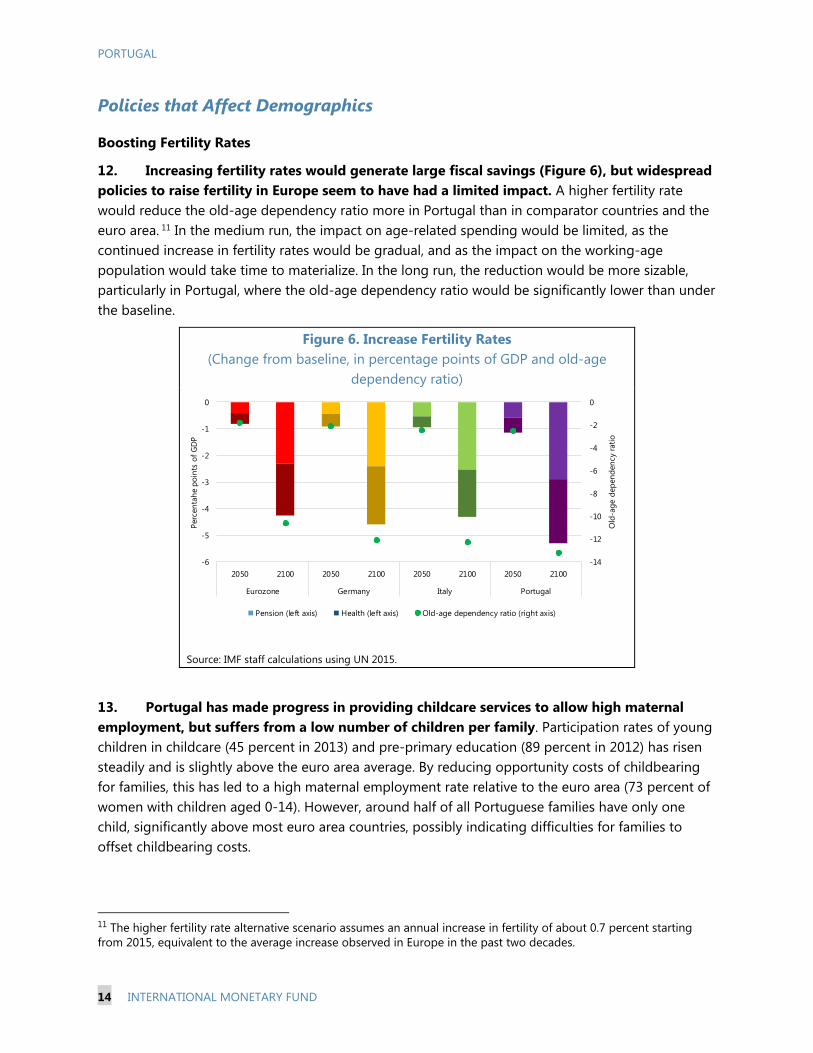
12. Increasing fertility rates would generate large fiscal savings (Figure 6), but widespread policies to raise fertility in Europe seem to have had a limited impact. A higher fertility rate would reduce the old-age dependency ratio more in Portugal than in comparator countries and the euro area. 11 In the medium run, the impact on age-related spending would be limited, as the continued increase in fertility rates would be gradual, and as the impact on the working-age population would take time to materialize. In the long run, the reduction would be more sizable, particularly in Portugal, where the old-age dependency ratio would be significantly lower than under the baseline.
Figure 6. Increase Fertility Rates (Change from baseline, in percentage points of GDP and old-age
dependency ratio)
Source: IMF staff calculations using UN 2015.
13. Portugal has made progress in providing childcare services to allow high maternal employment, but suffers from a low number of children per family. Participation rates of young children in childcare (45 percent in 2013) and pre-primary education (89 percent in 2012) has risen steadily and is slightly above the euro area average. By reducing opportunity costs of childbearing for families, this has led to a high maternal employment rate relative to the euro area (73 percent of women with children aged 0-14). However, around half of all Portuguese families have only one child, significantly above most euro area countries, possibly indicating difficulties for families to offset childbearing costs.
11 The higher fertility rate alternative scenario assumes an annual increase in fertility of about 0.7 percent starting from 2015, equivalent to the average increase observed in Europe in the past two decades.
-14
-12
-10
-8
-6
-4
-2
0
-6
-5
-4
-3
-2
-1
0
2050 2100 2050 2100 2050 2100 2050 2100
Eurozone Germany Italy Portugal
Old
-age
dep
ende
ncy
ratio
Perc
enta
he p
oint
s of
GD
P
Pension (left axis) Health (left axis) Old-age dependency ratio (right axis)
PORTUGAL
INTERNATIONAL MONETARY FUND 15
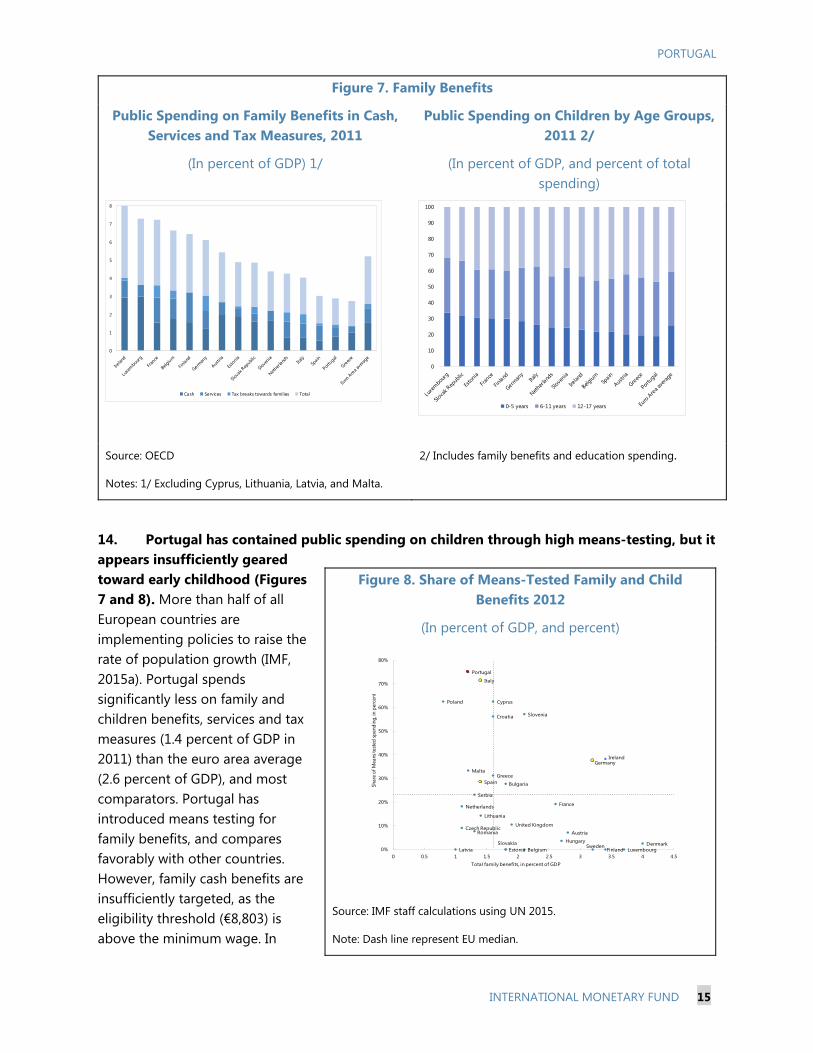
14. Portugal has contained public spending on children through high means-testing, but it appears insufficiently geared toward early childhood (Figures 7 and 8). More than half of all European countries are implementing policies to raise the rate of population growth (IMF, 2015a). Portugal spends significantly less on family and children benefits, services and tax measures (1.4 percent of GDP in 2011) than the euro area average (2.6 percent of GDP), and most comparators. Portugal has introduced means testing for family benefits, and compares favorably with other countries. However, family cash benefits are insufficiently targeted, as the eligibility threshold (€8,803) is above the minimum wage. In
Figure 7. Family Benefits
Public Spending on Family Benefits in Cash, Services and Tax Measures, 2011
(In percent of GDP) 1/
Public Spending on Children by Age Groups, 2011 2/
(In percent of GDP, and percent of total spending)
Source: OECD
Notes: 1/ Excluding Cyprus, Lithuania, Latvia, and Malta.
2/ Includes family benefits and education spending.
Figure 8. Share of Means-Tested Family and Child Benefits 2012
(In percent of GDP, and percent)
Source: IMF staff calculations using UN 2015.
Note: Dash line represent EU median.
0
1
2
3
4
5
6
7
8
Cash Services Tax breaks towards families Total
0
10
20
30
40
50
60
70
80
90
100
0-5 years 6-11 years 12-17 years
Denmark
FranceNetherlands
SwedenFinland
Austria
Germany
Italy
Belgium
Ireland
Greece
United Kingdom
Portugal
Spain
Luxembourg
Cyprus
Malta
Serbia
Lithuania
Bulgaria
Czech Republic
Estonia
Croatia
Latvia
Slovenia
Slovakia Hungary
Poland
Romania
0%
10%
20%
30%
40%
50%
60%
70%
80%
0 0.5 1 1.5 2 2.5 3 3.5 4 4.5
Shar
e of
Mea
ns te
sted
spen
ding
, in p
erce
nt
Total family benefits, in percent of GDP
PORTUGAL
16 INTERNATIONAL MONETARY FUND
addition, the share of social spending for 0-5 year-old children (including family benefits and education spending) is the smallest in Europe, pointing to the need to reallocate benefits toward families with young children, by increasing the efficiency of public education spending.
15. Rather than increasing cash benefits which have limited impact in improving fertility, Portugal could further improve childcare services. In 2016, Portugal increased the progressivity of family support, through a progressive increase in family allowances, a personal income tax reform to replace the family quotient by a lump-sum deduction, and a reversal to the 2012 scale of the guaranteed minimum income benefit to better take into account children, to offset the impact of recent measures on poverty (OECD, 2015). 12 While these measures are geared toward reducing inequality and poverty for families, they may have a limited impact on fertility, as evidenced by empirical studies on family cash benefits (IMF, 2013a). Financial measures that attempt to encourage parents to have more children have individually little or no impact, and may only induce parents that were in any case going to have a child to have a child earlier. Therefore, if Portugal wants to engage in policies to raise fertility, it would need to look at measures other than cash benefits to families, particularly childcare services for low income families. Key bottlenecks are capacity constraints in subsidized childcare, and insufficient access for low income families to affordable childcare services, as evidenced by the highest enrollment gap (around 40 percent) between high- and low-income families among OECD countries (OECD, 2011). Reversing Net Migration Outflows
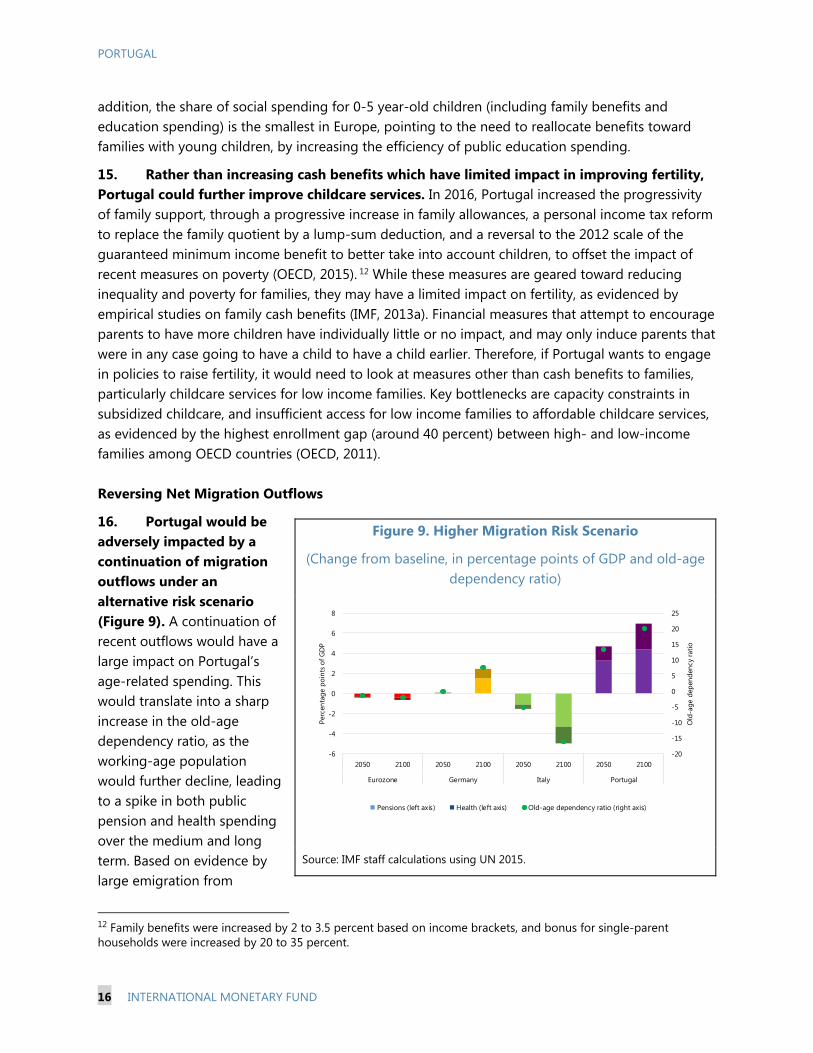
16. Portugal would be adversely impacted by a continuation of migration outflows under an alternative risk scenario (Figure 9). A continuation of recent outflows would have a large impact on Portugal’s age-related spending. This would translate into a sharp increase in the old-age dependency ratio, as the working-age population would further decline, leading to a spike in both public pension and health spending over the medium and long term. Based on evidence by large emigration from
12 Family benefits were increased by 2 to 3.5 percent based on income brackets, and bonus for single-parent households were increased by 20 to 35 percent.
Figure 9. Higher Migration Risk Scenario
(Change from baseline, in percentage points of GDP and old-age dependency ratio)
Source: IMF staff calculations using UN 2015.
-20
-15
-10
-5
0
5
10
15
20
25
-6
-4
-2
0
2
4
6
8
2050 2100 2050 2100 2050 2100 2050 2100
Eurozone Germany Italy Portugal
Old
-age
dep
ende
ncy
ratio
Perc
enta
ge p
oint
s of
GD
P
Pensions (left axis) Health (left axis) Old-age dependency ratio (right axis)
PORTUGAL
INTERNATIONAL MONETARY FUND 17
Central, Eastern and Southeastern Europe, a sustained period of large migration outflows could also lower growth potential in Portugal, by reducing the size of the labor force and productivity, and would also worsen competitiveness (IMF, upcoming).
17. Portugal has implemented policies to attract highly-skilled professionals, EU retirees and non-EU foreign investors. First, a golden visa scheme was put in place from 2012 for non-EU private investors, which however has generated only limited inflows thus far, with about 2,788 residency permits granted by end-2015 (SEF, 2014). A specific tax regime for non-habitual resident was also established for highly-skilled foreigners (such as doctors, senior managers, and auditors), and foreign pensioners that would settle in Portugal. While attracting more retirees from the rest of EU will not improve demographic prospects of the country, it may however have a positive indirect impact on the economy. About 5,600 foreigners had benefited from this tax regime at end-2014.
18. First and foremost, increasing potential growth and employment prospects would help reversing migration outflows. Two recent studies suggest that intra-EU migration in response to different degrees of labor market slack across member countries has increased (Goodhart and Lee (2013), and Beyer and Smets (2014)). Portugal still suffers from significant labor slack, with a sharp increase in the share of workers that are neither employed, fully employed nor fully disinclined to work, particularly among lower skilled workers. Migrant workers abroad, and particularly those intending to migrate out only temporarily, form a pool of workers that is connected to the domestic labor market by a two-way safety valve. To reverse past trends, it would be critical to reduce the labor slack through structural reforms to boost competitiveness, a prudent minimum wage policy to absorb lower-skilled workers, and a more inclusive and transparent social dialogue (IMF, 2016a).
19. In addition, more could be done to increase migration inflows of Portuguese workers and other migrants to improve demographic and growth prospects. Policy responses should first incentivize workers to stay, primarily by fostering a more favorable macroeconomic environment to boost employment. Engaging with the Portuguese diaspora abroad and removing barriers to reintegration in the workforce would facilitate return migration (IMF, upcoming). In addition, Portugal may try to attract more working-age migrants to increase the size of its labor force. While increasing migration inflows would be beneficial for Portugal’s demographic developments, the medium-term impact of a larger inflows on output would depend on its capacity to successfully integrate them into the labor force (IMF, 2016a). This would require implementing policies that facilitate labor market integration of migrants, such as introductory programs to support migrants in getting jobs, preventing a further increase in the minimum wage to reduce barriers for low-skilled workers, or active labor market policies to support private sector employers in the hiring migrants (IMF, 2016b).
Policies that Affect Labor Markets 20. Improving labor force participation of women and the elderly would contribute more modestly to offsetting age-related spending pressures (Figures 10 and 11). Increasing labor force participation would increase GDP by raising the number of workers, assuming that productivity remains constant. Higher labor force participation of women and the elderly would however generate limited savings in the long run, relative to an increase in fertility, or an improvement in net
PORTUGAL
18 INTERNATIONAL MONETARY FUND
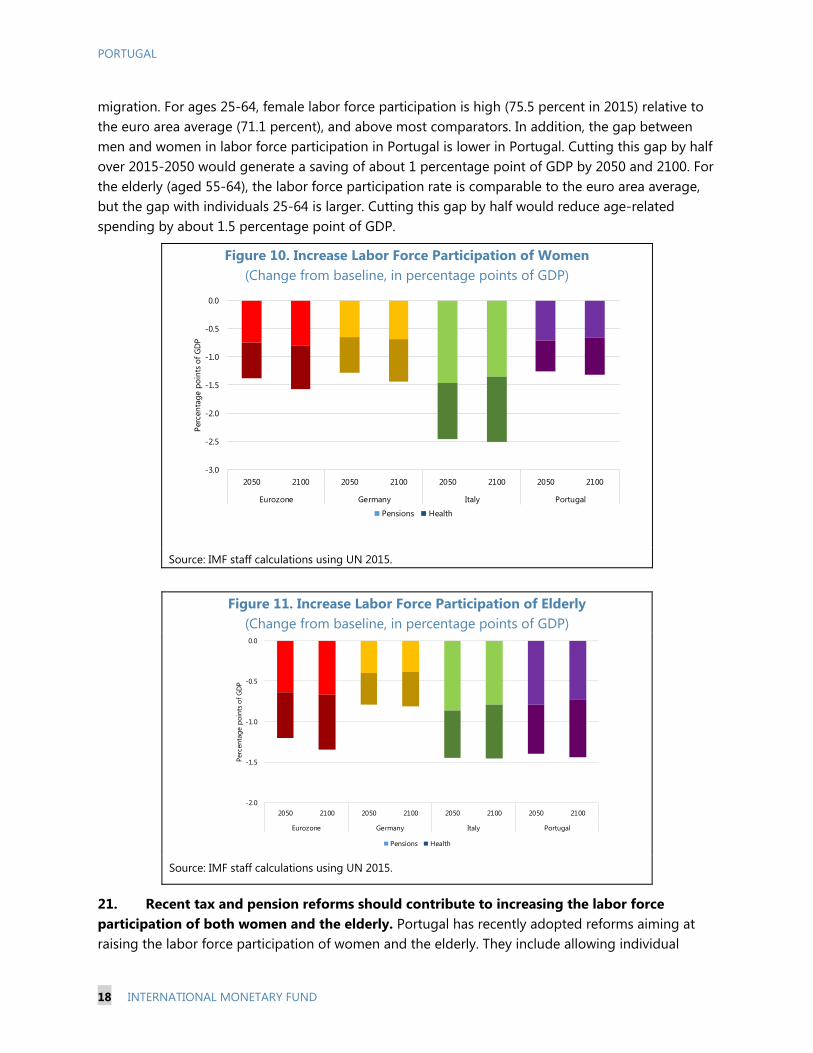
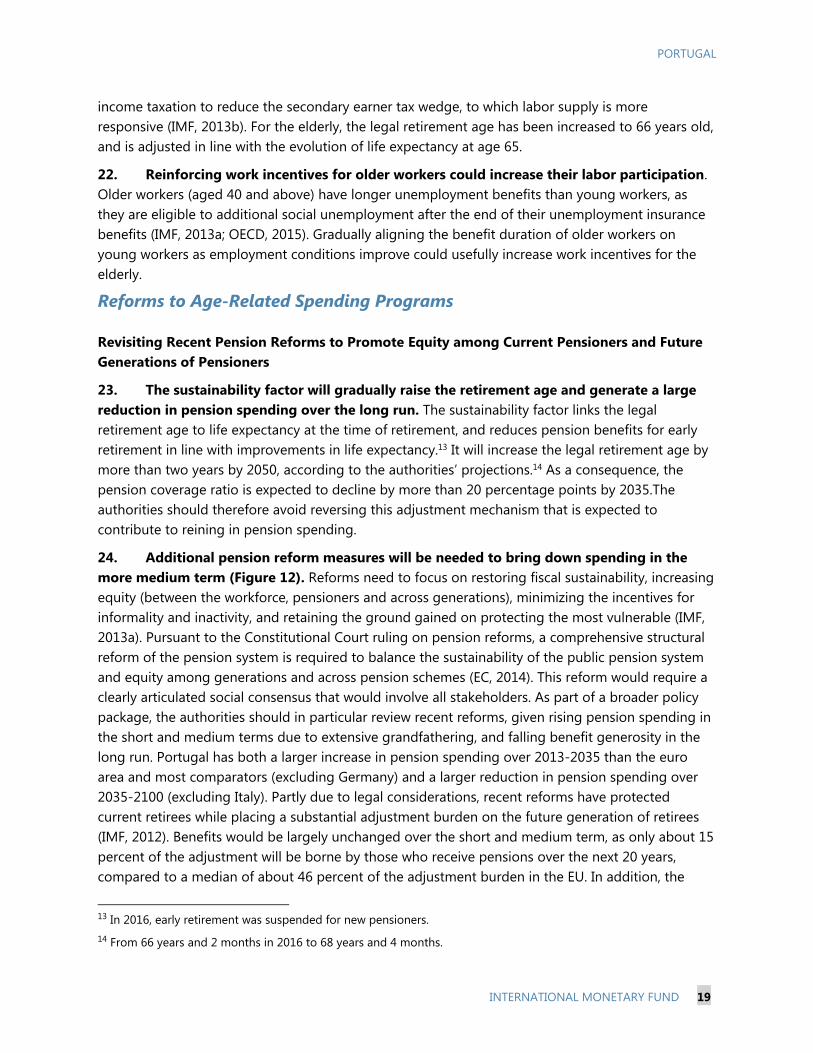
migration. For ages 25-64, female labor force participation is high (75.5 percent in 2015) relative to the euro area average (71.1 percent), and above most comparators. In addition, the gap between men and women in labor force participation in Portugal is lower in Portugal. Cutting this gap by half over 2015-2050 would generate a saving of about 1 percentage point of GDP by 2050 and 2100. For the elderly (aged 55-64), the labor force participation rate is comparable to the euro area average, but the gap with individuals 25-64 is larger. Cutting this gap by half would reduce age-related spending by about 1.5 percentage point of GDP.
Figure 10. Increase Labor Force Participation of Women (Change from baseline, in percentage points of GDP)
Source: IMF staff calculations using UN 2015.
21. Recent tax and pension reforms should contribute to increasing the labor force participation of both women and the elderly. Portugal has recently adopted reforms aiming at raising the labor force participation of women and the elderly. They include allowing individual
Figure 11. Increase Labor Force Participation of Elderly (Change from baseline, in percentage points of GDP)
Source: IMF staff calculations using UN 2015.
-3.0
-2.5
-2.0
-1.5
-1.0
-0.5
0.0
2050 2100 2050 2100 2050 2100 2050 2100
Eurozone Germany Italy Portugal
Perc
enta
ge p
oint
s of
GD
P
Pensions Health
-2.0
-1.5
-1.0
-0.5
0.0
2050 2100 2050 2100 2050 2100 2050 2100
Eurozone Germany Italy Portugal
Perc
enta
ge p
oint
s of
GD
P
Pensions Health
PORTUGAL
INTERNATIONAL MONETARY FUND 19
income taxation to reduce the secondary earner tax wedge, to which labor supply is more responsive (IMF, 2013b). For the elderly, the legal retirement age has been increased to 66 years old, and is adjusted in line with the evolution of life expectancy at age 65.
22. Reinforcing work incentives for older workers could increase their labor participation. Older workers (aged 40 and above) have longer unemployment benefits than young workers, as they are eligible to additional social unemployment after the end of their unemployment insurance benefits (IMF, 2013a; OECD, 2015). Gradually aligning the benefit duration of older workers on young workers as employment conditions improve could usefully increase work incentives for the elderly.
Reforms to Age-Related Spending Programs Revisiting Recent Pension Reforms to Promote Equity among Current Pensioners and Future Generations of Pensioners 23. The sustainability factor will gradually raise the retirement age and generate a large reduction in pension spending over the long run. The sustainability factor links the legal retirement age to life expectancy at the time of retirement, and reduces pension benefits for early retirement in line with improvements in life expectancy.13 It will increase the legal retirement age by more than two years by 2050, according to the authorities’ projections.14 As a consequence, the pension coverage ratio is expected to decline by more than 20 percentage points by 2035.The authorities should therefore avoid reversing this adjustment mechanism that is expected to contribute to reining in pension spending.
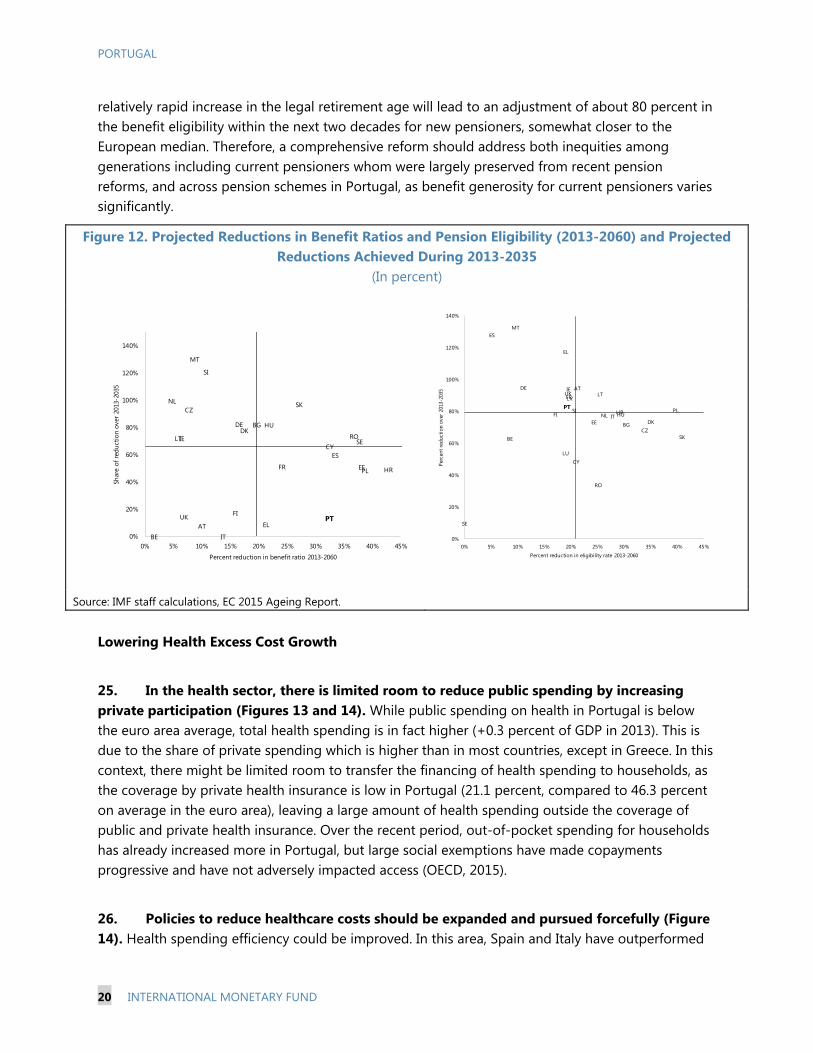
24. Additional pension reform measures will be needed to bring down spending in the more medium term (Figure 12). Reforms need to focus on restoring fiscal sustainability, increasing equity (between the workforce, pensioners and across generations), minimizing the incentives for informality and inactivity, and retaining the ground gained on protecting the most vulnerable (IMF, 2013a). Pursuant to the Constitutional Court ruling on pension reforms, a comprehensive structural reform of the pension system is required to balance the sustainability of the public pension system and equity among generations and across pension schemes (EC, 2014). This reform would require a clearly articulated social consensus that would involve all stakeholders. As part of a broader policy package, the authorities should in particular review recent reforms, given rising pension spending in the short and medium terms due to extensive grandfathering, and falling benefit generosity in the long run. Portugal has both a larger increase in pension spending over 2013-2035 than the euro area and most comparators (excluding Germany) and a larger reduction in pension spending over 2035-2100 (excluding Italy). Partly due to legal considerations, recent reforms have protected current retirees while placing a substantial adjustment burden on the future generation of retirees (IMF, 2012). Benefits would be largely unchanged over the short and medium term, as only about 15 percent of the adjustment will be borne by those who receive pensions over the next 20 years, compared to a median of about 46 percent of the adjustment burden in the EU. In addition, the
13 In 2016, early retirement was suspended for new pensioners. 14 From 66 years and 2 months in 2016 to 68 years and 4 months.
PORTUGAL
20 INTERNATIONAL MONETARY FUND
relatively rapid increase in the legal retirement age will lead to an adjustment of about 80 percent in the benefit eligibility within the next two decades for new pensioners, somewhat closer to the European median. Therefore, a comprehensive reform should address both inequities among generations including current pensioners whom were largely preserved from recent pension reforms, and across pension schemes in Portugal, as benefit generosity for current pensioners varies significantly.
Figure 12. Projected Reductions in Benefit Ratios and Pension Eligibility (2013-2060) and Projected Reductions Achieved During 2013-2035
(In percent)
Source: IMF staff calculations, EC 2015 Ageing Report. Lowering Health Excess Cost Growth
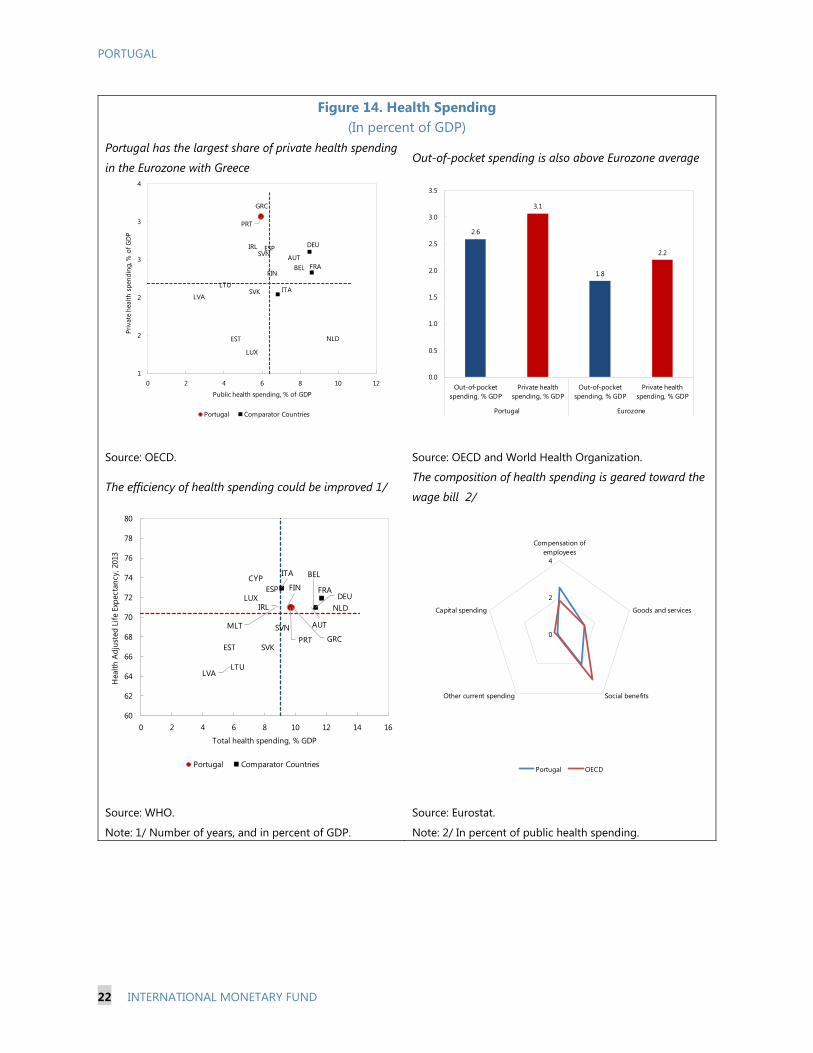
25. In the health sector, there is limited room to reduce public spending by increasing private participation (Figures 13 and 14). While public spending on health in Portugal is below the euro area average, total health spending is in fact higher (+0.3 percent of GDP in 2013). This is due to the share of private spending which is higher than in most countries, except in Greece. In this context, there might be limited room to transfer the financing of health spending to households, as the coverage by private health insurance is low in Portugal (21.1 percent, compared to 46.3 percent on average in the euro area), leaving a large amount of health spending outside the coverage of public and private health insurance. Over the recent period, out-of-pocket spending for households has already increased more in Portugal, but large social exemptions have made copayments progressive and have not adversely impacted access (OECD, 2015).
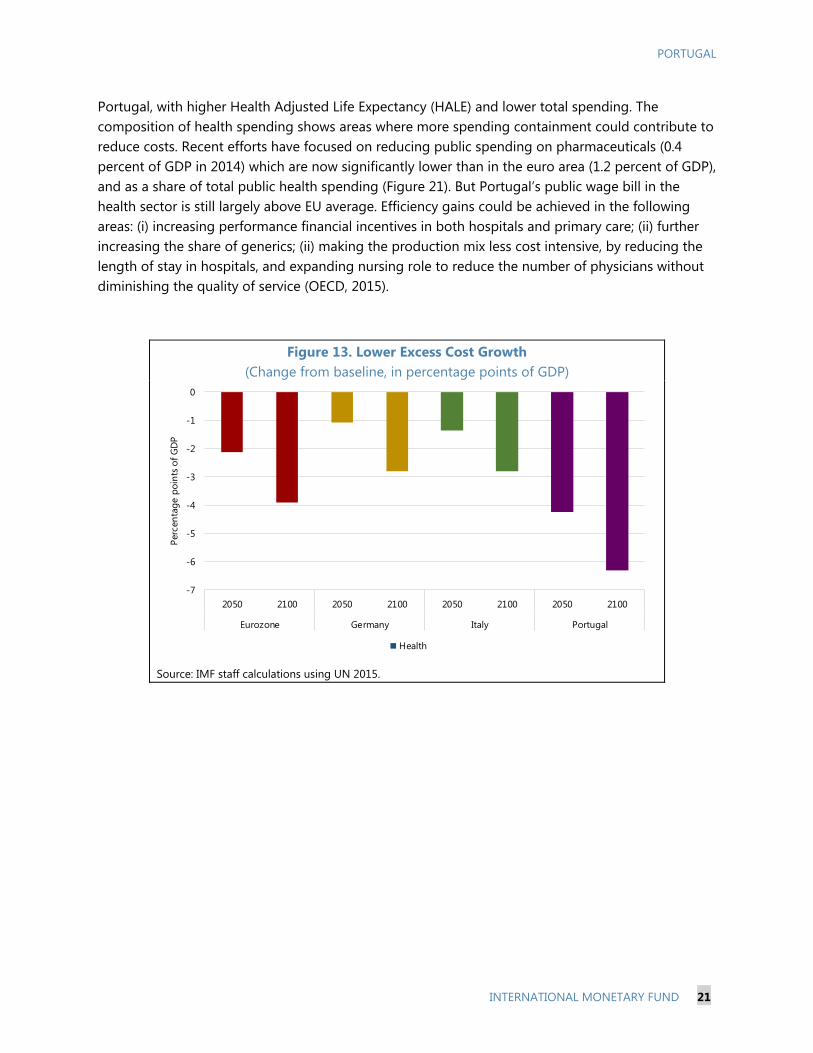
26. Policies to reduce healthcare costs should be expanded and pursued forcefully (Figure 14). Health spending efficiency could be improved. In this area, Spain and Italy have outperformed
BE
BG
CZ
DKDE
EE
IE
EL
ES
FR HR
IT
CYLT
HU
MT
NL
AT
PL
PT
RO
SI
SK
FI
SE
UK
0%
20%
40%
60%
80%
100%
120%
140%
0% 5% 10% 15% 20% 25% 30% 35% 40% 45%
Shar
e of
redu
ctio
n ov
er 2
013-
2035
Percent reduction in benefit ratio 2013-2060
BE
BGCZ
DK
DE
EE
IE
EL
ES
FR
HRIT
CY
LVLT
LU
HU
MT
NL
AT
PLPT
RO
SI
SK
FI
SE
UK
0%
20%
40%
60%
80%
100%
120%
140%
0% 5% 10% 15% 20% 25% 30% 35% 40% 45%
Perc
ent r
educ
tion
over
201
3-20
35
Percent reduction in eligibility rate 2013-2060
PORTUGAL
INTERNATIONAL MONETARY FUND 21
Portugal, with higher Health Adjusted Life Expectancy (HALE) and lower total spending. The composition of health spending shows areas where more spending containment could contribute to reduce costs. Recent efforts have focused on reducing public spending on pharmaceuticals (0.4 percent of GDP in 2014) which are now significantly lower than in the euro area (1.2 percent of GDP), and as a share of total public health spending (Figure 21). But Portugal’s public wage bill in the health sector is still largely above EU average. Efficiency gains could be achieved in the following areas: (i) increasing performance financial incentives in both hospitals and primary care; (ii) further increasing the share of generics; (ii) making the production mix less cost intensive, by reducing the length of stay in hospitals, and expanding nursing role to reduce the number of physicians without diminishing the quality of service (OECD, 2015).
Figure 13. Lower Excess Cost Growth (Change from baseline, in percentage points of GDP)
Source: IMF staff calculations using UN 2015.
-7
-6
-5
-4
-3
-2
-1
0
2050 2100 2050 2100 2050 2100 2050 2100
Eurozone Germany Italy Portugal
Perc
enta
ge p
oint
s of
GD
P
Health
PORTUGAL
22 INTERNATIONAL MONETARY FUND
Figure 14. Health Spending (In percent of GDP)
Portugal has the largest share of private health spending
in the Eurozone with Greece Out-of-pocket spending is also above Eurozone average
Source: OECD. Source: OECD and World Health Organization.
The efficiency of health spending could be improved 1/ The composition of health spending is geared toward the
wage bill 2/
Source: WHO.
Note: 1/ Number of years, and in percent of GDP. Source: Eurostat.
Note: 2/ In percent of public health spending.
AUTBEL
EST
FINFRA
DEU
GRC
IRL
ITALVA
LTU
LUX
NLD
PRT
SVK
SVNESP
1
2
2
3
3
4
0 2 4 6 8 10 12
Priv
ate
heal
th s
pend
ing,
% o
f GD
P
Public health spending, % of GDP
Portugal Comparator Countries
2.6
1.8
3.1
2.2
0.0
0.5
1.0
1.5
2.0
2.5
3.0
3.5
Out-of-pocketspending, % GDP
Private healthspending, % GDP
Out-of-pocketspending, % GDP
Private healthspending, % GDP
Portugal Eurozone
0
2
4
Compensation ofemployees
Goods and services
Social benefitsOther current spending
Capital spending
Portugal OECD
AUT
BELCYP
EST
FIN FRADEU
GRC
IRL
ITA
LVALTU
LUX
MLT
NLD
PRTSVK
SVN
ESP
60
62
64
66
68
70
72
74
76
78
80
0 2 4 6 8 10 12 14 16
Hea
lth A
djus
ted
Life
Exp
ecta
ncy,
201
3
Total health spending, % GDP
Portugal Comparator Countries
PORTUGAL
INTERNATIONAL MONETARY FUND 23
D. Conclusions
27. The projected decline in Portugal’s population poses a serious threat to its public finances. Under the baseline, age-related public spending would increase by more than 7 percentage points of GDP, and public debt would become unsustainable. This would be driven by health spending, as population ageing and technological improvements are projected to increase faster than economic growth. Pension spending will also further rise in the short term, as recent reforms have protected current retirees, while postponing the sharp adjustment on future generations of pensioners.
28. Addressing this massive fiscal challenge will require policies to raise growth potential, improve demographics and labor markets, and reform entitlements. While their respective contribution will ultimately depend on social preferences, a comprehensive mitigation strategy will be needed to safeguard social cohesion and ensure fiscal sustainability. First and foremost, macroeconomic policies should aim at generating sustainable growth and improving competitiveness. Offsetting rising fiscal costs will also require either reining in pension and health spending, rationalizing other expenditure or increasing tax revenue, or a combination of these three policy options.
29. Policy action is needed in the short term as Portugal already experiences adverse demographic changes. Portugal is one of the few advanced countries which has already experienced a decline in population over the recent period. As a consequence, the pace of entitlement reform should be faster in Portugal and policy reversals should be avoided to circumvent disruptive adjustments in the future. In particular, there is a great urgency to revisit recent pension reforms to frontload the adjustment effort. This would both contain spending pressure in the short run, while ensuring more equity between current pensioners and future generations of pensioners. Finally, reforms to reduce health care cost should be pursued forcefully to ensure that health costs are fiscally sustainable.
PORTUGAL
24 INTERNATIONAL MONETARY FUND
References
Bank of Portugal, 2015, “Demographic Transition and Growth in the Portuguese Economy,” Economic Bulletin - October 2015.
Beyer, Robert, and Smets, Frank., 2014, “Has Mobility Increased? Reassessing Regional Labor Market Adjustments in Europe and the US,” Presented at the 60th panel meeting of Economic Policy. Clements, B., D. Coady, and S. Gupta (eds.), 2012, “The Economics of Public Health Care Reform in Advanced and Emerging Economies.” Washington: International Monetary Fund. http://www.imfbookstore.org/ProdDetails.asp?ID=SCHPEA European Commission (EC), 2009, “Migration in an Enlarged EU: A challenging Solution?,” European Economic Papers 363. Brussels. ——, 2010, “The Role of Technology in Health Expenditure in the EU,” European Economic Papers 400. http://ec.europa.eu/economy_finance/publications/economic_paper/2010/ecp400_en.htm ——, 2014, “The Economic Adjustment Programme for Portugal 2011-2014,” European Economy Occasional Papers 202. http://ec.europa.eu/economy_finance/publications/occasional_paper/2014/op202_en.htm
——, 2015, “The Ageing Report – Economic and Budgetary Projections to the 28 EU Member States (2013-2060),” European Economy 3. http://europa.eu/epc/pdf/ageing_report_2015_en.pdf
Goodhart, Charles, and Lee, James, 2013, “Adjustment Mechanisms in a Currency Area,” Open Economies Review, Vol. 24, No. 4, pp. 627–56. Instituto Nacional de Estatistica, 2016a, “Portugal Resident Population Estimates 2015,” Press Release. http://www.bportugal.pt/en- US/EstudosEconomicos/Publicacoes/BoletimEconomico/BEAnteriores/Documents/bol_econ_ out2015_e.pdf ——, 2016b, “Demographic Changes in Portugal,” Revista de Estudos Demographicos 54. https://www.ine.pt/ngt_server/attachfileu.jsp?look_parentBoui=228364379&att_display=n&a tt_download=y International Monetary Fund (IMF), 2013a, “Portugal - Rethinking the State – Selected Expenditure Reform Options,” Technical Assistance Report. Washington. https://www.imf.org/external/pubs/cat/longres.aspx?sk=40225.0
PORTUGAL
INTERNATIONAL MONETARY FUND 25
——, 2013b, “Women, Work and the Economy: Macroeconomic Gains from Gender Equity,” Staff Discussion Note. https://www.imf.org/external/pubs/ft/sdn/2013/sdn1310.pdf ——, 2015a, “The Fiscal Consequences of Shrinking Populations,” Staff Discussion Note. http://www.imf.org/external/pubs/cat/longres.aspx?sk=43345
——, 2015b, “Uneven Growth. Short- and Long-Term Factors,” World Economic Outlook. https://www.imf.org/external/pubs/ft/weo/2015/01/pdf/text.pdf ——, 2016a, “From Crisis to Convergence: Charting a Course for Portugal,” European Department Paper. http://www.imf.org/external/pubs/ft/dp/2016/eur1602.pdf ——, 2016b, “The Refugee Surge in Europe: Economic Challenges,” Staff Discussion Note. https://www.imf.org/external/pubs/cat/longres.aspx?sk=43609 ——, upcoming, “Should They Stay or Should They Go? Economic Impact of Emigration on Eastern Europe, Staff Discussion Note. Organisation for Economic Co-operation and Development (OECD), 2011, “Doing Better for Families - Portugal,” Paris. http://www.oecd.org/els/family/doingbetterforfamilies.htm ——, 2013, “Public Spending on Health and Long-Term Care: A New Set of Projections”, OECD Economic Policy Papers Nº6. http://www.oecd.org/economy/public-spending-on-health-and-long-term-care.htm ——, 2015a, “Reducing Inequality and Poverty in Portugal,” Economic Departments Working Papers 1258. http://www.oecd-ilibrary.org/economics/reducing-inequality-and-poverty-in- portugal_5jrw21ng3ts3-en ——, 2015b, “Portugal – Raising Standard,” OECD Review of Health Care Quality. http://www.oecd.org/publications/oecd-reviews-of-health-care-quality-portugal-2015- 9789264225985-en.htm
Serviço de Estrangeiros e Fronteiras (SEF), 2015, “Relatório de Imigração, Fronteiras e Asilo 2015,” Lisbon. http://sefstat.sef.pt/Docs/Rifa_2015.pdf United Nations (UN), 2015, “World Population Prospects: The 2015 Revision”. New York: United Nations.
PORTUGAL
26 INTERNATIONAL MONETARY FUND
CHALLENGES CONFRONTING PORTUGUESE BANKS: PROFITABILITY AND ASSET QUALITY1 A. Introduction
This paper provides an overview of the main challenges confronting the Portuguese banking system, and identifies two key sources of vulnerability: low profitability and lackluster asset quality. It then studies the drivers of profitability and asset quality in Portuguese banks before, during, and after the global financial crisis and examines policy options for increasing profitability and strengthening asset quality over the medium-term.
We argue that that key characteristics of Portuguese banks contributed to a build-up of vulnerabilities that began in the mid-1990s and continued following euro accession during 1999– 2007. The banking sector was profitable throughout this period. However, it also experienced: (i) low levels of capital and increased solvency risk; (ii) an overreliance on wholesale funding, which in turn increased liquidity risk; (iii) concentrated ownership, which acted as a disincentive to capital increases that could dilute ownership shares; and (iv) the misallocation of credit, especially to the construction sector. The global financial crisis in 2008 would begin to expose those vulnerabilities across Europe, and would impact Portuguese banks as well.
Based on empirical analysis of a sample of euro area banks over the period 2010–2015, we find that low profitability was associated with (i) lower levels of capital; (ii) lower liquidity; and (iii) weaker macroeconomic fundamentals (lower GDP growth and higher public debt levels).2 Moreover, the effects of these variables appear to be larger for stressed economies (including Portugal) than for non-stressed economies.
In recent years, Portuguese banks were able to increase liquidity and, to a lesser extent, capital. However, significant challenges remain as low or negative profitability, weighed down by low growth, and poor asset quality, due to legacy issues, continue to impact the outlook for the banking sector.
Given limited policy options to restore profitability and improve asset quality, we argue that Portuguese banks should: (i) further reduce their operating costs; (ii) increase the pace of non-performing loan (NPL) disposal; and (iii) raise capital to absorb losses from restructuring and write-offs.
1 Prepared by Antoine Bouveret and Irene Yackovlev. 2 The positive association between capital and profitability during 2010–15 appears to be different from the pre-crisis period when high profitability was associated with low capital, as elaborated below.
PORTUGAL
INTERNATIONAL MONETARY FUND 27
B. The Pre-Crisis Period (1995–2007): Build-up of Vulnerabilities
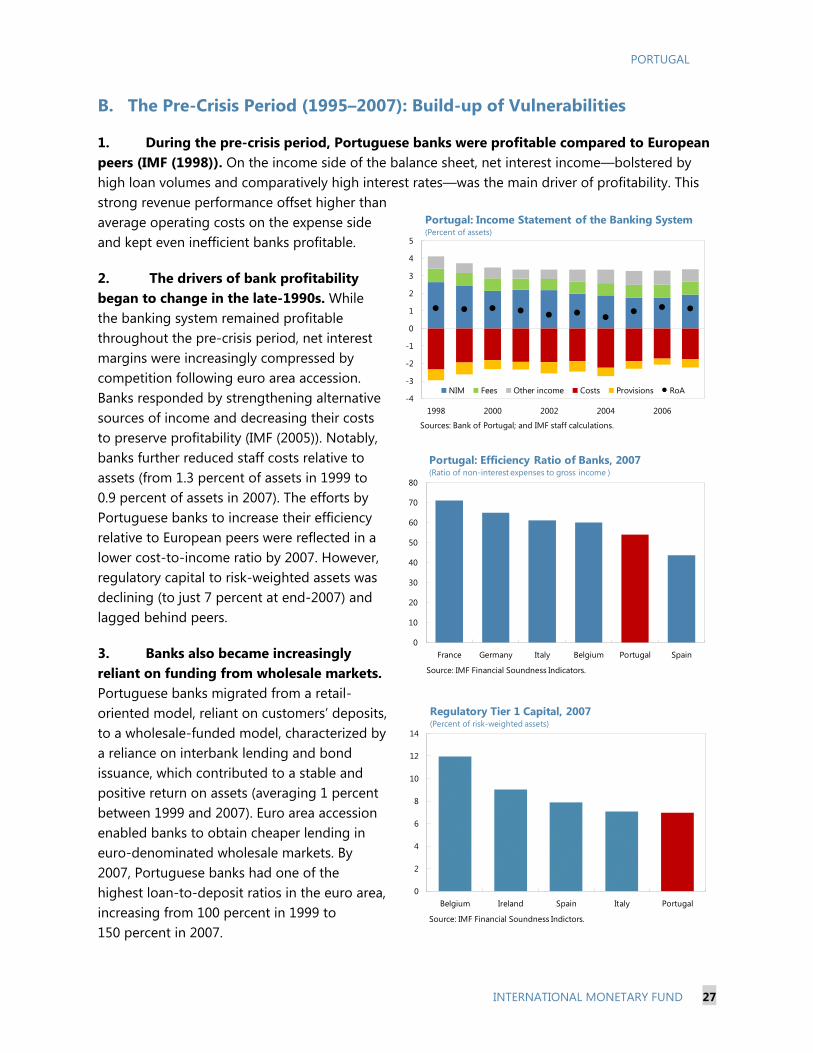
1. During the pre-crisis period, Portuguese banks were profitable compared to European peers (IMF (1998)). On the income side of the balance sheet, net interest income—bolstered by high loan volumes and comparatively high interest rates—was the main driver of profitability. This strong revenue performance offset higher than average operating costs on the expense side and kept even inefficient banks profitable.
2. The drivers of bank profitability began to change in the late-1990s. While the banking system remained profitable throughout the pre-crisis period, net interest margins were increasingly compressed by competition following euro area accession. Banks responded by strengthening alternative sources of income and decreasing their costs to preserve profitability (IMF (2005)). Notably, banks further reduced staff costs relative to assets (from 1.3 percent of assets in 1999 to 0.9 percent of assets in 2007). The efforts by Portuguese banks to increase their efficiency relative to European peers were reflected in a lower cost-to-income ratio by 2007. However, regulatory capital to risk-weighted assets was declining (to just 7 percent at end-2007) and lagged behind peers.
3. Banks also became increasingly reliant on funding from wholesale markets. Portuguese banks migrated from a retail-oriented model, reliant on customers’ deposits, to a wholesale-funded model, characterized by a reliance on interbank lending and bond issuance, which contributed to a stable and positive return on assets (averaging 1 percent between 1999 and 2007). Euro area accession enabled banks to obtain cheaper lending in euro-denominated wholesale markets. By 2007, Portuguese banks had one of the highest loan-to-deposit ratios in the euro area, increasing from 100 percent in 1999 to 150 percent in 2007.
0
2
4
6
8
10
12
14
Belgium Ireland Spain Italy Portugal
Regulatory Tier 1 Capital, 2007(Percent of risk-weighted assets)
Source: IMF Financial Soundness Indictors.
0
10
20
30
40
50
60
70
80
France Germany Italy Belgium Portugal Spain
Portugal: Efficiency Ratio of Banks, 2007(Ratio of non-interest expenses to gross income )
Source: IMF Financial Soundness Indicators.
-4
-3
-2
-1
0
1
2
3
4
5
1998 2000 2002 2004 2006
NIM Fees Other income Costs Provisions RoA
Sources: Bank of Portugal; and IMF staff calculations.
Portugal: Income Statement of the Banking System(Percent of assets)
PORTUGAL
28 INTERNATIONAL MONETARY FUND
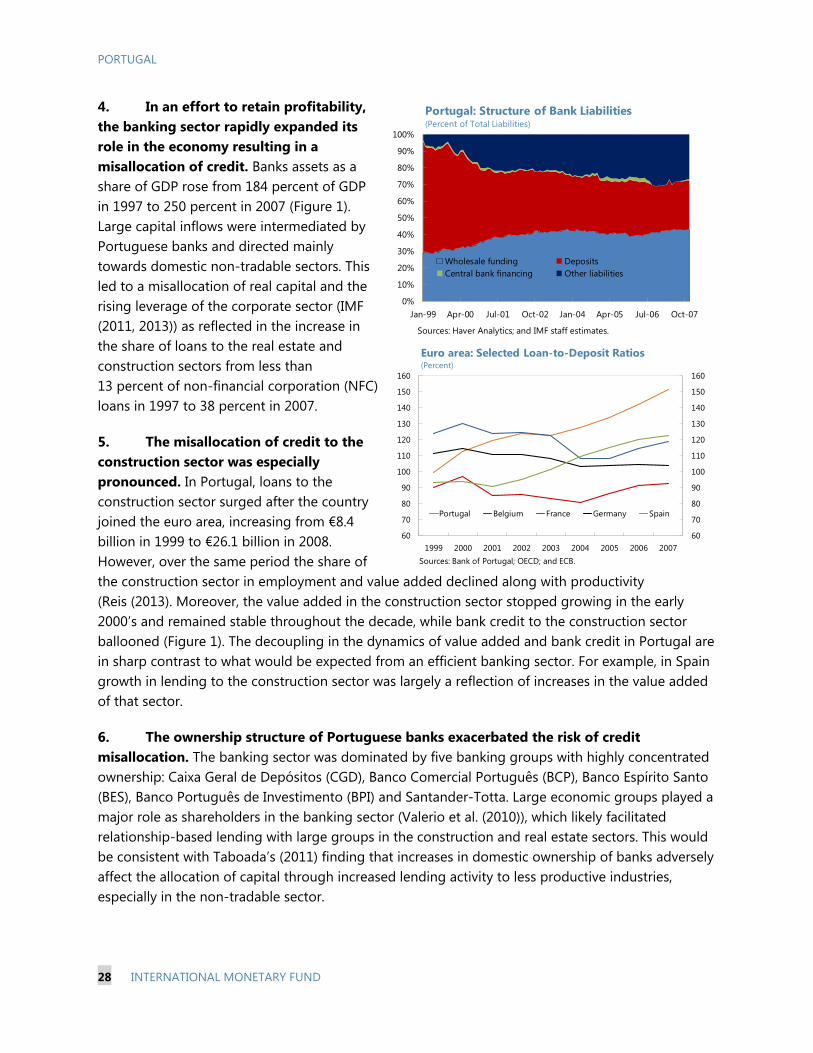
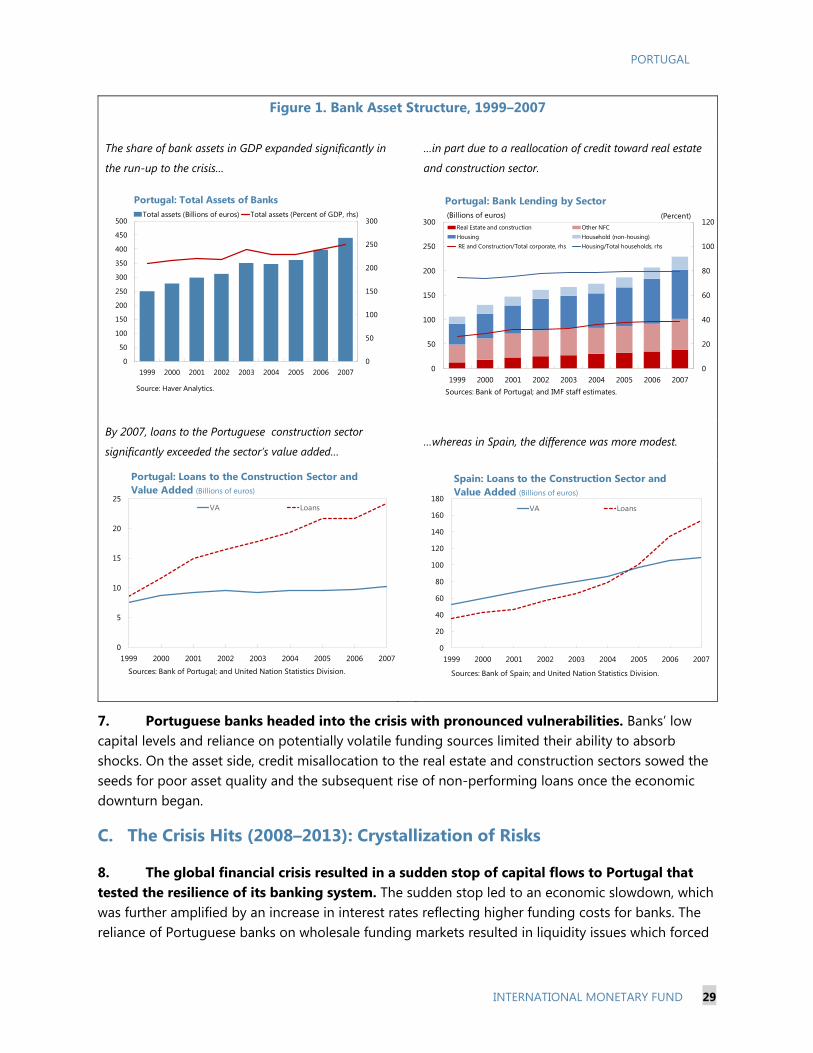
4. In an effort to retain profitability, the banking sector rapidly expanded its role in the economy resulting in a misallocation of credit. Banks assets as a share of GDP rose from 184 percent of GDP in 1997 to 250 percent in 2007 (Figure 1). Large capital inflows were intermediated by Portuguese banks and directed mainly towards domestic non-tradable sectors. This led to a misallocation of real capital and the rising leverage of the corporate sector (IMF (2011, 2013)) as reflected in the increase in the share of loans to the real estate and construction sectors from less than 13 percent of non-financial corporation (NFC) loans in 1997 to 38 percent in 2007.
5. The misallocation of credit to the construction sector was especially pronounced. In Portugal, loans to the construction sector surged after the country joined the euro area, increasing from €8.4 billion in 1999 to €26.1 billion in 2008. However, over the same period the share of the construction sector in employment and value added declined along with productivity (Reis (2013). Moreover, the value added in the construction sector stopped growing in the early 2000’s and remained stable throughout the decade, while bank credit to the construction sector ballooned (Figure 1). The decoupling in the dynamics of value added and bank credit in Portugal are in sharp contrast to what would be expected from an efficient banking sector. For example, in Spain growth in lending to the construction sector was largely a reflection of increases in the value added of that sector.
6. The ownership structure of Portuguese banks exacerbated the risk of credit misallocation. The banking sector was dominated by five banking groups with highly concentrated ownership: Caixa Geral de Depósitos (CGD), Banco Comercial Português (BCP), Banco Espírito Santo (BES), Banco Português de Investimento (BPI) and Santander-Totta. Large economic groups played a major role as shareholders in the banking sector (Valerio et al. (2010)), which likely facilitated relationship-based lending with large groups in the construction and real estate sectors. This would be consistent with Taboada’s (2011) finding that increases in domestic ownership of banks adversely affect the allocation of capital through increased lending activity to less productive industries, especially in the non-tradable sector.
60
70
80
90
100
110
120
130
140
150
160
1999 2000 2001 2002 2003 2004 2005 2006 200760
70
80
90
100
110
120
130
140
150
160
Portugal Belgium France Germany Spain
Euro area: Selected Loan-to-Deposit Ratios(Percent)
Sources: Bank of Portugal; OECD; and ECB.
0%
10%
20%
30%
40%
50%
60%
70%
80%
90%
100%
Jan-99 Apr-00 Jul-01 Oct-02 Jan-04 Apr-05 Jul-06 Oct-07
Wholesale funding DepositsCentral bank financing Other liabilities
Portugal: Structure of Bank Liabilities(Percent of Total Liabilities)
Sources: Haver Analytics; and IMF staff estimates.
PORTUGAL
INTERNATIONAL MONETARY FUND 29
7. Portuguese banks headed into the crisis with pronounced vulnerabilities. Banks’ low capital levels and reliance on potentially volatile funding sources limited their ability to absorb shocks. On the asset side, credit misallocation to the real estate and construction sectors sowed the seeds for poor asset quality and the subsequent rise of non-performing loans once the economic downturn began.
C. The Crisis Hits (2008–2013): Crystallization of Risks
8. The global financial crisis resulted in a sudden stop of capital flows to Portugal that tested the resilience of its banking system. The sudden stop led to an economic slowdown, which was further amplified by an increase in interest rates reflecting higher funding costs for banks. The reliance of Portuguese banks on wholesale funding markets resulted in liquidity issues which forced
Figure 1. Bank Asset Structure, 1999–2007
The share of bank assets in GDP expanded significantly in
the run-up to the crisis…
…in part due to a reallocation of credit toward real estate
and construction sector.
By 2007, loans to the Portuguese construction sector
significantly exceeded the sector’s value added… …whereas in Spain, the difference was more modest.
0
20
40
60
80
100
120
0
50
100
150
200
250
300
1999 2000 2001 2002 2003 2004 2005 2006 2007
Real Estate and construction Other NFCHousing Household (non-housing) RE and Construction/Total corporate, rhs Housing/Total households, rhs
Portugal: Bank Lending by Sector
Sources: Bank of Portugal; and IMF staff estimates.
(Billions of euros) (Percent)
0
5
10
15
20
25
1999 2000 2001 2002 2003 2004 2005 2006 2007
VA Loans
Portugal: Loans to the Construction Sector and Value Added (Billions of euros)
Sources: Bank of Portugal; and United Nation Statistics Division.
0
20
40
60
80
100
120
140
160
180
1999 2000 2001 2002 2003 2004 2005 2006 2007
VA Loans
Spain: Loans to the Construction Sector and Value Added (Billions of euros)
Sources: Bank of Spain; and United Nation Statistics Division.
0
50
100
150
200
250
300
0
50
100
150
200
250
300
350
400
450
500
1999 2000 2001 2002 2003 2004 2005 2006 2007
Total assets (Billions of euros) Total assets (Percent of GDP, rhs)
Source: Haver Analytics.
Portugal: Total Assets of Banks
PORTUGAL
30 INTERNATIONAL MONETARY FUND
banks to increase ECB funding (IMF (2013)). Excessive leverage in the corporate sector made firms unable to repay their loans, resulting in a rise in non-performing loans, especially in the construction sector. Banks reacted by deleveraging, through a decline in outstanding loans on the asset side, and by attracting deposits to change their funding structure and move towards a retail-based model.
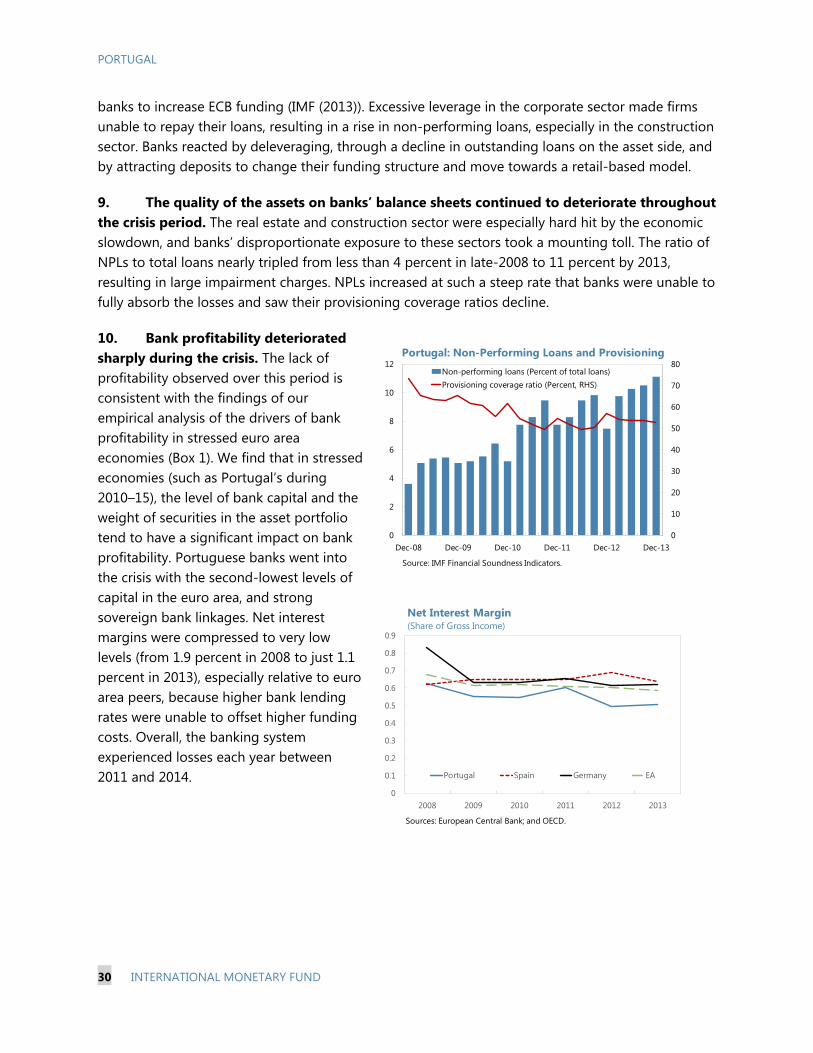
9. The quality of the assets on banks’ balance sheets continued to deteriorate throughout the crisis period. The real estate and construction sector were especially hard hit by the economic slowdown, and banks’ disproportionate exposure to these sectors took a mounting toll. The ratio of NPLs to total loans nearly tripled from less than 4 percent in late-2008 to 11 percent by 2013, resulting in large impairment charges. NPLs increased at such a steep rate that banks were unable to fully absorb the losses and saw their provisioning coverage ratios decline.
10. Bank profitability deteriorated sharply during the crisis. The lack of profitability observed over this period is consistent with the findings of our empirical analysis of the drivers of bank profitability in stressed euro area economies (Box 1). We find that in stressed economies (such as Portugal’s during 2010–15), the level of bank capital and the weight of securities in the asset portfolio tend to have a significant impact on bank profitability. Portuguese banks went into the crisis with the second-lowest levels of capital in the euro area, and strong sovereign bank linkages. Net interest margins were compressed to very low levels (from 1.9 percent in 2008 to just 1.1 percent in 2013), especially relative to euro area peers, because higher bank lending rates were unable to offset higher funding costs. Overall, the banking system experienced losses each year between 2011 and 2014.
0
0.1
0.2
0.3
0.4
0.5
0.6
0.7
0.8
0.9
2008 2009 2010 2011 2012 2013
Portugal Spain Germany EA
Sources: European Central Bank; and OECD.
Net Interest Margin(Share of Gross Income)
0
10
20
30
40
50
60
70
80
0
2
4
6
8
10
12
Dec-08 Dec-09 Dec-10 Dec-11 Dec-12 Dec-13
Non-performing loans (Percent of total loans)Provisioning coverage ratio (Percent, RHS)
Portugal: Non-Performing Loans and Provisioning
Source: IMF Financial Soundness Indicators.
PORTUGAL
INTERNATIONAL MONETARY FUND 31
Box 1. Portugal: An Empirical Analysis of Drivers of Bank Profitability, 2010–15
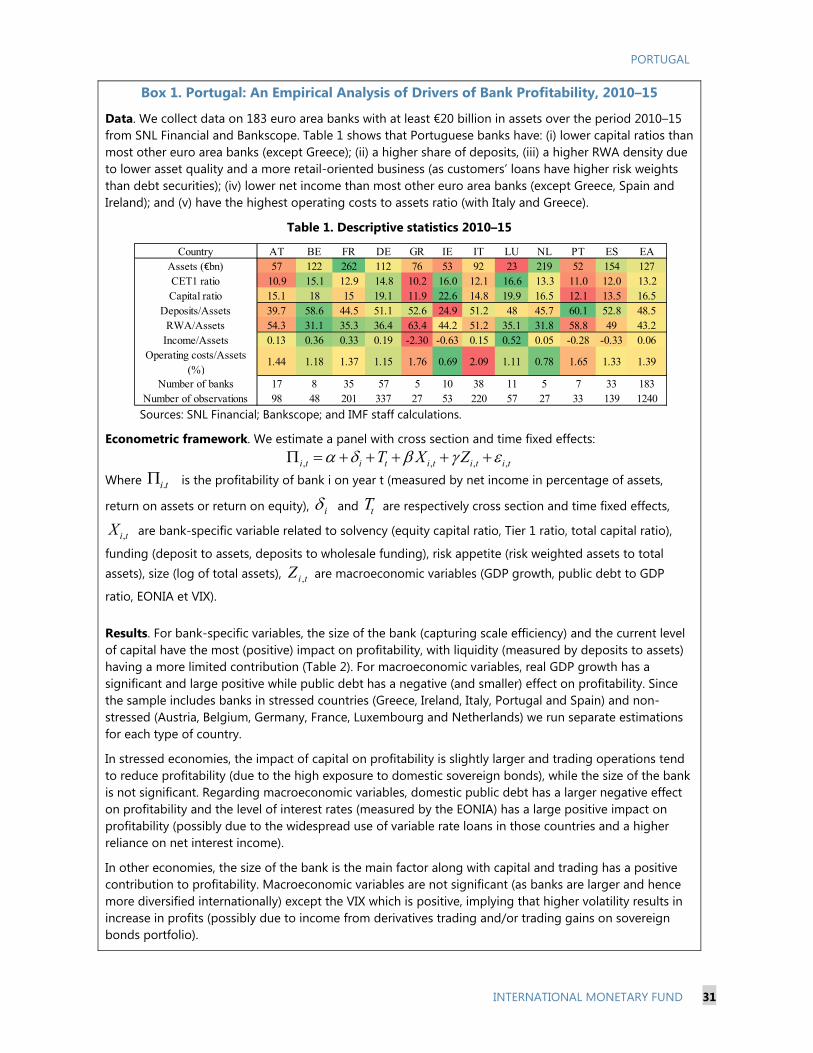
Data. We collect data on 183 euro area banks with at least €20 billion in assets over the period 2010–15 from SNL Financial and Bankscope. Table 1 shows that Portuguese banks have: (i) lower capital ratios than most other euro area banks (except Greece); (ii) a higher share of deposits, (iii) a higher RWA density due to lower asset quality and a more retail-oriented business (as customers’ loans have higher risk weights than debt securities); (iv) lower net income than most other euro area banks (except Greece, Spain and Ireland); and (v) have the highest operating costs to assets ratio (with Italy and Greece).
Table 1. Descriptive statistics 2010–15
Sources: SNL Financial; Bankscope; and IMF staff calculations.
Econometric framework. We estimate a panel with cross section and time fixed effects:
, , , ,i t i t i t i t i tT X Z
Where .i t is the profitability of bank i on year t (measured by net income in percentage of assets,
return on assets or return on equity), i and tT are respectively cross section and time fixed effects,
,i tX are bank-specific variable related to solvency (equity capital ratio, Tier 1 ratio, total capital ratio),
funding (deposit to assets, deposits to wholesale funding), risk appetite (risk weighted assets to total assets), size (log of total assets), ,i tZ are macroeconomic variables (GDP growth, public debt to GDP
ratio, EONIA et VIX). Results. For bank-specific variables, the size of the bank (capturing scale efficiency) and the current level of capital have the most (positive) impact on profitability, with liquidity (measured by deposits to assets) having a more limited contribution (Table 2). For macroeconomic variables, real GDP growth has a significant and large positive while public debt has a negative (and smaller) effect on profitability. Since the sample includes banks in stressed countries (Greece, Ireland, Italy, Portugal and Spain) and non-stressed (Austria, Belgium, Germany, France, Luxembourg and Netherlands) we run separate estimations for each type of country.
In stressed economies, the impact of capital on profitability is slightly larger and trading operations tend to reduce profitability (due to the high exposure to domestic sovereign bonds), while the size of the bank is not significant. Regarding macroeconomic variables, domestic public debt has a larger negative effect on profitability and the level of interest rates (measured by the EONIA) has a large positive impact on profitability (possibly due to the widespread use of variable rate loans in those countries and a higher reliance on net interest income).
In other economies, the size of the bank is the main factor along with capital and trading has a positive contribution to profitability. Macroeconomic variables are not significant (as banks are larger and hence more diversified internationally) except the VIX which is positive, implying that higher volatility results in increase in profits (possibly due to income from derivatives trading and/or trading gains on sovereign bonds portfolio).
Country AT BE FR DE GR IE IT LU NL PT ES EAAssets (€bn) 57 122 262 112 76 53 92 23 219 52 154 127CET1 ratio 10.9 15.1 12.9 14.8 10.2 16.0 12.1 16.6 13.3 11.0 12.0 13.2Capital ratio 15.1 18 15 19.1 11.9 22.6 14.8 19.9 16.5 12.1 13.5 16.5
Deposits/Assets 39.7 58.6 44.5 51.1 52.6 24.9 51.2 48 45.7 60.1 52.8 48.5RWA/Assets 54.3 31.1 35.3 36.4 63.4 44.2 51.2 35.1 31.8 58.8 49 43.2
Income/Assets 0.13 0.36 0.33 0.19 -2.30 -0.63 0.15 0.52 0.05 -0.28 -0.33 0.06Operating costs/Assets
(%)1.44 1.18 1.37 1.15 1.76 0.69 2.09 1.11 0.78 1.65 1.33 1.39
Number of banks 17 8 35 57 5 10 38 11 5 7 33 183Number of observations 98 48 201 337 27 53 220 57 27 33 139 1240
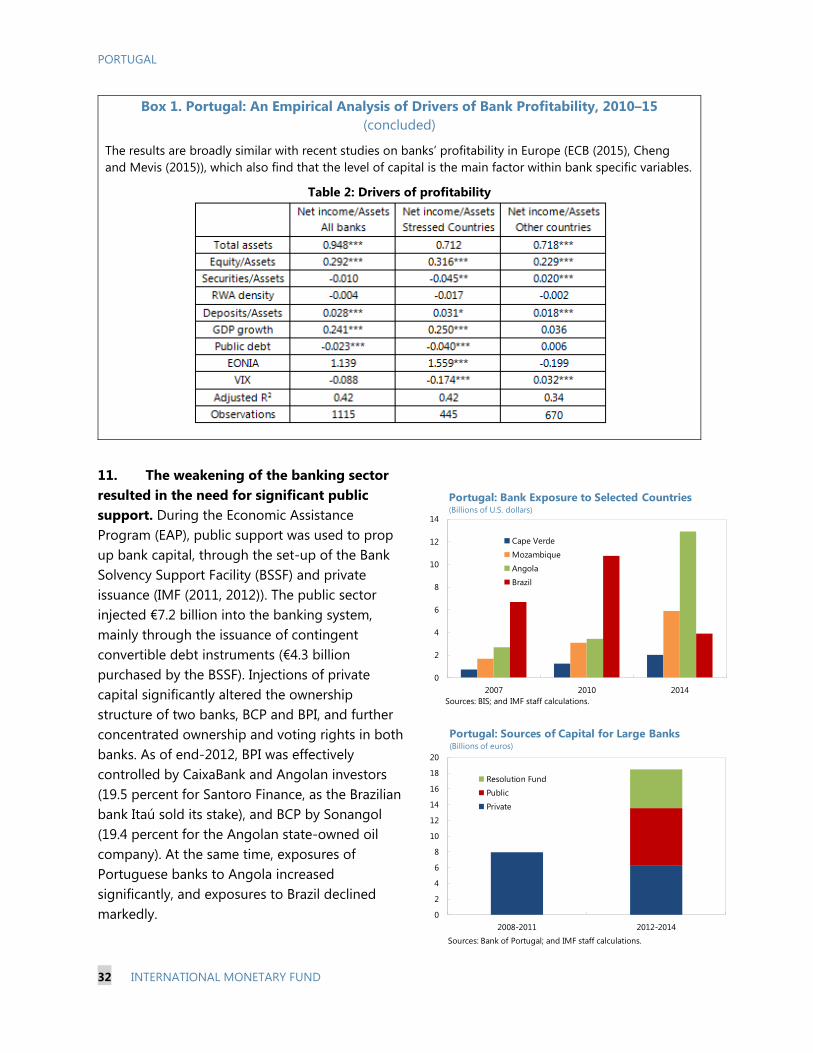
PORTUGAL
32 INTERNATIONAL MONETARY FUND
11. The weakening of the banking sector resulted in the need for significant public support. During the Economic Assistance Program (EAP), public support was used to prop up bank capital, through the set-up of the Bank Solvency Support Facility (BSSF) and private issuance (IMF (2011, 2012)). The public sector injected €7.2 billion into the banking system, mainly through the issuance of contingent convertible debt instruments (€4.3 billion purchased by the BSSF). Injections of private capital significantly altered the ownership structure of two banks, BCP and BPI, and further concentrated ownership and voting rights in both banks. As of end-2012, BPI was effectively controlled by CaixaBank and Angolan investors (19.5 percent for Santoro Finance, as the Brazilian bank Itaú sold its stake), and BCP by Sonangol (19.4 percent for the Angolan state-owned oil company). At the same time, exposures of Portuguese banks to Angola increased significantly, and exposures to Brazil declined markedly.
Box 1. Portugal: An Empirical Analysis of Drivers of Bank Profitability, 2010–15 (concluded)
The results are broadly similar with recent studies on banks’ profitability in Europe (ECB (2015), Cheng and Mevis (2015)), which also find that the level of capital is the main factor within bank specific variables.
Table 2: Drivers of profitability
0
2
4
6
8
10
12
14
2007 2010 2014
Cape Verde
Mozambique
Angola
Brazil
Portugal: Bank Exposure to Selected Countries(Billions of U.S. dollars)
Sources: BIS; and IMF staff calculations.
0
2
4
6
8
10
12
14
16
18
20
2008-2011 2012-2014
Resolution Fund
Public
Private
Portugal: Sources of Capital for Large Banks(Billions of euros)
Sources: Bank of Portugal; and IMF staff calculations.
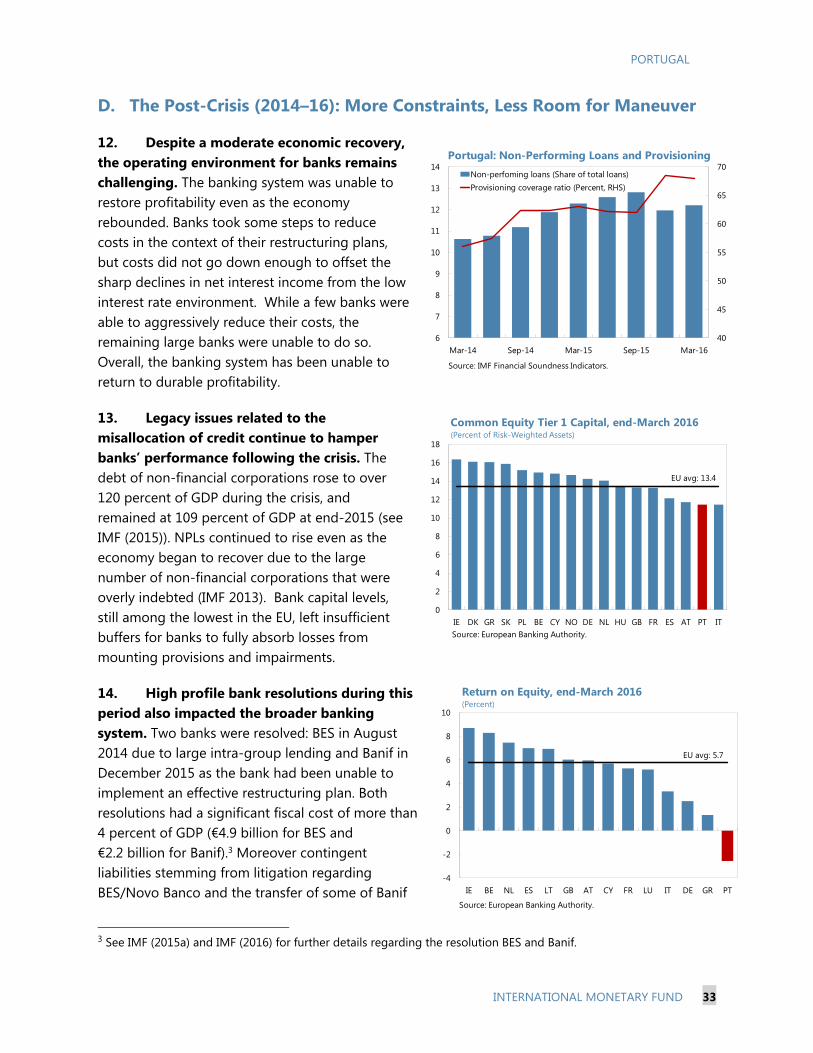
PORTUGAL
INTERNATIONAL MONETARY FUND 33
D. The Post-Crisis (2014–16): More Constraints, Less Room for Maneuver
12. Despite a moderate economic recovery, the operating environment for banks remains challenging. The banking system was unable to restore profitability even as the economy rebounded. Banks took some steps to reduce costs in the context of their restructuring plans, but costs did not go down enough to offset the sharp declines in net interest income from the low interest rate environment. While a few banks were able to aggressively reduce their costs, the remaining large banks were unable to do so. Overall, the banking system has been unable to return to durable profitability.
13. Legacy issues related to the misallocation of credit continue to hamper banks’ performance following the crisis. The debt of non-financial corporations rose to over 120 percent of GDP during the crisis, and remained at 109 percent of GDP at end-2015 (see IMF (2015)). NPLs continued to rise even as the economy began to recover due to the large number of non-financial corporations that were overly indebted (IMF 2013). Bank capital levels, still among the lowest in the EU, left insufficient buffers for banks to fully absorb losses from mounting provisions and impairments.
14. High profile bank resolutions during this period also impacted the broader banking system. Two banks were resolved: BES in August 2014 due to large intra-group lending and Banif in December 2015 as the bank had been unable to implement an effective restructuring plan. Both resolutions had a significant fiscal cost of more than 4 percent of GDP (€4.9 billion for BES and €2.2 billion for Banif).3 Moreover contingent liabilities stemming from litigation regarding BES/Novo Banco and the transfer of some of Banif
3 See IMF (2015a) and IMF (2016) for further details regarding the resolution BES and Banif.
0
2
4
6
8
10
12
14
16
18
IE DK GR SK PL BE CY NO DE NL HU GB FR ES AT PT ITSource: European Banking Authority.
EU avg: 13.4
Common Equity Tier 1 Capital, end-March 2016(Percent of Risk-Weighted Assets)
40
45
50
55
60
65
70
6
7
8
9
10
11
12
13
14
Mar-14 Sep-14 Mar-15 Sep-15 Mar-16
Non-perfoming loans (Share of total loans)Provisioning coverage ratio (Percent, RHS)
Portugal: Non-Performing Loans and Provisioning
Source: IMF Financial Soundness Indicators.
-4
-2
0
2
4
6
8
10
IE BE NL ES LT GB AT CY FR LU IT DE GR PT
Source: European Banking Authority.
EU avg: 5.7
Return on Equity, end-March 2016(Percent)

PORTUGAL
34 INTERNATIONAL MONETARY FUND
assets to the Resolution Fund could entail further costs in the future for the government but also for the banks (due to their recurring contribution to the Portuguese resolution fund on top of their contributions to the European Resolution Fund).
E. The Medium Term: Remaining Challenges
15. In the near future, economic growth, inflation and interest rates are expected to remain low, which will increase the importance of strengthening the banking system to ensure it can support the recovery. Deteriorating asset quality and low capital levels make the Portuguese banking system vulnerable. Therefore, strengthening the banking system will be an important element in ensuring it can support the recovery. While liquidity has been restored, legacy issues related to the misallocation of credit have not been dealt with, resulting in low profitability which makes it difficult to increase capital. Low capital levels in turn hamper the pace of balance sheet clean-up, creating a negative feedback loop. Therefore, banks will need to continue to adjust to the difficult operating environment and make tough decisions to restore profitability by increasing income and reducing expenses.
16. Banks will need to further bolster new and stable income streams. Alternative sources of income such as fees and commission could be strengthened, building on the universal banking model used by Portuguese banking groups. While the share of income stemming from commission and fees is in line with the euro area, commission and fees as percentage of banking assets have declined since 2012. Existing proposals at the European level, such as the Capital Market Union could be an opportunity for banks to develop further a fee-based business model, which could be supported by securitization markets. This would help reduce capital requirements and improve risk-sharing.
17. Further reduction in operating costs is also warranted, as the decline in costs has not been able to compensate for a higher level of impairments and dwindling net interest income. Compared to other euro area countries, compensation of bank employees accounts for a large share of revenue, which puts further downward pressure on banks’ profitability. Further restructuring will also be needed, including a rationalization of the branch network and continued divestment of non-core assets and lines of business that are not profitable.
18. Banks will also need additional capital to absorb the losses stemming from changing their business models. Streamlining bank operations around core, profitable income streams and dealing with legacy assets will require significant loss absorption capacity by some banks. In the current environment, banks’ efforts to meaningfully bolster their capital buffers are hampered by the
25
30
35
40
45
50
55
2011 2012 2013 2014 2015
Portugal Spain Germany Italy
Sources: SNL Financial; and IMF staff estimates.
Bank Compensation(Share of total revenue, percent)
PORTUGAL
INTERNATIONAL MONETARY FUND 35
high cost of capital – as both new and existing shareholders are weary of providing additional capital to an unprofitable banking system with unresolved balance sheet weaknesses.
19. The regulatory environment imposes additional constraints on banks. The entry into force of the Bank Recovery and Resolution Directive, the Single Resolution Mechanism and future Minimum Requirements for own funds and Eligible Liabilities (MREL) impose additional requirements on banks. While regulatory requirements are ultimately aimed at strengthening bank balance sheets, in the short-run they will impose costs on banks as they seek to adjust their business models and shore up their capital base. Over the medium-term, however, regulatory requirements to further impair NPLs and raise additional capital would improve asset quality and free resources to lend to more productive firms, especially in the tradable sector.
20. The challenges currently confronted by Portuguese banks arose over the course of decades, and will require decisive action to overcome. Banks will need to move aggressively to restore profitability by identifying alternative stable income streams and lowering costs, while seeking a solution to long-standing legacy issues stemming from the misallocation of credit. Capital levels will need to be strengthened, likely even surpassing regulatory requirements, to absorb losses.
PORTUGAL
36 INTERNATIONAL MONETARY FUND
References
Bank of Portugal, 2009, “The Portuguese Economy in the context of economic, financial and monetary integration”, Economics and Research Department. Cheng, G. and D. Mevis, 2015, “What happened to profitability? Shocks, challenges and perspectives for euro area banks”, European Stability Mechanism Working Paper No. 5. European Central Bank, 2016, “Bank profitability challenges in euro area banks: the role of cyclical and structural factors”, Financial Stability Review, May 2015. International Monetary Fund, 2006a, “Portugal: Financial System Stability Assessment”, IMF Country Report No. 06/378. International Monetary Fund, 2011, “Portugal: Second Review”, IMF Country Report No. 11/363. International Monetary Fund, 2013, “Portugal: Article IV”, IMF Country Report No. 13/18. International Monetary Fund, 2014a, “Risk Taking by banks: the role of governance and executive pay”, Global Financial Stability Report Chapter 3, October 2014. International Monetary Fund, 2014b, “Spain: Financial Sector Reform – Final Progress Report”, INMF Country Report No. 14/59. International Monetary Fund, 2015a, “Portugal: First Post Program Monitoring”, IMF Country Report No. 15/21. International Monetary Fund, 2015b, “Portugal: Second Post Program Monitoring”, IMF Country Report No. 15/226. International Monetary Fund, 2016, “Portugal: Third Post Program Monitoring”, IMF Country Report No. 19/97. Reis, R., 2013, “The Portuguese Slump and Crash and the Euro Crisis”, Brooking Papers on Economic Activity, Economic Studies Program, The Brookings Institution, Vol. 46(1), 143-210. Taboada, A.G., 2011, “The impact of changes in bank ownership structure on the allocation of capital: international evidence”, Journal of Banking & Finance, Vol. 35, 2528-2543. Valerio, N., A. B. Nunes, C. Bastien, R. M. de Sousa and S. Domingos Costa, 2010, “History of the Portuguese Banking System. Volume 2: From the Bank of Portugal’s Role as a Central Bank to the European Monetary Union”, edited by N. Valerio, Bank of Portugal.
PORTUGAL
INTERNATIONAL MONETARY FUND 37
PORTUGAL THROUGH QUANTITATIVE EASING (QE)1
The ECB initiated asset purchases in October 2014 in order to further ease monetary conditions in the context of below-target inflation in the euro area, where key ECB interest rates were near the lower bound. The asset purchase program aimed to improve access to finance for firms and households, supporting investment and consumption and contributing to a return of inflation toward the ECB’s target range. While it is difficult to build a counterfactual to assess what would have happened in the absence of a policy response, this paper summarizes the scale of ECB support to Portugal through its asset purchase program, and assesses the impact on public finances, the financial sector, and macroeconomic developments.
A. An Overview of the ECB’s Asset Purchase Program
1. In September 2014, the ECB announced an Asset Purchase Program (APP) as part of its toolkit to provide further monetary accommodation in the context of prolonged low inflation. Quantitative easing (QE) through the APP was intended to enhance the monetary policy transmission mechanism and support the provision of credit to the broad economy. Asset purchases were initially limited to private assets in the form of asset-backed securities and covered bonds2, but were expanded to also include public sector securities under the Public Sector Purchase Program (PSPP), which was announced in January 2015 and began operations in March 20153. The APP originally called for combined monthly purchases of €60 billion, to be completed at the end of September 2016; this was subsequently extended to March 2017, with monthly purchases increasing to €80 billion from April 2016. The range of securities covered by the PSPP included (i) nominal and inflation-linked central government bonds, and (ii) bonds issued by recognized agencies, international organizations and multilateral development banks within the euro area. This was subsequently expanded to also include corporate bonds under the Corporate Sector Purchase Program (CSPP), launched in June 2016.
2. The APP was anticipated to have an effect through several channels of transmission. A decline in sovereign bond yields as a result of large-scale purchases of longer-term securities, together with the ECB’s commitment that monetary policy would remain accommodative until price stability achieved, was expected to create an incentive for banks to shift from government bonds to riskier investments and ease lending conditions (the portfolio balance and credit channels). The impact on bank lending was considered to be particularly important in a bank-centered lending environment such as the euro area. Higher prices of financial and real estate assets would also
1 Prepared by Matthew Gaertner. 2 This was the ECB’s third covered bond purchase program (CBPP3), following operations in 2009-10 (CBPP) and 2011-12 (CBPP2). 3 The ECB had previously carried out sovereign debt purchases under the Securities Market Program (SMP), which was in operation from 2010-12. The SMP and its successor, the Outright Monetary Transactions program (OMT) aimed to repair the transmission mechanism of monetary policy by containing sovereign risk premia that were considered excessive.
PORTUGAL
38 INTERNATIONAL MONETARY FUND
increase financial wealth (wealth channel), inducing households to reduce precautionary savings and to raise consumption spending. In addition, by reassuring households and companies of its determination to use all available tools within its mandate to ensure the integrity of the euro area and address the risks of a prolonged period of low inflation, QE was expected to help reduce uncertainty and in turn encourage spending and investment by households and companies (the confidence channel). Lower interest rates were also expected to result in a weaker euro, helping to support exports and inflation (the exchange rate channel).
3. The support provided to the Portuguese sovereign bond market through the APP buying in the secondary market has been sizable, with PSPP purchases equal to a large share of new issuance since its inception. Average monthly purchases of Portuguese government bonds amounted to €1.2 billion from March 2015–June 2016, with total ECB holdings reaching €19.1 billion at end-June 2016, equal to 17 percent of the total outstanding and with a weighted average remaining maturity of 10 years. This compares with a total of €26.4 billion in IMF funding provided to Portugal under its 3-year adjustment program. In addition, banks have been able to issue €1.8 billion in covered bonds and €0.7 billion in asset-backed securities since the ECB launched those programs in late 2014.
4. In addition to the APP, the ECB also introduced several additional longer-term refinancing operations in September 2014 to support bank lending to the real economy. In addition to the expanded Long-Term Refinancing Operation (LTRO, providing financing with a maturity of 3 years, in place since 2011), the ECB introduced Targeted Long-Term Financing Operations (TLTRO, with a maturity of 4 years) in September 2014. As of June 30, long-term loans to Portuguese banks provided under the ECB's LTRO and TLTRO facilities amounted to €22 billion.
B. Assessing the Impact on Portugal
The impact of the APP is most clearly visible in the fiscal sector, where it has alleviated financing constraints and facilitated a slower pace of fiscal adjustment than had been envisaged previously. The APP, together with the ECB’s expanded refinancing operations, has similarly helped improve access to financing for banks and put downward pressure on lending rates, but transmission to lending appears constrained by the high level of NPLs. The impact on bank lending appears to have been primarily on household mortgages, where NPLs are relatively modest, with corporate lending continuing to contract. As a result, the macroeconomic effect thus far appears most evident on consumption, rather than investment, with little impact on headline growth.
Fiscal policy
5. Portugal has enjoyed a significant improvement in access to long-term market financing since ECB sovereign debt purchases began in 2015. After very limited net sovereign bond issuance in 2013 (-€1.1 billion) and 2014 (€0.5 billion), Portugal’s net bond issuance jumped to €12.9 billion last year, almost fully covered by the amount of purchases by the ECB. The increase in
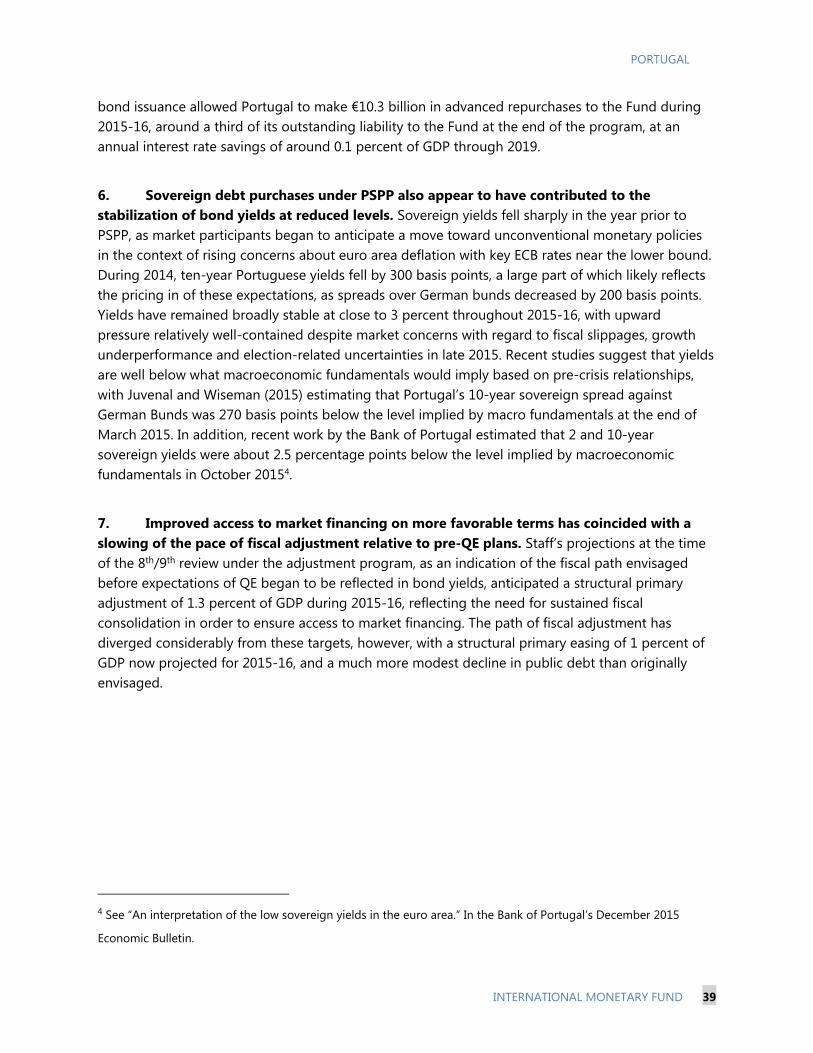
PORTUGAL
INTERNATIONAL MONETARY FUND 39
bond issuance allowed Portugal to make €10.3 billion in advanced repurchases to the Fund during 2015-16, around a third of its outstanding liability to the Fund at the end of the program, at an annual interest rate savings of around 0.1 percent of GDP through 2019.
6. Sovereign debt purchases under PSPP also appear to have contributed to the stabilization of bond yields at reduced levels. Sovereign yields fell sharply in the year prior to PSPP, as market participants began to anticipate a move toward unconventional monetary policies in the context of rising concerns about euro area deflation with key ECB rates near the lower bound. During 2014, ten-year Portuguese yields fell by 300 basis points, a large part of which likely reflects the pricing in of these expectations, as spreads over German bunds decreased by 200 basis points. Yields have remained broadly stable at close to 3 percent throughout 2015-16, with upward pressure relatively well-contained despite market concerns with regard to fiscal slippages, growth underperformance and election-related uncertainties in late 2015. Recent studies suggest that yields are well below what macroeconomic fundamentals would imply based on pre-crisis relationships, with Juvenal and Wiseman (2015) estimating that Portugal’s 10-year sovereign spread against German Bunds was 270 basis points below the level implied by macro fundamentals at the end of March 2015. In addition, recent work by the Bank of Portugal estimated that 2 and 10-year sovereign yields were about 2.5 percentage points below the level implied by macroeconomic fundamentals in October 20154.
7. Improved access to market financing on more favorable terms has coincided with a slowing of the pace of fiscal adjustment relative to pre-QE plans. Staff’s projections at the time of the 8th/9th review under the adjustment program, as an indication of the fiscal path envisaged before expectations of QE began to be reflected in bond yields, anticipated a structural primary adjustment of 1.3 percent of GDP during 2015-16, reflecting the need for sustained fiscal consolidation in order to ensure access to market financing. The path of fiscal adjustment has diverged considerably from these targets, however, with a structural primary easing of 1 percent of GDP now projected for 2015-16, and a much more modest decline in public debt than originally envisaged.
4 See “An interpretation of the low sovereign yields in the euro area.” In the Bank of Portugal’s December 2015
Economic Bulletin.
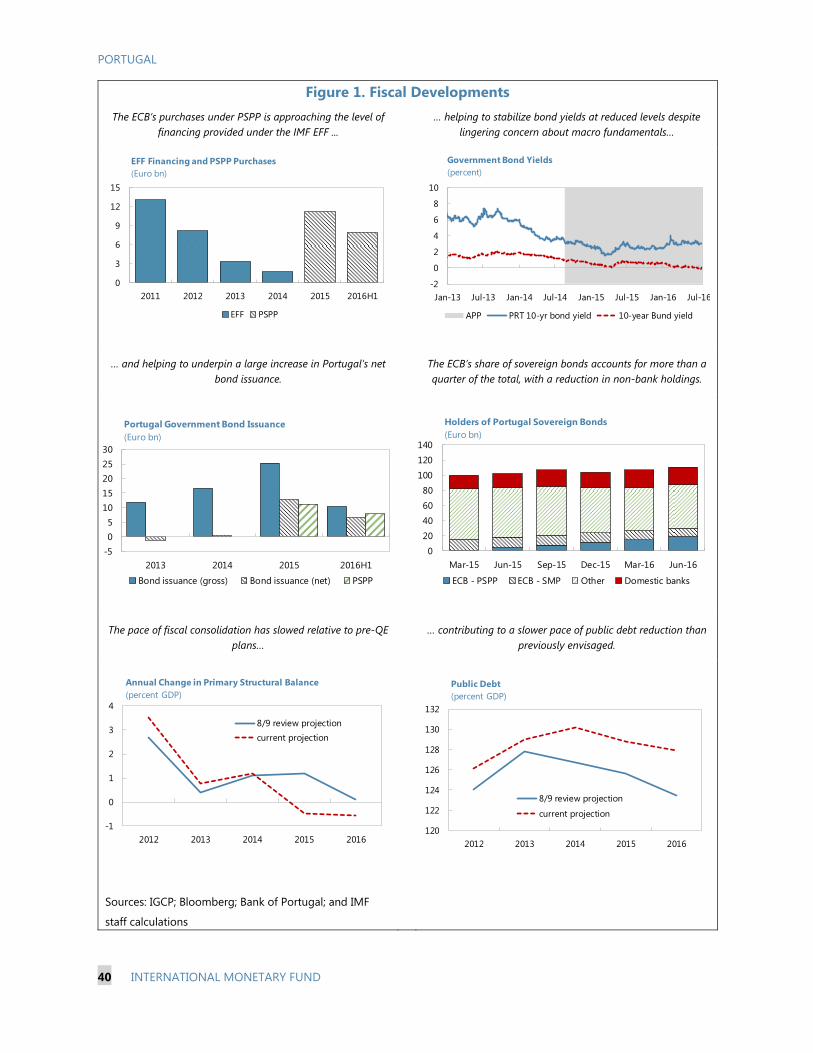
PORTUGAL
40 INTERNATIONAL MONETARY FUND
Figure 1. Fiscal Developments
The ECB’s purchases under PSPP is approaching the level of financing provided under the IMF EFF ...
… helping to stabilize bond yields at reduced levels despite lingering concern about macro fundamentals…
… and helping to underpin a large increase in Portugal’s net bond issuance.
The ECB’s share of sovereign bonds accounts for more than a quarter of the total, with a reduction in non-bank holdings.
The pace of fiscal consolidation has slowed relative to pre-QE plans…
… contributing to a slower pace of public debt reduction than previously envisaged.
Sources: IGCP; Bloomberg; Bank of Portugal; and IMF
staff calculations
-505
1015202530
2013 2014 2015 2016H1
Portugal Government Bond Issuance(Euro bn)
Bond issuance (gross) Bond issuance (net) PSPP
0
20
40
60
80
100
120
140
Mar-15 Jun-15 Sep-15 Dec-15 Mar-16 Jun-16
Holders of Portugal Sovereign Bonds (Euro bn)
ECB - PSPP ECB - SMP Other Domestic banks
-1
0
1
2
3
4
2012 2013 2014 2015 2016
Annual Change in Primary Structural Balance(percent GDP)
8/9 review projectioncurrent projection
0
3
6
9
12
15
2011 2012 2013 2014 2015 2016H1
EFF Financing and PSPP Purchases(Euro bn)
EFF PSPP
-2
0
2
4
6
8
10
Jan-13 Jul-13 Jan-14 Jul-14 Jan-15 Jul-15 Jan-16 Jul-16
Government Bond Yields(percent)
APP PRT 10-yr bond yield 10-year Bund yield
120
122
124
126
128
130
132
2012 2013 2014 2015 2016
Public Debt(percent GDP)
8/9 review projection
current projection
PORTUGAL
INTERNATIONAL MONETARY FUND 41
Financial sector
8. The ECB’s APP together with its expanded refinancing operations have helped to further reduce interest rates despite the main policy rate having reached the lower bound. Interest rates on new loans to non-financial corporations of less than €1 million and new mortgage loans declined by 116 and 101 basis points, respectively, from December 2014-May 2016, even as the ECB’s refinancing rate remained unchanged.
9. New lending since the inception of the APP has primarily focused on mortgages, however, with loans to NFCs remaining subdued. Although the total stock of outstanding loans has contracted further as banks continue to deleverage, new loans to households rose 30 percent during the first half of 2016 (y/y) after an increase of 28 percent (y/y) in 2015. The growth in household lending is reflects a sharp pickup in mortgage borrowing (although remaining well below levels prior to the financial crisis), contributing to the recovery in real estate prices since early 2014. This compared with a decrease in new lending to NFC of 5 percent in the first half of 2015 and 18 percent in 2015. The share of bank assets held in government securities has remained steady, meanwhile; while the fall in lending rates likely reflects in part a decline in risk premia, there is little indication thus far of any significant re-balancing in bank portfolios on aggregate.
10. The transmission to lending activity is likely to have been constrained by weak bank balance sheets and high private indebtedness. The problem is particularly acute in the corporate sector, where the high and rising stock of NPLs reflects the unresolved debt overhang. NPLs to the non-financial corporate sector amounted to 19.8 percent at end-2015, with a steady increase from 18.6 percent at end-2014 and 17.2 percent at end-2013. Loan performance on mortgages, which account for the bulk of household lending, has been significantly better, with NPLs to the household sector relatively stable over the past four years at 7-8 percent.
11. The decline in interest rates has so far been accompanied by an offsetting fall in the cost of funding, limiting the impact on bank profitability. The significant decline in the cost of funding, reflecting a fall in the average rate on deposits as well as lower rates on interbank and central bank financing has helped offset the decrease in interest income, contributing to a small increase in banks’ net interest income in 2014-15 after large declines in 2012-2013.
12. However, going forward, limited space to further reduce the cost of deposit rates could begin to diminish bank profitability. Thus far, deposit rates have been able to adjust downwards, preserving bank profitability as lending rates decreased, but there is likely to be a lower bound below which disintermediation occurs. At the same time, Euribor-linked lending rates are likely to continue to decline; this would imply an adverse impact on bank profitability unless lending growth picks up sufficiently to offset diminishing interest margins. A recent simulation by the Bank of Portugal estimated that a 100 basis point fall in Euribor rates would have a negative cumulative impact on domestic banks’ net interest income of approximately €700 million5. Weaker profitability would, in turn, limit scope for capital-constrained banks to be more proactive in NPL resolution.
5 See “Net Interest Income – Recent Developments and Future Prospects,” in the Bank of Portugal’s May 2016 Financial Stability Report.
PORTUGAL
42 INTERNATIONAL MONETARY FUND
Figure 2. Financial Sector Developments
Interest rates on new loans have continued to decline since the beginning of 2015…
…but only household mortgage lending has shown a sign of acceleration …
…where there has not been large accumulation of NPLs.
Banks continue to move from corporate to household lending, but there is little sign of a portfolio shift away from
government securities.
The decline in lending rates has not had an adverse impact on banks’ interest margins in 2015 …
… but Euribor-linked lending rates are likely to fall further, and there could be limited scope to reduce deposit costs.
Sources: Haver Analytics; Bank of Portugal; and IMF staff calculations.
0
2
4
6
8
10
2010 2011 2012 2013 2014 2015
Banks' Interest Margin(euro billion)
0
2
4
6
8
Jan-10 Jan-11 Jan-12 Jan-13 Jan-14 Jan-15 Jan-16
Interest Rates on New Loans(percent)
NFC loans up to E1mn ECB refinancing rateHousehold mortgage loans
0
5
10
15
20
25
2009 2010 2011 2012 2013 2014 2015
Non-performing Loans(share of total loans)
NFC Households Households, mortgage loans
-10123456
Jan-10 Jan-11 Jan-12 Jan-13 Jan-14 Jan-15 Jan-16
Lending and Deposit Rates(percent, weighted average of total outstanding)
Deposits NFC loans Mortgage loans Euribor (6-mth)
0
400
800
1200
1600
0
1000
2000
3000
4000
5000
Jan-10 Jan-11 Jan-12 Jan-13 Jan-14 Jan-15 Jan-16
New Loans(euro mn, 6-mth moving avg)
NFC (left axis) Households (right axis)
0
5
10
15
20
25
30
Jan-10 Jan-11 Jan-12 Jan-13 Jan-14 Jan-15 Jan-16
Banking sector assets(share of total)
Claims on NFC Claims on householdsClaims on government
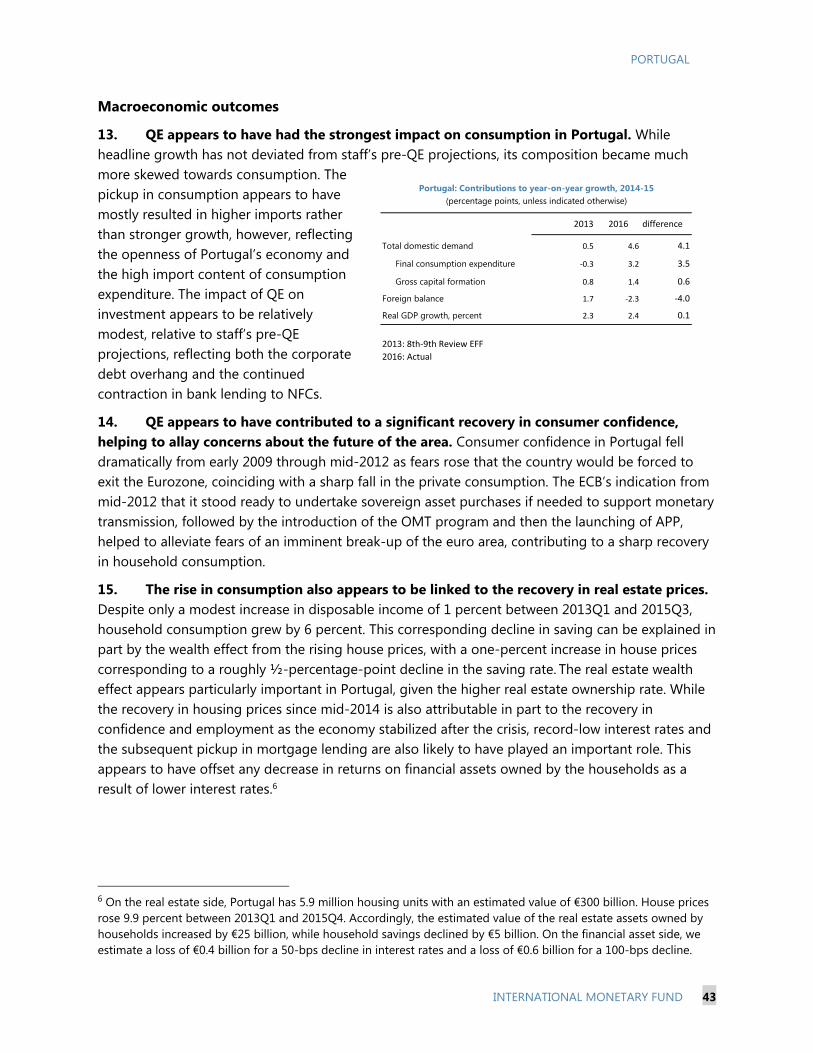
PORTUGAL
INTERNATIONAL MONETARY FUND 43
Macroeconomic outcomes
13. QE appears to have had the strongest impact on consumption in Portugal. While headline growth has not deviated from staff’s pre-QE projections, its composition became much more skewed towards consumption. The pickup in consumption appears to have mostly resulted in higher imports rather than stronger growth, however, reflecting the openness of Portugal’s economy and the high import content of consumption expenditure. The impact of QE on investment appears to be relatively modest, relative to staff’s pre-QE projections, reflecting both the corporate debt overhang and the continued contraction in bank lending to NFCs.
14. QE appears to have contributed to a significant recovery in consumer confidence, helping to allay concerns about the future of the area. Consumer confidence in Portugal fell dramatically from early 2009 through mid-2012 as fears rose that the country would be forced to exit the Eurozone, coinciding with a sharp fall in the private consumption. The ECB’s indication from mid-2012 that it stood ready to undertake sovereign asset purchases if needed to support monetary transmission, followed by the introduction of the OMT program and then the launching of APP, helped to alleviate fears of an imminent break-up of the euro area, contributing to a sharp recovery in household consumption.
15. The rise in consumption also appears to be linked to the recovery in real estate prices. Despite only a modest increase in disposable income of 1 percent between 2013Q1 and 2015Q3, household consumption grew by 6 percent. This corresponding decline in saving can be explained in part by the wealth effect from the rising house prices, with a one-percent increase in house prices corresponding to a roughly ½-percentage-point decline in the saving rate. The real estate wealth effect appears particularly important in Portugal, given the higher real estate ownership rate. While the recovery in housing prices since mid-2014 is also attributable in part to the recovery in confidence and employment as the economy stabilized after the crisis, record-low interest rates and the subsequent pickup in mortgage lending are also likely to have played an important role. This appears to have offset any decrease in returns on financial assets owned by the households as a result of lower interest rates.6
6 On the real estate side, Portugal has 5.9 million housing units with an estimated value of €300 billion. House prices rose 9.9 percent between 2013Q1 and 2015Q4. Accordingly, the estimated value of the real estate assets owned by households increased by €25 billion, while household savings declined by €5 billion. On the financial asset side, we estimate a loss of €0.4 billion for a 50-bps decline in interest rates and a loss of €0.6 billion for a 100-bps decline.
2013 2016 difference
Total domestic demand 0.5 4.6 4.1
Final consumption expenditure -0.3 3.2 3.5
Gross capital formation 0.8 1.4 0.6
Foreign balance 1.7 -2.3 -4.0
Real GDP growth, percent 2.3 2.4 0.1
2013: 8th-9th Review EFF
2016: Actual
Portugal: Contributions to year-on-year growth, 2014-15(percentage points, unless indicated otherwise)
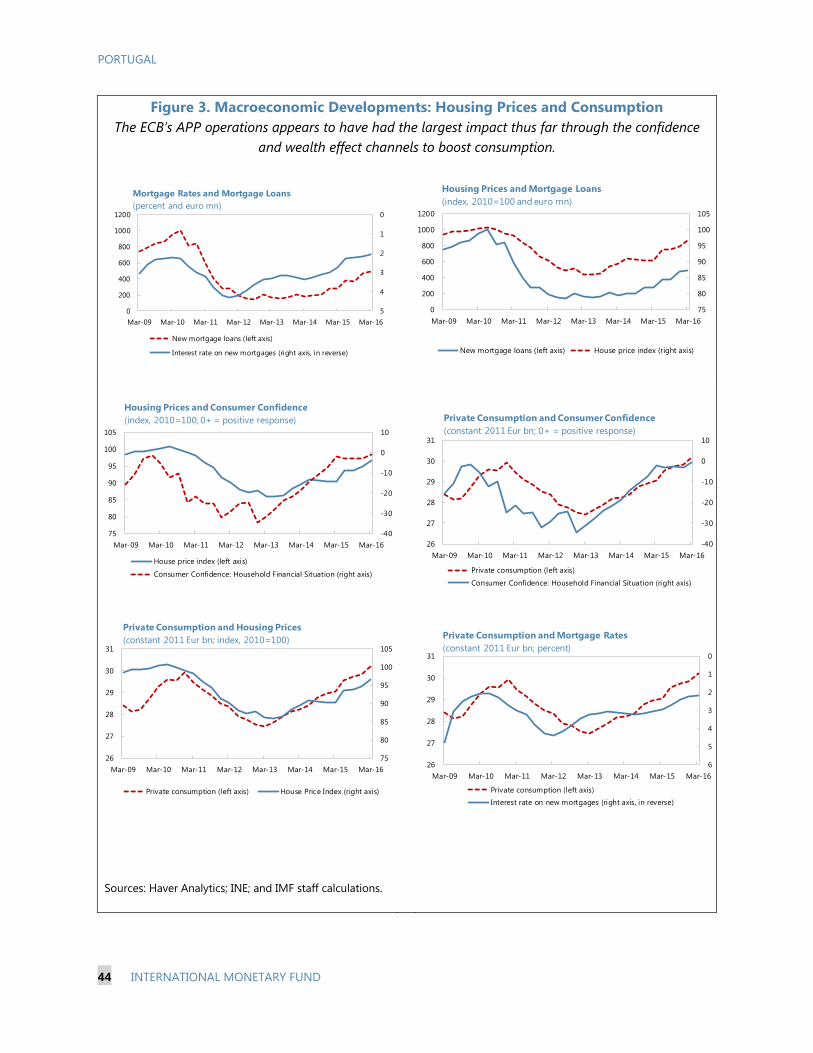
PORTUGAL
44 INTERNATIONAL MONETARY FUND
Figure 3. Macroeconomic Developments: Housing Prices and Consumption The ECB’s APP operations appears to have had the largest impact thus far through the confidence
and wealth effect channels to boost consumption.
Sources: Haver Analytics; INE; and IMF staff calculations.
-40
-30
-20
-10
0
10
75
80
85
90
95
100
105
Mar-09 Mar-10 Mar-11 Mar-12 Mar-13 Mar-14 Mar-15 Mar-16
Housing Prices and Consumer Confidence(index, 2010=100; 0+ = positive response)
House price index (left axis)
Consumer Confidence: Household Financial Situation (right axis)
75
80
85
90
95
100
105
0
200
400
600
800
1000
1200
Mar-09 Mar-10 Mar-11 Mar-12 Mar-13 Mar-14 Mar-15 Mar-16
Housing Prices and Mortgage Loans(index, 2010=100 and euro mn)
New mortgage loans (left axis) House price index (right axis)
-40
-30
-20
-10
0
10
26
27
28
29
30
31
Mar-09 Mar-10 Mar-11 Mar-12 Mar-13 Mar-14 Mar-15 Mar-16
Private Consumption and Consumer Confidence(constant 2011 Eur bn; 0+ = positive response)
Private consumption (left axis)
Consumer Confidence: Household Financial Situation (right axis)
75
80
85
90
95
100
105
26
27
28
29
30
31
Mar-09 Mar-10 Mar-11 Mar-12 Mar-13 Mar-14 Mar-15 Mar-16
Private Consumption and Housing Prices(constant 2011 Eur bn; index, 2010=100)
Private consumption (left axis) House Price Index (right axis)
0
1
2
3
4
5
626
27
28
29
30
31
Mar-09 Mar-10 Mar-11 Mar-12 Mar-13 Mar-14 Mar-15 Mar-16
Private Consumption and Mortgage Rates(constant 2011 Eur bn; percent)
Private consumption (left axis)
Interest rate on new mortgages (right axis, in reverse)
0
1
2
3
4
50
200
400
600
800
1000
1200
Mar-09 Mar-10 Mar-11 Mar-12 Mar-13 Mar-14 Mar-15 Mar-16
Mortgage Rates and Mortgage Loans(percent and euro mn)
New mortgage loans (left axis)
Interest rate on new mortgages (right axis, in reverse)
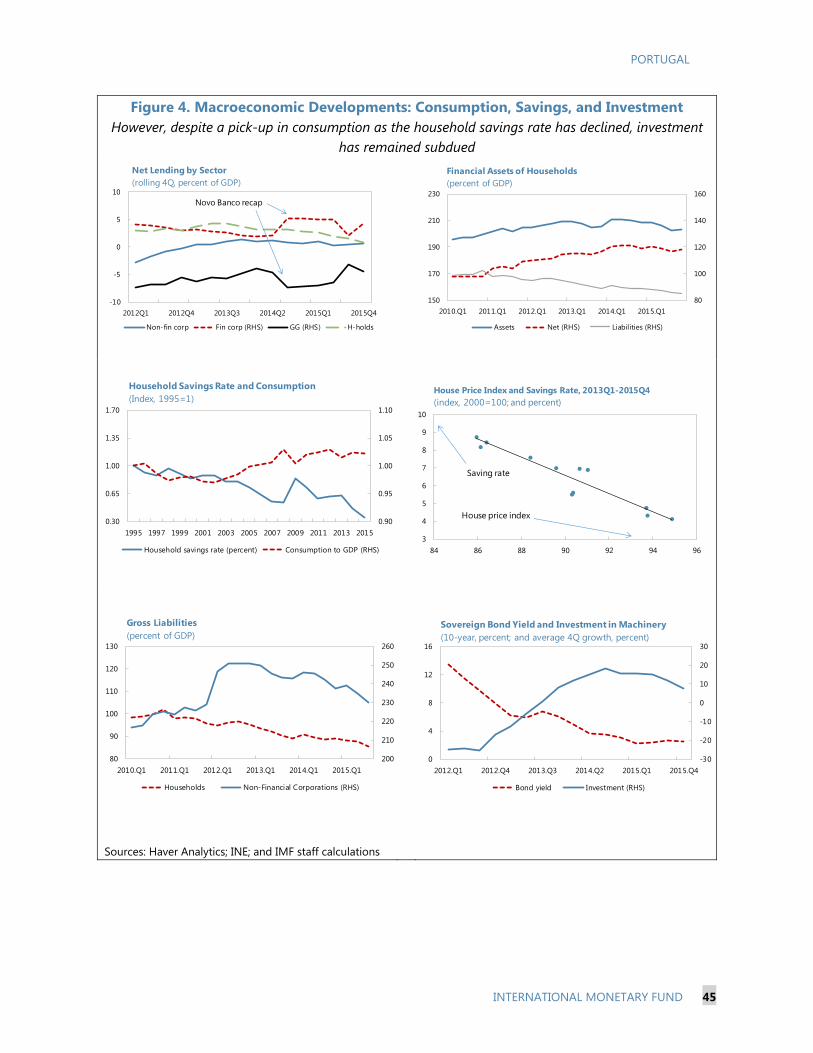
PORTUGAL
INTERNATIONAL MONETARY FUND 45
Figure 4. Macroeconomic Developments: Consumption, Savings, and Investment However, despite a pick-up in consumption as the household savings rate has declined, investment
has remained subdued
Sources: Haver Analytics; INE; and IMF staff calculations
0.90
0.95
1.00
1.05
1.10
0.30
0.65
1.00
1.35
1.70
1995 1997 1999 2001 2003 2005 2007 2009 2011 2013 2015
Household Savings Rate and Consumption(Index, 1995=1)
Household savings rate (percent) Consumption to GDP (RHS)3
4
5
6
7
8
9
10
84 86 88 90 92 94 96
House Price Index and Savings Rate, 2013Q1-2015Q4(index, 2000=100; and percent)
Saving rate
House price index
200
210
220
230
240
250
260
80
90
100
110
120
130
2010.Q1 2011.Q1 2012.Q1 2013.Q1 2014.Q1 2015.Q1
Gross Liabilities(percent of GDP)
Households Non-Financial Corporations (RHS)
-30
-20
-10
0
10
20
30
0
4
8
12
16
2012.Q1 2012.Q4 2013.Q3 2014.Q2 2015.Q1 2015.Q4
Sovereign Bond Yield and Investment in Machinery (10-year, percent; and average 4Q growth, percent)
Bond yield Investment (RHS)
-10
-5
0
5
10
2012Q1 2012Q4 2013Q3 2014Q2 2015Q1 2015Q4
Net Lending by Sector(rolling 4Q, percent of GDP)
Non-fin corp Fin corp (RHS) GG (RHS) H-holds
Novo Banco recap
80
100
120
140
160
150
170
190
210
230
2010.Q1 2011.Q1 2012.Q1 2013.Q1 2014.Q1 2015.Q1
Financial Assets of Households(percent of GDP)
Assets Net (RHS) Liabilities (RHS)
PORTUGAL
46 INTERNATIONAL MONETARY FUND
C. Conclusion
16. The APP looks to have had a positive impact on consumer confidence and mortgage lending, but the credit channel has been constrained by the corporate debt overhang. The confidence channel appears to have been particularly important in Portugal, with the ECB’s commitment to take action helping to alleviate fears of an imminent break-up of the euro area. The transmission of lower interest rates to lending activity has been primarily limited to household mortgages and consumption loans, however, as high corporate debt and rising NPLs on corporate loans have constrained lending in this segment. Overall, net lending has continued to contract as the increased availability of financing has done little to arrest the process of deleveraging in the banking system.
17. The resulting macroeconomic impact has been mostly on consumption, with limited impact on headline growth. The recovery in household confidence and pick-up in mortgage lending has contributed to a recovery in real estate prices, in turn boosting household consumption. The impact on growth has been modest, however, and is expected to fade as the household savings rate normalizes from historic lows at present. The impact on investment has been limited, meanwhile, reflecting the corporate debt overhang and rising uncertainty as a result of the standstill in efforts to address structural obstacles to growth.7
18. The ECB’s asset purchases may also have had the side effect of diminishing the sense of urgency regarding the need for fiscal adjustment. Sovereign debt purchases through the PSPP will account for a large share of Portugal’s gross bond issuance in 2015-16, providing a backstop that has alleviated financing concerns and reduced the priority attached to fiscal adjustment in order to ensure market access. As a result, the structural primary adjustment in 2015-16 is now projected to be nearly 2½ percent of GDP less than originally envisaged prior to QE.
7 ECB President Draghi, at the press conference announcing the decision to launch PSPP in January 2015, noted that: “For investment you need confidence, and for confidence you need structural reforms. The ECB has taken a further, very expansionary measure today, but it’s now up to the governments to implement these structural reforms, and the more they do, the more effective will be our monetary policy.”
PORTUGAL
INTERNATIONAL MONETARY FUND 47
References
Banco de Portugal, 2015, “An Interpretation of the Low Sovereign yields in the Euro Area,” Economic Bulletin December 2015 (Lisbon: Banco de Portugal).
Banco de Portugal, 2016, “Net Interest Income – Recent Developments and Future Prospects,” Financial Stability Report May 2016 (Lisbon: Banco de Portugal).
Berkman, P. and A. Jobst, 2015, “An Early Assessment of Quantitative Easing,” Selected Issues Paper (Washington, DC: International Monetary Fund).
Blattner, L., Farinha, L. and G. Nogueira, 2016, “The Effect of Quantitative Easing on Lending Conditions,” Banco de Portugal Working Paper March 2016 (Lisbon: Banco de Portugal).
Coeuré, B., 2015, “Embarking on Public Sector Asset Purchases,” Speech at the Second International Conference on Sovereign Bond Markets, March 10 (Frankfurt am Main: European Central Bank).
Draghi, M., 2015, “Introductory Statement to the Press Conference, January 22” (Frankfurt am Main: European Central Bank).
European Central Bank, 2013, “The Eurosystem Household Finance and Consumption Survey: Results from the First Wave,” Statistics Paper Series No. 2, April (Frankfurt/M.: European Central Bank).
European Central Bank, 2015, “The Governing Council’s Expanded Asset Purchase Programme,” Economic Bulletin Issue 1 2015, (Frankfurt/M.: European Central Bank).
European Commission, 2015, “Putting the Spring Forecast into Perspective: The ECB’s Quantitative Easing and the Euro Area Economy,” European Economic Forecast, Directorate- General for Economic and Financial Affairs, April (Brussels: European Commission), pp. 10-5.
Jobst, A. and H. Lin, 2016, “Negative Interest Rate Policy (NIRP): Implications for Monetary Transmission and Bank Profitability in the Euro Area,” IMF Working Paper No. 16/172, (Washington, DC: International Monetary Fund).
Juvenal and Wiseman, 2015, “Portugal’s Regained Market Access: Opportunities and Risks,” Selected Issues Paper (Washington, DC: International Monetary Fund).
Praet, P., 2015, “The APP Impact on the Economy and Bond Markets,” Speech at the Annual Dinner of the ECB’s Bond Market Contact Group, June 30 (Frankfurt am Main: European Central Bank).


![Imf 2013_country Report, Portugal Selected Issues Paper [January]](https://img.dokumen.tips/doc/110x75/5530cc415503465e598b48b2/imf-2013country-report-portugal-selected-issues-paper-january.jpg)