Embed Size (px)
Citation preview

Work supported in part by US Department of Energy contract DE-AC02-76SF00515.
Imaging nonequilibrium atomic vibrations with x-ray diffuse
scattering
M. Trigo∗,∗ J. Chen, and V. H. Vishwanath
PULSE Institute, SLAC National Accelerator Laboratory, Menlo Park, CA 94025, USA
Y. M. Sheu†
FOCUS Center and Department of Physics,
University of Michigan, Ann Arbor, MI 48109, USA
T. Graber and R. Henning
The Center for Advanced Radiation Sources,
University of Chicago, Chicago IL 60637, USA
D. A. Reis
PULSE Institute, SLAC National Accelerator Laboratory, Menlo Park, CA 94025, USA and
Department of Photon Science and Applied Physics,
Stanford University, Stanford, CA 94305, USA
(Dated: October 25, 2010)
Abstract
We use picosecond x-ray diffuse scattering to image the nonequilibrium vibrations of the lattice
following ultrafast laser excitation. We present images of nonequilibrium phonons in InP and InSb
throughout the Brillouin-zone which remain out of equilibrium up to nanoseconds. The results are
analyzed using a Born model that helps identify the phonon branches contributing to the observed
features in the time-resolved diffuse scattering. In InP this analysis shows a delayed increase in
the transverse acoustic (TA) phonon population along high-symmetry directions accompanied by a
decrease in the longitudinal acoustic (LA) phonons. In InSb the increase in TA phonon population
is less directional.
1
SLAC-PUB-14297
I. INTRODUCTION
The interaction of hot carriers and phonons in solids is a fundamental problem with
important technological implications. In polar semiconductors, a bottleneck in the decay of
certain phonon-modes leads to increased electron scattering from the nonthermal phonons
having a direct effect on carrier mobility and heat removal in devices1. Detailed knowledge
of the nonthermal phonon distribution has been limited by the lack of probes with sufficient
temporal and momentum resolution. In this work we present the first picosecond images
of nonequilibrium phonons throughout the Brillouin-zone in photoexcited semiconductors
using time-resolved x-ray diffuse scattering. We find that the lattice remains significantly out
of equilibrium with the delayed emission of transverse acoustic phonons up to a nanosecond
after laser excitation, even though typical phonon lifetimes are only a few picoseconds2. The
results have broader implications for the detailed understanding of dynamical properties of
materials where specific phonons in the Brillouin-zone play a defining role.
X-ray scattering is sensitive to short wavelength phonons, which reduce the intensity of
Bragg peaks as well as produce structure in the diffuse scattering background3,4. Prior x-ray
experiments on nonequilibrium phonons were limited by time-resolution5,6 or to studying rel-
atively long wavelength excitations7–9. Analysis of the equilibrium thermal diffuse scattering
(TDS) had been used to determine interatomic force constants and phonon dispersion in rel-
atively simple cases10–13 before inelastic neutron scattering became the preferred technique
to study lattice dynamics14. With the advent of intense synchrotron x-ray sources, there
was a renewed interest in TDS for measuring phonon dispersion15. In the current study,
we exploit the relatively short x-ray pulses from these sources to measure nonequilibrium
phonon dynamics in the time domain.
II. EXPERIMENTAL DETAILS
Experiments were performed at the BioCARS beamline of the Advanced Photon Source
(APS) at Argonne National Laboratory. The samples were (001)-cut single crystals of InP
and InSb. Photoexcitation of carriers was achieved using∼ 1 ps visible pulses from an optical
parametric amplifier synchronized to the x-rays from the APS. The laser pulse energy at
the sample was ∼ 62 µJ focused to a 0.14× 2.1 mm spot. well below the melting threshold
2

!
!
!"
#
"
$#%!$#
!&
0
200
400
600
800
a e 400 ps
b
c 0 ps
d 100 ps
0.01
-0.005
0.005 0
g
0
5
10
15
f 10 ns
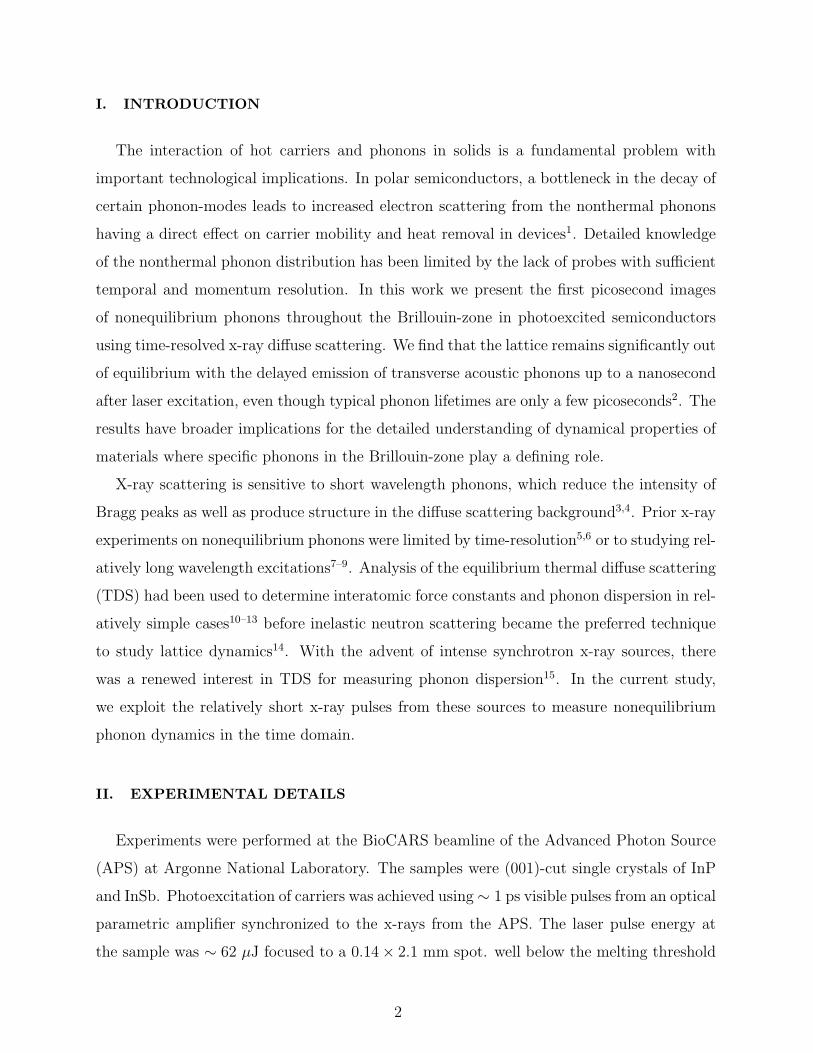
FIG. 1: (a) room temperature TDS image of InP at 15 keV oriented with (100) nearly parallel to the
x-ray direction. (b) Calculated TDS from a Born model with six nearest-neighbors forces at 15 keV
convolved with a 2 % Gaussian energy spread. (c) - (f) differences between laser-exposed and laser-
off frames at delays ∆t = 0, 100, 400 ps, and 10 ns, respectively (same scale). (g) Difference between
frames at 400 ps and 100 ps normalized by the dark image, i.e. [I(400 ps)− I(100 ps)]/I(off).
for InP and InSb and both recover fully between pulses at 40 Hz. The wavelength was
set to 640 nm for InP and 700 nm for InSb. Similar results were obtained for InP at
640 nm and 700 nm. A dual undulator setup provided an x-ray photon flux at the sample of
∼ 1010 photons/pulse with photon energies in the range 12− 15 keV in a < 4 % bandwidth.
Single 100 ps x-ray pulses were isolated by a high-speed chopper at a rate of 40 Hz. The
crystals were oriented at grazing incidence so that the x-rays were incident primarily along
(100). Typical incidence angles of α = 0.3o were used to match the volume probed by the
x-rays with the laser excitation. A large area detector (MarCCD 165 mm diameter) placed
64 mm behind the sample collected the x-rays with scattering angles of up to 2θ ∼ 51o.
In choosing the x-ray energy and crystal orientation, special care was taken to avoid Bragg
reflections on the detector.
3
III. RESULTS AND DISCUSSIONS
Figure 1 (a) shows a static baseline (without laser excitation) x-ray scattering pattern
from InP at room temperature taken with 15 keV x-ray energy. The upper half of the image is
shown, the lower half being blocked by the sample. The detector captures a large solid angle
of the Ewald sphere projected onto a plane. The intensity pattern originates primarily from
(inelastic) scattering from thermally activated phonons and shows structure that reflects the
details of the phonon dispersion in the material and the phonon population16. Figure 1 (b)
shows the calculated image using a Born model for the interatomic forces, which captures
the main observed features.
Ultrafast laser excitation initially produces a non-equilibrium state where phonons may
not be populated according to the Bose factor. The evolution of this phonon population is
encoded in the time-resolved diffuse scattering at different delays. As a function of laser-
x-ray delay, ti, we record a frame with laser exposure, I(tj), and a dark frame, I(off). In
this manner we can subtract the initial room temperature diffuse scattering as well as any
time-independent background. Figures 1 (c)− (f) show the change in the image upon laser
excitation for several representative time delays [i.e. I(tj) − I(off)]. The data I(tj) are
obtained by averaging 100 images with 100 single-pulse exposures per image. Initially, the
areas near the zone-centers brighten at t = 0 ps (c) while the scattering increases for several
hundred ps after excitation (d) and (e), before decreasing after a few ns (f), eventually
returning to equilibrium.
While most of the increase in scattering occurs on the 100 ps timescale, Figures 1 (c) - (f)
show subtle differences that suggest that thermal equilibrium has not yet been achieved. To
emphasize these differences, in Fig. 1 (g) we plot I(400 ps)− I(100 ps) normalized by I(off).
If the lattice were in thermal equilibrium, Fig. 1 (g) would be uniform (in the classical limit)
and proportional to the relative difference in temperature T (400 ps)− T (100 ps). However,
the nontrivial pattern shows areas where the relative scattering increases (bright) and areas
where it decreases (dark) and suggests that a more complex nonthermal dynamics in the
phonon population is taking place where some phonon modes deplete while others continue
to populate even at 400 ps.
In order to understand which phonons contribute to the diffuse scattering images at
4

scattering vector Q, we consider the intensity of one-phonon scattering16,
I1(Q) ∝∑j
1
ωj(q)
(nj(q) +
1
2
)|Fj(Q)|2 , (1)
where ωj(q) is the frequency of the phonon mode in branch j with reduced wavevector q,
nj(q) is its population and Fj(Q) is
Fj(Q) =∑s
fs√ms
e−Ms(Q · es,j,q)e−iKQ·rs . (2)
In this expression, fs, ms, Ms are the atomic scattering factor, the mass, and the Debye-
Waller factor17 of atom s at position rs, es,j,q is the phonon polarization vector, and KQ
is the closest reciprocal lattice vector to Q, i.e. Q = q + KQ. In Eq. (1) we omitted
additional slowly varying factors from the polarization dependence of the scattering as well
as geometrical factors16.
Eq. (1) gives a strong contribution from acoustic modes near the center of the Brillouin
zone where their frequency goes to zero. These low-frequency phonons give rise to the four
brightest diffuse spots in Fig. 1 (a). Directions in reciprocal space where the dispersion
relation is soft appear in Fig. 1 (a) as bright lines connecting the near-zone-center spots.
Furthermore, the quantity Fj(Q) in Eq. (2) has the form of a structure factor modified
by the dot product (Q · es,j,q), which selects phonon modes polarized along the scattering
vector. Finally, the eight small spots of a few pixels in diameter in Fig. 1 (a) [not present
in the calculated image, Fig. 1 (b)] are crystal surface truncation rods and are well known
from surface diffraction18.
Equations (1) and (2) can be used to compute the TDS if the phonon frequencies and
eigenvectors are known. To gain insight on the different phonon contributions we implement
a Born model of the lattice dynamics. For each vector Q, we construct the dynamical matrix
D(Q) using force constants up to six nearest neighbors. Details of the implementation of
the model can be found in Refs.19,20. The phonon polarization and frequencies in Eq. (1)
and (2) are obtained from the eigenvalues and eigenvectors of D(Q). The 28 parameters
that represent the real space covalent forces for InP and InSb were taken from Refs.21
and22 respectively. This model ignores the ionic component of the forces and thus does not
reproduce the phonon dispersion with all detail, particularly it does not give a splitting of the
LO and TO phonons at zone-center for the zinc-blende structure. However the insight gained
is extremely valuable for understanding the static diffuse images particularly in separating
5
the contributions from transverse (TA) and longitudinal (LA) acoustic phonons. As we see
in Fig. 1 (b), the calculation agrees well with the static measurements and reproduces the
main features.
To help identify the phonons responsible for the nonequilibrium behavior, we performed
singular value decomposition (SVD) of the time-resolved data, I(tj)−I(off). The procedure
is as follows. We write each difference frame I(tj) − I(off) as a column vector xj and
construct the matrix X whose columns are the vectors xj. Thus, adjacent columns of X
correspond to consecutive frames in the time-delay series. The SVD states that X = USVT ,
where S = diag(si) is the diagonal matrix of singular values with si ≥ 0, and U and V
are orthogonal matrices whose columns, uj and vj, are the left and right singular vectors,
respectively. The vectors uj represent time-independent “populations”, and form a complete
orthonormal basis. The vectors vj contain the time-dependent information of each of the
populations and also form an orthonormal basis. The singular values {si} act as weight
factors for these vectors and represent the amount of “signal” contained in each singular
vector in the reconstructed data. This method has been applied successfully to a wide set
of problems from small angle scattering23 and the analysis of spectroscopic data24 to time-
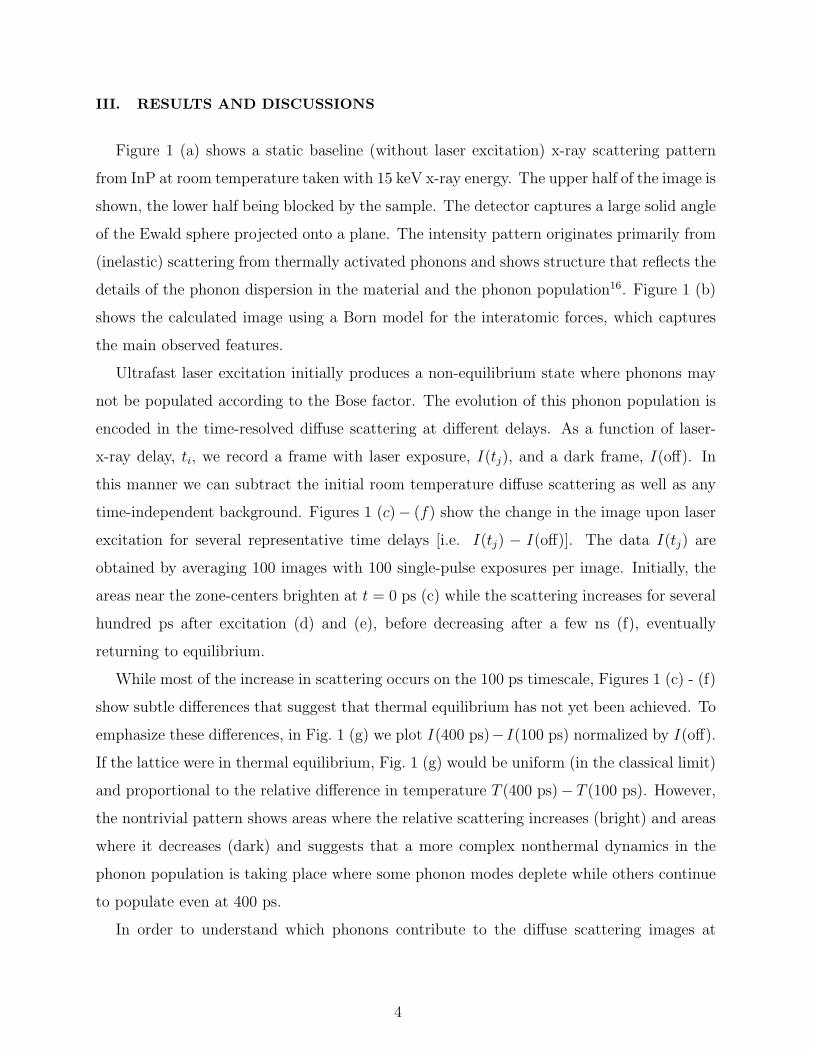
resolved Laue diffraction of protein crystals25. In Fig. 2 we summarize the results of the SVD
analysis for both InP [(a) and (b)] and InSb [(c) and (d)]. The truncation rods were masked
out to avoid artifacts from saturated pixels. Due to the larger lattice constant, the data for
InSb were taken at 13 keV to match the same reciprocal space coverage on the detector as
InP at 15 keV. On the left we show the lSV for the two most significant SV, while on the right
we plot the corresponding rSV scaled by the corresponding SV. Singular values for which
the rSV showed comparable amplitudes for t < 0 and t > 0 were considered comparable
to the noise. Under this truncation criteria only the first two singular vectors shown in
Fig. 2 are statistically significant. For both materials, much of the signal is contained in the
first singular vector [Fig. 2 (a) and (c)], the time dependence of which consists of a sharp
increase in the diffuse scattering that decays in few ns time scale (Fig. 2 (a) and (c) right
panels). The image from this lSV resembles the equilibrium image, which suggests this lSV
corresponds to lattice heating and diffusion that decays within a time-scale of few ns.
The second singular vectors however show a more complex behavior both in reciprocal
space as well as in the time domain. In the case of InP, the lSV [Fig. 2 (b) (left)] shows
sharp bright and dark areas indicating that parts of the image brighten while other areas
6

0
500
1000
1500
!200
!100
0
100b
a
0
500
1000
!2 0 2 4 6 8 10
!100
0
100
Time delay [ns]
lSV rSVInP
InSb
SV
x rS
VS
V x
rSV
c
d
!0.01 0 0.01
FIG. 2: Results of the singular value decomposition analysis of the time-resolved data. The
procedure decomposes the data as a sum of individual images (lSV) (left) each with a corresponding
time dependence (rSV) scaled by the corresponding SV (right). (a) and (b) correspond to the two
most significant singular values for InP and (c) and (d) for InSb.
decrease their scattering. The fact that the rSV [Fig. 2 (b) (right)] increases only after
t ≈ 400 ps means that the corresponding pattern on the left continues increasing after
the initial excitation. This is indicative of non-equilibrium phonon dynamics that lead to
a delayed heating and cooling of different parts of the Brillouin-zone. A similar delayed
behavior is observed in InSb as seen in Fig. 2 (d) (right), which shows a maximum increase
at ∼ 4 ns. We attribute this behavior to relaxation of non-equilibrium phonon populations.
Although the (equilibrium) TDS distributions for InP and InSb are similar, as well as the
first singular vector in Fig. 2 (a) and (c), which reflects similarities in the phonon dispersion,
the difference in the second lSV is quite remarkable and cannot be explained by differences
in the equilibrium phonon dispersion alone. It is instructive to separate the contribution
from different phonon branches to the diffuse scattering. Each phonon branch contributes
7
a
−8 −6 −4 −2 0 2 4 6 8x 10 −3
LA TA
b
c
d
e
f
(133)(022)
(131)
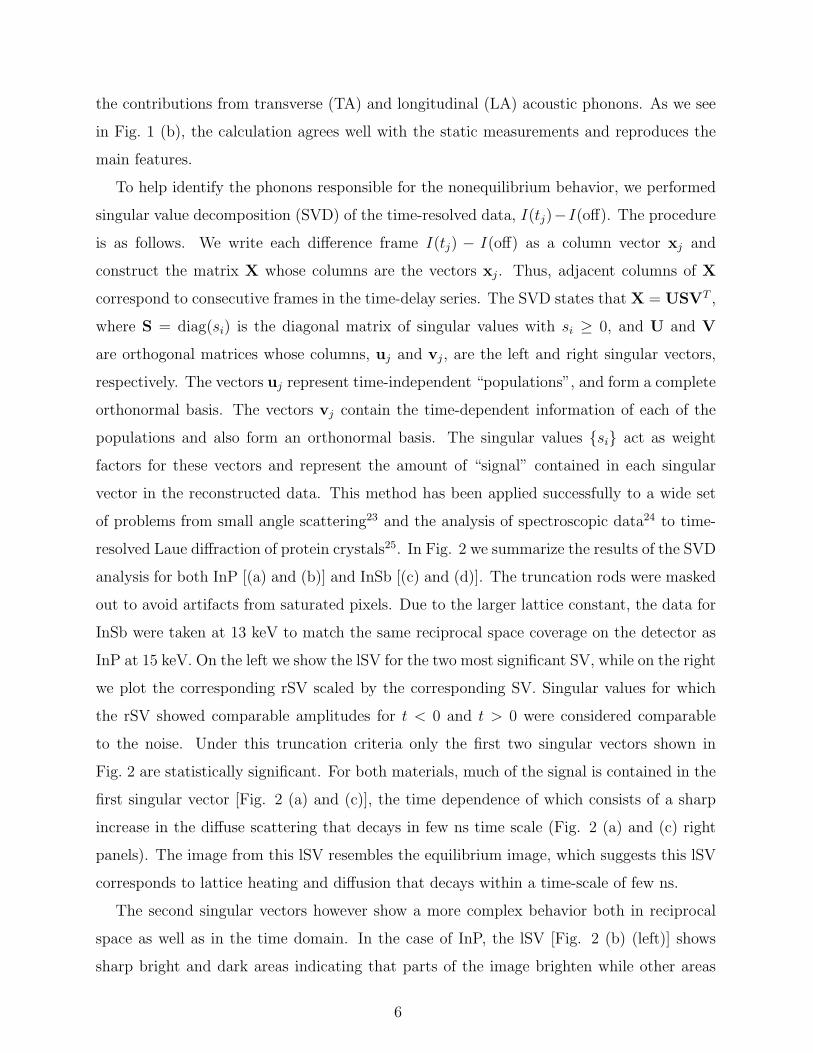
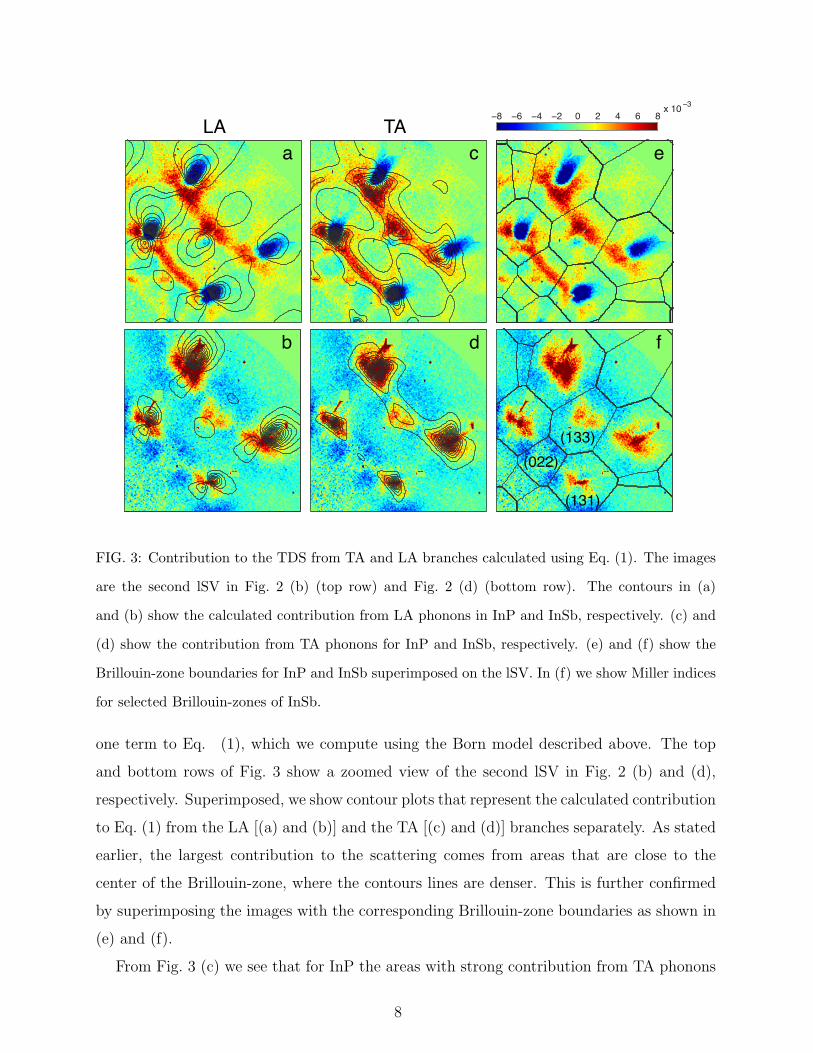
FIG. 3: Contribution to the TDS from TA and LA branches calculated using Eq. (1). The images
are the second lSV in Fig. 2 (b) (top row) and Fig. 2 (d) (bottom row). The contours in (a)
and (b) show the calculated contribution from LA phonons in InP and InSb, respectively. (c) and
(d) show the contribution from TA phonons for InP and InSb, respectively. (e) and (f) show the
Brillouin-zone boundaries for InP and InSb superimposed on the lSV. In (f) we show Miller indices
for selected Brillouin-zones of InSb.
one term to Eq. (1), which we compute using the Born model described above. The top
and bottom rows of Fig. 3 show a zoomed view of the second lSV in Fig. 2 (b) and (d),
respectively. Superimposed, we show contour plots that represent the calculated contribution
to Eq. (1) from the LA [(a) and (b)] and the TA [(c) and (d)] branches separately. As stated
earlier, the largest contribution to the scattering comes from areas that are close to the
center of the Brillouin-zone, where the contours lines are denser. This is further confirmed
by superimposing the images with the corresponding Brillouin-zone boundaries as shown in
(e) and (f).
From Fig. 3 (c) we see that for InP the areas with strong contribution from TA phonons
8
appear bright in the lSV, while areas with more contribution from the LA branch [Fig. 3
(a)] appear dark. This lSV has the time-dependence shown in the right panel of Fig. 2 (b),
which means that even at time-delays t > 400 ps TA phonons are still populating while
the LA branch population decreases. In InSb the situation is different. The LA branch
shows no appreciable decrease in scattering above the noise level [Fig. 3 (b)], while the
TA branches populate delayed [Fig. 3 (d)]. In Fig. 3 (f) we indicate the Miller indices of
selected Brillouin-zones for InSb at 13 keV. Note that at this energy the number and size of
Brillouin zones covered by the detector in InSb is similar to InP at 15 keV. We can assign
the InP TA phonons in Fig. 3 (c) to modes with q approximately along the high-symmetry
〈111〉 and 〈010〉 directions. InSb on the other hand shows a less directional scattering from
the TA branches, indicating that the population is distributed more isotropically within the
Brillouin-zone. We attribute this difference to the large gap between the optical and acoustic
modes in InP, which leads to less available phonon decay channels2.
IV. CONCLUSIONS
We have shown that time-resolved non-thermal x-ray diffuse scattering yields heretofore
inaccessible information of the non-equilibrium dynamics of solids under ultrafast excita-
tion. InP and InSb show complex non-equilibrium redistributions of the scattered intensity
throughout the Brillouin-zone that are clearly separated by singular value decomposition.
This non-equilibrium lattice persists up to several hundred ps. This behavior is interpreted
using a Born model which reveals that TA phonons populate several hundred ps after initial
laser excitation and, in the case of InP, is very directional and appears concomitant with a
decrease in the scattering by LA phonons. In the current study, we are limited to dynam-
ics that occur on more than 100 ps time-scale due to the x-ray pulse duration. We note
that measurements of the initial emission of hot phonons by the photoexcited carriers and
their subsequent anharmonic decay will become possible with new x-ray sources such as the
Linac Coherent Light Source at SLAC. As these new sources of ultra-bright femtosecond
x-ray pulses come online, x-ray diffuse scattering becomes a promissing approach to explore
the ultrafast dynamics of solids under laser excitation at the femtosecond time-scale.
9

V. ACKNOWLEDGEMENTS
We acknowledge S. Ghimire for experimental assistance and H. Dosch and T. C. Chiang
for fruitful discussions. This research is supported through the PULSE Institute at the SLAC
National Accelerator Laboratory by the U.S. Department of Energy, Office of Basic Energy
Sciences. V. H. V. was supported by the Air Force Office of Science Research under contract
FA9550-08-1-0340 from the Multidisciplinary University Research Initiative Program. Use
of the Advanced Photon Source was supported by the U.S. Department of Energy, Basic
Energy Sciences, Office of Science, under Contract No. DE-AC02-06CH11357. Use of the
BioCARS Sector 14 was supported by the National Institutes of Health, National Center
for Research Resources, under grant number RR007707. The time-resolved set-up at Sector
14 was funded in part through a collaboration with Philip Anfinrud (NIH/NIDDK).
† currently at Los Alamos National Laboratory
1 Jing Chen, J. B. Khurgin, and R. Merlin, Appl. Phys. Lett. 80, 2901 (2002).
2 A. Debernardi, Phys. Rev. B 57, 12847 (1998).
3 R. James, Optical Principles of the Diffraction of X-Rays (G. Bell, London, 1954).
4 B. E. Warren, X-Ray Diffraction (Dover, New York, 1969).
5 D. B. McWhan, P. Hu, M. A. Chin, and V. Narayanamurti, Phys. Rev. B 26, 4774 (1982).
6 L. D. Chapman, S. M. Hsieh, and R. Colella, Phys. Rev. B 30, 1094 (1984).
7 S. D. LeRoux, R. Colella, and R. Bray, Phys. Rev. Lett. 35, 230 (1975).
8 D. A. Reis and A. M. Lindenberg, in Light Scattering in Solids IX, Topics in Applied Physics,
edited by M. Cardona and R. Merlin (Springer, 2007), vol. 108, pp. 371–422.
9 M. Trigo and D. Reis, MRS Bulletin 35 (2010).
10 R. E. Joynson, Phys. Rev. 94, 851 (1954).
11 E. H. Jacobsen, Phys. Rev. 97, 654 (1955).
12 H. Cole, Journal of Applied Physics 24, 482 (1953).
13 H. Cole and B. E. Warren, Journal of Applied Physics 23, 335 (1952).
14 B. N. Brockhouse and A. T. Stewart, Phys. Rev. 100, 756 (1955).
10

15 M. Holt, Z. Wu, Hawoong Hong, P. Zschack, P. Jemian, J. Tischler, Haydn Chen, and T.-C.
Chiang, Phys. Rev. Lett. 83, 3317 (1999).
16 Ruqing Xu and Tai C. Chiang, Z. Kristallogr. 220, 1009 (2005).
17 J. F. Vetelino, S. P. Gaur, and S. S. Mitra, Phys. Rev. B 5, 2360 (1972).
18 I. K. Robinson, Phys. Rev. B 33, 3830 (1986).
19 Helen M. J. Smith, Phil. Trans. Roy. Soc. Lond. 241, 105 (1948).
20 Frank Herman, J. Phys. Chem. Solids 8, 405 (1959).
21 H.-M. Kagaya and T. Soma, phys. stat. sol. (b) 121, K113 (1984).
22 T. Soma and H. Matsuo Kagaya, phys. stat. sol. (b) 118, 245 (1983).
23 Shigeru Okamoto and Shinichi Sakurai, Journal of Applied Crystallography 36, 982 (2003).
24 Eric R. Henry, Biophysics Journal 72, 652 (1997).
25 Marius Schmidt, Sudarshan Rajagopal, Zhong Ren, and K. Moffat, Biophysics Journal 84, 2112
(2002).
11