Embed Size (px)
Citation preview
Imaging Core Laboratory
April, 2008
Barry Siegel, MD
ACRIN Core Laboratory
ACRIN Experience with Quantitative
PET
ACRIN Core Laboratory
Professor of Radiology and Chief of the Division of PET/Nuclear
Medicine
Mallinckrodt Institute of Radiology
Washington University School of Medicine
St. Louis, Missouri
Mitchell Schnall MD, PhD
Barry A. Siegel, M.D.
Joel Karp, PhD
ACRIN Background
• NCI funded collaborative group with a
mission to perform multicenter trials of
imaging
• Originally funded in 1999
• Accrued over 75,000 patients in over 25 trials
Imaging Core Laboratory
• Accrued over 75,000 patients in over 25 trials
at over 100 sites
• Trials of image detection, characterization,
therapeutic guidance, monitoring (including
clinical outcomes)
• Trials including multiple modalities: CT, MR,
PET, SPECT, Mammography, and Ultrasound
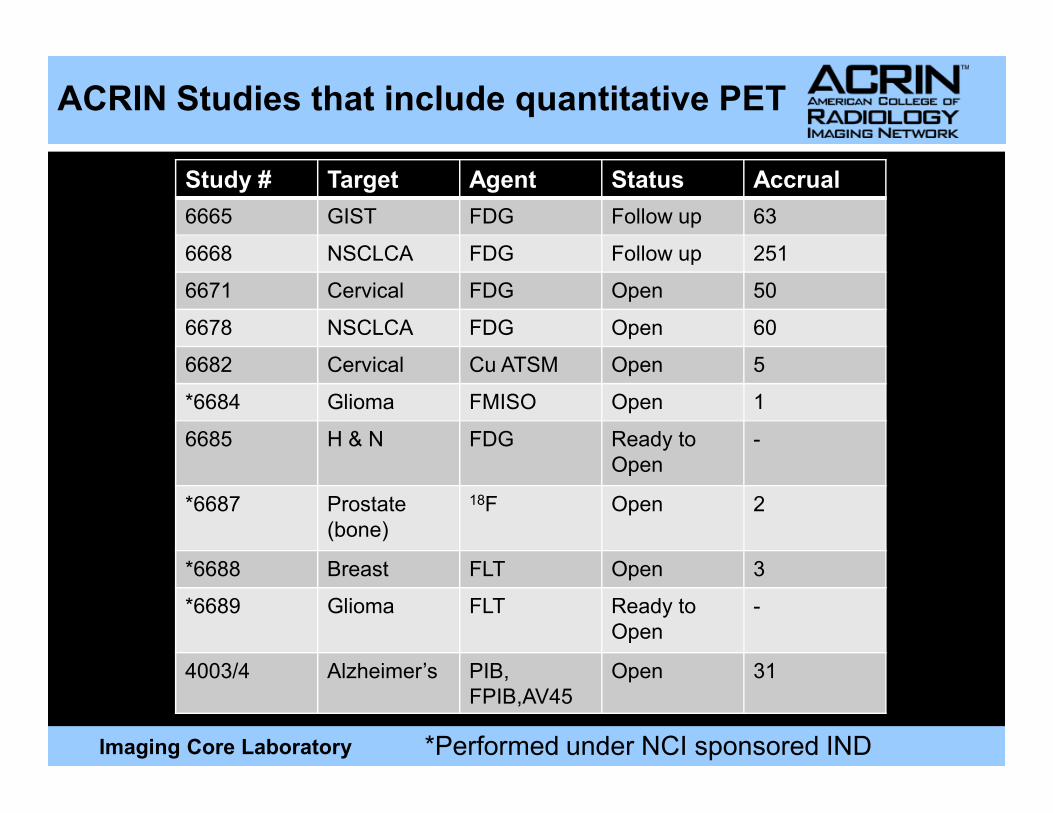
Study # Target Agent Status Accrual
6665 GIST FDG Follow up 63
6668 NSCLCA FDG Follow up 251
6671 Cervical FDG Open 50
6678 NSCLCA FDG Open 60
6682 Cervical Cu ATSM Open 5
*6684 Glioma FMISO Open 1
ACRIN Studies that include quantitative PET
Imaging Core Laboratory
*6684 Glioma FMISO Open 1
6685 H & N FDG Ready to
Open
-
*6687 Prostate
(bone)
18F Open 2
*6688 Breast FLT Open 3
*6689 Glioma FLT Ready to
Open
-
4003/4 Alzheimer’s PIB,
FPIB,AV45
Open 31
*Performed under NCI sponsored IND
Lessons Learned
• Quality Control
� Qualification
� Ongoing Quality Control
•
Imaging Core Laboratory
• Accrual
� Site recuritment
• Trial Design/Qualification Strategy
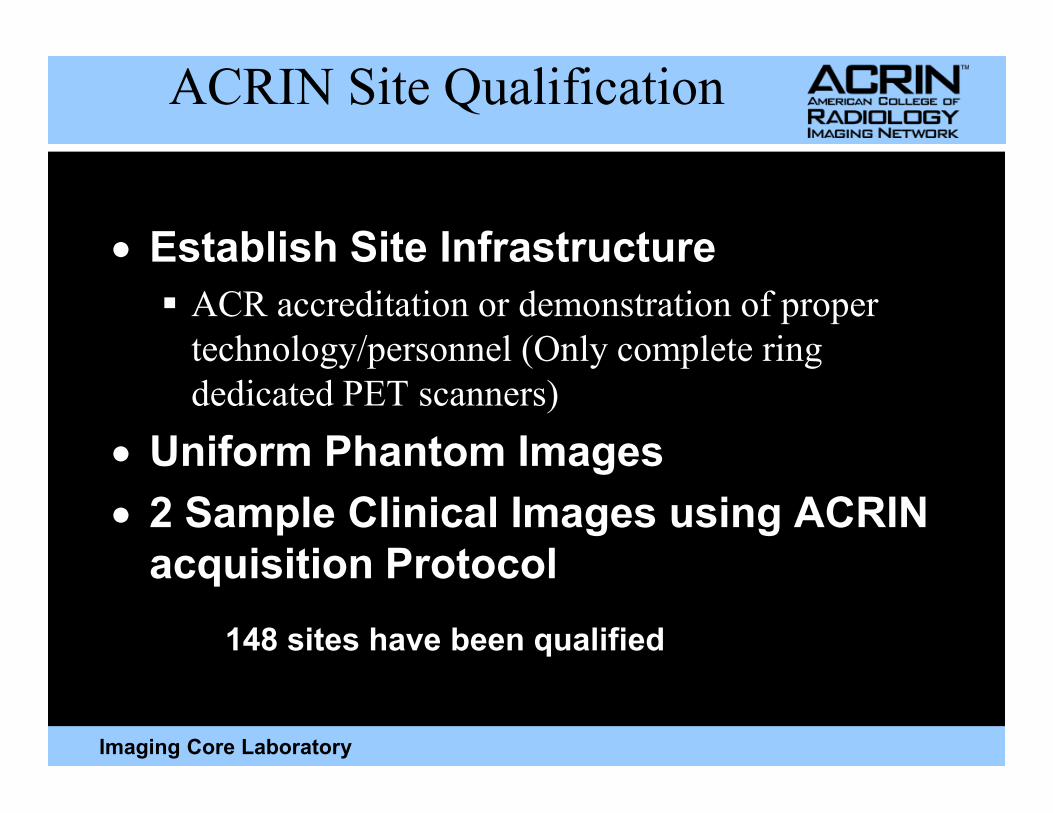
ACRIN Site Qualification
• Establish Site Infrastructure
� ACR accreditation or demonstration of proper
technology/personnel (Only complete ring
dedicated PET scanners)
Imaging Core Laboratory
dedicated PET scanners)
• Uniform Phantom Images
• 2 Sample Clinical Images using ACRIN
acquisition Protocol
148 sites have been qualified
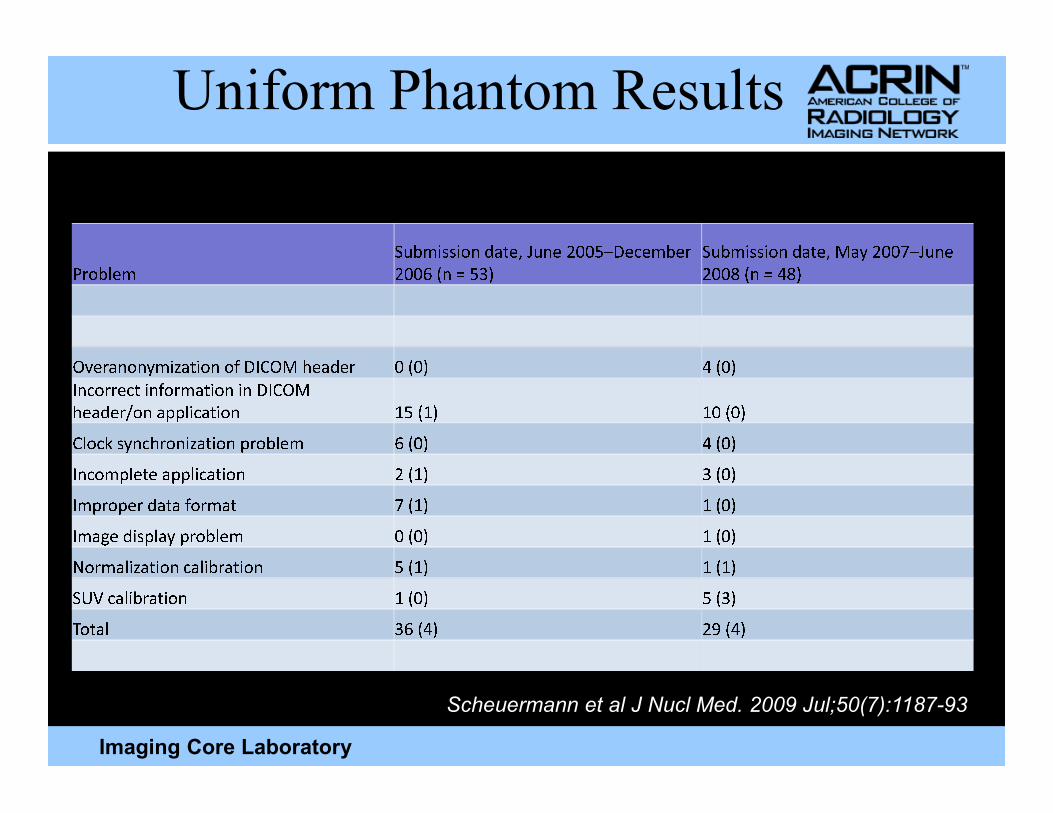
Uniform Phantom Results
Pr o b le m Su b m is s i o n da te, J u ne 2 0 0 5– De ce m be r2 0 0 6 ( n= 5 3 ) Su b m is s i o n da te, M a y 2 0 0 7– J u ne2 0 0 8 ( n= 4 8 )
Ov e r a n o n y m iz a t i o n o f D I C O M he a de r 0 ( 0 ) 4 ( 0 )I n c or r e c t i n f or ma t i o n i n D I C O Mh d / l i t i 1 5 ( 1 ) 1 0 ( 0 )
Imaging Core Laboratory
he a de r / o n a p p l i ca t i o n 1 5 ( 1 ) 1 0 ( 0 )C l o c k s y n c h r o n iz a t i o n pr o b le m 6 ( 0 ) 4 ( 0 )I n c o m p le te a p p l i ca t i o n 2 ( 1 ) 3 ( 0 )I m pr o pe r da ta f or ma t 7 ( 1 ) 1 ( 0 )I ma ge d is p l a y pr o b le m 0 ( 0 ) 1 ( 0 )N or ma l iz a t i o n ca l i br a t i o n 5 ( 1 ) 1 ( 1 )S U V ca l i br a t i o n 1 ( 0 ) 5 ( 3 )T o ta l 3 6 ( 4 ) 2 9 ( 4 )
Scheuermann et al J Nucl Med. 2009 Jul;50(7):1187-93
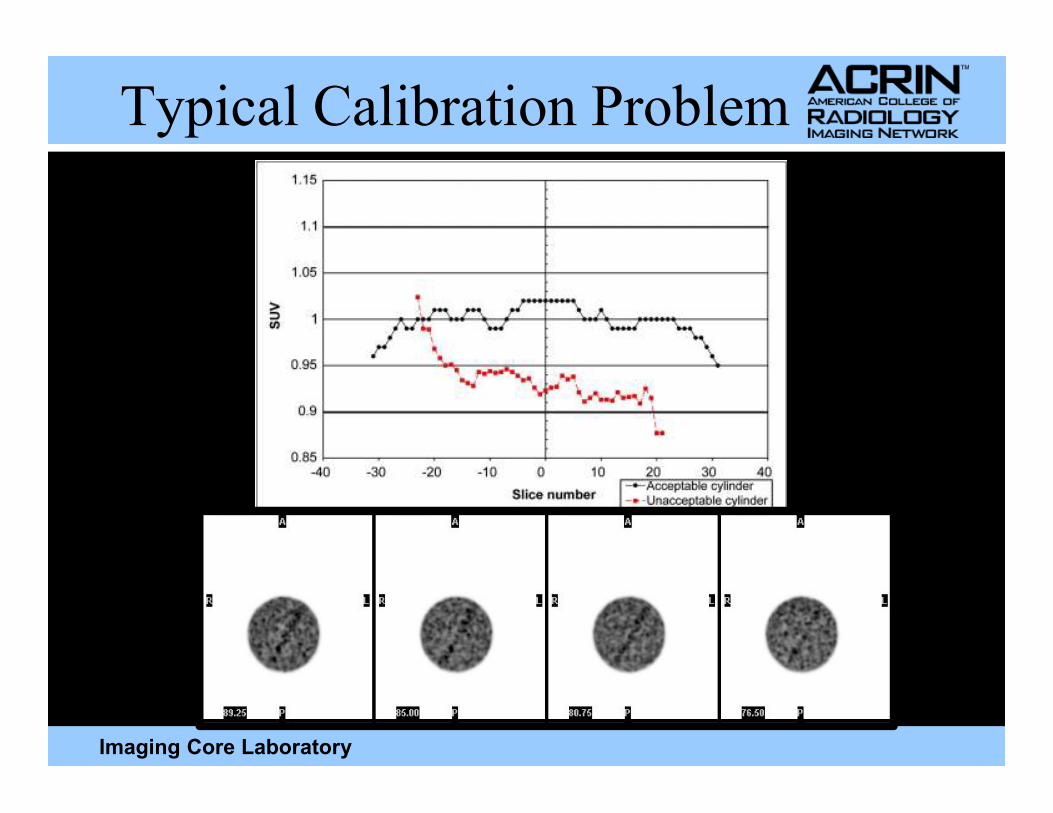
Typical Calibration Problem
Imaging Core Laboratory
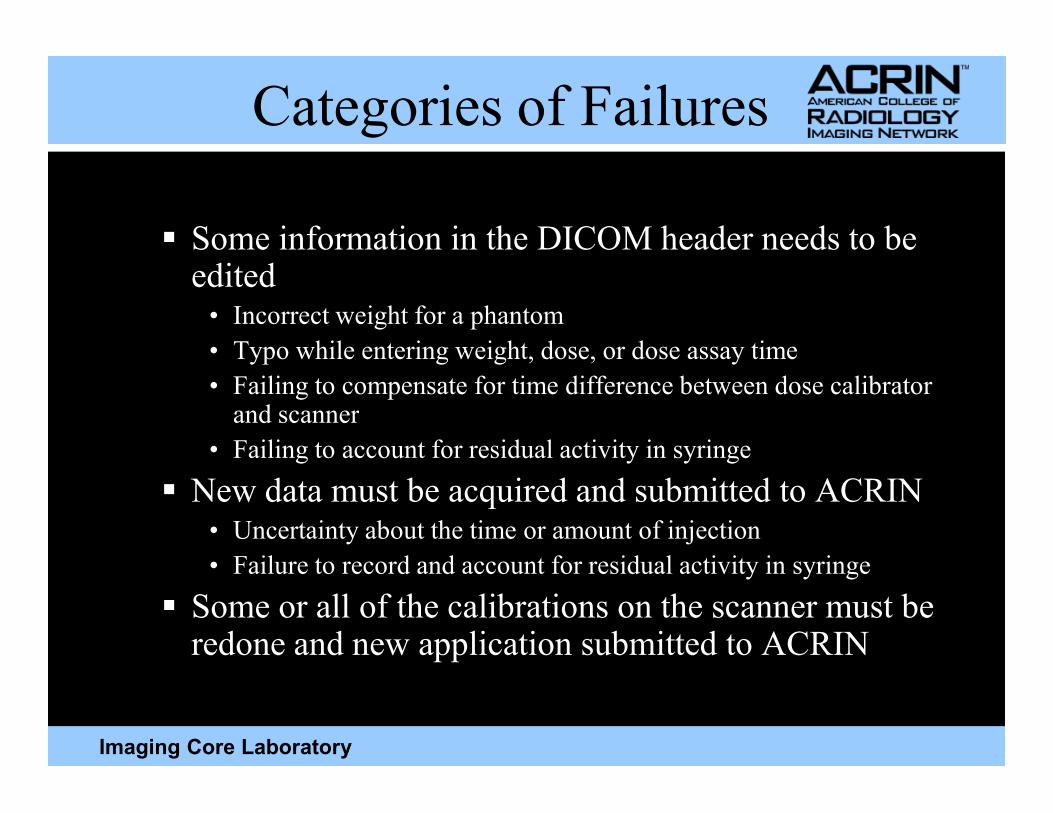
Categories of Failures
� Some information in the DICOM header needs to be edited• Incorrect weight for a phantom
• Typo while entering weight, dose, or dose assay time
• Failing to compensate for time difference between dose calibrator and scanner
Imaging Core Laboratory
and scanner
• Failing to account for residual activity in syringe
� New data must be acquired and submitted to ACRIN• Uncertainty about the time or amount of injection
• Failure to record and account for residual activity in syringe
� Some or all of the calibrations on the scanner must be redone and new application submitted to ACRIN
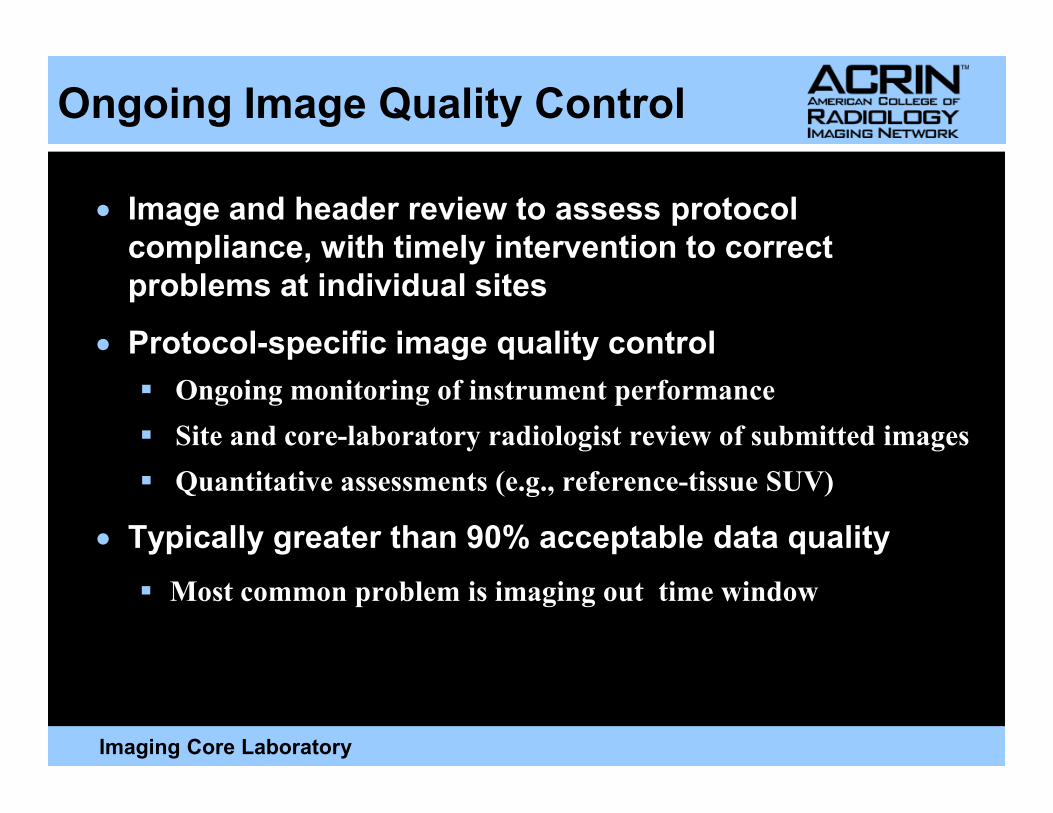
• Image and header review to assess protocol
compliance, with timely intervention to correct
problems at individual sites
• Protocol-specific image quality control
� Ongoing monitoring of instrument performance
Ongoing Image Quality Control
Imaging Core Laboratory
� Site and core-laboratory radiologist review of submitted images
� Quantitative assessments (e.g., reference-tissue SUV)
• Typically greater than 90% acceptable data quality
� Most common problem is imaging out time window
Analysis
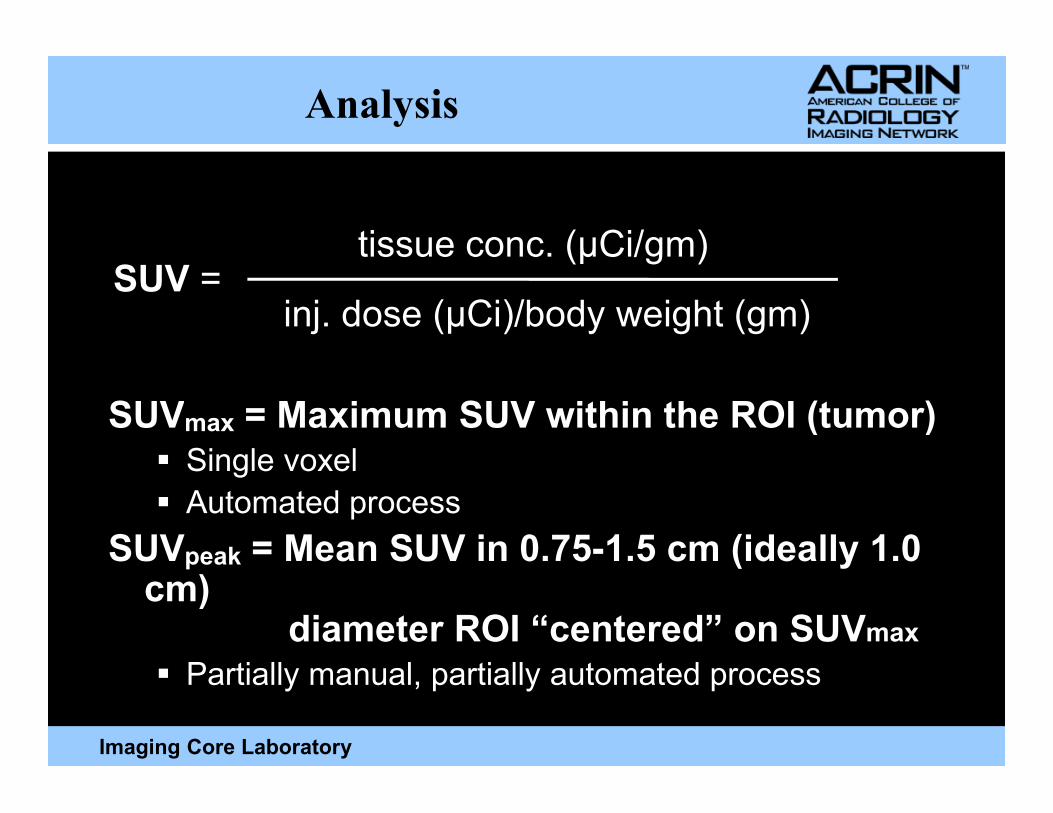
SUV = Maximum SUV within the ROI (tumor)
tissue conc. (µCi/gm)SUV =
inj. dose (µCi)/body weight (gm)
Imaging Core Laboratory
SUVmax = Maximum SUV within the ROI (tumor)� Single voxel
� Automated process
SUVpeak = Mean SUV in 0.75-1.5 cm (ideally 1.0 cm)
diameter ROI “centered” on SUVmax� Partially manual, partially automated process
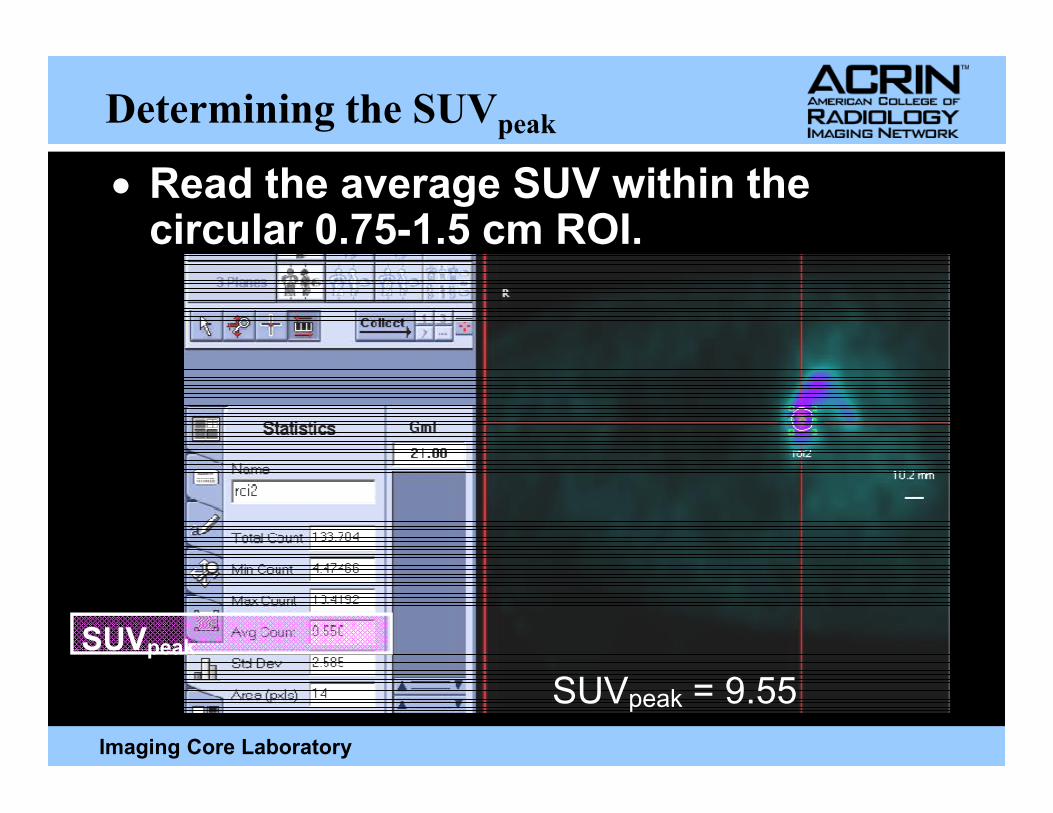
Determining the SUVpeak
• Read the average SUV within the circular 0.75-1.5 cm ROI.
Imaging Core Laboratory
SUVpeak
SUVpeak = 9.55
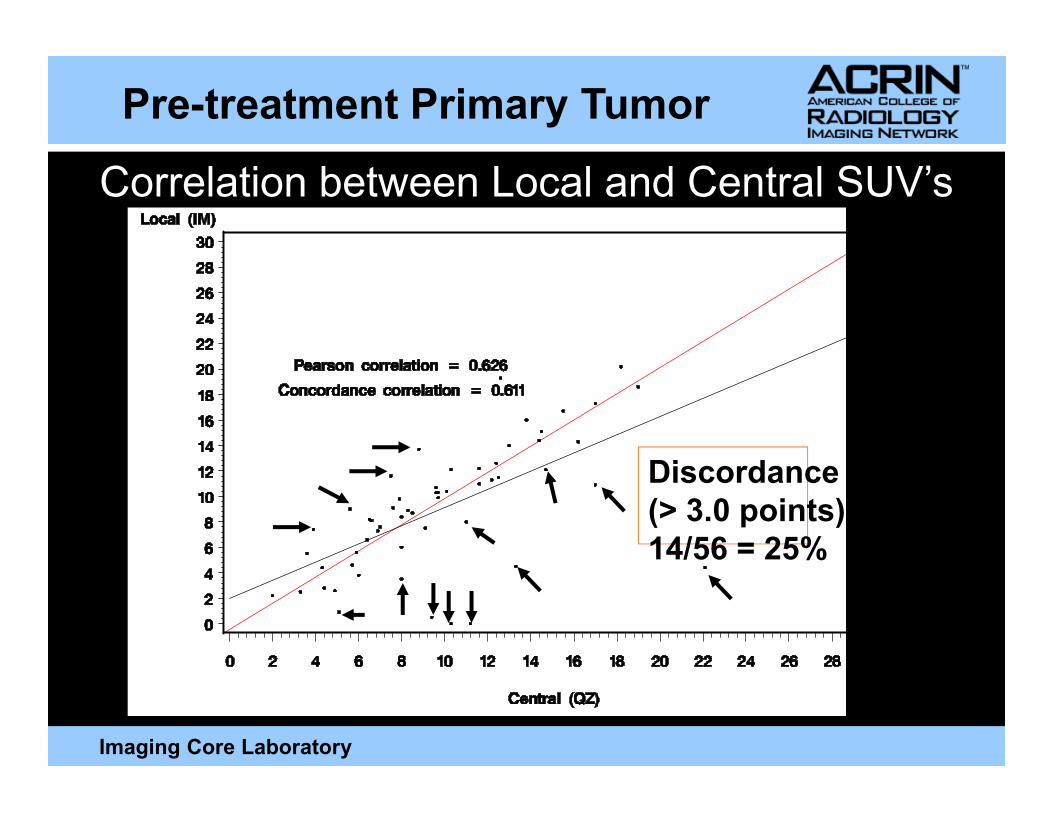
Pre-treatment Primary Tumor
Correlation between Local and Central SUV’s
Imaging Core Laboratory
Discordance
(> 3.0 points):
14/56 = 25%
15
20
25
30
35
R1
R2
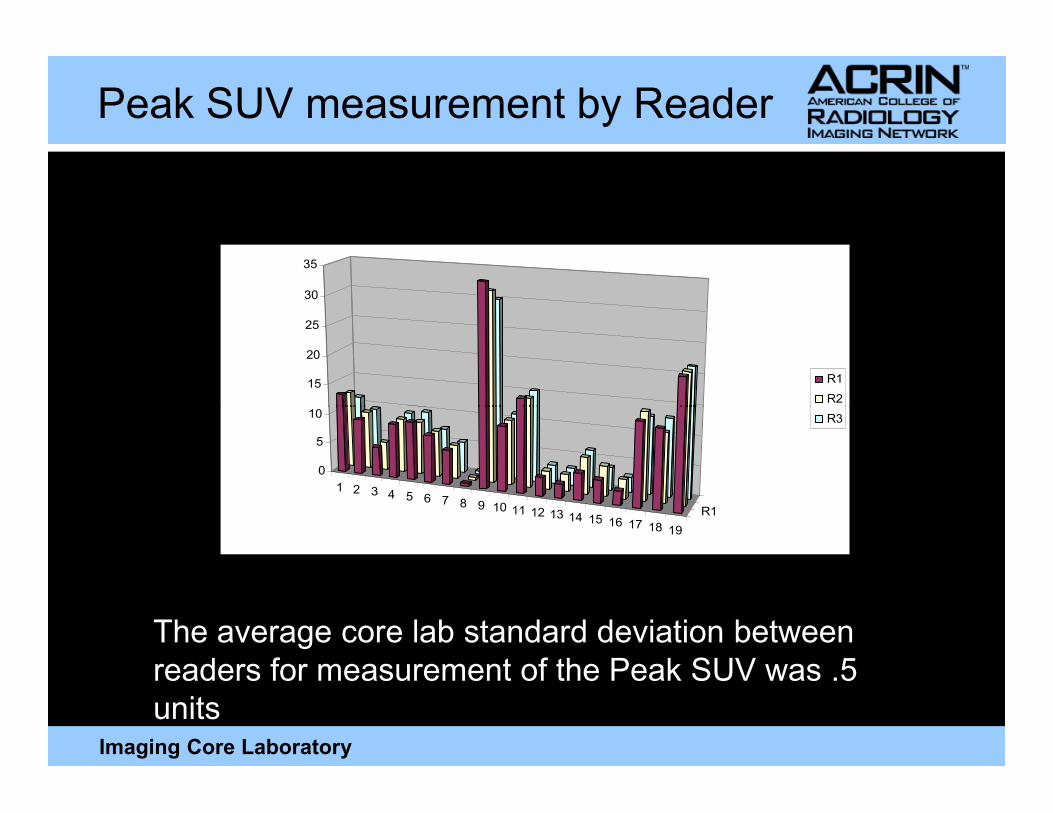
Peak SUV measurement by Reader
Imaging Core Laboratory
1 2 3 4 5 6 7 8 9 10 11 12 13 14 15 16 17 18 19
R1
0
5
10 R3
The average core lab standard deviation between
readers for measurement of the Peak SUV was .5
units
-0.4
-0.2
0
0.2
0.4
0.6
0.8
1
Percent Peak SUV
response
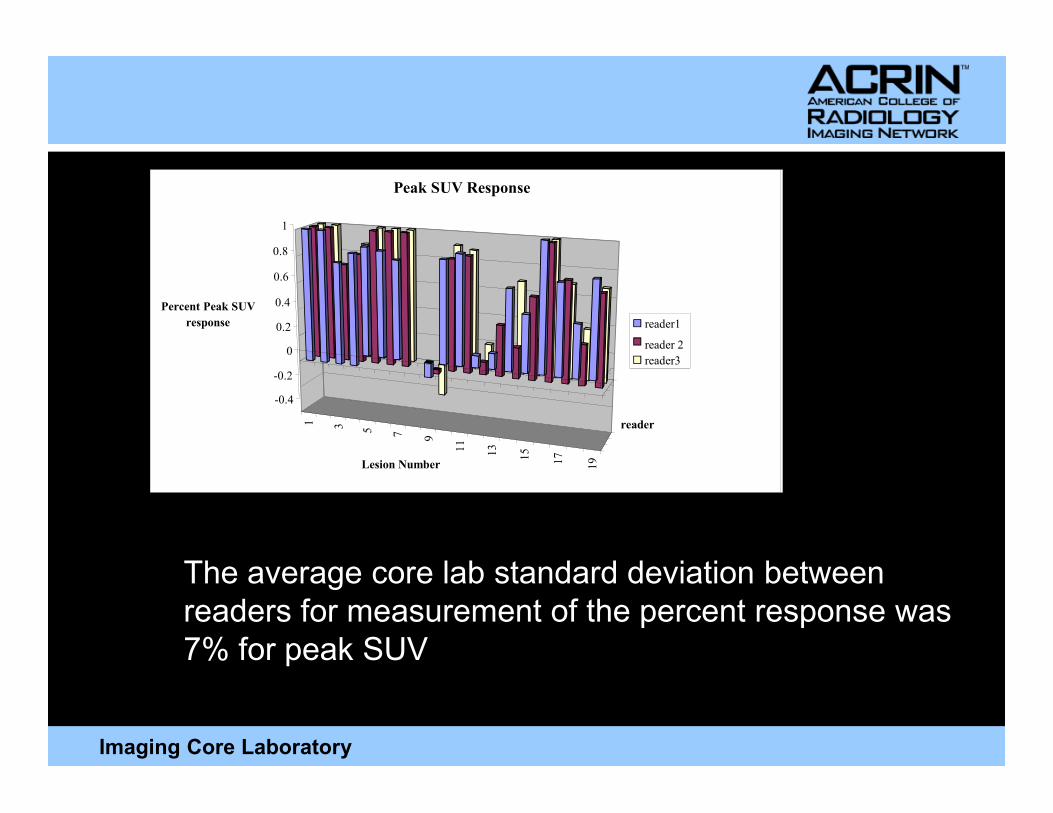
Peak SUV Response
reader1
reader 2
reader3
Imaging Core Laboratory
1 3 5 7 9
11
13
15
17
19Lesion Number
reader
The average core lab standard deviation between
readers for measurement of the percent response was
7% for peak SUV
Primary PET Biomarker Imaging Trials:
Unique Accrual Issues
• No immediate patient benefit
• Radiation Concerns
• Scheduling issues
Imaging Core Laboratory
• Scheduling issues
• Site recruitment
� The “Venn Diagram” problem
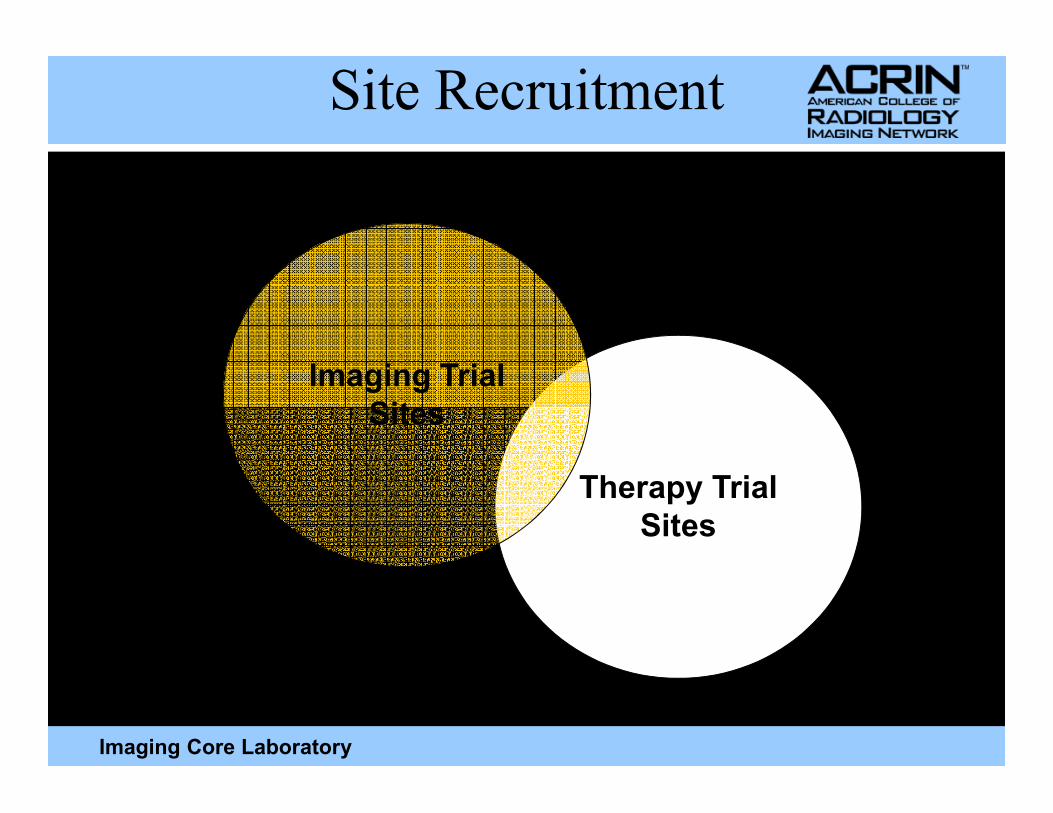
Site Recruitment
Imaging Trial
Sites
Imaging Core Laboratory
Therapy Trial
Sites
Sites
Approach
• Focus on critical data points to minimize
exposure and facilitate scheduling
• Enlarge each Cell of the Venn Diagram
� Plan study with as liberal treatment options as
possible consistent with the mechanism of the
Imaging Core Laboratory
marker tested
� Balance technical requirements on the imaging
sites consistent with study needs
• Enlarge the “Union”
� Focus on sites with clinical / imaging integration
� Mandate the imaging component in treatment trial
Lessons
• High quality data quantitative data can
be acquired in the setting of
multicenter trials
• Site training is key to establishing and
Imaging Core Laboratory
• Site training is key to establishing and
maintaining quality
• Accrual into PET biomarker trials is
uniquely challenging