Embed Size (px)
Citation preview

"I'M BUYING U.S. SHARES"
DOES THE BROAD FEAR OF THE FINANCIAL CRISIS 2007 - 2009 LEAD TO UNDERVALUATION OF COMPANIES WHICH HAVE NOT EXPERIENCED INFLUENCES FROM THE FINANCIAL CRISIS?
Authors: Andreas Blome Martyn Chabros
Supervisor: Håkan Bohman
Student
Umeå School of Business
Spring semester 2009 Master thesis, one-year, 15 hp

I
Acknowledgments
The authors would like to thank Håkan Bohman their supervisor for supporting their thesis
work with his knowledge in business research methodology and his great experience in
guiding students through their research project.
Andreas Blome
Martyn Chabros
Umeå, the 27th of May 2009

II
Abstract
The starting point of this Master Thesis have been utterances of well known investors during
the financial crisis which recommend to buy shares especially in the time of financial
downturn because one could buy good performing companies at a low price.
This arouse the question if broad fear of market participants during the financial crisis of 2007
to 2009 leads to undervaluation of companies which have not experienced influences of the
financial crisis.
The researchers found that this question must be answered positively.
The authors come to this result after they, in a first step, detected unaffected companies by
observing the key financial indicators (earnings, book value and operating cash flow) of the
600 constituents companies of the S&P 600 Small Cap Index during the time period from
2004 to 2008 (before and during the financial crisis).
In a second step the writers selected one company out of all unaffected companies and carried
out a valuation to find the fundamental (or intrinsic value) of this company. By comparing the
fundamental value of the company with its share price they found that this company was
undervalued.
In a third and last step the researchers discovered the indication that this undervaluation
results from investors' fear, as they could show that a confidence indicator that measures the
confidence of institutional investors correlates with the value of the S&P 600 Small Cap
Index but not with the financial indicators (in this case EBIT and Book Value) of the
constituents companies of the S&P 600 Small Cap Index.
Thus, the main research question if the broad fear of market participants leads to
undervaluation of companies which have not experienced influences of the financial crisis of
2007 – 2009 must be answered positively, as mentioned before.
Moreover, the hypothesis: Markets can be inefficient in the times of the financial crisis 2007
to 2009, which the researchers established must be seen as true.

III
Table of content
Acknowledgments....................................................................................................................... I
Abstract ......................................................................................................................................II
Table of content........................................................................................................................ III
Table of formulas and relationships .........................................................................................VI
Table of formula variables ......................................................................................................VII
Abbreviations in alphabetical order ...................................................................................... VIII
1 Introduction ........................................................................................................................ 1
1.1 Background ................................................................................................................ 1 1.2 Research purpose........................................................................................................ 3 1.3 Research questions ..................................................................................................... 4
2 Research strategy and design ............................................................................................. 4
2.1 Role of theory............................................................................................................. 5 2.2 Epistemological considerations.................................................................................. 5 2.3 Ontological considerations......................................................................................... 7 2.4 Paradigmatic positions ............................................................................................... 8 2.5 Determination of the research strategy....................................................................... 8 2.6 Research design.......................................................................................................... 9
3 Theory and hypothesis ..................................................................................................... 12
3.1 Efficient Market Hypothesis (EMH)........................................................................ 12 3.1.1 Summarized description................................................................................... 12 3.1.2 Forms of the Efficient Market Hypothesis ....................................................... 13 3.1.3 EMH and Fundamental analyses...................................................................... 14 3.1.4 Market anomalies ............................................................................................. 15 3.1.5 Interpretation of market anomalies................................................................... 16
3.2 Behavioural finance.................................................................................................. 18 3.2.1 Summarized description................................................................................... 18 3.2.2 Phenomena of behavioural finance .................................................................. 18 3.2.3 Theories of behavioural finance....................................................................... 20 3.2.4 Summery of the behavioural finance and impact in the research work ........... 21
3.3 Financial crisis.......................................................................................................... 22 3.3.1 Causes............................................................................................................... 22
3.3.1.1. Securitization............................................................................................ 22 3.3.1.2. Maturity mismatches ................................................................................ 22 3.3.1.3. Structured products gain popularity ......................................................... 23 3.3.1.4. Consequences ........................................................................................... 25
3.3.2 From a sub-prime to a global financial crisis...................................................25 3.3.3 Influences on the real economy........................................................................ 26 3.3.4 Market and emotions........................................................................................ 29
3.4 Establish the hypothesis ........................................................................................... 29 4 Methods............................................................................................................................ 30
4.1 Valuation models...................................................................................................... 30 4.1.1 The economic value added............................................................................... 31
4.1.1.1. Introduction .............................................................................................. 31 4.1.1.2. Advantages and drawbacks ...................................................................... 31
IV
4.1.2 Multiple analysis .............................................................................................. 31 4.1.2.1. Introduction .............................................................................................. 31 4.1.2.2. Advantages and drawbacks ...................................................................... 31
4.1.3 Discounted cash flow model ............................................................................ 32 4.1.3.1. Introduction .............................................................................................. 32 4.1.3.2. Advantages and drawbacks ...................................................................... 32
4.1.4 The dividend discount model ........................................................................... 33 4.1.4.1. Introduction .............................................................................................. 33 4.1.4.2. Advantages and drawbacks ...................................................................... 33
4.1.5 Residual Earnings Model ................................................................................. 34 4.1.5.1. Introduction .............................................................................................. 34 4.1.5.2. Advantages and drawbacks ...................................................................... 34
4.1.6 The Abnormal Earnings Growth Model........................................................... 35 4.1.6.1. Introduction .............................................................................................. 35 4.1.6.2. Advantages and drawbacks ...................................................................... 35
5 Research strategy in practice............................................................................................ 36
5.1 Concepts in question ................................................................................................ 36 5.2 Finding adequate measures of the concepts ............................................................. 38
5.2.1 Measures of company's financial performance ................................................ 38 5.2.2 Measure of fundamental value ......................................................................... 40 5.2.3 Measure of market value .................................................................................. 40 5.2.4 Measure the market participants confidence.................................................... 40
6 Seeking not influenced companies................................................................................... 41
6.1 Definition of selection criteria.................................................................................. 41 6.2 Definition of research sample .................................................................................. 41
6.2.1 The research sample ......................................................................................... 41 6.2.2 Exclusion of the telecommunication industry.................................................. 42
6.3 Definition of seeking concept .................................................................................. 43 6.3.1 Difficulties........................................................................................................ 43 6.3.2 Basic idea ......................................................................................................... 43 6.3.3 Defining an observation period ........................................................................ 44 6.3.4 Mathematical Implementation of the seeking concept..................................... 45
6.4 Selecting of an appropriate case for further investigation........................................46 7 Valuation of a selected case ............................................................................................. 47
7.1 Selecting an appropriate valuation model ................................................................ 47 7.1.1 Necessary financial Data.................................................................................. 49 7.1.2 Estimating the cost of capital ........................................................................... 50
7.1.2.1. Estimating the risk free rate ..................................................................... 51 7.1.2.2. Estimating Beta ........................................................................................ 51 7.1.2.3. Estimating the market risk premium ........................................................ 52 7.1.2.4. Calculation of the cost of equity capital................................................... 53 7.1.2.5. Criticism of the CAPM method for estimating the cost of equity capital 53
7.1.3 The forecast horizon and growth rate of RE after the forecast horizon ........... 53 7.1.3.1. Determination of the forecast horizon...................................................... 53 7.1.3.2. Determination of the growth rate of RE after the forecast horizon.......... 54
7.1.4 Calculating the value of the selected case according to the RE model. ........... 54 7.1.4.1. The starting position................................................................................. 55 7.1.4.2. Detailed description of the calculations ................................................... 55
7.1.5 Result of the company valuation and comparison with the actual share price. 56 7.2 Undervaluation and emotional driven markets ........................................................ 57

V
8 Conclusions ...................................................................................................................... 58
8.1 Description of results ............................................................................................... 58 8.1.1 Possibilities of generalisation and limitations of the study .............................. 59 8.1.2 Reliability and Validity of the results .............................................................. 59
8.1.2.1. Reliability ................................................................................................. 60 8.1.2.2. Validity..................................................................................................... 61
8.2 Lessons from the research work............................................................................... 63 8.2.1 Recommendations for further research in this study area ................................ 64
References ................................................................................................................................ 66
Books:................................................................................................................................... 66 Articles: ................................................................................................................................ 66 Working papers .................................................................................................................... 68 Master Thesis ....................................................................................................................... 68 Articles published electronically:......................................................................................... 68 Websites ............................................................................................................................... 69
Table of appendix:.................................................................................................................... 70
Appendix .................................................................................................................................. 71

VI
Table of formulas and relationships
1) EVA = (ROIC – WACC) * K .............................................................................................. 31
2) MV = D1 / (1 + k) + D2 / (1 + k)2 + ... + Dn / (1 + k)n + TV / (1 + k)n ................................. 33
3) TV = D n+1 / CE - g ............................................................................................................... 33
4) Residual earnings1 = Earnings1-(Required return*Investment0).......................................... 34
5) Residual earnings = (ROCE - Required Return on equity)*Book value of common equity34
6) VE0 = B0 + (RE1 / pE) + (RE2 / p
2E) +…+ (RET / p
TE) .......................................................... 34
7) VE0 = B0 + (RE1 / pE) + (RE2 / p
2E) +…+ (RET / p
TE) + (RET+1 / pE – 1) / pTE..................... 34
8) VE0 = B0 + (RE1 / pE) + (RE2 / p
2E) + (RE3 / p
3E) +…+ (RET / p
TE) + (RET+1 / pE – g) / pTE34
9) Abnormal earnings growtht = Cum-dividend earningst - normal earningst ......................... 35
10) Cum-dividend earningst = Earningst + (pE-1) * dividendt-1 ............................................... 35
11) Normal earnings = pE * Earningst-1.................................................................................... 35
12) VE0 = 1 / pE - 1[Earn1 + AEG2 / pE + AEG3 / p
2E + AEG4 / p
3E + ...] ................................ 35
13) Earnt – (pE – 1)Bt-1 = [ROCEt – (pE – 1)]Bt-1 ..................................................................... 49
14) Ending book value = Beginning book value + Comprehensive Income – Net dividends . 50
15) ks = rf + [E (rm) – rf] (beta).................................................................................................. 50
16) ks = rf + [E (rm) – rf] (beta) ................................................................................................. 53
17) Ending equity = Beginning equity + Total (comprehensive) income – Net payout to
shareholders.............................................................................................................................. 55
18) Bt = Bt-1 + Earnt – dt ........................................................................................................... 55
19) Earnt / Bt-1 = ROCEt ........................................................................................................... 55
20) REt = Earnt – (pE – 1)Bt-1 ................................................................................................... 55
21) VREt0 = REt / p
tE.................................................................................................................. 55
22) VRE0 = VRE1
0 + VRE20 + VER3
0 + … + VRET0 ....................................................................... 55
23) CVT = (RET+1 / pE – 1) ....................................................................................................... 56
24) CVT = (RET+1 / pE – g) ....................................................................................................... 56
25) CV0 = CVT / pTE ................................................................................................................. 56
26) VE0 = B0 + VRE
0 + CV0....................................................................................................... 56

VII
Table of formula variables
AEG Abnormal Earnings Growth B Book Value (beta) Beta estimation of the company CE Cost of Equity CV Continuous Value D Dividend in a certain year d Dividends E (rm) Expected return on the market Portfolio Earn Earnings EVA Economic Value Added g Residual earnings growth rate K Capital stock of the company at the beginning of year ks Cost of equity MV Market Value n Number of years in the explicit period pE Required rate of return on equity (where 5% = 1 + 0,05) rf Risk-free rate RE Residual Earnings ROCE Return On Common Equity ROIC Return for Invested Capital T Time after the forecast horizon TV Terminal Value VE Value of Equity VRE Value of Residual Earnings WACC Weighted Average Cost of Capital

VIII
Abbreviations in alphabetical order
ABCP Asset Backed Commercial Papers ABS Asset Backed Securities AEG Abnormal Earnings Growth Model AIT Applied Industrial Technology Inc. BPS Book value Per Share CAPM Capital Asset Pricing Model CASY Casey's General Stores Inc. CDO Collateralized Dept Obligations CDS Credit Default Swaps CI State Street Confidence Index CP Commercial Paper CW Curtiss-Wright Corp. DCF Discounted Cash Flow Model DDM Dividend Discount Model DPS Dividends Per Share EBIT Earnings Before Interest and Tax EMH Efficient Market Hypothesis EPS Earnings Per Share EVA Economic Value Added GDP Gross Domestic Product HAIN Hain Celestial Group IFRS International Financial Reporting Standards IMF International Monetary Fund JJSF J & J Snack Foods LNCE Lance, Inc. MVA Market Value Added NYSE New York Stock Exchange P/B Price to Book Ratio P/E Price to Earnings Ratio PEET Peet's Coffee PFCB P. F. Change's China PhD A Doctor of Philosophy degree PPD Pre-Paid Legal Services P/S Price to Sales Ratio RE Residual Earnings repo Repurchase Agreement ROCE Return On Common Equity ROIC Return On Capital Invested RRGB Red Rubin Gourmet SAM Boston Beer Company SEC Security and Exchange Commission SIV Structured Investment Vehicles SSYS Stratasys Inc. USD US Dollar US-GAAP United States Generally Accepted Accounting Principles WACC Weighted Average Cost of Capital WDFC WD-40 Company
1
1 Introduction
In the first paragraph of this study the authors will describe from which background their
research project arrived. After the formulation of the main research question they will explain
the purpose of their study and what goals they want to achieve with it. In a next step they will
also establish three more research questions which will guide the whole work to the final
conclusions. Moreover the authors will discuss basic methodological assumptions they make
and will present the research strategy as well as the research design they choose for their
work.
1.1 Background
The emergence of financial crisis (2007-2009) was caused by many factors. However, the
spark, which has an impact on wide spreading it, was the depreciation on the American
housing market in the first quarter of 2006. The market naively expected that the prices of
property could increase indefinite and it did not create any system security (regulations),
which could protect the economy from wide spreading the default from real estate market to
others industry.1 The first victims of the wave of collapsing property industry were sub prime
lenders, whose market role relied on lending money to borrowers, who did not meet the
requirements of mainstream lenders. Such borrowers had to pay higher interest rates, because
the risk of insolvency was significantly higher and their financial situation could change
rapidly to the worst in the time of their financial problems.2 Moreover most of sub prime
loans were not given to finance the purchase of a house, but they were sold to the customers,
who wanted to refinance their existing loans.3
The process of gradual bankruptcy of such risk lenders caused decline of the value of sub
prime asset-basked securities, which were possessed by hedge funds of big investment banks
such as Bear Stearns, Merrill Lynch or BNP Paribas.4 The worst the situation of the sub
prime-lenders, the cheaper and less liquid become the derivates based on their performance.
Moreover these derivatives were significant part of the assets of these investment banks and
they could lead them to the state of bankruptcy, which could have an impact on creating a
dangerous situation in the world financial market.5 Such dangerous situation undermined the
trust of the big financial players to each other, which were uncertain how many of the toxic
financial instruments could possess its business counterparties and as a result it caused the
reduction of the credit line. The banks stopped borrowing themselves on three-months period,
1 Acharya / Philippon / Richardson / Roubini (2009), p. 89 2 Gerardi / Lehnert / Sherland / Willen (2009), p. 7 3 Gerardi / Lehnert / Sherland / Willen (2009), p. 8 4 Acharya / Philippon / Richardson / Roubini (2009), p. 89 5 Acharya / Philippon / Richardson / Roubini, (2009), p. 93

2
reducing the inside branch activity to only overnight borrowing.6 The widespread of distrust
among the banks lead to decrease of their liquidity and finally to the reduction of loans for the
entrepreneurs, who could not continue or start investments. These interconnections between
the different sectors of economy and unhealthy financial system caused the creation of self-
propelled spiral, which lead to decreasing the Gross Domestic Products, the value of stock
prices and increasing of unemployment rate. It is very important to stress that the USA
economy is the biggest in the world7 and it has a great influence on the economies of other
nations in a globalizing world. That’s why the paramount position of the USA economy was
decisive of wide spreading the financial crisis to other countries. According to the data, the
economy of USA shrinks of 1,6% in the last quarter of 2008 (in a comparison to previous
quarter), 27 European countries of 1,5% and Japan 3,2%.8 The unemployment rate increased
in USA from March 2008 to March 2009 of 3,4%9, in European Union area from February
2008 to February 2009 of 1,1 %10 and in Japan from February 2008 to February 2009 of
0,6%. Finally, the value of the indexes of the biggest stock markets also decreased: the
London Stock Exchange Market from 1390 (3rd April 2008) to 612
(3rd April 2009)11, S&P 500 from 1350 (3rd April 2008) to 842,5 (3rd April 2009)12 and
Japanese Nikei from 68 (3rd April 2008) to 52 (3rd April 2009).13 At worst, the predictions for
the economy are not optimistic, the GDP of the most countries will slow down in the 2009
and world GDP will shrink down of 0,5 - 1% in 2009 according to IMF.14 Moreover the world
trade, which was the lever of increasing world GDP in the last decade, will also be lower of
2,1 % than in 2008.15 Obviously the data shows a black picture of the whole world economy.
However, in between this abundance of ongoing bad news reporting the economy goes from
bad to worse, some authors of newspaper articles and prominent investors recommend that
this time is the best time for buying shares. The probably most famous investor Warren Buffet
for instance recognizes a widespread fear in the market and sees the chance, that in this point
of time, substantial companies can be bought at an attractive price. He claims that shares will
outperform cash over the next decade.16 Another example is the article "Cheap shares snap up
now" which draws the same picture. It is stated that the decline of the stock markets brings 6 Acharya / Philippon / Roubini (2009), p. 92 7http://epp.eurostat.ec.europa.eu/portal/page/portal/eurostat/home/ 8http://epp.eurostat.ec.europa.eu/portal/page/portal/eurostat/home/ 9 Bureau of Labour Statistics (2009) 10 http://epp.eurostat.ec.europa.eu/portal/page/portal/eurostat/home/ 11 www.google.com/finance 12 www.google.com/finance 13 www.google.com/finance 14 International Monetary Fund (2009) 15The World Bank (2008) 16 Wearden (2008)

3
good opportunities especially in the field of normally expensive and conservative shares.
Moreover the investors could find company stocks which are unevaluated at the moment
because the high volatile market has not brought them down.17
So on the one hand the most common economic indicators show that the economy is in the
worst downturn since the great depression and on the other hand some people in the financial
scene are of the opinion that exactly this downturn is a good opportunity to invest in shares
because most of these stocks are on a historical low level. Especially in the article "Cheap
shares to snap up now" it is emphasised that the financial crisis has not put down all
companies and moreover that companies might under valuated.18
The resulting question for any investor in these days is of course, who is right? Is it possible
that a company has not experienced any influences resulting from the financial crisis? Isn't it
the case that the financial crisis has an impact on everything, even on the real economy? Can
we find really companies which are unevaluated and which might be a chance of abnormal
earnings when the economy recovers? And if this is the case, which companies are
unevaluated and to what extent? Or are the authors of these kinds of newspaper or magazine
articles wrong and shares are valuated correct by the market?
All these questions an investor (or a common person following the economic developments)
might keep in mind these days and they can be summarized to one research question which
answer is the subject of this study:
"Does the broad fear of the financial crisis 2007 - 2009 lead to undervaluation of companies
which have not experienced significant influences from the financial crisis?"
1.2 Research purpose
The results of this study will detect a case of a listed company which is undervalued by the
market participants because of the broad fear that dominates the financial markets in the time
of the financial crisis 2007 - 2009. The study will prove that particular firms have not
experienced influences resulting from the financial crisis 2007 – 2009. After selecting one
case which will be investigated in a deeper fashion the study will detect that the firm drop in
its share prices for no economic reason but because of the broad fear of market participants
who are uncertain about the future.
17 Hill (2008) 18 Hill (2008)

4
1.3 Research questions
To achieve the main goal of the research: Prove that the financial crisis leads to particular
undervaluation of firms which are not influenced by the impact of the financial crisis because
of broad fear of market participants, several Sub-questions will be answered.
First, the question if there are existing listed companies which demonstrate that they are in no
way influenced by the financial crisis will be detected. Some examples for influences which
result from the global financial crisis might be: higher refinancing costs, decrease or increase
of demand, difficulties in loan commitments, etc. In this study the authors will show that none
of the selected companies which should be subject to further investigation are exposed to such
influence factors.
Second, the question if the selected firms are under valuated will be scrutinized. The authors
will choose one case out of the uninfluenced firm and present an assessment of its firm value
and an argumentation why they believe that their suggested estimates are true values of the
company. Furthermore, they will compare their estimations with share prices which allows
them to make statements if and to what extent the valued company is undervalued.
The last question to be answered is if that under valuation is a result of the broad fear of
market participants or if there might be other reasons for that. To answer this question the
authors will examine how the financial performance (indicators) of the selected company and
S&P 600; the share price of the selected company and S&P 600; and an investor confidence
index interact. If the share price drops in the same fashion as the confidence index and if at
the same time the financial performance stays stable this must be seen a strong indication that
the market is not driven by rational but emotional investors.
There are three sub-questions:
• Are there companies to find which are not influenced by the
financial crisis?
• Are these firms under valuated?
• Does this under valuation result from broad fear of market
participants during the financial crisis?
The consideration of these sub-questions will allow the authors to answer the major question
of this study.
2 Research strategy and design
In this paragraph the authors will discuss theory related, epistemological and ontological
assumptions in relation to the research topic. Based on these considerations they will
determine a research strategy which represents the fundament of this study.

5
2.1 Role of theory
Thinking about the appropriate research strategy starts with considerations about the role of
theory. Any research is in some way linked to theory. There are two views of the relationship
between theory and research: Deductive and inductive theory.19 The nature of deductive
theory is that at first a particular hypothesis is established which arises from already known
aspects of a certain field of study and from theoretical considerations which are related to it.
After that the established hypothesis is tested by finding empirical evidence that this
hypothesis is true or false. The last step is a feed back or the revision of former theory.20
The inductive is the opposite of the deductive approach. In this instance at first, data is
collected. After that it is tried to find relations between the observations. At the end the
relationships are generalized to create a new theory.21 Of course a clear delineation between
these two approaches is not possible: "However, just as deduction entails an element of
induction, the inductive process is likely to entail a modicum of deduction."22
However, some researches add to these two categories another one, which is called the
functional theory. That kind of theory combines the elements from deductive and inductive
theory and it is especially useful in the area of psychological research.23
This work follows the deductive approach. This study is related to the Efficient Market
Hypotheses and to the theories of behavioural finance because these theories explain on the
one hand when, why and how markets act efficient and rational and on the other hand under
what circumstances markets act irrational and inefficient. Resulting from this theories this
study aims to clarify whether the fear of the financial crisis leads to a undervaluation of
particular companies or if the market acts even in this special situation rational, logically and
efficient. In this study it is tested if and how these theories work under the conditions of the
current financial crisis and if the established hypotheses can be proved as true.
In other words an established hypothesis which results from existing theories is tested by
empirical data to state if the hypotheses hold true. This procedure reflects a typical deductive
approach.
2.2 Epistemological considerations
After defining the role of theory epistemological considerations are taken into account as a
second step to the appropriate research strategy of this work. Epistemology deals with the
question of what should be seen as knowledge in a certain field of study. The main question is
19 Bryman / Bell (2007), p. 11 20 Bryman / Bell (2007), p. 11, 12 21 Bryman / Bell (2007), p. 13, 14 22 Bryman / Bell (2007), p. 14 23 Graziano / Raulin (2000), p. 38

6
if social relationships should be studied in the same way as the naturalistic science.24
The primary epistemological positions are positivism, realism and interpretivism.
The positivistic position is characterized by different attributes. First of all only phenomena
that can be proved by senses can be seen as reality. Moreover the objective of theory is to
create hypotheses. The testing activity of this hypothesis allow to explaining the reality.
Further more knowledge is generated by examining the real world and summarizing the
findings of these examinations in basic relationships. In addition to that scientific
examinations must be objective. The last important characteristic of the positivist position is
that a scientific study has to deal with scientific statements and not with normative
statements.25
The second epistemological position is realism. In general realism has the same attributes as
the positivistic position that is: natural and social science should use the same approaches
when collecting and explaining data and the conception that there exists an external reality
which is examined by scientists.26 Apart form these basic similarities there are two main
forms of realism the empirical realism and the critical realism.
Empirical realism means that reality can be understood by employing suitable methods. The
critical realism view includes not only the examination of the reality but also the exploration
of events and discourses of the social world.27
The last epistemological position is the interpretivism. This position is almost the opposite of
the positivistic view. Interpretivism distinguishes between the social action of individuals and
the naturalistic science view of reality. According to the interpretivitic reality is a social
construct. Because of that the scientist must analyse the social behaviour to understand the
reality.28
Regarding this study it is difficult to determine an epistemological position. On the one hand
the study will examine the development of share prices and after that analyse them and draws
conclusions which result from the analyses. In this case the scientists observe a subject (share
prices) from a outstanding perspective which can not be influenced. This train of thoughts
would lead clearly to a positivistic epistemological position. On the other hand is the
development of share prices a result of supply and demand and one step further the supply
and demand is a result of social interaction. It deals with how market participants assess the
actual and future economic situation. The people assessment depends on confidence or fears
24 Bryman / Bell (2007), p. 16 25 Bryman / Bell (2007), p. 16 26 Bryman / Bell (2007), p. 18 27 Bryman / Bell (2007), p. 18 28 Bryman / Bell (2007), p. 19

7
in the present and in the future. In short share prices are consequences of complex social
interaction. When this study claims to examines share prices against the background of the
financial crisis29 the only suitable epistemological position which allows to explaining and
hence understand the development of share prices is the interpretivistic position.
Because this study includes both the outstanding objective scientist who examines invariable
facts and tries to draw his conclusions from them and the researcher who wants furthermore
understand why the in retrospect unchangeable data developed like this30 the most appropriate
epistemological position is the critical realism because first: "Realism shares two features
with positivism: a belief that the natural and the social science can and should apply the same
kinds of approach to the collection of data and to explanation, and a commitment to the view
that there is an external reality to which scientists direct their attention."31, and in addition to
that: " … critical realists unlike positivists are perfectly content to admit into their
explanations theoretical terms that are not directly amenable to observation. As a result,
hypothetical entities to account for regularities in the natural or social orders (the generative
mechanisms to which Bhaskar refers) are perfectly admissible for realists, but not for
positivists."32
2.3 Ontological considerations
After determining a deductive theory approach and a critical realistic epistemology position
for this work the next step to the appropriate research strategy is to establish the ontological
position of the study. In general there are two major positions which reflect opposite views.
"The central point of orientation here is the question of whether social entities can and should
be considered social constructions built up from the perceptions and actions of social
actors."33
The term objectivism describes the view that social phenomena (social reality) are existing
separately or independent from social actors.34 The constructivist view on the other hand
claims that this social phenomena or social reality is not existing independent from the social
actors but it is created by them.35 In other words reality does not only exist out there but it is
created by participants of social life by interaction.
This study in which specific relationships of stock markets should be examined the
objectivistic position is of major importance. In this study market data must be collected and
29 In the Situation of a crisis emotions and beliefs play even a larger role 30 Especially related to the behaviour of finance 31 Bryman / Bell (2007), p. 18 32 Bryman / Bell (2007), p. 18 33 Bryman / Bell (2007), p. 22 34 Bryman / Bell (2007), p. 22 35 Bryman / Bell (2007), p. 23

8
analysed. These tasks require a strict objective attitude. Only when it comes to the analyses of
why the share prices developed like they did the ontological position changes a very little step
in the direction of constructivism because this question deals with the behavioural of finance
and hence with social interaction.
2.4 Paradigmatic positions
Since ontological and epistemological assumptions are the basement of business research it is
fundamental to understand the ontological and epistemological assumptions authors make in
their research papers and the relationship between these two.36 Because paradigms cluster
different beliefs of what and how some specific topics should be studied and moreover how
the results should be interpreted37 they are a good possibility to summarize epistemological
and ontological assumptions.
In the field of business studies there are four main paradigms which are clusters of certain
assumptions: functionalist, interpretative, radical humanist, radical structuralist.38
For this study the most important is the functionalist paradigm which combines an objectivist
view on reality and a regulatory research purpose. Especially the data collection and analyse
part of this study will be mainly influenced by this paradigm. Only when it comes to the
investigation of possible reasons of certain developments the interpretative paradigm which
combines a subjectivist view on reality with regulatory research purpose guides the further
discussion.
2.5 Determination of the research strategy
Finally, after discussing all important points related to the field of research strategy, a
statement on an appropriate research strategy can be made.
Although the distinction of between qualitative and quantitative research strategy is seen as
not useful39 the authors will use this differentiation because it combines and includes the
assumptions which had been made so far and gives (against the background of these
assumptions) a general orientation how business research should be carried out.40
The appropriate research strategy results from the assumptions which had been made:
• A deductive approach to the use of theory
• An epistemological position of a critical realist
• Mainly a strict objectivistic ontological position
• Mainly an underlying functionalist paradigm for the business research
36 Bryman / Bell (2007), p. 25 37 Bryman / Bell (2007), p. 25 38 Bryman / Bell (2007), p. 25 39 Bryman / Bell (2007), p. 28 40 Bryman / Bell (2007), p. 28

9
From these assumptions results a mainly quantitative research strategy. Because the authors
wanted, to a certain extent, also answer questions concerning underlying relationships which
might have lead to the observed developments, the study will in some parts, to a very small
extent, fluctuate from an otherwise strict quantitative research strategy.
2.6 Research design
After determining the research strategy which should be the fundament of this study, another
important point is discussed: What research design should this study follow?
The research design fulfills the important role of guiding the data collection. It is a method of
completion the data by the researchers.41
The first type of research design – the experimental design – relies on different combinations
of two variables, of which one is dependent from the other. The change of the independent
variable has an impact on the dependent variable. 42 That kind of research is conducted in two
kinds of surroundings: laboratory or field and observation groups are exposure to the
manipulation of the independent variable.43 Such research design allows to measure, the
correlation between the independent and dependent variable. Obviously, that research design
has the delimitations, because with this kind of research design it is not possible to measure
the interaction between more variables and thus it is useless to apply for a more complicated
reality such as society, sophisticated economical models. Therefore, the authors consider that
this type of research design will not support their research which deals with many variables
like company performance, share prices and confidence indices and in addition to that (to a
small extend) with immeasurable (behavioral finance) factors.
The cross-sectional design bases on the collection of different kind of data for more than one
case in a particular single time in order to find relations between them. The purpose of this
kind of research design is suitable to find variations between different cases.44 Such research
design is especially useful to detect the deep difference between some cohorts or samples.45
However, the main obstacle of using this type of research design in this research paper is
connected with the data collection in only one single point of time. The authors think that the
data, which comes only from one single particular moment, can not fully give an answer if the
theory (Efficient Market Theory) works during the current financial crisis (the whole financial
crisis has been lasting for two years now). Further more, the authors are of the opinion that
their observations should be repeated a few times to give a clear answer if particular theory
41 Bryman / Bell (2007), p. 40 42 Graziano / Raulin (2000), p. 50-51 43 Bryman / Bell (2007), p. 45, 46 44 Bryman / Bell (2007), p. 65 45 Graziano/ Raulin (2000), p. 152

10
works under these specific conditions. That’s why this type of research design should not be
fully applied by the authors in their work. However, the cross-sectional design is in some
extent applicable for this work, because it puts pressure on the variation between the cases.
The examination of many cases can be useful regarding the detection of companies which are
not influenced by the financial crisis. A possible scenario might be to determinate certain
criteria a company must fulfill to be "not influenced" by the financial crisis. That’s why some
elements of this type of research design are going to be implemented in this work.
Longitudinal design concentrates on changes, which are done during a specific period of time.
In other words, the researchers collect data from different points in time in order to compare
them.46 There are two kinds of sample in this type of research design: panel study and cohort
study. In the panel study, the choice of sample is done randomly among the population and
the collection of data is conducted during the meetings with the individuals or organizations at
least twice times. Whereas the cohort study includes the sample of the entire population,
which possesses some special characteristic, which can be: the purchase of the same products,
the similar age, the same weight in particular period of time.47 The biggest disadvantage of
this kind research design can be the change of the sample during the long time of
examination48. In our case some of the analyzed companies can be withdrawn from the stock
exchange because of the bankruptcy, especially in the times of the financial crisis. However,
some parts of longitudinal research design can help the researchers to achieve satisfactory
research results, because when not influenced companies should be detected, the performance
of each of the companies must be observed over a longer period of time. If a company fulfils
over this time certain requirements it can be seen as not influenced by the financial crisis.
It does not make any sense to comparing the fluctuation of stock prices before and during the
financial crisis. The fluctuations of the stocks during the financial crisis are higher and it is
caused by bigger uncertainty of market participants. During the financial troubles people have
a bigger tendency to imitate the behavior of others, even thought they can behave irrational.
Such phenomena are called by the psychological researchers ‘herding behavior’.49 This kind
of behavior causes that people resign with taking their own decisions, which based on their
own rational consideration and they follow for the action of others. Unfortunately the
irrational decision of the herd causes ‘non-optimal Pareto equilibrium’.50 The financial crisis
in the countries of East Asia can prove the occurrence of investors’ panic, which was
46 Bryman / Bell (2007), p. 60 47 Bryman / Bell (2007), p. 60, 61 48 Graziano / M. Raulin (2000), p. 146 49 Morone / Samanidou (2008), p. 640 50 Morone / Samanidou (2008), p. 640

11
characterized by the herd behavior during the financial troubles for local economies in 1997
and 1998.51 Furthermore we can not compare the current financial crisis with the similar
events - Great Depression 1929-1935, because of the significant technological change, which
allowed to developing the instruments on the financial market. In the face of the presented
facts, the authors consider that longitudinal research design can not be used to examine the
valuation of the stock prices before and during financial crisis. However, this type of research
design can be helpful for collection of data in the different times during the financial crisis.
The comparative research design concentrates its efforts to find the difference or similarities
between two contrasting cases. Such research is very useful in the cross-national comparisons,
because it shows clearly the differences between two groups. These kinds of studies are of
qualitative nature, because they highlight social issues such as: lifestyle, behavior, code of
culture. This research design can not be applicable to this study, because the purpose of this
paper does not rely on the comparisons between the groups of people and furthermore the
main task of such type of study is to explain the differences based on the culture contexts. The
comparative research design is mainly useful to conduct qualitative research than quantitative
research. Because the grounding of this paper is a quantitative research strategy a research
design which supports mainly qualitative research is unfavorable for this research work.
The authors think that the case study design is best suitable to their work because it combines
the different types of research designs and it allows a deeper examination of a problem. The
great advantage of this type of research design is also the possibility to detect the unique
features of the analyzed problems.52 Furthermore, the authors are going to use this approach,
because it offers the possibility to deduct tests53 and the design fits for studies which include a
deductive approach of the role of theory. Especially, the critical case might be helpful for this
study, because it examines a hypothesis in order to hold or refute them. Such critical approach
allows the authors to see the validity and reliability of Efficient Market Theory against the
background of the financial crisis.
In summary it must be stated that the main research design of this paper will be the case study
because it offers the possibility to analyze an entity in great detail. This will be important
when it comes to the valuation of the selected case. Only in the part when uninfluenced
companies should be detected, from which the case for the valuation will be selected,
elements of the cross-sectional and longitudinal research designs will be included in the work
because if one want to detect a company which is not influenced by the financial crisis it must
51 Baig / Goldfajn (1999), p. 194 52 Bryman / Bell (2007), p. 63 53 Bryman / Bell (2007), p. 64

12
show stability in certain key indicators over a period over several years (before and during the
times of the financial crisis). Only if a company maintains stability in these key indicators
over the time it can be seen as not affected. If a case is selected out of the pool of unaffected
companies the further examination of this case will follow only the case study design.
Because of the case study design must be seen as the main research design of this study.
The case study takes into consideration sample, which includes 600 companies which are
constituents of the S&P 600. Such sample allows to generalizing the conclusions from our
case to the whole market, because it consists of the companies from different industries and it
is big. The case study design in this work will be relied on criteria which detect clearly if
company is not affected during the time of financial disturbance in 2008 and 2009. The
criteria will be based on basic accounting figures such as earnings, book value and cash flow,
which will be apply to both company and its industries performance. Later, the researchers
will choose a few companies, which meet the requirements of stable ratios. From these
smaller sample will be selected one most hopeful companies in order to estimate its values
based on the valuation models chosen. The next step will be the comparisons of the estimated
company value with the actual market prices. If significant differences between market price
and firm value can be observed, the author have some arguments for refutation of efficient
market theory in the times of financial crisis.
3 Theory and hypothesis
In this paragraph the authors will describe all necessary theories and concepts which
underlie the study topic. They will discuss the different theories in respect of the research
topic and will come up with hypothesises resulting from this discussion.
3.1 Efficient Market Hypothesis (EMH)
3.1.1 Summarized description
This study deals with share prices and if the market sets these share prices correctly (efficient,
retinal) in times of financial disturbance. Because of that economic theories are of main
importance which occupy with the behaviour of stock market prices.
First of all, the studies which dealt with the behaviour of stock prices were made by Maurice
Kendall. He analysed time series and found that stock prices do not reflect the prospects of a
certain company, but that they seem to evolve randomly.54
One of the probably best known theories in this field is the Efficient Market Hypothesis
developed by Eugene F. Farma during his PhD studies in the year 1965. After two other
54 Bodie / Kane / Marcus (2008), p. 357

13
publications of Fama concerning this topic, a summary of all his findings regarding the
behaviour of stock prices was published 1970 under the title "Efficient capital markets: A
review of theory and empirical work" in "The Journal of Finance". This publication is
considered as a milestone in financial theory. The Efficient Market Hypothesis claims two
main circumstances:
• Stock prices follow a random walk55
• Stock prices fully reflect available information56
Security prices change in respect to available information. If a new piece of information
appears the security price changes respectively. The term "new information" is always
considered as unpredictable. If a piece of information allows to interpreting the future, this
piece of information is considered as today's news and as yet included in the share prices.
Because new information appears randomly (unpredictable), share prices behave randomly,
too.57
Security prices are considered to reflect all available information because markets are always
analysed and observed deeply by investors and analysts in the hope to find more information
or find information earlier than competitors, so that they can use arbitrage strategies to
generate abnormal returns. So, the competition among investors and analysts leads to security
prices which reflect all available information.58
3.1.2 Forms of the Efficient Market Hypothesis
The empirical work carried out regarding stock price behaviour can be divided in three main
groups. This three groups (referred to as forms) depend on the kind of information which is
considered.59
The weak-form includes only historical information, which is for example: past prices, trading
volume or short interest rates. Because this data is publicly available and almost costless all
investors are well informed and because of that prices are set efficiently. Generating abnormal
earnings with the use of trend analyses is not possible.60
The semi-strong-form includes information which is "obviously publicly available"61. This
term includes historical information plus all public available information. Examples of this
kind of information is: "past prices, fundamental data on the firm's product line, quality of
55 Fama (1965), p. 55 56 Fama (1970), p. 48, 49 57 Bodie / Kane / Marcus (2008), p. 358 58 Bodie / Kane / Marcus (2008), p. 359-361 59 Fama (1970), p. 414 60 Bodie / Kane / Marcus (2008), p. 361 61 Fama (1970), p. 414

14
management, balance sheet composition, patents held, earnings forecasts, and accounting
practices."62 Because this information is all publicly available the security prices should
reflect this information. And because that is the case, it would be not possible to generate
abnormal earnings, too.63
The strong-form includes information of the past (historical information), all public available
information and in addition to that information to which only specific groups have access to.64
(Also referred to as insider information)65 Possible insiders might be a few corporate officers
because they have access to important information before the public. However, The Securities
and Exchange Commission (SEC) put much effort in preventing insider trade.66
3.1.3 EMH and Fundamental analyses
In respect to the research topic of this study it is important to point out the relationship
between the Efficient Market Hypothesis and the Fundamental analyses because the authors
will use fundamental analyses in a later section of this study to detect companies which not
have experienced influences of the financial crisis and to give an estimate on the firm value
based on fundamental data.
Fundamental analysts try to use earnings, dividend prospects, expectations of future interest
rates, and risk assessments of a company to estimate an adequate stock price. The financial
information needed is gathered from past and actual balance sheets. Also information from
economic analyses, evaluation of the abilities of the management, the companies’ position in
the industry and the future changes of the whole industry are added. If this data the analyst
uses for his fundamental analyses is publicly available than this analyses will according to the
Efficient Market Hypothesis give the analyst not the chance of generating abnormal returns.
This is because under the theoretical framework of the Efficient Market Hypothesis the
analyst's analyse will not be better than any analyses of his rivals. Because there are many
well informed analysts and investors its very hard to detect knowledge which none else has
yet and which can give an analyst a competitive advantage.67
In short: Under the theory of EMH, fundamental analyses can not provide an investor or an
analyst the possibility of generating abnormal earnings. If the previous statement is true, why
do the authors than wanted to carry out a firm valuation in this study and estimate the certain
62 Bodie / Kane / Marcus (2008), p. 361 63 Bodie / Kane / Marcus (2008), p. 361 64 Fama (1970), p. 414 65 Bodie / Kane / Marcus (2008), p. 361 66 Bodie / Kane / Marcus (2008), p. 361 67 Bodie / Kane / Marcus (2008), p. 363

15
companies? If the EMH is right, than companies must be valued adequately and a firm
valuation which relies on available data won't give the authors more insight.
3.1.4 Market anomalies
There are serious doubts in the research society that the EMH holds true in any case. The so-
called "market anomalies" give a first indication, that the EMH might have some
vulnerabilities and does not explain any price movement. Some examples for such anomalies
are described in the following.
The P/E effect was detected by Basu. He found that: "During the period April 1957-March
1971, the low P/E portfolios seem to have, on average, earned higher absolute and risk-
adjusted rates of return than the high P/E securities. This is also generally true when bias on
the performance measures resulting from the effect of risk is taken into account."68 Basu
concluded from his findings that: "Contrary to the growing belief that publicly available
information is instantaneously impounded in security prices, there seem to be lags and
frictions in the adjustment process."69 By that he criticises partly the theory of efficient
markets.
Another anomaly is called the small-firm-effect and was discovered by Banz. He found that:
"On average, small NYSE firms have had significantly larger risk adjusted returns than large
NYSE firms over a forty year period."70 He pointed out that: "There is no theoretical
foundation for such an effect."71, which mean that in this special case the EMH gives no
explanation. The small-firm-effect after its detection by Banz has been complemented by
Keim who found that: "… daily abnormal return distributions in January have large means
relative to the remaining eleven months, and that the relation between abnormal returns and
size is always negative and more pronounced in January than in any other month…"72
Because of that the name of the small-firm-effect was changed into the small-firm-in-January
effect.
The neglected-firm effect was detected by the researchers Arbel and Strebel. They interpreted
the small-firm effect differently in the sense that because small firms are often neglected by
large institutional traders, information about such small firms is not that extensive. The lack
68 Basu (1977), p. 680 69 Basu (1977), p. 681 70 Banz (1981), p. 16 71 Banz (1981), p. 16 72 Keim (1983), p. 31

16
of information results in higher risk which requires higher returns. However, the neglected-
firm effect can't be seen as the strict market inefficiency.73
The book-to-marked effect was established by Fama and French in the year 1992. The
researchers found that: "…beta seemed to have no power to explain average security
returns."74 These findings have a great importance regarding the idea of efficient markets,
because it claims that: "…a factor that should affect returns – systematic risk – seems not to
matter, while a factor that should not matter – the book-market-ratio – seems capable of
predicting future returns."75
The last effect which should be mentioned here is the post-earnings-announcement price drift
discovered by Ball and Brown in 1968. The researchers found that although the annual report
of a company captures one-half of all information of this firm which was published during a
year, the market does not adjust prices according to the abundance fast (as it is implied by the
EMH), but more in a drifting fashion.76
After describing the main market anomalies the question arises, if those anomalies must be
seen as market inefficiencies (explanation not conform to the EMH) or as a form of risk
premium (explanation conform to the EMH). If the anomalies turn out to be as market
inefficiencies the authors have evidence that the efficient pricing of securities does not work
at any circumstances and by that an indication that undervaluation of companies is possible
and may be the case.
3.1.5 Interpretation of market anomalies
Several studies had been carried out by different researchers to answer the question whether
market anomalies indicate market inefficiencies or risk premiums. Farma and French found
that: "…stocks with higher 'betas' (also known as factor loadings) on size or market-to-book
factors have higher average returns; they interpret these returns as evidence of a risk premium
associated with the factor."77 This means in other words, that company size and book-to-
market ratios can be seen as proxies for fundamental risks. The higher returns of small firms
and firms with a low book-to-market ratio are consistent with the EMH in the way that a
different risk levels asks for different returns.78
A similar study carried out by Lakonishok, Shleifer and Vishney offered almost the same
findings (value stock outperform glamour stocks) is interpreted by the researchers in a 73 Bodie / Kane / Marcus (2008), p. 375 74 Bodie / Kane / Marcus (2008), p. 376 75 Bodie / Kane / Marcus (2008), p. 376 76 Ball / Brown (1968), p. 168–171 77 Bodie / Kane / Marcus (2008), p. 379 78 Bodie / Kane / Marcus (2008), p. 379

17
different way.79 They state that: "While one can never reject the 'metaphysical' version of the
risk story, in which securities that earn higher returns must by definition he fundamentally
riskier, the weight of evidence suggests a more straightforward model. In this model, out-of-
favour (or value) stocks have been under priced relative to their risk and return characteristics
and investing in them has indeed earned abnormal returns."80 The researchers are of the
opinion that analysts make evaluation errors in the sense that they overprice firms with good
past performance and under priced firms with poor performance. When these evaluation
errors are detected by the market and prices are adjusted value stocks outperform glamour
stocks.81
These two studies are only two examples of research which is concerned with the question if
the detected anomalies are market inefficiencies or a form of risk premiums.
Some researchers are even of the opinion that these anomalies have no other explanation than
data mining. They argue that: "…if one reruns the computer database of past returns over and
over and examines stock returns along enough dimensions, simple chance will cause some
criteria to appear to predict returns."82 This idea becomes even more interesting when it was
observed that some of these anomalies disappear after they had been detected. However, the
examination of data not already researched (other security markets around the world revealed
the same anomalies which had been detected before.83
In summary it can be stated that the EMH is a grounding theory of the behaviour of stock
prices and because of that an essential part of this research paper. The EMH states that market
prices are set efficiently in the sense that they reflect all available information. Although some
researchers doubt that the EMH does not cover every case (see anomalies) it is not clear if this
anomalies must be seen as market inefficiencies or as a form of risk premium. Nevertheless
the findings of anomalies has lead to remaining doubts if the EMH can really explain any
price movement or if there are other factors influencing the pricing of securities.
This idea is especially interesting against the background of this research paper because if it is
true that the EMH explains not all price movements than the security prices might be wrong
priced. The detection of the true value of miss priced securities might then offers the
possibility of earning abnormal returns when prices adjust again after market participants
detected the miss pricing. Arguments for other factors influencing price changes offer another
79 Lakonishok / Shleifer / Vishney (1994), p. 1574 80 Lakonishok / Shleifer / Vishney (1994), p. 1574 81 Bodie / Kane / Marcus (2008), p. 379 82 Bodie / Kane / Marcus (2008), p. 381 83 Bodie / Kane / Marcus (2008), p. 381

18
(more modern) theory which combines economic with psychological aspects. This theory is
known under the term "Behavioural finance" which will be introduced in the next paragraph.
3.2 Behavioural finance
Behavioural finance raises issue of psychological influences on taking the decisions by
market participants. The task of that branch of finance relies on explanation of irrational
investors’ decisions based on the psychological theories of human behaviour.84
3.2.1 Summarized description
The milestone of the development of such theories was the paper ‘Prospect theory: an analysis
decisions under risk’ by D. Kahneman and A. Tversky, which undermined the importance of
utility theory and developed another alternative, the prospect theory. This alternative draws
attention to how the decisions are made with emphasizing on the role of psychology.85 After
the publication of Kahnemen's and Tversky's work, other scientists conducted researches in
this area and this results in the creation of a new economic discipline, the ‘behavioural
finance’ which joins the elements of financial models and psychology86. The behavioural
finance researches have recognized a few psychological tendencies such as: overconfidence;
representativeness; conservatism; narrow framing; ambiguity aversion; positive feedback and
extrapolative expectations; regret; cognitive dissonance; availability bias and miscalculation
of probabilities, which have an impact on taking the decisions by market participants.87
3.2.2 Phenomena of behavioural finance
The phenomenon of overconfidence derives from the peoples’ belief in their own ability to
predict correctly future events. The bigger the self-estimation of particular person of being an
expert in specific field, the higher possibility of overestimation the success of own
prognoses.88 Furthermore, people who once predicted future events correctly, have the
tendency to believe too much in their capability to repeat it. It causes that their
overconfidence blocks them to take into consideration all factors, which can have impact on
the situation development.89 However the psychologists state that people do not believe in
themselves when the task, which they have to do, is too complicated from their perspective.
They underestimate their ability to complete it.90 In the time of financial crisis, when the
84 Glen (2001), p. 599 85 Kahneman / Tversky (1979), p. 263-291 86 Goldberg / Nitzsch / Rüdiger (2001), p. IX 87 Glen (2001), p. 635-638 88 Goldberg / Nitzsch / Rüdiger (2001), p. 117 89 Goldberg / Nitzsch / Rüdiger (2001), p. 118 90 Moore / Cain (2007), p. 197

19
events occur rapidly and the reality is more complicated and different than before, people can
have the tendency to unbelief in control the sequence of events. This lack of control causes
their nervous reaction, unbelief in market’s predictions and it leads to higher violability of
stock prices with any rationality reasons.
Representativeness causes the prediction of the reality which is based on our previous
experiences. If market participants observe that the stock price of particular company has
been increased for a few years, they have the tendency to believe in glamorous future of that
firm. On the other hand if the company has suffered, people can claim that the trend will
continue in the future. Such premature decisions, which are not based on the detail
companies’ analysis, but on the stereotypes, mislead often the investors.91
Conservatism is connected with the reluctance to change the mind of previous taken
decisions. Although people receive the negative information of their action, they continue
maintaining their own decisions.92
Narrow framing emphasizes that market investors are reluctant to see the whole picture of the
market reality and they have the inclinations to concentrate on the small fragment, which
particularly interest them. Such perception of the reality drives them to missing the chance of
better investment and forces them to take considerable higher risk.93
Ambiguity aversion paralyzes the willingness to taking decisions because of the limitation of
knowledge about the specific object (another market, overseas investment). Such tendency is
unable people to invest in more profitable markets or stocks.94
Positive feedback and extrapolative expectations causes that market participants purchases the
stocks, which have the tendency to increase and this drives to creation of self-propelled spiral
of increasing the share prices. The appreciation of such stock prices does not have the solid
fundament in the financial statements of these companies. That’s why after a while, when the
market participants realize that these stock are overpriced, it caused to suddenly fall down of
them.95
Regret is connected with the human hedonism. Some people try to take as much happiness as
possible and they want to avoid sorrow. This approach to life leads them from avoiding the
situation, which can lead them to disappointment.96
91 Glen (2001), p. 599 92 Glen (2001), p. 600 93 Glen (2001), p. 600 94 Glen (2001), p. 600 95 Glen (2001), p. 600 96 Glen (2001), p. 600

20
Confirmation bias drives people to avoid the information, which are not coherent with their
perception of their reality. They only absorb information, which confirm their choices,
decisions or world view. That’s why they can ignore the negative information from the
market, because they can be contradictory to their beliefs.97
Cognitive dissonance applies to human’s tendency to hold personal opinions as long as
possible, despite of finding proofs that they are not any more actual.98
Availability bias is the irrational fear, which pushes away people from some things. For
example, if one of the big companies from a particular industry collapses, people can be afraid
of purchasing the stocks of healthy enterprises from this branch.99
Miscalculation of probabilities proves that people have the tendency to believe in the events,
whose probability is very low and they can underestimates the occurrence of highly possible
things.100
Anchoring is formed by the people based on the receiving information. However people need
the time to transform the past information to the market value. We can observe these
phenomena by gradually increasing the stock prices after the publishing of good financial
company’s results.101
3.2.3 Theories of behavioural finance
Furthermore if we treat the stock like the normal commodity, it allows us for the deeper
psychological analysis of some financial behaviour phenomena. First of all, the balance
theory can explain the reasons of the creation of the availability biases. According to that
theory, we judge the reality by the observation of triad, which include such elements as ‘1) a
person and his or her perceptions of (2) an attitude object and (3) some other person or
object.’102 These two last elements are strictly connected with each other and they affect
strongly of themselves. If a consumer changes his/her opinion about one of these two last
triad elements, he/she automatically passes it to another. For instance, if a person has negative
experience with the stock from a particular industry, he/she can pass his/her disappointment at
others among these branches, despite of the fact that they are healthy.
What’s more the cognitive dissonance theory can be used to explain the importance of time to
change of opinion or why people maintain it.103 The market participants have a strong belief
97 Glen (2001), p. 600 98 Glen (2001), p. 601 99 Glen (2001), p. 601 100 Glen (2001), p. 601 101 Glen (2001), p. 601 102 Solomon (1996), p. 171 103 Solomon (1996), p. 169
21
in a good condition of particular stock, however the flow of the negative information about
the performance of that shares undermine the attitude to the adoration object. The previous
good perception of the stock is a buffer, which protect it from losing the credibility too fast
and encouragement to look for the alternatives source of information, which can admit their
old good view of stocks. Although the weight of the information, which allows to maintaining
a good opinion of adoration object, is inferior to the flow of negative information. It is a
satisfaction excuse to hold the decreasing stocks.
Social judgment theory suggests that people have tendency to categorize the things according
to their net of framework, which includes such elements as their previous experience,
knowledge and feeling. This tendency causes that some information is refused by them,
because it is not included in their frame of reference.104 Such theory can explain why the
financial behaviour phenomena: narrow framing and ambiguity aversion occur.
Furthermore heuristics are shortcut in taking the decisions by consumer, because they allow to
saving the consumer time essential for the consideration of their market choices. Examples of
heuristics can be ‘I buy the stock prices of that company, because most of my friends have
purchased it recently’ or ‘many people have purchased the stock of these companies, that’s
why it must be a good investment’. Heuristics can fulfil the function of explanation of human
financial behaviour in case of positive feedback and extrapolative expectations.
3.2.4 Summery of the behavioural finance and impact in the research work
These examples of psychological tendencies stress how important input is human behaviour
to understand the compliance of setting the prices of the stock market. Furthermore, these
psychological tendencies are contradictions to the rational Efficient Market Model. However,
without taking into consideration these two opposite approaches of setting prices, which fulfil
and overlaps themselves, we can not fully understand the functionality market stock. If we
engage Freudian theory105 in explanation of setting the prices, we can conclude that
behavioural finance is like ‘id’, which is responsible for fulfilment of human desires, which
are selfish and illogical. On the other hand the Market Efficient Model is like ‘superego’,
which imposes the rational market rules on selfish and illogical id. However, the stock market
prices are like ego, which conciliate the rights of both contradictory sides of human nature.
But the readers should realize that id and superego fights fiercely on the dominancy on the
setting stock prices and authors' task will rely on in which extent this id is stronger in the
times of financial crisis than in the other periods.
104 Solomon (1996), p. 170-171 105 Salomon (1996), p. 134-135
22
3.3 Financial crisis
This study deals with the development of share prices and fundamental firm value under the
special circumstances of financial disturbance. Because times of economic or financial
turmoil have apart from some similarities always its own unique features the authors describe
in the next paragraph the financial crisis 2007 – 2009. Special emphasise will be put on the
causes which lead to the crisis, as well as the influences on the real economy and the market
participants' mental health, because these points are important for further considerations in
this research paper.
3.3.1 Causes
In the years before the financial crisis the U.S. economy was experiencing an environment
which was characterized by large capital inflows (mainly from Asia) and a loose interest rate
policy by the Federal Reserve. In this environment the banking sector underwent an important
transformation from the traditional banking model (holding loans on the banks' balance
sheets) to the 'pass through' model in which banks repack the loan and push them further to
other financial investors. This development in this special environment laid the foundation of
the financial crisis.106 The transformation of bank practices is described in greater detail in the
next paragraphs.
3.3.1.1. Securitization
One change in the banking system was the securitization of mortgages or loans. The term
"securitization" describes the practice of banks to build diversified portfolios out of mortgages
and other kinds of loans, cutting these diversified portfolios in trenches and after that, sell
these trenches to other investors.107 The trenches are divided in different risk classes so that
every investor can choose the trench which appeals to his risk aversion. Investors who bought
a risky trench protect themselves with credit default swaps (CDS). An investment in risky
trenches in connection with a CDS is considered as a safe and less risky in these days,
because the probability that the CDS counterparty to fail was estimated as very small.108
3.3.1.2. Maturity mismatches
In the years before the financial crisis the trend towards short maturity assets increased.
Investors prefer this kind of assets because they offer many advantages for them. The main of
these advantages are: that funds can be withdrawn at a short notice, that they can be used as a
106 Brunnermeier (2009), p. 77 107 Brunnenmeier (2009), p. 78 108 Brunnenmeier (2009), p. 78, 79

23
commitment device to discipline banks because of the possibility of immediate withdrawal of
funds and that the use of this kind of assets signals confidence in the own ability to achieve
good results in the future. The problem of this development was that the investment projects
the raised funds had been invested in had a far longer maturity. In other words there was a
huge discrepancy in maturities (maturity mismatch) existing.109
A mismatch of maturities was observed by so-called "off-balance-sheet vehicles" or
"conduits". The strategy of these vehicles raised funds by selling short-term assed backed
commercial papers (borrow short-term) and invests these funds in long term assets. This
strategy exposes the sponsoring banks to funding risk in the way that they grant credit lines to
the off-balance-sheet investment vehicles in case that investors might stop buying the assed-
backed securities from the vehicles so that they are not be able to roll over their short-term
dept.110
Moreover the mismatch of maturities on the balance sheet of investment banks enhance, too
because banks started to finance their balance sheets increasingly with short-time "repos". In a
repo contract a company borrows funds by selling a collateral asset today and promises at the
same time to repurchase this asset at a later date. The greater financing trough short-term
instruments forced the banks t roll over a great portion of their founding.111
The great maturity mismatch resulting from granting credit lines to off-balance-sheet vehicles
and from the increasingly use of repo financing exposed the financial system to the great risk
of stress if for some reason the founding liquidity is reduced.112
3.3.1.3. Structured products gain popularity
In the fist two paragraphs it was illustrated which trends led to the financial crisis. This
paragraph will illuminate the question what causes create this trends.
The first two reasons why structured financial products became more and more popular was
that they offer the possibility to shift risks to investors who wanted to bear the risks and that
the risk could be widely spread with this kind of financial product.113 This advantages lead to
lower mortgage rates and to lower interest rates for other kinds of loans. Moreover, the
characteristics of structured products allowed some institutional investors like pension funds
to hold indirectly assets which they are normally not allowed holding. For example pension
funds are only allowed to hold triple “A” rated assets. Any asset which is rated lower than
109 Brunnenmeier (2009), p. 79, 80 110 Brunnenmeier (2009), p. 79, 80 111 Brunnenmeier (2009), p. 80 112 Brunnenmeier (2009), p. 80 113 Brunnenmeier (2009), p. 80

24
triple A is not available for pension funds. With the help of structured products it is possible
to construct a triple “A” rated asset trench out of less rated assets. This triple “A” rated trench
is now available for certain financial institutions like pension funds. Although this kind of
financial products offer the possibility of shifting or selling off the risk most of the risk stayed
in the banking system because banks were one of the greatest buyers of this products.114 This
had different reasons.
Regulatory and rating arbitrage possibilities are the main reasons which made this kind of
investment products especially interesting for banks. With the use of structured investment
vehicles (off-balance-sheet) banks had the possibility to circumvent the Basel I accord which
required a capital charge of 8 percent of their loan on their balance sheets. This capital charge
is less for contractual credit lines and is missing for no contractual credit lines.115 "Thus,
moving a pool of loans into off-balance-sheet vehicles, and then granting a credit line to that
pool to ensure a AAA-rating, allowed banks to reduce the amount of capital they needed to
hold to conform with Basel I regulations while the risk for the bank remained essentially
unchanged."116 The Basel II accord which tight the interest rate to the rating has only a little
correcting effect because with the practice of pooling different securities and the
diversification of related risk the banks get a better rating for the whole pooled securities than
for each security alone.117
Further more, these products become popular because they offer good ratings. This good
ratings result on the one from the statistical models of many rating agencies or professional
investors which show mainly optimistic forecasts. However, these results were not reflecting
the actual situation but were promoting the valuations of AAA trenches because these models
were based on historical low mortgage default rates and low cross-regional correlation of
house prices.118
Other reasons for good ratings may also be the following. Maybe structured products get
better ratings because of the higher fees rating agencies get for rating this kind of financial
products. Moreover so-called "rating at the edge" took place in which bank and rating
agencies worked together closely so that the financial products can be structured in that way
that they just get an AAA rating.119
114 Brunnenmeier (2009), p. 80 115 Brunnenmeier (2009), p. 81 116 Brunnenmeier (2009), p. 81 117 Brunnenmeier (2009), p. 81 118 Brunnenmeier (2009), p. 81 119 Brunnenmeier (2009), p. 81

25
One reason why fund managers might favour especially bad trenches is that this trenches are
only traded infrequently and because of that it is difficult do value them. This gives the fund
manager flexibility in valuation and by that the possibility to make his returns appearing
smoothly.120
3.3.1.4. Consequences
The consequences of this developments lead to a huge amount of cheap credit. Banks had
only to bear the risk of loan default until they are purchased further to other investors.
Because of that banks had a only a little interest to take care about the quality of applicants.
Further more it was expected that a borrower could always pay off a loan because house
prices (houses were used as collateral) were likely to rise further. As a result the whole
lending standard fell. The combination of cheap credits and low lending standards result in a
rush on the housing market which can be seen as the basement of the financial crisis.121
3.3.2 From a sub-prime to a global financial crisis
In the last preceding paragraph the causes of the financial crisis had been discussed. In this
paragraph the development from a sub-prime towards a financial crisis is described. While the
beginning of the crisis had been the defaults in the sub-prime market, the first event which
indicates a broad financial crisis was the breakdown of two high levered Bear Stearns hedge
funds which ware highly invested in asset-backed-securities (ABS). The breakdown was the
result of the following development: Fist the prices of collateralized dept obligations fell, so
that the lenders to the fund ask for more collateral. When it was tried to sell off assets only a
very small part of these assets found a buyer, so that the illiquid ness of these assets became
obvious. To avoid fire sales the sponsoring bank Bear Stearns had to lend a huge loan to the
fund to keep it afloat.122
The example of the Bear Stearns case highlights typical characteristics of a financial crisis.
The cheap credits (leading to high leverage in financial institutions) and the housing market
bubble that burst result in a fall of prices of assed backed securities. This caused margin calls
which forced investors to sell the asset. This leads to the deflation of the asset. This caused the
decline of value of collateral that was backing the former credit boom. This development
result in a downturn spiral of margin calls, fire sales of assets and further fall in asset
prices.123
120 Brunnenmeier (2009), p. 81, 82 121 Brunnenmeier (2009), p. 82 122 Acharya / Philippon / Richardson / Roubini (2009), p. 89, 90 123 Acharya / Philippon / Richardson / Roubini (2009), p. 90

26
The next great happening that showed how the sub-prime crisis became a broad financial
crisis was the run on structured investment vehicles (SIV) of BNP Paribas. This run was so
great that the bank had to suspend the redemptions. From that time on asset backed
commercial papers (ABCP), which until then were considered as save, must be seen as not
that safe short-term vehicles. On the contrary these papers relied on sub-prime credit quality
assets which lost their liquidity. This led to freezing of the ABCP market.124
PNP Paribas was only an example. Almost every financial institute had to face the same
situation. This led to a: "… lack of transparency on what financial institutions were holding
and how much of the conduit loss would get passed back to the sponsoring institutions caused
the entire market to shut down."125 All short-terms markets like the commercial paper (CP) or
repo market freeze. The only expectations had been money injections of the central banks.126
In general this situation can be described as follows. Private financial markets need
information, reporting and disclosure to function. If now, because of the non-transparent
structure of the financial system, none knows which bank or institute holds which risks a great
uncertainty came up. This causes risk aversion, lack of trust and decreasing confidence. As a
result the liquidity in particular financial market dries up.127
In the period thereafter sub-prime lenders became bankrupt and banks had to undertake
massive write downs. Because banks were cross linked with each other and none know which
institute is exposed to what extend of sub-prime risk, the probability of counterparty failure
arose. This counterparty risk made banks not trusting each other any longer and as a result
hording excess liquidity instead of lending it to other banks. This development dries up the
liquidity also in the inter bank market which makes the sub-prime crisis become a systematic
global financial crisis. That the counterparty risk which had made the marked dies up was
valid showed the bankruptcies of two of the larges investment banks Bear Stearns and
Lehman Brothers.128
3.3.3 Influences on the real economy
This study should give an insight if every company was affected or influenced by the financial
crisis. To be able to make a statement abut this issue it is important that it is pointed out how
the financial crisis influences the companies or generally spoken the real economy.
124 Acharya / Philippon / Richardson / Roubini (2009), p. 91 125 Acharya / Philippon / Richardson / Roubini (2009), p. 92 126 Acharya / Philippon / Richardson / Roubini (2009), p. 92 127 Acharya / Philippon / Richardson / Roubini (2009), p. 92 128 Acharya / Philippon / Richardson / Roubini (2009), p. 92-94
27
The connection between the financial sector and the real economy are loans from banks to
private companies and households. The extent of lending from banks to the real economy is
the main influencing factor of the financial crisis on the real economy. When lending to the
stops the real economy will be extent to financing and founding problems.129
The authors of the article: "The credit crunch and the real economy." Diana Farrell and Susan
Lund try to evaluate the decline of funding capital to the real economy.130 Although the values
of this article might not be accurate because of the early stage of the financial crisis which
does not allow precise calculation and although the presented numbers reflect only the U.S.
economy the article is of importance for this study because it offers a more detailed insight in
possible credit channels from financial institutions to real economy participants.
The authors of the article identify five main credit channels though which maintain the real
economy with capital: bank lending to households and companies, lending by no bank
intermediates (pension funds, insurance companies, and the government), dept owned or
securitized by government-sponsored institutions (Fannie Mae and Freddie Mac), corporate
bond and commercial papers and securitization papers.131
Further more the authors make statement about the extent to which they believe the different
channels will dry up or decrease in loan supply. Although the banks could get new founding
through government lending and private investors the money supply through this channel will
decline because of the massive write downs the banks had to undertake. The recapitalisation,
reduction of bank leverage and the payable taxes will use up much of the new funds so that
the leftover money which is available for lending will be only a small amount.132
The loan channel of insurance companies, pensions and the government is, according to the
authors of the article dried up and will remain in this situation for about two years.133
The channel through government-sponsored institutions is the only source which increased
lending trough the crisis and by that set-off some of the credit reduction of other channels.134
Lending through corporate bond and commercial-paper market is the greatest source of
company founding (and by that especially important regarding this research paper) has
decreased in investment-grade sector only modestly but in the high-yield sector to a big
129 Acharya / Philippon / Richardson / Roubini (2009), p. 92 130 Farrell / Lund (2009), p. 30-31 131 Farrell / Lund (2009), p. 30-31 132 Farrell / Lund (2009), p. 30-31 133 Farrell / Lund (2009), p. 30-31 134 Farrell / Lund (2009), p. 30-31

28
extend. The founding activity through this channel will continuously be on a low level for the
next quarters of 2009 and 2010.135
The channel through securitization markets decreased massively. The authors of the article
believe that only so-called plain vanilla (simplest structure) form of securitization will offer a
little possibility to raise funds through that channel. More exotically structured instruments
will be not used during a long time.136
The articles provide a detailed insight how the financial crisis might influence the real
economy. Of course one could argue that companies have to face other risks like the decrease
of demand but if this one thinks further in this direction one will come up with purchasing
power of consummates which is only a result of money supply and the money supply is
caused lending ability and the lending willingness by financial institutions. So the author of
this paper will consider restrictions in lending ability and willingness from financial
institutions to the real economy a major and most important influencing factor form the
financial crisis on the real economy. This assumption will become especially important when
is comes to defining of selection criteria to select companies which do not have to suffer from
bad influences from the financial crisis.
The last important point which is important to mention and which at the same time leads to
the next paragraph can be described with the following quote: "Each of these scenarios
depends on many assumptions and comes with caveats, which offer cause for either hope or
worry."137 This sentence which Farrell and Lund, put at the end of their calculated estimates,
detects an important issue in the financial crisis and for this study. The sentence says that the
authors do not know if there estimates were right. It is always speculation in estimating the
extent of the financial crisis. Regarding this study this is important, because it can anticipate
the possibility that analysts draw a too bad or too good picture in its estimations. This is
exactly the point where the investigations of this study starts. If market observers, analysts
and investors misjudge the actual situation then there might be a possibility of finding miss
priced company stocks. Indications that market observes draw a too bad picture of the actual
situation and as a result some companies might be under valuated should be presented in the
next paragraph.
135 Farrell / Lund (2009), p. 30-31 136 Farrell / Lund (2009), p. 30-31 137 Farrell / Lund (2009), p. 31
29
3.3.4 Market and emotions
Many articles these days give an insight about the main emotional state of investors, financial
institutions and the common public. Allan Sloan who has been writing about business since
forty years comments that this financial crisis feels worst. Furthermore, he compares the
current crisis with the great depression.138 And in deed, according to a CNN/Opinion
Research Corp. poll to which Mark W. Riepe refers in his column "Depression Fear is
Overblown", sixty percent of the Americans believe that the economy will fall into a
depression.139 Moreover many of them are very frightened to loose their jobs140 and as a
result, consumer confidence is almost gone.141 In short: "…people feel less safe and more
insecure…".142
When moving from the general public to the financial sector one can observe similar
emotions. Cary Cooper state that in the economic downturn uncertainty is a prime feeling
which has created: "…a negative psychological state…" in market participants (consumers,
savers, households and investors).143
In a panel discussion dealing with the financial crisis, many comments were made regarding
the emotion and feelings during the economic downturn, but the statement which describes
the situation best was made by Miller: "Many of the institutions are scared to death…"144
Moreover many investors are frightened about political decisions which may result from the
economic decline. Some investors fear a massive intervention of the government like
nationalization of banks, and some are worried that the administration might act not strong
enough to get a grasp of the crisis.145
Summarizing this paragraph one can state that nobody has an idea what the next phase of the
financial crisis will look like. Because nobody knows if the measures taken are the right ones,
and will have a positive impact on the shrinking economy, uncertainty and fear dominates the
minds, and the confidence in what the future will bring diminishes.146
3.4 Establish the hypothesis
To this point the EMH was considered which claims that prices are set efficiently. In the end
of the explanations regarding the EMH anomalies are emphasised which indicate that the
138 Sloan (2008), p. 26 139 Riepe (2008), p. 32 140 McKellar (2009), p. 18 141 Treanor / Katsoris / Fisch / Kaswell / Cohen / Miller / Morgenson / Neiman / Cave (2009), p. 1-47 142 Cooper (2008), p. 26 143 Cooper (2008), p. 26 144 Treanor / Katsoris / Fisch / Kaswell / Cohen / Miller / Morgenson / Neiman / Cave (2009), p. 31 145 Steverman (2009), p. 8 146 Treanor / Katsoris / Fisch / Kaswell / Cohen / Miller / Morgenson / Neiman / Cave (2009), p. 31

30
EMH might not fully explain any price movement. These anomalies however could not totally
prove that the market acts inefficient.
After considering different items of the behavioural of finance theory which includes
psychological aspects in the consideration serious doubts arose, if the EMH is the ultimate
explanation of price setting. Especially against the background of the financial crisis with
many bad company and economic news, concepts like narrow framing, confirmation bias etc.
might give a better explanation of how prices might be set during this time. If it is true, these
psychological reasons are responsible for the pricing of securities these days of economic
disturbance and no longer rational consideration, than companies might be undervalued by
market participants. Some authors are exactly of this opinion. Cary Cooper for instance state
that: "…fluctuations are more often about the public's mood, their perceptions and psychology
about markets…"147 He continuous that in these times of the financial crisis investors’
decision-making is irrational.148 Allan Sloan also believes that stocks have been fallen to
unreasonable (inefficient) levels.149 The last author which should be cited here is Ben
Steverman. He is of the opinion that especially in the November of 2008 the irrational
tendencies could be observed.150
If irrational price setting has taken place and as a result companies might be undervalued, that
implies the advantage of realizing abnormal returns when the prices of fundamentally not
affected companies adjust after the crisis to its true value again.
Because the authors are of the opinion that the fear of the financial crisis lead to irrational
decisions which follow the theory of the behaviour of finance they put forward the hypothesis
that:
Markets can be inefficient in the times of the financial crisis 2007 to 2009.
4 Methods
4.1 Valuation models
There are many models of company valuation. However, in most academic scripts one can
find the following: the economic value added, multiply analysis, discounted cash flow, the
dividend discount model (DDM), Abnormal Earnings Growth (AEG), the discounted cash
flow (DCF). Because the author’s work is limited in the extent, they must reduce themselves to
describe all of them shortly with the presentation of their advantages and drawbacks.
147 Cooper (2008), p. 26 148 Cooper (2008), p. 26 149 Sloan (2008), p. 27 150 Steverman (2009), p. 8

31
4.1.1 The economic value added
4.1.1.1. Introduction
This approach to company valuation shows the profitability of the firm. This model is
calculated by the difference between the return on capital investment and the cost of capital.
Next this difference is multiplied by the capital companies stock at the end of the year.151
1) EVA = (ROIC – WACC) * K
The reasons for applying EVA to company valuation are to show, if the firm in a particular
year adds or destroy its value.
4.1.1.2. Advantages and drawbacks
The biggest advantage of this valuation approach is the possibility of observance the
company's performance in small elements such as projects and activities. If the WACC is
greater than ROIC, it points out the company, that some of its activities or projects should be
withdrawn. It must be highlighted that the purpose of the management should not be
maximized the EVA for the particular projects or activities in one year, but the increase of the
value of EVA for a whole company in the long time perspective. This long-term EVA is
called MVA (Market Value Added).152
4.1.2 Multiple analysis
4.1.2.1. Introduction
This valuation approach relies on comparisons between the companies’ ratios (multiplies)
such as: price to sales, price to earnings or price to book value. It should be emphasized that
comparative companies should have many similarities such as: size, products, clients etc. In
order to compare them, it should be calculated firstly the average or median of: their sales,
earnings before extraordinary items, book value and market value. In the next step this items
from the financial statements are used to compute the ratios such as: P/S, P/E and P/B. The
multiple comparisons between the different companies’ ratios allow to set the fair prices of
the particular stock among the inside industry comparisons.
4.1.2.2. Advantages and drawbacks
Although this valuation is very simple, fast and cheap, it has many drawbacks. First of all, it is
difficult to find the companies, which are almost identical or at least very similar. In the face 151 Frykman / Tolleryd (2003), p. 33 152 Frykman / Tolleryd (2003), p. 34 152 Frykman / Tolleryd (2003), p. 34

32
of these problems, it can not make any sense to comparing the companies, which are different
in to a big extent. Furthermore, it might occur the negative ratio in one of the comparative
companies and it is not able to assess the value of the stock based on that model.153
Furthermore the use of the different accounting approaches cause difficulties in
comparisons.154 This model is used especially for the valuation of companies, which can not
fairly and reliable be priced or if the investments bank is going to list the companies on the
exchange market.155
4.1.3 Discounted cash flow model
4.1.3.1. Introduction
This model calculates the value of equity. In the first step all future free cash flow, which is
the difference between its cash flow from the operations and investments, is discounted to the
present value. In the next step, from the discounted company’s free cash flow it is deducted
the firm’s debt and this calculated amount shows the value of the company.156
4.1.3.2. Advantages and drawbacks
Although that model is easy and useful to apply for different size of companies, it supports
such theory as the CAPM and moreover accounting rules does not affect it157, it has many
drawbacks. First of all the decrease of the investment causes the increase of companies value.
However, in the long-time future each company requires the investments to develop itself and
they should be considered like the positive issue. However, the DCF assesses them like the
loss of value. In addition to that the model does not meet the requirements of matching
principle. It means that cash receipts from the operations do not cover with the investments,
which create them in the same year. The effect of the investment is visible on the operations
cash flow in the next year. Furthermore, there is a lack of good forecasts of cash flows,
because the financial specialists concentrate their efforts on predicting the earnings.158 Finally,
this model does not allow companies to compare with their main competitors, because of it
does not take into considerations the role of business strategy, which includes besides the
153 Penman (2007), p. 76-77 154 Copeland / Koller / Murrin (2000), p. 67 155 Penman (2007), p. 78 156 Penman (2007), p. 122-123 157 Frykman / Tolleryd (2003), p. 70-71 158 Penman (2007), p. 126, 127

33
finance, for instance such important business elements like marketing, implementation of
innovation and management.159
4.1.4 The dividend discount model
4.1.4.1. Introduction
The DDM model “equals the equity value to the value of all future dividends discounted back
to today using the appropriate cost of capital”160 First of all to predict the value of company,
the dividends should be forecasted for the next a few years. These dividends are usually taken
from the following one to five years. This time is called ‘explicit period’. Furthermore, after
this ‘explicit period’ the long-term dividend growth should be founded to count terminal
value, which shows all capital flows after the explicit period to infinity. Both expected
dividends to time T and expected terminal value at T should be discounted to present value by
using the cost of capital.161 The mathematical formula below can completely summarize this
model:
2) MV = D1 / (1 + k) + D2 / (1 + k)2 + ... + Dn / (1 + k)n + TV / (1 + k)n
The formula for TV is:
3) TV = D n+1 / CE - g
4.1.4.2. Advantages and drawbacks
The advantages of that model are simplicity and predictability, because it is easy to predict
and calculate dividends in the short-period of time. However, this model also possesses many
serious drawbacks such as the lack of the relevant connection between the creation of real
value and dividend’s payoff. Dividend does not have any influence on creation of the
company’s value, but actually there is the distribution of firms’ wealth.162 Furthermore,
dividends can be paid to stockholders from borrowing money, that’s why it can not be a good
indicator of the value creation by the company.163 Finally, there are many obstacles to forecast
realistically the dividends in the long period of time. Nevertheless it is recommended to use
this model, when the payoff ratio of a company is fixed.164
159 del Sol / Ghemawat (1999), p. 42-56 160 Frykman / Tolleryd (2003), p. 29 161 Frykman / Tolleryd (2003), p. 29 162 Penman (2007), p. 122 163 Penman (2007), p. 247 164 Penman (2007), p. 122

34
4.1.5 Residual Earnings Model
4.1.5.1. Introduction
This method relies on the valuation of residual earnings (abnormal earnings) in order to assess
the value of the company. The return which exceeds the required rate of return from the
investment is called residual earnings. The rate of return for a particular company is computed
by the use of company’s beta (based on the CAPM model):165
4) Residual earnings1 = Earnings1-(Required return*Investment0)
Furthermore we can calculate (RE) based on another mathematic formula:166
5) Residual earnings = (ROCE - Required Return on equity)*Book value of common equity
The growth of two drivers of residual earnings: return on common equity (comprehensive
earnings to book value of net assets) and book value of common equity cause the increase of
this ratio, which results the higher value of the company’s stock. RE company valuation relies
on both, forecasting ROCE and the growth of book value of common equity for the following
years. Both of these ratios are essential to compute RE in the next phase of the valuation,
which should be additionally discounted to present value. In the last phase to find the
company’s value, discounted RE should be added to the current book value.167 These phases
are summarized by the following mathematic formulas:
1) When residuals earnings is expected to be 0, after predicted period:168
6) VE0 = B0 + (RE1 / pE) + (RE2 / p
2E) +…+ (RET / p
TE)
2) When residual earnings is expected to be constant: 169
7) VE0 = B0 + (RE1 / pE) + (RE2 / p
2E) +…+ (RET / p
TE) + (RET+1 / pE – 1) / pTE
3) When residual earnings is expected to grow with stabile rate: 170
8) VE0 = B0 + (RE1 / pE) + (RE2 / p
2E) + (RE3 / p
3E) +…+ (RET / p
TE) + (RET+1 / pE – g) / pTE
4.1.5.2. Advantages and drawbacks
The biggest advantages of using this model are: focus on the value drivers (profitability),
investments are treated like the creation rather than lost of value, many accounting principles
can be applicable to it, protect investors for paying too much for companies171 and
furthermore is applicable even if the company does not generate free cash flow or not pay
165 Penman (2007), p. 156 166 Peterson Drake (2008), p. 1 167 Penman (2007), p. 164 168 Penman (2007), p. 168 169 Penman (2007), p. 169 170 Penman (2007), p. 170 171 Penman (2007), p. 175
35
dividends. The disadvantages of that model are: dependence too heavily on accounting data,
reliance on the assumption that book value can be a good reflection of owner’s equity in the
companies.172
4.1.6 The Abnormal Earnings Growth Model
4.1.6.1. Introduction
This model takes into consideration the future earnings and earnings growth in the company’s
valuation as the inventors of the AEG Model Ohlson and Juettner-Nauroth state: "In a very
real sense, the core of the [AEG] model shows how the current price depends on forward EPS
and their subsequent growth as captured by two dividend-policy independent measures of
EPS growth".173 To calculate the equity value based on this model some mathematical
quotation must be introduced: 174
9) Abnormal earnings growtht = Cum-dividend earningst - normal earningst 10) Cum-dividend earningst = Earningst + (pE-1) * dividendt-1
11) Normal earnings = pE * Earningst-1
To estimate the company’s value according these model it should be used the following steps:
"1. Forecast one year-ahead earnings
2. Add the present value (at the end of Year 1) of expected abnormal earnings growth for year
2 ahead and onward.
3. Capitalize the total of forward earnings and the value of abnormal growth."175
To summarize these steps one can apply the following mathematical formula:176
12) VE0 = 1 / pE - 1[Earn1 + AEG2 / pE + AEG3 / p
2E + AEG4 / p
3E + ...]
4.1.6.2. Advantages and drawbacks
The strong point of this model is the focus on the most useful financial ratio (P/E). The
paramount importance of that ratio draws the investors attention to the value added to the
companies from firms’ market operations. The model is also compatible with many
accounting principles.177 The research proved the applicability of this model in the reality.
According to Swedish scientists most of the stock prices calculated on this model assumptions
was closed to real.178 However, the model possesses also drawbacks such as: the compliancy
172 Peterson Drake (2008), p. 4 173 Jennergren / Skogsvik (2007), p. 2 174 Penman (2007), p. 205 175 Penman (2007), p. 204-205 176 Penman (2007), p. 204-205 177 Penman (2007), p. 213 178 Wingård / Viklund Emil (2007), p. 41

36
for laics, the lack of deeper inside into drivers of earnings, sensitiveness to the creative
accounting.179
5 Research strategy in practice
In this paragraph the authors discuss which concepts the researchers want to analyse to be
able to answer the research questions. And in addition to that they will introduce measures of
each concept.
5.1 Concepts in question
Bryman and Bell define concepts as: "…the building blocks of theory and represent the point
around which business research is conducted."180 They continue their explanations and state
that: "Each presents a label that we give to elements of the social world that seem to have
common features and that strike us as significant."181
In this research work four study areas are of major importance. The first deals with the
question if it is possible to find companies which have not experienced significant influences
from the financial crisis. Second, what the current real value of companies is. Third, how
market participants estimate the current situation. And fourth, what leads market participants
in their estimations (rationality or emotion). For every field of this study an adequate concept
must be found, which captures the particular area.
In the first study area companies should be detected which have not experienced significant
influences from the current financial crisis. Or in other words, companies which are still in a
similar condition in the times of the financial crisis as they were before the crisis. A concept
which reflects the financial situation of a company is the company's financial performance.
The authors are aware that this concept is highly aggregated because it aimed to reflect the
financial performance of the whole company instead of concentrating to a more detailed
concept like credit risk. Although one could argue that a more detailed concept like credit risk
might be a better one because it refers more directly to possible impacts of the financial crisis
(credit risk increased during the financial crisis) and because of that gives a deeper insight in
how companies may be influenced by the financial crisis, the authors choose the more
aggregated concept of company's financial performance. The main reason for this are, that the
financial crisis has not only obvious or direct influences on companies like a declining
lending willingness or maybe higher interest rates for borrowing and as a result higher cost of
capital, but also indirect influences like the decline of demand as a result of declining
purchasing power because many people have lost their jobs in the economic downturn. An
179 Penman (2007), p. 213-215 180 Bryman / Bell (2007), p. 157 181 Bryman / Bell (2007), p. 157

37
aggregated concept like company's financial performance captures these indirect influences,
too.
The second study area refers to the current real value of the company. In this part the authors
want to detect how much a company is really worth. An appropriate concept of this study is
the fundamental value of the company. The authors believe that the fundamental value is the
real value (or an estimate as close to the real value as possible) of a company because as
described in the introduction of the behavioural finance theory framework, market values
might be driven by market participants emotions and by that fluctuate from the appropriate
value the business is really worth. By using the method of fundamental analyses an analyst or
investor tries to detect: "…intrinsic values, warranted values, or fundamental values."182 The
term intrinsic value describe according to Penman: "…the worth of an investment that is
justified by the information about its payoffs."183 In other words: With the use of fundamental
analyses an investor tries to concentrate on discovering the real value of an asset which is
determined by its future payoffs. By that he avoids being miss leaded by his emotions and as a
result get as close as possible to the real value of the company. Because of that the authors
believe that the fundamental value is the right concept in the third study field.
The third study field deals with the market participants’ estimation of the situation of the
financial crisis. The concept that describes market participant's estimation of the current
situation is the market value of an asset. According to the Efficient Market Hypothesis any
new information appearing will be included into the market value of an asset though supply
and demand which result from market participants estimations of the current situation with a
new peace of information. Because of that the concept of the market value should be used in
this study to describe the market participants’ estimation of the current situation.
The fourth study field refers to the reasons why the market participants estimate the current
situation in the way they do. What leads the market participants in their estimations? Are
market participants acting rational or are their actions driven by emotions? These kinds of
questions are difficult to answer because they require extensive surveys about the feelings,
hopes and fears of market participants. Although it is difficult, the authors want to include a
concept that reflects the emotional condition of the market participants in their work. The
concept which fits best it is confidence. The authors are aware that only the concept of
confidence can describe the whole emotional situation of the market participants but in a
relatively small research project like this work is useful, as it describes partly the emotional
condition of market participants and (as we see later) data about the confidence of market 182 Penman (2007), p. 4 183 Penman (2007), p. 4

38
participants is provided by several financial service providers and thus relatively easy to
gather without extended surveys.
5.2 Finding adequate measures of the concepts
After the introduction of the concepts which should be examined in this study, the next step is
to find adequate measures of these concepts. Following a quantitative research strategy, which
is the fundament of this study as described in the beginning, the introduced concepts must be
measured. After the concepts of a study are measured they reveal insight in the studied topic
in the form of relationships (independent or dependent variables) between them. By that hey:
"… may provide an explanation of a certain aspect of the social world, or they may stand for
things we want to explain."184 Moreover measures have many advantages. The most important
of them are: Measurement allows to detecting fine differences, measurement provides a
consistent device and measurement allows more precise estimates of the degree of
relationship between concepts.185 It should be pointed out that when determining appropriate
measures it must be vigilant about that the measures must be reliable and valid and of course
that they are related in a special manner to the possible financial crisis impacts.186
5.2.1 Measures of company's financial performance
When it comes to find appropriate measures for the first concept "company's financial
performance" many authors in various articles give recommendations. The article "Pricing
with performance-controlled multiples"187 deals with the accuracy of the valuation of a
company with multiples. The author state that the company's earnings are a:" …highly
aggregated performance measure."188 In contrast to earnings multiples, book equity, invested
capital or sales multiples lead to a smaller pricing accuracy.189 The results of the study "Stock
Prices and Accounting Information: A Review of the State of Play"190 even confirms the view
of Herrmann and Richter. The authors claim that:" …a number of studies that explore the
value relevance and predictive power of accounting variables in a wide range of countries
around the world. These studies generally find that book value and earnings can explain a
substantial part of the variation in share prices, and that they can play a useful role in
predicting future returns." This quote includes three main advantages regarding this study.
First, earnings and book value of a company can predict future returns in an appropriate way.
184 Bryman / Bell (2007), p. 158 185 Bryman / Bell (2007), p. 158 186 Bryman / Bell (2007), p. 162-168 187 Herrmann / Richter (2003), p. 194-219 188 Herrmann / Richter (2003), p. 217 189 Herrmann / Richter (2003), p. 217 190 Pirie / Smith (2008), p. 22-36
39
This feature is important when it comes to the observation of company performance during
the crisis. Two other advantages, which are not connected with this paragraphs topic of
finding a measure for the concept but not less important, are that these two figures can explain
a great part of the variation in share prices and the value relevance of this numbers. These two
advantages become more important when it comes to miss pricing of shares and the real
(fundamental) value of a selected company. In short, the results of both articles show that
earning and book value multiples are appropriate measures of firm performance.
However, the authors want to add other measures for these concepts to account for the special
situation of the financial crisis. Because of that three more measures should be introduced
which first measure the company's financial performance and second are especially connected
with possible financial distress. The article " The Early Indicators of Financial Failure: A
Study of Bankrupt and Solvent Health Systems"191 deals with the topic of how financial
failure can be detected as soon as possible. Although this article refers to health systems as
study subjects the authors of this paper believe that the results can be transferred to the
company sector because the principles of funding are always the same. The author of the
article found that: "Traditional measures of financial performance related to debt and
receivables management did not provide such clear early warning signals of problems for the
bankrupt health systems."192 Instead he suggests to using cash flow related figures. Three
ratios are of main importance for him: Operating Cash Flow (percentage change from prior to
current period), Operating Cash flow to net revenues, Cash Flow to total liabilities.193 Because
of the before mentioned connection of these figures to financial distress the authors of this
paper will include these measures in their work. Only for simplification purpose the authors
will summarize the three different cash-flow related measures to one measure, namely
Operating Cash Flow.
In summery the authors of this study will use three figures to measure the concept of
company's performance. These measures are:
• Earnings
• Book value
• Operating cash flow
These measures (or indicators) will also be the selection criteria when it comes to find
companies which are not influenced by the financial crisis later in this paper.
191 Coyne / Singh (2008), p. 333-345 192 Coyne / Singh (2008), p. 343 193 Coyne / Singh (2008), p. 343
40
5.2.2 Measure of fundamental value
The third area of interest – the real value of the company - is described by the concept of
fundamental value. As one can see in the part "Valuation Models" of this study there exist
many different possibilities to measure the fundamental value of a company. Several
valuation models with different input variables can be employed to calculate the value of a
firm. Because the models differ quite a lot the authors draw up a certain section named
"Selecting a Valuation Model" to discuss in a greater extent why they choose a certain
valuation model as a measure of the concept of fundamental value. Because of that and
because this concepts increase importance first when it comes to the valuation of the selected
company the measure of the third concept will be introduced later in that specific section.
5.2.3 Measure of market value
The measure for the concept of market value of a company is of course the share price. The
market value of a company can be calculated by multiplying the actual price of common stock
of a company with its shares outstanding.194 In this study the share price should be used as the
measure of a company's market value.
5.2.4 Measure the market participants confidence
By measuring the market participants’ confidence the researchers fondly hope to insight in the
emotional condition of the investors during the financial crisis. Bodie, Kane and Marcus
recommend confidence indices as an appropriate measure to estimate the market participants’
current confidence in the situation. The authors state that a "Confidence Index" which
includes data from the bond market gives insight in market participant's estimations, because:
"… the actions of the bond traders reveal trends that will emerge soon in the stock market."195
Furthermore Bodie, Kane and Marcus recommend a confidence index computed by the
company Barron's. As it was not possible for the researchers of this paper to gather data of
Barron's confidence index they use an index computed by the State Street Corporation. It is
stated on the company's webpage the State Street Confidence index. " … measures the
attitude of investors to risk."196 The index was developed by the Harvard professor Ken Froot
and an associate of State Street Corporation. The confidence index provides a measure of
actual and changing risk included in investment portfolios and gives by that insight in the
actual confidence of investors.197
194 Bodie / Kane / Marcus (2008), p. 604 195 Bodie / Kane / Marcus (2008), p. 412 196 www.statestreet.com/investorconfidenceindex/ 197 www.statestreet.com/investorconfidenceindex/

41
6 Seeking not influenced companies
After defining the questionable concepts and their measures the first step of finding an
appropriate valuation case can be taken, the detection of companies which are not influenced
by the financial crisis. To discover appropriate cases the following questions must be
answered: What indicates that a company is affected by the financial crisis?, Which and how
many companies should be researched?, How do the researchers want to find a cases out of
the not affected firms that they valuate with the chosen valuation model? What assumptions
and criteria do they use? In the next paragraph the authors will discuss these issues in detail.
6.1 Definition of selection criteria
As mentioned before in the paragraph "Measures of company's financial performance" the
concept of a company's performance should be measured by the use of three indicators which
are: earnings, book value and operating cash flow. By observing these criteria during the time
before and in the financial crisis companies which are not influenced by the financial crisis
will be detected. How the sorting of companies will be deducted in detail is described in the
next paragraphs.
6.2 Definition of research sample
6.2.1 The research sample
The ideal sample for the authors would be the entire stock market. There are two main reasons
for that. First, if the entire market is researched the possibility of finding companies which are
undervalued and at the same time not influenced by the financial crisis is greater. Second, and
this must be seen as the main reason, the possibility of generalisation is given if the whole
market is examined. For example is it possible for the researches to give statements if
undervaluation can be observed to a greater extent in the small firm sector or in the sector of
the biggest firms. Or maybe companies of certain branches (for example the energy industry)
are not affected to such a great extent like companies of the banking or automotive industry.
In short, exploring the whole market gives more knowledge in which parts of the market
possible undervaluation is more common. The knowledge, gained by this study would be
greater.
Because the extent of this study does not allow to examining the entire market the authors
must limit themselves to a smaller sample. The search of an appropriate research sample is
guided by two criteria from which the first must be seen as more important than the latter: The
sample should allow an overview over different (most important) industries and by that
197 www.statestreet.com/investorconfidenceindex/

42
provide the possibility of generalisation of results; the sample should include companies
where an undervaluation can be anticipated.
The first criteria lead the researchers to the idea to research constituents companies of stock
market indices because an index includes several companies from different branches which
would allow for generalisation. The second criteria lead the researchers to the use of an index
that include small sized companies. If one recall the market anomalies introduced in the
paragraph (3.1.4 Market anomalies) one might remember that miss pricing or undervaluation
can be found in the sector of small sized companies which because these companies are less
carefully observed by market participants.198 Because the financial crisis starts in the United
States the index that should be the research sample of this study is the S&P 600 Small Cap
Index (The market capitalisation of constituents must be located between 200 million USD
and 1,0 billion USD).199 The authors are aware that they can't make any generalisations
regarding different firm sizes if they select the S&P 600 Small Cap Index. The authors must
accept this disadvantage because first of all they have to deduct the study according to the
research purpose of their study. The purpose of this study is finding a company that is not
affected by the financial crisis and detect its undervaluation and not finding out which kind of
companies (small or big ones) are more likely to be not influenced by the financial crisis.
6.2.2 Exclusion of the telecommunication industry
When the authors divided the S&P 600 index according to different industries, they reveal
that one industry (telecommunication service) is consists only of a few companies. First, such
small industry including only four companies can not reflect the situation in the whole
industry. Possible reason of a small number of telecommunication companies in the S&P 600
index might be a result from the industry specifications. Because economies of scale play an
important role in this branch most of the companies operate in this business field are included
in stock indices including medium or big sized companies. Second, the average results for this
industry can be affected too much by one company that differs significantly from the others in
the branch. Because the industry average of each indicator is important for further
calculations a significant change in the average resulting only from one company will
adulterate the results of further calculation. Such situation occurs during the calculations for
the telecommunication industry, because the financial indicators of Neutral Tandem differ
from others companies in the branch significantly. Because of that the authors exclude the
companies of the telecommunication branch from their research sample.
198 Bodie / Kane / Marcus (2008), p. 375 199 www.standardandpoors.com

43
6.3 Definition of seeking concept
6.3.1 Difficulties
One of the most difficult questions of this research paper will be discussed in the following:
How does one find a company which has not experienced significant influences from the
financial crisis?
This prime question involves many sub questions which must be answered. Some of the main
questions are presented in the following list:
• Is a company affected by the financial crisis if the key indicators change negatively or
positively?
• In which extent can key indicators change to state that companies are not affected by
the financial crisis?
• What is a normal state for the particular company?
• How should the normal state be found?
• How should the normal state be combined with the financial crisis?
• Does a normal state of the company should be depended only on companies’
performance or on the industry performance?
• Is a company affected by the financial crisis although its key indicators fall in value,
but the firm still performs better than other companies in the branch?
• Or is a company affected by the financial crisis if its key indicators grow, but they
increase slower than whole industry?
6.3.2 Basic idea
After the discussion of all this issues a final seeking concept was found, that is based on the
following condition:
A company must be seen as not influenced by the financial crisis if the company performs
according the industry average (which is an extrapolation of the historical industry average
development calculated from the time 2004 to 2006) in the times before as well as during the
times of the financial crisis (2006 – 2008).
This condition combines company performance with branch performance. This is essential
because if the industry a company belongs to is not taken into account one cannot make a
statement if a certain company is influenced by the financial crisis or not. If for instance the
data of a certain a company in the years before and during the financial crisis is compared and
the company shows a stable performance, one might say that this company is not influenced
by the crisis. If however, the whole industry of this particular firm performs better, than the

44
company, the firm must be seen as affected by the financial crisis although its performance is
stable when only the data of this particular company in the times before and during the
financial crisis is compared. Because of this the consideration of the specific firm
performance in connection with the average branch performance is of major importance to
detect uninfluenced companies. In short, a company can only be seen as not affected by the
financial crisis if it performs according to its industry average.
To be able to compare industry and company specific values industry average and firm
specific growth rates should be calculated. The standard deviation of the average growth rate
form the industries should be used to establish minimum and maximum growth bands. Only
the companies with growth figures which are located in between this, from historical values
from 2004 to 2006 calculated bands, can be seen as not affected by the financial crisis.
Moreover it is essential that the companies’ growth is located in between these bands during
the time of the financial crisis as well as before the financial crisis. This is to avoid the
following scenario. If for instance a company performs above the industry average before the
financial crisis and performs in relation to the industry average in the financial crisis this
means that the company is negatively affected by the financial crisis. Now, if the only
condition would be that the company must perform in relation to the industry average in the
times of the financial crisis the above mentioned company would fulfil this condition (and
because of that is seen a not affected company) although it was influenced in a negative
fashion during the financial crisis. To avoid that this kind of cases it is essential that the
companies develop according to the industry average before and in the times of the financial
crisis. Therefore the company performance must be located between the minimum and
maximum bands in both periods (before and during the financial crisis).
6.3.3 Defining an observation period
As mentioned in the paragraph before the observation period in which companies must
maintain certain levels of the established indicators should be from the year 2004 to 2006 for
the time before the financial crisis and 2007 and 2008 for the times of the financial crisis.
The authors decide to establish a time period of only three years for the time before the
financial crisis. This decision has several reasons. First, the economy nowadays is ruled by the
process of creative destruction. This means that our companies experience rapidly
technologically and social changes, which both destroy and launch a new companies, create
new industries, modify economical cycles, shorten the product life and as a result influence
the economic performance of companies (in the case of this study measured by earnings, book
value or cash flow). Thus the company indicators fluctuate to a great extend in unpredictable
45
directions. If for instance, among an industry a break-through innovation is discovered, it can
lead to a rapid change in the demand, which in turn influence the firm’s economic
performance and thus the measures established in this research. That is why the authors
consider that it can be too risky to include a longer period than three years before the financial
crisis in order to set the bands of average economic indicators for each industry. If the authors
would decide to choose a longer time period, the variance of the earnings, book value and
cash flow could be significantly higher. This might lead to the setting of too wide bands,
which will result the inclusion of too many companies sorted out as not affected by the
financial crisis. In order to avoid the selection of too many companies, the researchers decide
to use only a three years observation period for the companies indicators before the financial
crisis.
6.3.4 Mathematical Implementation of the seeking concept
After introducing an concept according to that the not influenced firms should be sorted out
the researchers had to implement this concept in an excel spreadsheet that allows for
proceeding the 600 constituent companies of the S&P 600 Small Cap Index. The spreadsheet
(for each indicator one spreadsheet was established) was created according to the following
explanation:
First, the average value of the indicator from 2004 to 2006 is calculated. The numbers at the
bottom line of each industry are the industry values. After that, the growth rates from the year
2004 to 2005 and 2005 to 2006 as well as the average growth from 2004 to 2006 of the
indicator were calculated. The standard deviation of the two growth figures was calculated
afterwards. For each industry bands were established which reflect the average growth plus
two times the standard deviation. If the average growth of an industry is for instance 15% and
if the standard deviation of growth is 8% than the maximum band is 8% x 2 + 15 = 31% and
the minimum band is 8% x 2 – 15 = -1%. By the introduction of bands a corridor of possible
growth values for the years 2004 to 2008 is created. Under "normal" conditions (the absence
of the financial crisis) most of the growth rates of the companies in 2004 and 2008 will lay
between the minimum and the maximum band in the created corridor.
In the second table sheet in the excel file first the average of the values of the particular
indicator is of the years 2007 and 2008 is calculated. Afterwards the growth rate of the value
of the indicator form 2006 to 2007 and from 2007 to 2008. Moreover the average of the
growth rates is calculated. At this stage two conditions are implemented which reflect the
seeking concept the researchers established in under the point (6.3.2 Basic idea).

46
With the first condition it is proved if the average growth of the indicator of the years 2004
too 2006 is located in the established bands. If that is the case the condition is fulfilled.
The second condition refers to growth rate of the indicator in the times if the financial crisis.
With this condition it is proved if the average growth rate from the years 2006 to 2008 is
located between the minimum band and maximum band. If that is the case the condition is
fulfilled. This means that the particular indicator grows in relation to the industry average –
the company can be viewed as not influenced by the financial crisis. If the average growth of
the years 2006 to 2008 is not situated in the bands (growth is greater or smaller). This means
that the particular indicator grows either too much or too little in the time of the financial
crisis in relation to the industry – the company is either influenced in a good or in a bad
fashion by the financial crisis. These kinds of companies are sorted out by this condition, too.
Only the company which passes both conditions in each of the key indicators can be seen as
not influenced by the financial crisis because the indicator grows before an in the times of the
financial crisis in relation to the historical industry average. Only companies which fulfil both
conditions in each indicator will be part of further investigation.
6.4 Selecting of an appropriate case for further investigation
The selection process which followed the above described calculations and includes all
constituents companies of the S&P 600 Small Cap Index (detailed description of underlying
data can be found in the appendix number 14) lead to the following results. Firms which are
according to the researchers approach not influenced by the financial crisis are:
• Applied Ind'l Tech (AIT), Industrials
• Boston Beer Company (SAM), Consumer Staples
• Casey's General Stores Inc. (CASY), Consumer Staples
• Curtiss-Wright Corp. (CW), Industrials
• Hain Celestial Group (HAIN), Consumer Staples
• J & J Snack Foods (JJSF), Consumer Staples
• Lance, Inc. (LNCE), Consumer Staples
• P. F. Chang's China (PFCB), Consumer Discretionary
• Peet's Coffee (PEET), Consumer Discretionary
• Pre-Paid Legal Svcs (PPD), Consumer Discretionary
• Red Robin Gourmet (RRGB), Consumer Discretionary
• Stratasys Inc. (SSYS), Information Technology
• WD-40 Company (WDFC), Cosumer Staples

47
Thirteen companies out of 600 pass the restrictions the researchers established to find
unaffected firms. Because the extent of this research paper is limited the authors will select
the most promising case for further investigation. The authors are of the opinion that a
company that indicator values steadily rise must be seen as most promising, because first each
of this companies must be seen as not affected by the financial crisis and in addition to that
continuously rising indicator values of certain companies indicate that the company performs
slightly better year after year. A drop in the share price by especially this kind of companies
first, should be really rare and second if a drop in share price should be really the case this
must be seen as a strong indication of possible undervaluation. If one compare the
development of the indicators of the selected companies (see Appendix 1 – 13) then one can
recognize that only one company shows a slightly continuous upward trend namely: Applied
Industrial Tech (AIT). The mentioned company shows from year to year in all indicators a
slightly increase.
7 Valuation of a selected case
7.1 Selecting an appropriate valuation model
Under the point (4.1 Valuation models) of this work, the authors describe the different models
of company’s valuation with stressing their weak and strong points. However, when the
situation of the financial market is tension, the authors should carefully check it again to
choose the most suitable model to conduct the current company valuation. The authors decide
to use the Residuals Earnings Model, because of several reasons.
Initially, the authors of two academic articles recommend residual earnings based valuation as
accurate measures of the firm value. First, the article "Residual-Income-Based Valuation
Predicts Future Stock Returns: Evidence on Mispricing vs. Risk Explanations"200 written by
Ali, Hwang and Trombley support the residual-income-model because the authors used this
model to estimate the fundamental value of companies in their study. Moreover this model is
especially suitable to predict future stock returns.201 Second, Pirie and Smith state in their
paper "Stock Prices and Accounting information: A Review of the State of Play"202 in which
they review the theoretical background of the residual income model and after that discuss the
results of empirical studies based upon it, that: "These findings suggest that the residual
income model, and the Ohlson version of it in particular, form a useful framework for
exploring empirical relationships between share prices and accounting figures."203 In
200 Ali / Hwang / Trombley (2003), p. 377 - 396 201 Ali / Hwang / Trombley (2003), p. 394 202 Pirie / Smith (2008), p. 22 - 36 203 Pirie / Smith (2008), p. 34

48
summary, one can say that the findings of both articles support the use of the residual-income-
model. Firstly because of, it is used in both studies to discover the fundamental company
value and secondly, the model has a special relationship with share prices. These relationships
must be seen as a special advantage when it comes to the comparison between share price and
fundamental value of certain companies.
Moreover the decision in favour of the residual earnings valuation approach has some
technical advantages. The central point of this model there are residual earnings, which testify
about the profitability and growth of the company.204 In order to calculate the RE, information
about the ROCE has to be possessed, which points out how the company generates the
earnings from shareholders’ investments in the firm. In other words ROCE is the rate of
return from 1$ invested by the shareholders in the company. There is a good point of
companies’ comparisons, because it shows how the companies generate the earnings in the
time of financial crisis. Some of them can be better adopt to deal with the financial crisis,
because their management could predict the appearance of the storm of the financial market
and prepared company to that event or firm’s wise strategy includes the elements, which
protect them from negative consequences of financial disturbance (2007 - 2009). Generally,
that element of the computation of Residual Earnings Model is in the bigger extent rational,
because it shows the skills of management of leading the company in difficult times of the
financial crisis and firm’s flexibility to adoption to the permanent changing conditions.
However, other elements of the Residual Earnings model: required return of equity and book
value, are to great extent affected by the irrationality of the financial markets in the time of
financial crisis. The companies required rate of return depends on the assessment done by the
credit rating agencies. At the first glance, the analyses of companies’ performance are
conducted by the specialists, who scrutinize carefully all available public financial
statements205 to assess the credibility of the company. The higher company’s credibility, the
lower interest rate is for it.206 It is important to stress that credit rating agencies have managed
with their role quite well for many years.207 However, it must be stated that they operate in
such unstable business surrounding first time, because their role in the economy became
bigger just after the Great Financial Crisis (1929 - 1933) and since that crisis the world have
not copied with such huge disturbance on the financial markets again. Moreover the rating
agencies have been one of the creators of the financial crisis, because they did not asses
204 Penman (2007), p. 372 205 Kim / Nofsinger (2007), p. 79 206 Kim / Nofsinger (2007), p. 80 207 Kim / Nofsinger (2007), p. 81

49
properly the risk of collateralized debt obligations (CDO). They were too optimistic according
to the credibility of such financial instruments.208 If they had predicted too optimistically
performance of CDO, they could be too pessimistic of the assessment the companies’
credibility in the times of financial crisis, which could result the higher rates of required
return. The research, which has been done by one of the biggest rating agencies (Moody's),
shows that the percent of global speculative-grade companies has been increased from 1,5%
to 7,1% during one year.209 In which extent, this rapid change is caused by rational facts taken
from financial statements and in which extent, by the psychological patterns described by the
authors in the paragraph ‘behavioural finance’. Another part of model - book value is the
difference between assets and liabilities. It represented the shareholders investment in the
company.210 In the times of the financial crisis shareholders usually liquidate their
investments into companies. However, this process can be speeded up by the phenomena of
herds, which the authors explained earlier and causes that most of the investors used to buy
stocks "high" and sell them "low". It is contradicted to profitable investment strategy.211 We
can conclude that this model contain the features with absorb also the irrational behaviour of
human nature. That’s why the price, which are set based on it combine the irrational and
rational elements. It can be interested how the stock exchange real price is different from this
computed price based on models to observe how the stock exchange is affected by the
irrationality.
7.1.1 Necessary financial Data
To be able to apply the residual earnings valuation model, certain financial data must be
collected from the selected case companies. The necessary financial data result mainly from
the residual earnings drivers. Residual earnings are driven by the following items: Return on
common equity (ROCE), cost of capital for equity and the book value of common equity.212
All of these items except the ROCE must be collected from the financial statements of the
case companies. The ROCE must not be collected because it can be calculated with the help
of the following equation:213
13) Earnt – (pE – 1)Bt-1 = [ROCEt – (pE – 1)]Bt-1
208 The Wall Street Journal (2009) 209 www.moodys.com/ 210 Penman (2007), p. 155 211 Lynott (2008), p. 72-73 212 Penman (2007), p. 162 213 Penman (2007), p. 162

50
To be able to calculate the future book values (book values during the forecast horizon) two
other items must be added to the yet existing ones. The future book values are calculated
according to the stocks and flows formula:214
14) Ending book value = Beginning book value + Comprehensive Income – Net dividends
From this equation it follows that data about the net dividends of a company must also be
collected so that the list of necessary date now consists of four items: Earnings, book value,
net dividends and required return on equity.
Since the object to be valued in this study is are a company on terms of shares (equity) some
of the general items mentioned can be changed to share related items: Earnings per share
(EPS), dividends per share (DPS), book values per share (BPS).215
When it comes to the calculation of the continuing value another figure might be needed. In
case the residual earnings after beyond the forecast horizon increase at a certain amount a
year, then the growth rate of residual earnings is needed, too.
The definitive list of necessary data consists therefore of: Earnings per share (EPS), dividends
per share (DPS), book value per share (BPS), cost of capital for equity and (if the certain case
requires that) the residual earnings growth rate after the forecasting horizon.
7.1.2 Estimating the cost of capital
The cost of capital for equity is also called opportunity cost of equity financing and describes
the rate of return that is required by the company's common shareholders ("Cost of capital is
the opportunity cost of having money tied up in an investment"216). Estimating the cost of
capital for equity is an important step in valuating shares (or companies) as it is used in the
calculation of the residual earnings and as it is the figure by that the future residual earnings
are discounted to present the present value. Penman217 as well as Copeland, Koller and
Murrin218 recommend to using the capital asset pricing model (CAPM) to calculate the cost of
capital for equity. Copeland, Koller and Murrin summarize the idea behind this technique as
follows: "CAPM postulates that the opportunity cost of equity is equal to the return on risk-
free securities plus the company's systematic risk (beta) multiplied by the market price of risk
(market risk premium)."219 This relationship is described by the equation:
15) ks = rf + [E (rm) – rf] (beta)
214 Penman (2007), p. 165 215 Penman (2007), p. 167 216 Penman (2007), p. 99 217 Penman (2007), p. 167, 474 218 Copeland / Koller / Murrin (2000), p. 214 219 Copeland / Koller / Murrin (2000), p. 214

51
Consequently, before one arrives at the cost of capital for equity one must first determine the
variables of the equation.
7.1.2.1. Estimating the risk free rate
The first step that should be taken is to estimate the risk-free rate. In theory the risk free rate
is the return on a portfolio which has no risk and it is in addition to that totally uncorrelated
with any returns in the economy. The most appropriate risk-free rate is therefore the return on
a zero-beta portfolio with a minimum variance. Because contracting this kind of portfolio is
complex and costly it is not common in estimating the risk-free rate.220
The authors Copeland, Koller and Murrin recommend to using a 10-year Treasury-bond rate.
Reasons for that are according to the authors: It is a long-term rate which normally matches
the duration of the cash flow of the company of investigation, it approximates the duration of
stock market index portfolios like the S&P 500, it is less sensitive to unexpected inflation
changes and the liquidity premium which is built into the rate might be slightly lower than
that of 30-year bonds.221 Penman also mentioned bonds that cover the duration of the
investment as a "readily measured" risk- free rate.222 Because of the author's
recommendations the rate of return of 10-year U.S. Treasury Bills (at the end of 2008) will be
used as the risk-free rate in this study which amounts 2,240%.223
7.1.2.2. Estimating Beta
The company's beta represents: "…the sensitivity of the investment's return to the market
return…"224 The beta of a specific company is determined by the covariance of the returns on
the specific company and the return on the market, divided by the variance of the return on
the market.225
Company's betas are ready calculated by financial data service providers and therefore can be
downloaded from the service provider's databases. The problem this pre calculated beta
estimations is that they are mostly related to the S&P 500 index. Because in this paper the
S&P 600 Small Cap Index is used the authors calculated their own beta estimations for this
paper. The beta the researchers compute reflect the correlation between the selected case
company and the S&P 600 Small Cap Index. Moreover, the calculation of own beta estimates
protects the writers from the confusion caused by different beta estimates given by the
220 Copeland / Koller / Murrin (2000), p. 215 221 Copeland / Koller / Murrin (2000), p. 216 222 Penman (2007), p. 114 223 www.finance.yahoo.com 224 Penman (2007), p. 114 225 Penman (2007), p. 114

52
financial data service providers. Furthermore, most of the financial data service providers do
not offer the historical betas for a particular day and the authors need the selected company’s
beta for the 31.12.2008 to be accurate and reliable in the valuation of case.
In order to calculate AIT’s beta, firstly the authors computed the monthly returns from both,
the selected company and the S&P 600 Index (detailed description of the collection of data
can be found in the appendix 14). Next, the covariance between the returns of the selected
company and the index was calculated. The covariance between these two variables was
positive, but very low (0.0028) in the years 2004 – 2008. This means that the strength of the
linear relationship between these two variables was very weak. Furthermore, the variance of
S&P 600 was computed and it was also very low (0.0026), which indicates that the monthly
returns of the index was almost similar to each other in the period 2004 – 2008. Finally, the
selected company’s beta was calculated by the division of its covariance (with S&P 600) with
the variance of S&P 600 index and it amounted 1.1377. This number states that the volatility
of the company’s returns exceeds that of the index by 13.77% in the period 2004 – 2008.
7.1.2.3. Estimating the market risk premium
The only variable which is still missing is the market risk premium. The market risk premium
describes the price of risk and is calculated by subtracting the risk-free rate of return by the
expected rate of return on the market portfolio.
The estimation of the market risk premium turned out to be difficult. First, the authors try to
compute the risk premium by themselves. However, the result was not satisfactory. The
calculation relies on first finding the yearly returns from S&P 600. Second, the average return
is calculated for the time period chosen by the authors. Finally, from the average market
return of the particular period the risk-free rate is subtracted. The authors chose data from
different time periods from which they then calculated the market risk premium. In the case of
years 1989 – 2009 the market risk-premium amounts 8.52%. If data from the period 2004 –
2008 was used the risk-premium amounts 12.54%. Moreover, the market risk premium for the
time of the financial crisis (2007 – 2008) was negative at a value of –0.5%. Such great
discrepancy of results causes the untrustworthiness of the authors’ results. Furthermore, it is
difficult to predict the market risk premium for 2009, because of the uncertainty about the
actual situation. Usually the stock exchange (share prices) anticipates first the recovery from
an economic recession. However, because of the scale of financial crisis it is difficult to state
that stock exchange will recover in 2009. That’s why the authors decide to take the risk
premium from the article: "Market Risk Premium: Required, Historical and Expected". In this
article different experts recommend the use of different historical market risk-premiums. The

53
writers decide to use the lowest from the proposed, because in the time of the financial crisis
the risk-premium must be low. An indications for that is the risk-premium the authors
calculated from data of the years 2007 to 2008 which had a value of – 0,5%. The market risk-
premium for further calculations will be 3%.226
7.1.2.4. Calculation of the cost of equity capital
The cost of equity capital for further calculations in this work results from the formula:
16) ks = rf + [E (rm) – rf] (beta)
If the equation is applied with the use of the before established estimates of the variables it
results:
ks = 2,240% + 3% * 1,1377
The cost of equity capital is therefore 5,653%.
7.1.2.5. Criticism of the CAPM method for estimating the cost of equity capital
At this stage it is important to mention that the CAPM technology for estimating the cost of
capital for equity has serious drawbacks. For one, different commercial service providers
offer different beta estimates, each claiming that their own estimate is the most accurate. In
short: "No one knows the true beta and inevitably betas are measured with error."227
Moreover, and this is even a greater issue, the determination of the market risk premium is
problematic. Like the variation in the beta estimates the numbers for the market risk premium
also vary from one another (sometimes in a very extent way).228 And of course: "…this degree
of uncertainty, estimates of required returns are likely to be highly unreliable."229
Unfortunately the authors of this paper have to deal with these drawbacks, because: "…
despite a huge effort to build an empirically valid asset pricing model, research in finance has
not delivered a reliable technology. In short, we really don't know what the cost of capital for
most firms is."230
7.1.3 The forecast horizon and growth rate of RE after the forecast horizon
7.1.3.1. Determination of the forecast horizon
In the book "Financial Statement Analysis and Security Valuation" from Penman the forecast
horizon lasts for five years. Unfortunately, the authors’ had to undertake the valuation with a
226 Fernandez (2004), p. 4 227 Penman (2007), p. 115 228 Penman (2007), p. 115 229 Penman (2007), p. 115 230 Penman (2007), p. 116
54
shorter forecast period, which lasts only for three years. The reason of for this is caused by the
availability of data delivered by the DataStream database, which was used by the authors to
collect the forecasts of EPS and DPS. The database offers only expert forecasts of these
variables for three years. The reason for the shorter period of available forecasts might be
caused by the uncertainty connected with the financial crisis. The financial experts might be
afraid of the accuracy of their predictions in the environment of financial crisis, and this in
turn might be the reason why only forecast estimates of three years are available in the
DataStream database. In short, the decision of the length of the forecast horizon was not
driven by methodological considerations but by the fact that forecast estimates were only
available for three years.
7.1.3.2. Determination of the growth rate of RE after the forecast horizon
The estimation of the growth rate of RE after the forecast horizon is pivotal for the calculation
of the company value because even small changes of this figure can lead to a great change of
the company value. That’s why the authors had a fierce discussion about this variable.
Penman recommends as one possible growth rate for residual earnings the GPD rate.231 The
authors will not follow his advice since they are of the opinion that the actual growth rate is
driven by the financial crisis and thus is not a favour. Another possibility is to take the 5 year
average growth rate of earnings which is 15.32% for this company. According the authors, the
maintenance of such dynamic is impossible in the face of financial crisis (too optimistic).
From the authors point of view the growth of residual earnings for the years 2009 – 2011 is an
adequate growth rate because it takes into account the growth for the next few years which
seem to be a realistic growth for the future years. Thus, the authors decide to choose the three
years average growth rate of residual earnings form the years 2009 to 2011 which amounts
2,38%.
7.1.4 Calculating the value of the selected case according to the RE model.
In the following paragraph the detailed calculations are presented which in the context of
valuation using the residual earnings model were implemented. The calculation of the
company value by using the residual earnings model is guided by the calculation Penman
used when applying the residual earnings model.
231 Penman (2007), p. 172
55
7.1.4.1. The starting position
The calculation of the fundamental value of the company starts with the gathered data (a
detailed description of the collection of data can be found in the appendix 14). The data that
represents the starting point of the calculation is: The book value per share in 2008 (11,88
USD), the forecasted earnings per share (1,44 USD 2009, 1,27 USD 2010, 1,49 USD 2011)
and dividends per share (assumed to stay stable at 0,60 USD) for the forecast horizon, the RE
growth rate of 2,38% and the cost of equity capital of 5,653%.
7.1.4.2. Detailed description of the calculations
Initially the stocks and flows equation is applied to forecast the book value per share for the
forecast horizon:
17) Ending equity = Beginning equity + Total (comprehensive) income – Net payout to shareholders
This general relationship applied in the special case of company valuation will result in:
18) Bt = Bt-1 + Earnt – dt
The ROCE now can be calculated by applying the next formula:
See formula 13 of this study
For simplification issues one can reformulate this formula as follows:
19) Earnt / Bt-1 = ROCEt
After that the residual earnings for the forecast horizon can be calculated in two ways. First,
one can start with the earnings and book values and use the formula below to calculate the
residual earnings for the forecast horizon:
20) REt = Earnt – (pE – 1)Bt-1
Second, one can start with the forecasts of the ROCE and use the ROCE equation above to
calculate the residual earnings for the forecast horizon.
Next, the value of the residual earnings discounted to the time 0 is calculated for each year of
the forecast horizon:
21) VREt0 = REt / p
tE
After that, the present values of all residual earnings are added together to calculate the total
present value of residual earnings for the forecast horizon:
22) VRE0 = VRE1
0 + VRE20 + VER3
0 + … + VRET0
As a next step, the so called "continuing value" is calculated. As mentioned before there are
three different possibilities how residual earning may develop in the future (beyond the
forecast horizon: The residual earning might be zero after the forecast horizon, residual

56
earnings might be stable (not growing) after the forecast horizon or residual earnings may
grow at a constant rate after the forecast horizon.
In the first case, if the residual earnings are zero after the forecast horizon no additional
calculations are necessary because there is no continuing value of residual earnings.
In the second case, if the residual earnings after the forecast horizon are sable, the continuing
value can be calculated by the following formula:
23) CVT = (RET+1 / pE – 1)
In the third case, if the residual earnings grow at a constant rate after the forecast horizon the
equation below must be used to calculate the continuing value:
24) CVT = (RET+1 / pE – g) After that, the continuous value must be discounted back to time 0 by using the cost of capital
for equity:
25) CV0 = CVT / pTE
The last step in the present values of the continuing value, the residual earning in between the
forecast horizon and the book value at time 0 are summed up to get the fundamental value of
the specific company:
26) VE0 = B0 + VRE
0 + CV0
The detailed description of calculations the authors of this paper presented to explain all
calculations carried out in the estimation process of the company value can also be described
in following summarized by the formulas:
• Formula 6 of this study for the fist case (zero residual earnings after the
forecast horizon)
• Formula 7 of this study for the second case (stable residual earnings
after the forecast horizon)
• Formula 8 of this study for the third case (growing residual earnings
after the forecast horizon)
The excel spreadsheet of the calculations of the firm value can be found in the appendix 15.
7.1.5 Result of the company valuation and comparison with the actual share price
After the calculations have been conducted the company valuation results in a company value
of 33.16 UDS per share.
If one compare this with the share price (a chart of the development of the share price can be
found in the appendix 18) of the share at the last day in 2008 which was 18,62 USD232 one
232 www.finance.yahoo.com

57
recognize a difference between fundamental and market value of 14,54 USD or circa 43, 85%.
Because the researchers believe that the fundamental (or intrinsic) value of the company that
results from the valuation is the true value of the company and not the market value, the
company must be seen as under valuated.
7.2 Undervaluation and emotional driven markets
After the researchers presented companies which are according to the established criteria must
be seen as not affected by the financial crisis and after valuating of one of these companies
and by that detect undervaluation of this stock, the last remaining question is if it can be
proved that this undervaluation results from broad fear of market participants?
To answer this question the writers examined the relations (correlations): First, between the
State Street Investor Confidence Index (CI) for the region of North America (including
Canada and the United States) with historical prices of the S&P 600 index and AIT; and
secondly between the CI and the sum of two of the author’s former financial indicators
earnings and book value of all constituents of the S&P 600 Index and the selected companies
(AIT).
In the first part of the correlation research the data of the Consumer Index, the price of S&P
600 and AIT was taken from the period January 2006 – Mai 2009 (a detailed description of
the collection of the data can be found in the appendix 14). The results show between all of
these three variables a relative strong positive correlation. The correlation between CI and
AIT’s share prices amounts 0.542, between CI and S&P 600 0.706 and finally between S&P
600 and AIT share prices 0.851. This indicates that the mood of the investors influences the
stock prices during the times of the financial crisis, at least for the S&P 600 Index.
In the second part of the correlation research the authors take data of the CI, the book value
and EBIT of the constituents of the S&P 600 Index and AIT for four particular moments in
different years (May 2006, May 2007, May 2008, and May 2009). There is a small miss
match between the periods of these two parts of the correlation research, because in the
second part a little bit longer period is analyzed. This is caused by needs of more times series
to put to the correlation model. However, the authors believe such small miss match still
allow to comparing both parts of their research. The results from the second part of the
correlation research show negative correlation between the CI and the financial indicators of
the constituents companies of the S&P 600 Index. The correlations between the CI and
earnings amount – 0.6151, and between the CI and the book value – 0.1579. The big
difference in correlation of price S&P 600 and Confidence Index on the one side, and S&P
600 earnings and S&P 600 from others amounts 1.32. This could indicate that the unjustified

58
fear of investors during the financial crisis (indicated by the behavior of the CI) can influence
the S&P 600 Index too deeply and the prices of S&P 600 can be under valuated, but such
statement requires further detailed examination. Furthermore the price and book value of AIT
are a little positively correlated with the Consumer Index 0.117 and 0.026. This means that it
could be many companies on the market, which are under valuated, because of the negative
difference between the correlation of AIT earnings and CI, and S&P 600 Earnings and CI,
which amounts 0.761. However, such statements require further researches and calculations.
(a summary of the correlation research results can be found in the appendix 16 and 17).
8 Conclusions
8.1 Description of results
The goal of this study was to find out, if the fear of the market participants during the
financial crisis 2007 to 2009 leads to undervaluation of companies which are not influenced
by the financial crisis and thus in the times of the financial crisis the market is partially
inefficient.
This goal must be seen as achieved as the researchers in the first part of their study (6.
Seeking not influenced companies) detected firms which heave not been influenced by the
financial crisis. By this the authors answered the first research question.
In the second part of the study (7. Valuation of a selected case), the authors showed with the
valuation of one company out of the thirteen detected uninfluenced firms that the particular
firm was under valuated. By this the researchers answered the second research question.
In the last part of their research (7.2 Undervaluation and emotional driven markets) the
authors provide strong indication that the under valuation (miss pricing) of the company
results from an emotion driven market, as the performance of the selected company stays
stable (see appendix 1) during the financial crisis but the share price falls (see appendix 18).
This behaviour of the stock price is irrational from the viewpoint of the efficient market
hypothesis. If a company achieves good results in a stable fashion the share price should not
fall but develop in relation to the good results of the company. If the share price drops anyway
this indicates that the market reacts irrational and might be driven by emotion. A strong signal
that the market is driven by emotions provides the State Street Investor Confidence Index.
The indicator falls continuously from August 2007 to December 2008 whereas the companies
of the S&P 600 Small Cap Index perform stable. Because of that the authors believe that the
undervaluation of the company is due to broad fear of market participants. By this the third
research question is answered.

59
Furthermore, the writers of this research paper must mention that the established hypothesis
turned out to be true.
The authors consider that all of their research questions were proved by the deeper analysis of
the S&P 600, the selected company (AIT) and correlation between the Consumer Index with
both stock prices and indicators of cumulated S&P 600 and AIT.
8.1.1 Possibilities of generalisation and limitations of the study
Unfortunately, the generalisation possibility of the authors’ research paper is limited. The
authors believe that this limitation results from the research design of a case study. The
authors proved their research questions and hypothesis by finding one example (case) which
indicates that their beliefs turn out to be true and by that the established research questions
and the hypothesis must be answered positively. This research design of finding only one case
which examination gives answers of all questions limits the possibility of generalisation
because the researchers are only able to refer to this case. Because of that they are not able to
make statements about their findings in general.
Although the authors examined all companies included in the S&P 600 Index and found that
that most of the companies which are according to the writers are not affected by the financial
crisis belong to the branches Consumer Staples and Consumer Discretionary the researchers
believe that they can not make a general statement in the way that especially the branches
Consumer Staples and Consumer Discretionary seem to be less affected than other branches
because the researchers are of the opinion that their findings are not statistical significant.
Moreover does the examination and valuation of only one case company not allow general
statements that companies are in general under valuated in the times of the financial crisis?
Furthermore, the findings presented at the end of the correlation research part which might
indicate that the broad fear of investors lead in general to the undervaluation of most
companies is mot possible because to be sure that such a relationship exists further, deeper
studies of this specific area are necessary.
In short, the researcher answered the research questions and by that the main question of this
study but are not able to make statements which go beyond these questions.
8.1.2 Reliability and Validity of the results
In this paragraph the authors will reflect the reliability and validity of their research work
and by that verify if the results they have achieved hold strict scientific criteria. To check the
reliability and validity first the measures used in this study should be recalled: the measure of
the concept of company performance have been earnings, book value and operating cash flow

60
(multiple measure), the measure of the concept of market value has been the share price, the
measure of the concept of fundamental (intrinsic) value of a company has been the
fundamental value calculated according to the residual earnings model and the measure of
the emotional condition of market participants has been the State Street Confidence Index.
8.1.2.1. Reliability
The term reliability of a measure refers to: "… the consistency of a measure of a concept."233
This sentence mean if the application of the same measures used in this study under the same
assumptions the authors made, will show exactly the same results.
First, the authors believe that all their measures are reliable. The measures share price (for the
market value of a company) and fundamental (intrinsic) value of the company (calculated
according to the residual earnings model) results from financial theory and has been
adequately proved regarding their reliability by the scientific society.
All measures describing the performance of the firm (earnings, book value, cash flow) are
taken from financial statements of the respective company and must be seen as reliable as the
financial statements must be established according accounting rules. Moreover the financial
statements are checked by an auditor if the accountancies draw up the financial statements
according to these rules.
The S&P 600 Small Cap Index as well as the State Street Confidence Index are calculated by
well known companies which must have proved the reliability of their indices before
publishing them and thus these two measures must be seen as reliable, too.
Further more the authors believe that it is possible for other researchers to achieve the same
results if they conduct the same research. The writers base their judgment about the possibility
of replication on several reasons. First, the researchers used in their work data, which is
relatively easy to gather (even the DataStream database which is not public available should
be available for researchers at their respective institutions). The accounting numbers must be
published by every listed company. Moreover, historical share prices, values of the S&P 600
Small Cap Index, values for the State Street Confidence Index are public available, too
through the internet. In addition to that the authors give a detailed description how they
gathered their data so that other researchers can find the same data when they follow the
descriptions.
Second, all the steps and calculations which change the data to gain insight and answers to the
research questions had been explained in great detail. Further more, all assumptions the
233 Bryman / Bell (2007), p. 163
61
authors set (especially in the part of the company valuation) had been discussed and
established clearly before the calculations.
Because of that reasons the authors believe that the other researchers are provided with all
important information about the deduction of this research and thus must be able to achieve
the same results if deducting this research for their own.
8.1.2.2. Validity
The validity of a measure: "… refers to the issue of weather or not an indicator (or set of
indicators) that is devised to gauge a concept really measures that concept."234 From the
measures used in this study the share price and the fundamental value calculated according to
the residual earnings model must be seen as beyond question because these two measures
arrive from financial theory and have been adequately reviewed regarding their validity by the
scientific society.
That means that the remaining measures which must be discussed at this stage are the
measures of the company performance (which consists of earnings, book value and operating
cash flow) and the measure of the emotional condition of market participants the State Street
Confidence Index.
Do the book value, earnings and the operating cash flow really measures the companies
performance. To answer this question first one must examine how this figures come about.
Earnings, book value and cash flow are key numbers taken from financial statements of a
company. These financial statements must be drawn up according to certain accounting rules.
In Europe this accounting rules are known under the item IFRS and in the United States they
are called US-GAAP. His two accounting frameworks differ in some point. Because in this
study only companies from the United States are examined the rules according to which the
numbers are calculated are coherent. However, it must be mentioned that the figures might be
manipulated by the accountancies of the respective company because the accounting rules
leave space of interpretations. Unfortunately the authors as well as anyone else outside the
company must trust this figures after they have been proved to be calculated regularly by an
audit agency.
The second question is, if these three indicators can really measure the whole performance of
the company. This is especially questionable if one recall the part about the financial crisis of
this study in which so-called off-balance sheet vehicles where introduced. The problem with
these off-balance sheet vehicles or items (swaps are not covered in the balance sheet as well)
234 Bryman / Bell (2007), p. 165

62
is, as the name indicates, that they do not show up on the balance sheet of the company and
thus are not captured with the established indicators although they can bear risk or include
profits. The authors of this work must accept this because they are not able to gain more
insight in items which are hold apart from the balance sheet. Because regulatory restrictions
for these items have been less strict even institutional control authorities have not deeper
insight in these positions. Nevertheless the authors believe that profits and losses out this kind
of items soon or later will appear and influence the performance of the whole company that
holds this items (as one can see at the case of Bear Sterns introduced in the financial crisis
part of this study) and thus be captured by the introduced measures of company performance
the authors established according to recommendations of other business researchers.
The last measure in question is the Confidence Index. According to the State Street
Corporation: "…the Index provides a quantitative measure of the actual and changing risk
contained in investment portfolios…"235 and by that gives an insight of the confidence of the
investors. But is it possible to draw conclusions of the investors emotional condition (if they
are feared or not) by examine their confidence measured by the fact how much risk they take?
The first connection between the willingness to take risks and the state of the confidence of
market participants is obvious. The more confident one is the greater gets the willingness to
take risks. The smaller the trust in the future is the smaller the willingness to take risks. But
the second connection between the confidence and the fear is questionable. Are these tow
issues really linked? Must a loss of confidence inevitably result from fear? Of course not. A
loss of confidence can be caused by many things: less trust in the own abilities, less
expectations about the future performance of companies, a different risk aversion of investors,
expectations of political and financial stability etc. All these different factors influence the
confidence. None would talk about fear if the Confidence index would fall by some points in
value because the expectations of the future performance of companies are not good. The
fluctuation of the index resulting from such reason is normal.
The point which makes the authors believes that the confidence indicator is able to reflect
investor's fear is the extent and the timeframe in that the confidence index shrinks. A fast,
huge drop of the confidence to historical all-time lows would imply that the investors (in the
case of the State Street Confidence Index institutional investors) loose at the same time,
confidence in the future and maybe even in their own skills and maybe in the financial
stability. Because of this the authors believe that the Confidence Index can give insight in the
235 www.statestreet.com/investorconfidenceindex/
63
emotional condition of investors and is able to detect the fear of investors during the financial
crisis.
8.2 Lessons from the research work
The authors have learned several lessons from their research work. First, the most general and
most obvious conclusion is to be sceptical of the judgment of others, before the careful
examination of the case for your own.
Secondly, the authors consider that valuation models which can be found in most of the
financial students books are not suitable with the times of financial disturbance. Because the
most of their variables must be positive (earnings, growth earnings, market risk premium) in
order to find the value of the company. Thus, the appearance of such financial crisis could
lead the financial experts to disorientation of the companies’ valuation, which experienced
negative ratios. The lack of appropriate companies’ valuation tools could result in the panic of
the financial markets and undervaluation of many companies. Such optimistically approach to
permanent growth of the companies’ ratios, which are presented in most of the financial
books, should be replaced by more counterbalanced, which take into consideration the
negative values, especially in the face of globally changes. The Western societies become
older and older in comparisons to the rest of the world. The senescence of the Western
societies can lead to decrease of their innovativeness, efficiency and flexibility, which can
have a great impact on decline their competiveness, demand for the products and finally being
gradually replaced by the companies from developing countries. Moreover, the reality is seen
in more black colours by Wallerstein, who does not see the difference between the young
developed societies and old western. He states generally about capitalism: "The system
reaches a point of bifurcation. There are many signs that today, we have reached this point.
Deruralization, ecological exhaustation and democratisation, each in different ways, reduce
the ability to cumulate capital."236 This reduction of ability to cumulate capital will lead to
decrease of investments and without them, it is impossible to sustain the permanent growth of
capitalistic world. That’s why it should be created models of company valuation, which took
into consideration the negative value of company’s ratios.
Thirdly, authors learn that the choice of the research design (or in general the methodology
pre-conceptions) have a big influence on the outcome of the study. By choosing the case
study design for this research paper the authors recognized that they can answer their research
questions and hypothesis but that they are not able to make general statements with their
findings because they are very limited.
236 Wallerstein (1999), p. 74

64
Maybe the authors wanted to answer too many questions at the same time. If they for instance
concentrate only on the topic if companies are not influenced by the financial crisis they could
choose other research design which allows for the comparison of many companies. By that
they might then be able to make statements about which branch is less affected than another.
Fourthly, the writers learned that their results mainly depend on their assumptions they made.
Other researchers can state for instance that the author’s approach is wrong, because they
might have chosen the wrong observation period for in the part in which they seek unaffected
companies. The three years before the financial crisis were very well for most of the
companies listed on the S&P 600 and they achieved wonderful financial results and even
without the appearance of the financial crisis such extreme high pace of growth of companies’
indicators could not be sustained. That’s why the others researchers could point out that
another period of time should be better for creating observation period to the financial crisis.
Moreover other scientists might criticize that the authors create the adequacy of the bands the
researcher established to detect unaffected firms. The bands created based on standard
deviation from the average results. The standard deviations from the average results are lower
than from the normal companies’ results. That’s why if the authors change the technique of
creating the bands from the average to normal results, the bands could be bigger and by that
significantly more unaffected companies could be included than in their case.
8.2.1 Recommendations for further research in this study area
The limitations of this study as well as the lessons the authors draw from it lead to the
recommendations the authors of this research paper give for further research in this field of
study.
As mentioned before the possibility of generalisation of the findings of this study is very
limited. Therefore other researchers could deduct investigations which allow for more general
statements. This might be achieved by changing the research design or by the concentration of
only one research question.
Another possibility of further research would be the deduction of the same study with
changed assumptions. As the writes discussed before their assumptions have a great influence
on their results and in addition to that might be wrong or not accurate. A study with different
assumptions would give answers of the question if changes in the assumptions change the
basic massage of this study (in the times of the financial crisis the market is inefficient).
Moreover further research could examine the same questions but later in time. The days this
study was carried out are maybe at the end of the financial crisis or maybe in the financial
crisis. At the actual point in time none knows if the financial crisis is over yet. Maybe the real

65
impact of the financial crisis on the companies appears with delay and thus is still in front of
us. Maybe a study like this in a later point of time (when it is really possible to delimit the
time periods before, during and after the financial crisis) detect that the market is efficient
(maybe because the drop in share price anticipates the fall of earnings in the future) an thus,
the findings of this study must be revised.
All this further research recommendations aim the deeper study of market efficiency during
the times of the financial crisis.

66
References
Books:
Bodie, Zvi; Kane, Alex; Markus, Alan J. (2008), Investments, seventh edition, London: McGraw Hill
Bryman, Alan; Bell, Emma (2007), Business Research Methods, second edition, Oxford:
Oxford University Press Copeland Tom; Koller, Tim; Murrin, Jack (2000), Valuation: measuring and managing the
value of companies, third edition, New York: John Wiley & Sons Frykman, David; Tolleryd, Jakob (2003), Corporate Valuation: An Easy Guide to Measuring
Value, Harlow: Financial Times Prentice Hall Glen, Arnold (2001), Corporate Finance, second edition, Harlow: Financial Times Prentice
Hall Goldberg, Joachim; von Nitzsch, Rüdiger (2001), Behavioral Finance, New York: John Wiley
& Sons Graziano, Anthony M.; Raulin, Michael L. (2000), Research methods: a process of inquiry,
fourth edition, Boston: Allyn and Bacon Corp. Kim, Kenneth A.; Nofsinger, John R. (2007), Corporate Governance, second edition, Upper
Saddle River: Pearson Prentice Hall Penman, Stephen H. (2007), Financial Statement Analysis and Security Valuation, third
edition, London: McGraw Hill Solomon, Michael R. (1996), Consumer Behavior, third edition, Englewood Cliffs: Prentice
Hall Wallerstein, Immanuel (1999), The end of the world as we know it: social science for the
twenty-first century, Minneapolis: Minneapolis University of Minnesota Press Articles:
Acharya, Viral; Philippon, Thomas; Richardson, Matthew; Roubini, Nouriel (2009), "The Financial Crisis of 2007-2009: Causes and Remedies", Financial Markets, Institutions & Instruments, May 09, Vol. 18 Issue 2, p. 89-137
Ali, Ashiq; Lee-Seok Hwang; Trombley, Mark A. (2003), "Residual-Income-Based Valuation
Predicts Future Stock Returns: Evidence on Mispricing vs. Risk Explanations", Accounting Review, Apr 03, Vol. 78 Issue 2, p. 377-396
Baig, Taimur; Goldfajn, Ilan (1999), "Financial Market Contagion in the Asian Crisis", IMF
Staff Papers, Jun 99, Vol. 46 Issue 2, p. 167 Ball, Ray; Brown, Philip (1968), "An Empirical Evaluation of Accounting Income Numbers",
Journal of Accounting Research, autumn 68, Vol. 6 Issue 2, p 159-178

67
Banz, Rolf W. (1981), "The Relationship between Return and Market Value of Common Stocks", Journal of Financial Economics, Mar 81, Vol. 9 Issue 1, p. 3-18
Basu, S. (1977), "Investment Performance of Common Stocks in Relation to Their Price
Earnings Ratios: A Test of the Efficient Market Hypothesis", Journal of Finance, Jun 77, Vol. 32 Issue 3, p. 663-682
Brunnermeier, Markus K. (2009), "Deciphering the Liquidity and Credit
Crunch 2007–2008", Journal of Economic Perspectives, winter 09, Vol. 23 Issue 1, p. 77-100
Cooper, Cary (2008)," Buy now, pay now", Director, Mar 08, Vol. 61 Issue 8,
p. 26-26 Coyne, Joseph S.; Singh, Sher G. (2008), "The Early Indicators of Financial Failure: A Study
of Bankrupt and Solvent Health Systems", Journal of Healthcare Management, Sep/Oct 08, Vol. 53 Issue 5, p. 333-345
del Sol, Patricio; Ghemawat, Pankaj (1999), "Strategic Valuation of Investment Under
Competition", Interfaces, Nov/Dec 99, Vol. 29 Issue 6, p. 42-56 Fama, Eugene F. (1965), "The Behavior of Stock-Market Prices", Journal of Business, Jan 65,
Vol. 38 Issue 1, p. 34-105 Fama, Eugene F. (1970), "Efficient Capital Markets: A Review of Theory and Empirical
Work", Journal of Finance, May 70, Vol. 25 Issue 2, p. 383-417 Farrell, Diana; Lund, Susan (2009), "The credit crunch and the real economy", McKinsey
Quarterly, 2009 Issue 1, p. 30-31 Gerardi, Kristopher S.; Lehnert, Andreas; Sherland, Shane M.; Willen, Paul S (2009),
"Making sense of subprime crisis", Federal Reserve Bank of Atlanta, Feb 09 Issue 2, p. 1-74
Herrmann, Volker; Richter, Frank (2003), "Pricing with Performance Controlled Multiples",
Schmalenbach Business Review (SBR), Jul 03, Vol. 55 Issue 3, p. 194-219 Kahneman, Daniel; Tversky, Amos (1979), "Prospect theory: an analysis decisions under
risk", Econometrica, Mar 79, Vol. 47 Issue 2, p 263-291 Keim, Donald B. (1983), "Size-Related Anomalies and Stock Return Seasonality: Further
Empirical Evidence", Journal of Financial Economics, Jun 83, Vol. 12 Issue 1, p. 13-32
Lakonishok, Josef; Shleifer, Andrei; Vishny, Robert W. (1994), "Contrarian Investment,
Extrapolation, and Risk", Journal of Finance, Dec 94, Vol. 49 Issue 5, p 1541-1578 Lynott, Bill J. (2008), "Wise Investors Stray from The Herd", American Drycleaner,
Dec 08, Vol. 75 Issue 9, p. 72-73

68
McKellar, Hugh (2009), "Silver, not dark, linings", KM World, Apr 09, Vol. 18 Issue 4, p. 18
Moore, Don A.; Cain, Daylian M. (2007), "Overconfidence and underconfidence: When and
why people underestimate (and overestimate) the competition", Organizational Behavior & Human Decision Processes, Jul 07, Vol. 103 Issue 2, p. 197-213
Morone, Andrea; Samanidou, Eleni (2008), "A simple note on herd behaviour", Journal of
Evolutionary Economics, Oct 08, Vol. 18 Issue 5, p. 639-646 Pirie, Scott; Smith, Malcolm (2008), "Stock Prices and Accounting Information: A Review of
the State of Play", Journal of Accounting, Business & Management, Oct 08, Vol. 15 Issue 2, p. 22-36
Riepe, Mark W. (2008), "Depression Fears Overblown", Journal of Financial Planning,
Dec 08, Vol. 21 Issue 12, p. 32-35 Sloan, Allan (2008), "Should you jump in now?", Fortune, Dec 08, Vol. 158 Issue 12,
p. 26-30 Treanor, William Michael; Katsoris, Constantine N.; Fisch, Jill E.; Kaswell, Stuart; Cohen,
Steven M.; Miller, Harvey; Morgenson, Gretchen; Neiman, Richard; Cave, Bryan (2009), "The eighth annual alert. A destefano lecture on corporate, securities and financial law", Fordham Journal of Corporate & Financial Law, 2009, Vol. 14 Issue 1, p. 1-47
Working papers
Jennergren Peter L.; Skogsvik, Kenth (2007), "The abnormal earnings growth model: applicability and applications", SEE/EFI Working Paper Series in Business Administration, Sep 07, No. 2007:11, p. 1-28
Master Thesis
Wingård, Axel; Viklund Emil (2007), "Cut to the case: A Study of the Usefulness of a Simplified Residual Income & Abnormal Earnings Growth Model", Master Thesis in Accounting and Financial Management, Stockholm School of Economics, p. 1-61
Articles published electronically:
Bureau of Labour Statistics (2009), "Employment Situation Summary", Economic News
Release, 2009, reviewed 27/5/09, http://www.bls.gov/news.release/empsit.nr0.htm Hill, J. (2008), "Cheap shares to snap up now", TimesOnline, 2008, reviewed 9/4/09,
http://www.timesonline.co.uk/tol/money/investment/article4881205.ece International Monetary Fund (2009), "Advanced Economies to Contract Sharply in 09,
Upturn Next Year—IMF", IMF Survey online, 2009, reviewed 27/5/09, http://www.imf.org/external/pubs/ft/survey/so/2009/NEW031909A.htm

69
Peterson Drake, Pamela (2008), "Residual Income", James Madison University, 2008, reviewed 27/5/09, http://peregrin.jmu.edu/~drakepp/FIN362/resources/ri.pdf
Steverman, Ben (2009), "The Stock Market's Frightful Slide", Business Week Online, Feb
2009, p. 23-23, reviewed 24/4/09, http://www.businessweek.com/investor/content/feb2009/pi20090223_552263.htm
The Wall Street Journal (2009), "A Triple-A Idea", WSJ.com, 2009, reviewed 27/5/09,
http://online.wsj.com/article/SB123976320479019717.html#printMode The World Bank (2008), "Historic commodity price boom ends with slowing global growth",
The World Bank News, 2008, reviewed 27/5/09, http://go.worldbank.org/5U43NLL1M0
Wearden, G. (2008), "Warren Buffet: I'm buying US shares", guardian.co.uk, 2008, reviewed
9/4/09, http://www.guardian.co.uk/business/2008/oct/17/warren-buffett-shares markets/print
Websites
http://www.finance.yahoo.com
http://www.google.com/finance
http://epp.eurostat.ec.europa.eu/portal/page/portal/eurostat/home/
http://www.statestreet.com/investorconfidenceindex/
http://www.moodys.com/
http://www.standardandpoors.com
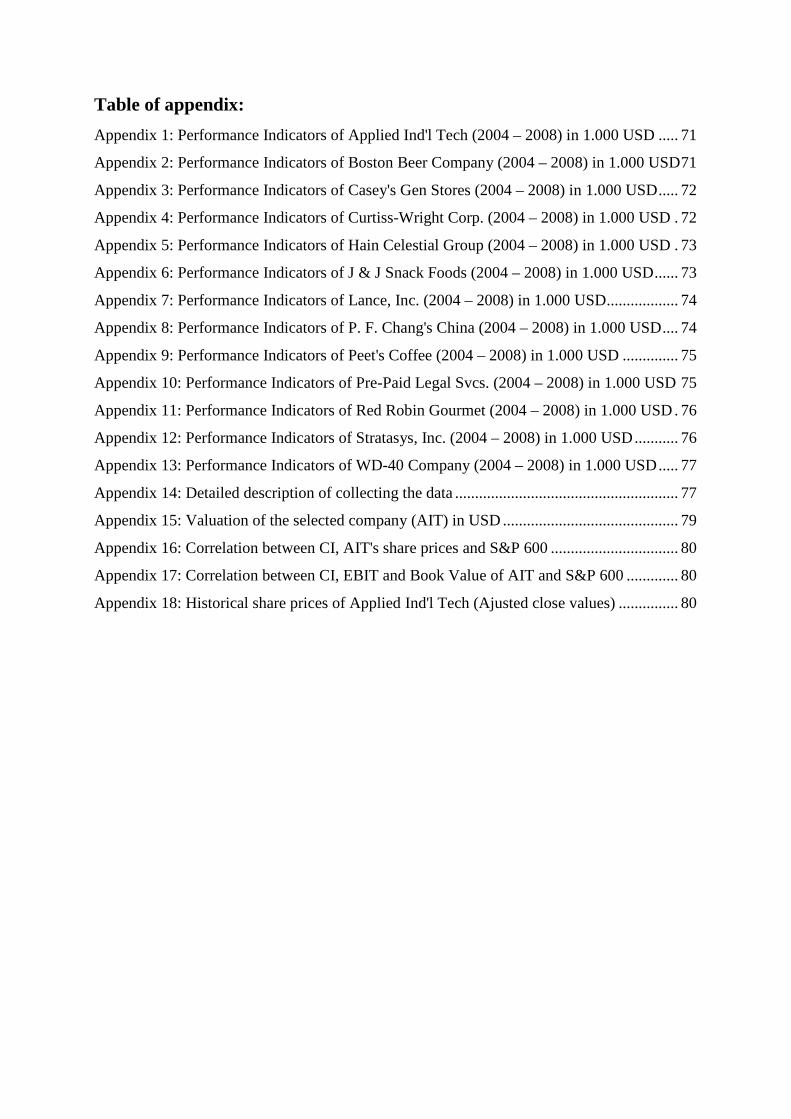
Table of appendix:
Appendix 1: Performance Indicators of Applied Ind'l Tech (2004 – 2008) in 1.000 USD ..... 71
Appendix 2: Performance Indicators of Boston Beer Company (2004 – 2008) in 1.000 USD71
Appendix 3: Performance Indicators of Casey's Gen Stores (2004 – 2008) in 1.000 USD..... 72
Appendix 4: Performance Indicators of Curtiss-Wright Corp. (2004 – 2008) in 1.000 USD . 72
Appendix 5: Performance Indicators of Hain Celestial Group (2004 – 2008) in 1.000 USD . 73
Appendix 6: Performance Indicators of J & J Snack Foods (2004 – 2008) in 1.000 USD...... 73
Appendix 7: Performance Indicators of Lance, Inc. (2004 – 2008) in 1.000 USD.................. 74
Appendix 8: Performance Indicators of P. F. Chang's China (2004 – 2008) in 1.000 USD.... 74
Appendix 9: Performance Indicators of Peet's Coffee (2004 – 2008) in 1.000 USD .............. 75
Appendix 10: Performance Indicators of Pre-Paid Legal Svcs. (2004 – 2008) in 1.000 USD 75
Appendix 11: Performance Indicators of Red Robin Gourmet (2004 – 2008) in 1.000 USD. 76
Appendix 12: Performance Indicators of Stratasys, Inc. (2004 – 2008) in 1.000 USD........... 76
Appendix 13: Performance Indicators of WD-40 Company (2004 – 2008) in 1.000 USD..... 77
Appendix 14: Detailed description of collecting the data ........................................................ 77
Appendix 15: Valuation of the selected company (AIT) in USD............................................ 79
Appendix 16: Correlation between CI, AIT's share prices and S&P 600 ................................ 80
Appendix 17: Correlation between CI, EBIT and Book Value of AIT and S&P 600 ............. 80
Appendix 18: Historical share prices of Applied Ind'l Tech (Ajusted close values) ............... 80

Appendix
Appendix 1: Performance Indicators of Applied Ind'l Tech (2004 – 2008) in 1.000 USD (Source: DataStream) Appendix 2: Performance Indicators of Boston Beer Company (2004 – 2008) in 1.000 USD (Source: DataStream)
APPLIED IND'L TECH
0
200000
400000
600000
Time
US
D
Book value
Cash flow
Earnings
Book value 339535 393287 414822 450983 502075
Cash flow 43088 81034 69853 70925 110303
Earnings 29871 55339 72299 86022 95456
2004 2005 2006 2007 2008
BOSTON BEER COMPANY
0
50000
100000
150000
Time
US
D
Book value
Cash flow
Earnings
Book value 78370 85979 108589 133588 140028
Cash flow 19273 28841 28977 53794 39842
Earnings 12502 15559 18192 22491 8088
2004 2005 2006 2007 2008

72
Appendix 3: Performance Indicators of Casey's Gen Stores (2004 – 2008) in 1.000 USD (Source: DataStream) Appendix 4: Performance Indicators of Curtiss-Wright Corp. (2004 – 2008) in 1.000 USD (Source: DataStream)
CASEY'S GEN STORES
0
200000
400000
600000
800000
Time
US
D
Book value
Cash flow
Earnings
Book value 439794 469137 523190 572264 647472
Cash flow 97902 132184 147818 113338 175904
Earnings 36466 42532 62940 63542 85004
2004 2005 2006 2007 2008
CURTISS-WRIGHT CORP
0
200000
400000
600000
800000
1000000
Time
US
D
Book value
Cash flow
Earnings
Book value 575614 638220 762074 914785 866762
Cash flow 105347 105178 143871 139136 179821
Earnings 65066 75280 80569 104328 109390
2004 2005 2006 2007 2008

73
Appendix 5: Performance Indicators of Hain Celestial Group (2004 – 2008) in 1.000 USD (Source: DataStream) Appendix 6: Performance Indicators of J & J Snack Foods (2004 – 2008) in 1.000 USD (Source: DataStream)
HAIN CELESTIAL GROUP
0
200000
400000
600000
800000
Time
US
D
Book value
Cash flow
Earnings
Book value 496765 528290 616401 696956 742811
Cash flow 30801 34973 52544 66431 24486
Earnings 27008 21870 37067 47482 41221
2004 2005 2006 2007 2008
J & J SNACK FOODS
0
100000
200000
300000
400000
Time
US
D
Book value
Cash flow
Earnings
Book value 210096 234762 262873 295582 316778
Cash flow 47144 52644 54965 57843 54897
Earnings 22710 26043 29450 32112 27908
2004 2005 2006 2007 2008
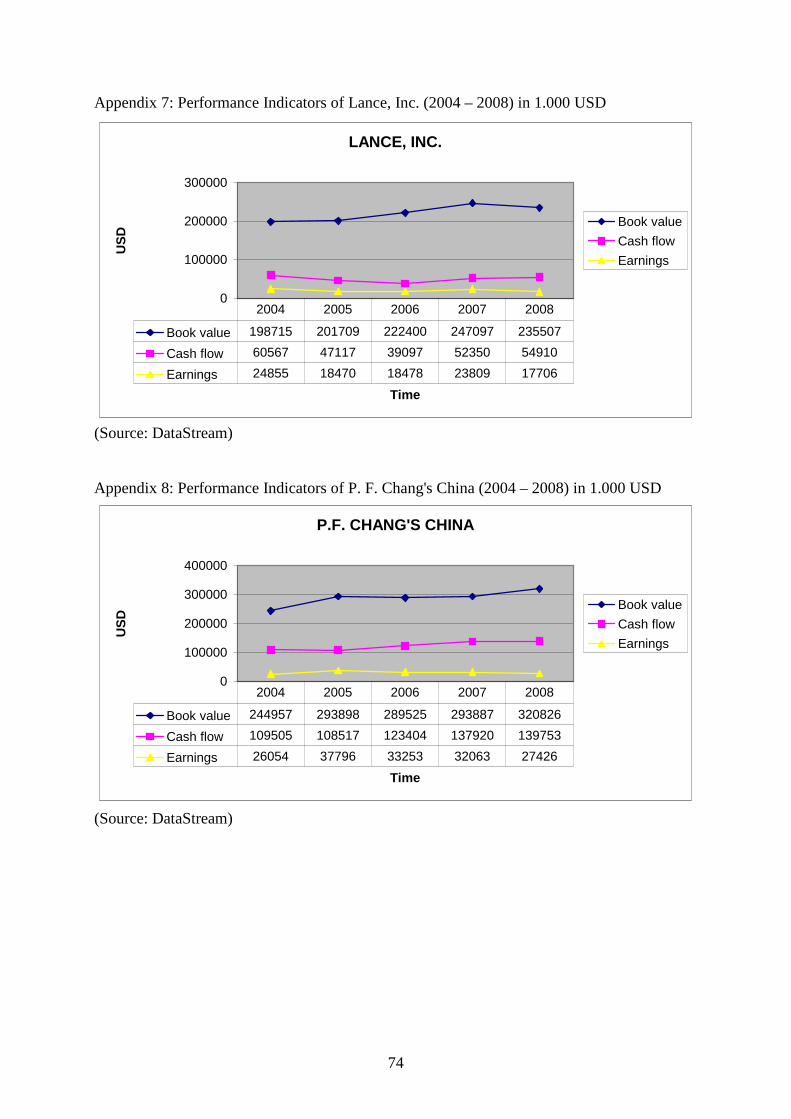
74
Appendix 7: Performance Indicators of Lance, Inc. (2004 – 2008) in 1.000 USD (Source: DataStream) Appendix 8: Performance Indicators of P. F. Chang's China (2004 – 2008) in 1.000 USD (Source: DataStream)
LANCE, INC.
0
100000
200000
300000
Time
US
D
Book value
Cash flow
Earnings
Book value 198715 201709 222400 247097 235507
Cash flow 60567 47117 39097 52350 54910
Earnings 24855 18470 18478 23809 17706
2004 2005 2006 2007 2008
P.F. CHANG'S CHINA
0
100000
200000
300000
400000
Time
US
D
Book value
Cash flow
Earnings
Book value 244957 293898 289525 293887 320826
Cash flow 109505 108517 123404 137920 139753
Earnings 26054 37796 33253 32063 27426
2004 2005 2006 2007 2008

75
Appendix 9: Performance Indicators of Peet's Coffee (2004 – 2008) in 1.000 USD (Source: DataStream) Appendix 10: Performance Indicators of Pre-Paid Legal Svcs. (2004 – 2008) in 1.000 USD (Source: DataStream)
PEET'S COFFEE
0
50000
100000
150000
200000
Time
US
D
Book value
Cash flow
Earnings
Book value 109127 126072 127439 147253 143907
Cash flow 18337 19503 17774 20133 25444
Earnings 8785 10687 7816 8377 11165
2004 2005 2006 2007 2008
PRE-PAID LEGAL SVCS
0
20000
40000
60000
80000
Time
US
D
Book value
Cash flow
Earnings
Book value 31447 51394 30860 17839 31807
Cash flow 47263 50131 54385 67178 64317
Earnings 40777 35812 51798 51202 60172
2004 2005 2006 2007 2008

76
Appendix 11: Performance Indicators of Red Robin Gourmet (2004 – 2008) in 1.000 USD (Source: DataStream) Appendix 12: Performance Indicators of Stratasys, Inc. (2004 – 2008) in 1.000 USD (Source: DataStream)
RED RODIN GOURMET
0
100000
200000
300000
Time
US
D
Book value
Cash flow
Earnings
Book value 165888 204859 243533 284442 268908
Cash flow 55521 65433 78525 93558 91164
Earnings 23381 27386 29362 30651 27126
2004 2005 2006 2007 2008
STRATASYS, INC.
0
50000
100000
150000
Time
US
D
Book value
Cash flow
Earnings
Book value 84887 86269 97792 123834 122562
Cash flow 15931 8125 12396 21169 14491
Earnings 9129 10603 11164 14324 13615
2004 2005 2006 2007 2008

77
Appendix 13: Performance Indicators of WD-40 Company (2004 – 2008) in 1.000 USD (Source: DataStream) Appendix 14: Detailed description of collecting the data
Because putting all the data which was the basis of the author's research paper was not
possible because it was too much data material the authors describe in this paragraph how
they gathered the data and from which sources it was taken, so that other researchers are able
to reproduce the findings of this work.
The authors concentrate their efforts on companies listed on S&P 600. To find companies,
which are not affected by the financial crisis, the researchers analyzed three indicators:
earnings, book value and net value of cash flow? These indicators for all listed companies on
S&P 600 was taken yearly from 2004 - 2008 from program ‘Datastream’, which is run by the
company Thomson Financial and one of the best sources for financial data. Secondly, the data
to the valuation models such as: Book Value, prediction of EPS and DPS was taken yearly for
years 2008 - 2011 from the same database. Finally, the data used in the correlation was taken
from:
1) State Street Confidence Index in period January 2006 – Mai 2009 from website
http://www.globallink.com/en/About/InvestorConfidenceIndex/index, which publishes
the result of the researches conducted by Global Link Overview.
2) The prices of AIT stocks and cumulated S&P 600 Index in the period January 2007 –
Mai 2009, from the website http://finance.yahoo.com.
3) Earnings and Book Value yearly from Mai 2006 – Mai 2009 from DataStream.
WD-40 COMPANY
0
50000
100000
150000
200000
Time
US
D
Book value
Cash flow
Earnings
Book value 112418 130066 155731 168272 163992
Cash flow 31491 31564 28197 51651 29362
Earnings 25643 27798 28112 31534 27622
2004 2005 2006 2007 2008

78
Finally, the calculation for the beta is based on stock prices of S&P 600 and selected
companies (AIT) from the website http://finance.yahoo.com.

79
Appendix 15: Valuation of the selected company (AIT) in USD APPLIED ITN'L GROUP (2008)
Forecast Years 2008 2009 2010 2011 EPS 1,44 1,27 1,49 DPS 0,6 0,6 0,6 BPS 11,88 12,72 13,39 14,28 ROCE 12,12% 9,98% 11,12% RE ( 5,653% Charge) 0,768 0,551 0,733 Discount rate 1,057 1,116 1,179 Present value of RE 0,727 0,493 0,621 Total present value of RE to 2008 1,84 Continuing value 22,92 Present value of continuing value 19,44 Value per share 33,16 The continuing value: 22,92 2008 2009 2010 2011 Common equity 502075000 Number of shares outstanding 42250000 BPS 11,88 EPS and EPS forecast 1,44 1,27 1,49 Historical 5 year growth 2,38% Calculation of the cost of equity capital: Risk free rate: 2,240% beta: 1,1377 Market risk premium: 3,000% Cost of equity capital: 5,653% (Source: Residual Earnings Valuation Table accoring to Penman (2007), p. 172)

80
Appendix 16: Correlation between CI, AIT's share prices and S&P 600 Correlation between CI and AIT's share prices:
0,5424
Correlation between CI and S&P 600:
0,7062
Correlation between S&P 600 and AIT's share prices:
0,8517
(Source: Based on own Calculations) Appendix 17: Correlation between CI, EBIT and Book Value of AIT and S&P 600
Correlation between CI and
sum of S&P 600 EBIT
Correlation between CI and sum of S&P 600
Book Value
Correlation between CI and AIT EBIT
Correlation between CI
and AIT Book Value
Correlation between S&P 600 and AIT
EBIT
Correlation between S&P 600 and AIT Book value
-0,6151 -0,1579 0,1170 0,0267 -0,4751 0,6181 (Source: Based on own Calculations) Appendix 18: Historical share prices of Applied Ind'l Tech (Ajusted close values)
APPLIED IND'L TECH
0,005,00
10,0015,0020,0025,0030,0035,0040,00
03.0
1.20
07
03.0
3.20
07
03.0
5.20
07
03.0
7.20
07
03.0
9.20
07
03.1
1.20
07
03.0
1.20
08
03.0
3.20
08
03.0
5.20
08
03.0
7.20
08
03.0
9.20
08
03.1
1.20
08
Time
US
D
Adj Close
(Source: http://finance.yahoo.com)

Umeå School of Business
Umeå University SE-901 87 Umeå, Sweden www.usbe.umu.se