Embed Size (px)
Citation preview

Financial Strategy BMBA715.2 W149303021
1
“The buying back of shares by companies is a dangerous financial
strategy as it increases the company’s gearing ratio.”
My point of view.
Francesco Merone
25.3.2015

Financial Strategy BMBA715.2 W149303021
2
Contents:
1. Executive summer page 2
2. Introduction page 3
3. High level of gearing page 4
4. Maximized the WACC with the buy-back shares page 8
5. A real case: Shire Plc page 9
6. Conclusions page 14
References page 15
Appendix 1: Shire: Prices, Dividend, Div. growth and expected 2015 page 17
Appendix 2: Shire: Balance Sheet 2010/14 page 20
Appendix 3: Shire: Income Statement 2010-2014 page 22
1. Executive summer
This assignment considers some different theories regarding the action of buying-back their own
shares with an increase of the level of the gearing (leverage) ratio.
Many authors consider that increasing the level of the gearing is dangerous for firms, others think it
could be necessary, acceptable or positive for different reasons.
According to Healeas (2012) the value of the firm is maximized when the WACC (Weight Average Cost
of Capital) is minimized. The problem is the trade-off between the gearing ratio with the firm’s WACC.
In the final part of the report is presented a real buy-back share case made in the late 2012 by Shire
Plc, and what would have happened if they had used additional debts to buy back their shares.

Financial Strategy BMBA715.2 W149303021
3
2. Introduction
Share buy-back is considered as an alternative way of giving money to the shareholders rather than
paying them dividends. In both cases the result is a decrease of the Equity value and an increase of
the gearing ratio.
A company can decide to buy its own shares in three different ways:
1. acting as the other shareholders, buying them in an open market. The company does
not reveal itself as the buyer.
2. The firm can set up a tender offer announcing to all stockholders that it is willing to
purchase a number of stocks at a specific price.
3. The company could buy shares from specific individual shareholders, this way it is
called target repurchase.
Wayne & Harford (2000) wrote that the stock price reaction to dividend increase is more positive than the reaction to repurchases. Yet, a recent study made in the German’s stock market by Andresa, Doumetb, Fernaub and Theissenc (2015), shows that after the introduction of stock repurchases in 1998, the importance of (regular) dividends have diminished. They noticed a decrease in average dividend payout-ratio from 60.9% to 46.0%. In addition to this, Skinner (2008) shows that the total annual value of share repurchases now usually exceeds that of cash dividends in the United States, and reports that repurchases have become the preferred method of distributing cash to investors. These facts show how important and widespread are for firms buying-back their shares. In the next pages I will describe some theories pros and cons the buy-back share because related to
an increase of the leverage ratio.

Financial Strategy BMBA715.2 W149303021
4
3. High level of gearing
According to Modigliani (1981), an increase in the level of the gearing will negatively effect the market value of the firm; the principal reasons for that are:
(i) bankruptcy costs which reduce the expected flow to all concerned; (ii) agency costs, resulting from the arrangements needed to protect the creditors; (iii) moral hazard or foregone valuable opportunities which would be particularly relevant
for firms with true growth opportunities; (iv) debt is valuable in so far as it serves to shelter income from taxes, though at a cost.
As debt rises, there is a growing probability of income falling below a threshold level where the shelter cannot be used.
In addition to that, the pecking order theory says that the firm will borrow, rather than issuing equity, when internal cash flow is not sufficient to fund capital expenditures. Thus the amount of debt will reflect the firm's cumulative need for external funds. Hovakimian, Opler & Titman (2011) have recently written that profitable firms often use their earnings to pay down debt and, as a result, are usually less levered than their less profitable counterparts. In addition, firms tend to issue equity following an increase in stock prices, implying that firms that perform well subsequently reduce their leverage. Arnold (2013) considers the major disadvantage for a high leverage the increase of the financial risk distress, and ultimately the liquidation.
Graph 1
Ke is the cost of equity - Kd is the cost of debt - Ko is the overall or weighted average cost of capital
In graph 1 it shows the theoretical optimal level of gearing, at point X. From that point starts a level of gearing riskier for the firm.

Financial Strategy BMBA715.2 W149303021
5
The problem is that any firm will have a different X point, so how can someone understand when the firm is behind or ahead of that value? Damodaran (2001) related the different firm’s stages with the risk and opportunities related with the gearing (see table 1).
Table 1 Myers (1984) wrote that average debt ratios will vary from industry to industry because asset risk, asset type, and requirements for external funds also vary by industry. If the leverage is dangerous, why firms simply do not avoid any debt? If the gearing is not always dangerous, when does the level start to become dangerous? Does it depend on the type of sector and could it be prevented in the last years?
The tradeoff theory says that firms seek debt levels that balance the tax advantages of additional debt against the costs of possible financial distress. The tradeoff theory predicts moderate borrowing by tax-paying firms. Hence, can a profitable firm increase its gearing because of its corporate taxes? Does the taxation have an important effect on the gearing ratio of a firm?
Stage 2
Rapid Expansion
Stage 1
Start-up
Stage 4
Mature Growth
Stage 5
Decline
IV. The Debt-Equity Trade off and Life Cycle
Time
Agency Costs
Revenues
Earnings
Very high, as firm
has almost no
assets
Low. Firm t akes few
new investment s
Added Disceipline
of Debt
Low, as owners
run the firm
Low. Even if
public, firm is
closely held.
Increasing, as
managers own less
of firm
High. Managers are
separated from
owners
Bamkruptcy Cost
Declining, as firm
does not t ake many
new investment s
Stage 3
High Growth
Net Trade Off
Need for Flexibility
$ Revenues/
Earnings
Tax BenefitsZero, if
losing money
Low, as earnings
are limit ed
Increase, with
earnings
High High, but
declining
Very high. Firm has
no or negat ive
earnings.
Very high.
Earnings are low
and volatile
High. Earnings are
increasing but st ill
volatile
Declining, as earnings
from exist ing assets
increase.
Low, but increases as
existing project s end.
High. New
investments are
difficult to monitor
High. Lot s of new
investments and
unst able risk.
Declining, as assets
in place become a
larger portion of firm.
Very high, as firm
looks for ways to
est ablish itself
High. Expansion
needs are large and
unpredicatble
High. Expansion
needs remain
unpredictable
Low. Firm has low
and more predictable
investment needs.
Non-exist ent . Firm has no
new investment needs.
Cost s exceed benefits
Minimal debt
Cost s st ill likely
to exceed benefit s.
Mostly equity
Debt start s yielding
net benefits t o t he
firm
Debt becomes a more
at t ractive opt ion.
Debt will provide
benefits.

Financial Strategy BMBA715.2 W149303021
6
If you consider the US corporate tax rate, the rate reached its peak in the ’50s then started to fall (see graph 2). We should do the same analysis for each country where a specific firm has the headquarters and pay its corporate taxes. It is clear that if your financial debts will cost 20-50% less, thanks to the positive fiscal effects of the taxation, the real cost of the leverage will decrease, so well the firm’s WACC.
Graph 2
Another important aspect that impacts on the gearing ratio is the interest rates of the debt. In this
case we can notice different periods where it was much higher than in nowadays (see graph 3). As
written above, we should consider the different countries where firms are based.
In addition to this case, if your WACC is roughly 10% and the interest rates are 20%, any financial
additional debt will increase your WACC. Therefore it will be difficult to find a profitable project with
a Net Present Value (NPV) higher than the WACC.
Graph 3

Financial Strategy BMBA715.2 W149303021
7
Hence, we cannot compare a Brazilian firm with a 34% corporate tax rate1 plus a level of interest rate
of 12.75%2 with a UK firm with a 20-21% corporate tax rate3 plus the level of the interest rate at
0,50%4.
Brazilian UK Equity 10,000,000 10,000,000
Income 1,500,000 1,500,000 Debts 6,000,000 6,000,000
Interest 765,000 300,000 Gearing 1 37.5% 37.5%
Tax 249,900 246,000
Net Income 485,100 954,000
New Equity 10,485,100 10,954,000
WACC 1 12.3% 9.4% KE 12% 12%
WACC 2 12.3% 9.5% Gearing 2 36.4% 35.4%
Table 2
In the table 2 I highlighted how much the corporate tax rate plus the level of the interest rate affects
two identic firms, one based in Brazil and the other in UK. I assumed that they have the same gearing
and the same revenue, but the WACC is 12,30% for the Brazilian and 9,40% for the UK based one.
How they can define the same X point?
It is evident that the X point, for firms with the same revenue but located in different countries, with
different level of taxation and interest rate, is totally different. In Brazil should be far lower than in UK.
In addition to that, there are also some high profitable companies with large amount of cash flow and
a high WACC that have difficulties to find new projects with NPVs higher than their WACC, so they
prefer buy buck their own shares to create a sort of fake new investments5(see principle 5). They are
investing in themselves reducing the number of the shares and the WACC. It shows a lack of
perspective projects for the future and so a difficult to guarantee the same growth for the coming
years.
1 http://www.kpmg.com/global/en/services/tax/tax-tools-and-resources/pages/corporate-tax-rates-table.aspx 2 http://www.tradingeconomics.com/brazil/interest-rate 3 https://www.gov.uk/corporation-tax-rates/rates 4 http://www.tradingeconomics.com/united-kingdom/interest-rate 5 Ten w ays to create shareholder value by A. Rappaport http://hbr.org/2006/09/ten-ways-to-create-shareholder-value

Financial Strategy BMBA715.2 W149303021
8
4. Maximized the WACC with a buy-back shares
The free cash flow theory says that dangerously high debt levels will increase value, despite the threat
of financial distress, when a firm's operating cash flow significantly exceeds its profitable investment
opportunities.
Generally accepted benefits of repurchasing their own stocks are: i. signaling undervaluation, ii. reducing the agency costs associated with excess cash,
iii. fending off takeover attempts, iv. mimicking industry peers.
Bonaimé, Öztekin & Warr (2014) documented that capital structure adjustments are a value-
increasing motive for repurchases and that the extent to which adjusting capital structure through a
repurchase creates value depends on the undervaluation of the firm. Firms repurchase stock for a
variety of reasons, including signalling undervaluation, reducing the agency costs associated with
excess cash, fending off takeover attempts, and mimicking industry peers.
Danis, Rettl & Whited (2014) showed that firms chose levels of debt in order to balance the benefits
from the interest tax shield with the costs of future financial distress or of current financial inflexibility.
They reckon that at times when firms are at or close to their optimal level of leverage, the cross-
sectional correlation between profitability and leverage is positive.
Mr Terry Smith, the founder and chief executive of asset manager Fund Smith, declares that buy-backs
only create shareholder value if the stock being purchased is trading below its intrinsic value and there
is no better use for the cash that would generate a higher return.
Mr Smith’s opinion finds confirms with a recent study by Brav, Graham, Harvey and Michaely (2005). They interviewed 384 financial executives and discovered that maintaining the dividend level is on par with investment decisions, while repurchases are made out of the residual cash flow after investment spending. Many managers prefer to repurchase because they are view as being more flexible than dividends and can be used in an attempt to time the equity market or to increase earnings per share. Many of those firms that pay dividends wish they did not, saying that if they could start all over again, they would not pay as much in dividends as they currently do. Firms with stable and sustainable increases in earnings are for the most part the only firms that consider increasing or initiating
dividends. But even many of these firms would prefer to pay out in the form of repurchases.
Hence a lot of executives think that to maximize the WACC is preferable to buy-back share, it also depends on the favourable moment of the gap between the cost of the debt compared to the equity
cost.
It is clear that both theories consider a high level of gearing dangerous. The big difference is that some authors and professionals consider the buy-back an opportunity when a company has projects with NPVs higher than its WACC and/or the firm’s shares are undervalued. In these cases they think that
the X point can be pushed more on the right side of the graph 1.

Financial Strategy BMBA715.2 W149303021
9
5. A real case: Shire Plc
Shire Plc is a biopharmaceutical company founded in 1986 and is headquartered in Dublin.
They used their cash flow to buy back shares. This means that their gearing ratio increased in
percentage with their equity but not in real terms.
I used their US Annual Report (see appendix 2-3) and evaluated what happened after they had decided
to buy-back their shares.
The first step is to define their cost of capital (Ke) and the cost of debt (Kd) during the period that they
bought back the shares.
2012 Equity 3,185,000,000
Dividends Paid 86,300,000
Net Equity 3,098,700,000 Ke (dividend growth) 12.0%
Table 3
The table 3 shows that, before deciding to activate the buy-back, Shire had an equity value of US$
3,185 Million with dividends for US$ 86,3 Million. Hence, I considered as a starting point an Equity
value of US$ 3,098.7 Million (3,185 – 86,3), without the dividends. I considered the cost of the capital
(Ke) at 12% because it represented the dividend growth from 2010 until 2014 (see appendix 1). I
assumed it was the same in 2012.
2013 Equity 3,098,700,000
Share buy back 500,000,000
Price per Share 29.19
Number of share 17,129,154
Book value of shares 5.509
Value of buy back for Equity 94,361,083
New Equity Value 3,004,338,917

Financial Strategy BMBA715.2 W149303021
10
% reduction of equity 3.0%
Table 4
Shire announced their buy-back programme on October 25, 2012 6 up to US$ 500 Million. On
November 11, 2013 they declared that this programme was terminated. They had bought only US$
300 Million with an average price per share of £ 19,46 (US$ 29.19, exchange rate US$/£ 1,50). Hence,
they bought 9,823,536 shares.
Looking the Table 4, let us consider what it could have happened when they had bought-back of US$
500 Million with an average price of £ 19.46 (US$ 29.19); because this is what probably the investors
had considered on October 25, 2012.
They probably evaluated that the real equity value would be worth US$ 3,004.34 Million after the buy-
back. To obtain this value I divided the value of the buy-back with the number of shares purchased
with US$ 500 Million and then I erased this value from the “old” equity value. I needed to consider
the book value of the shares and not the stock exchange’s price. After this buy -back the value of the
equity would become lower for about the 3%.
Average share price 2012 28.41
Average share price 2013 34.845
Share price for buy back 29.19 Table 5
The table 5 shows the real average price7 of Shire during the years 2012 and 2013. It also highlight the
average price paid from Shire for its buy-back. All price are expressed in US$.
6 http://www.shire.com/shireplc/en/investors/irshirenews?id=883 7 https ://uk.finance.yahoo.com/q/hp?s=shp.l

Financial Strategy BMBA715.2 W149303021
11
Graph 4
The Graph 4, uses a different value scale, but clearly shows how well this programme had worked
because Shire was stuck between the value 1,5-2,0 until the end of 2012, before they announced the
buy-back program. After that, they started to grow. We do not know if this programme worked better
than expected or they did not need it so far because they decided to interrupt it before buying the
US$ 500 Million that they had announced.
.
WACC 9.79% Market Capitalisation
562,200,000 29.19
16,410,618,000
Future cash flows 1,606,174,531 9.79%
16,410,618,000
What happens after buy back of 26,315,789 share at £ 19,46 ($ 29.19) each?
Shares Price Value

Financial Strategy BMBA715.2 W149303021
12
Shares WACC Value
WACC 9.74% New Market Capitalisation
1,606,174,531 9.74%
16,496,355,492
Number of shares after buy back
545,070,846
New Price of share 30.26
Increase value in shares 3.68%
Leverage pre buy back 26.2%
Leverage post buy back 26.8%
Table 6
In the Table 6 I calculated the market capitalisation considering the number of share and their average
price paid from Shire for the buy-back. I simulated their cash flow that combined with the WACC gave
this value at Shire. It is useful to define the new value when you use a different WACC.
Then, I calculated the Shire’s WACC considering the cost of the Equity at 12%, using the dividend
growth formula (dividends from 2010 until 2014) and the cost of the debts as pe r Balance Sheet 2012
(US$ 39.1 Million for US$ 1,100 Million of Bond, equal to 3.55%).
Shire’s WACC pre buy-back was 9,79%, after the buy-back became 9,74%. With a lower WACC, the
firm’s value immediately increased. The share price became US$ 30.26 from 29.19 (+ 3,67%). The same
effect is for the leverage, from 26,2% to 26.8%. In this case Shire used its cash flow for the buy-back,
but it is mathematical that when you reduce the number of the share, so the value of your equity, the
relation between debts and equity, will increase.
What will happen to EPS?
EPS 2012 pre buy back 1.33
EPS 2012 post buy back 1.37
Table 7
In Table 7 I showed how this buy-back programme increased also the EPS value. Also in this case it is
mathematical that if your Earning is the same and you reduce the number of share, their ratio will
increase.
Hypotesis buy back share with more debts at the same cost (Kd)
New value of financial debts 1,600,000,000
Value of Equity 3,004,338,917
Ke 12.0%
Kd 3.55%
WACC 9.07%

Financial Strategy BMBA715.2 W149303021
13
Leverage 34.75%
New Market Capitalisation 17,717,989,666
New Price of share 32.51
Table 8
In table 8 I considered a hypothetic case: if Shire increased the financial debts for buying-back, what
would happen? For simplicity I did not change any other parameter.
The Shire’s WACC would decrease to 9,07% and the relative share price would increase to a theoretical
US$ 32,51, from US$ 29.19 it represents a plus 11.37%, compared to US$ 30,26 (+ 3,67%) happened
in reality.
At the same time, the gearing ratio would increase from 26.2% to 34.75%.
The hypothetical case showed how happy the Shire’s shareholders would have been if Shire had
purchased its share using additional debt.
Yet, what would have happened for the company, if they had used additional debt?
What will happen in the company?
Net Income 2012 pre buy-back 745,400,000
Net Income 2012 after buy-back 743,625,000
Dividend paid 2012 86,300,000
Free cash flow 2012 pre buy-back 659,100,000
Free cash flow 2012 post buy-back 657,325,000
Table 9
The Table 9 shows that more debts could increase the share’s price, as seen in the previous table 6,
but they decrease the company’s cash flows (reduced because of the loan’s interests paid) . Shire
would have had less cash flow to invest in growth. To be precise, the real Net Income 2012 after the
buy-back with more debts would be higher than I wrote in the Table 9 because I did not consider the
benefit of the taxation on the interests paid. The tax rate for the interest is different in each countries
and it does not change the fact that with more financial debts you have less free cash flow to invest.

Financial Strategy BMBA715.2 W149303021
14
6. Conclusion
In 1984, Myers wrote that theories do not seem to explain actual financing behaviour, and it
seems presumptuous to advise firms on optimal capital structure when we are so far from
explaining actual decisions.
Some years later (2001), he added that there is no universal theory of the debt/equity
choice and no reason to expect one.
Every firm is different and operates in a different market and environment. What could
be considered a good structure in the UK market would be dangerous in the Brazilian and
so on.
When you need to define a capital structure of your firm, the main points to consider are
the WACC and the project’s NPVs. The higher the NPV compare to the WACC, the lower
the risk that the company is going on the right side of the optimal “X” point.
Bonaimé, Öztekin & Warr (2014) consider the benefits to repurchasing will be more pronounced when a firm's equity is undervalued, and thus the overall cost of repurchasing is low. Correspondingly, when the firm's stock is overvalued and repurchasing equity is relatively expensive, adjustments requiring stock repurchases will be more costly and hence less beneficial.
According to Damodaran (2001) Debt matters in valuation. It can both create and destroy value.

Financial Strategy BMBA715.2 W149303021
15
References Andresa, C., Doumetb, M., Fernaub, E., Theissenc E., (2015) The Lintner model revisited: Dividends
versus total payouts, Journal of Banking & Finance, Volume 55, pp. 56–69
Arnold, G. (2013) Corporate Financial Management, Pearson, fifth edition.
Bonaimé, A.A., Öztekin, O. & Warr, R.S. (2014) Capital structure, equity mispricing, and stock
repurchases, Journal of Corporate Finance, 26, pp. 182–200
Brav, A. , Graham, J.R., Harvey, Michaely R., (2005) Payout policy in the 21st century, Journal of
Financial Economics, 77, pp. 483–527
Brealey, R. A. and Myers, S. C. (1994) Principles of Corporate Finance, McGraw Hill, fifth edition.
Chen, S. & Wang, Y. (2012) Financial constraints and share repurchases, Journal of Financial Economics,
105, pp. 311–331
Damodaran, A. (2001) Corporate Finance 2nd Edition with Business Extra Password Card Set, Wiley,
second edition
Danis, A., Rettl, D. & Whited, T.M. (2014) Refinancing, profitability, and capital structure, Journal of
Financial Economics, 114, pp. 424–443
DeAngelo, H., DeAngelo, L., Skinner D.J. (2008) Corporate payout policy, Foundations and Trends in
Finance, 3, pp. 95–287
Guay, W. & Harford J. (2000) The cash-flow permanence and information content of dividend increases
versus repurchases, Journal of Financial Economics, 57, pp. 385-415
Healeas, S. (2012) Identifying and Evaluating Value, Mc Graw Hill, second edition.
Harris, M. & Raviv, A. (1991) The Theory of Capital Structure The Journal of Finance, Vol. 46, No. 1, pp.
297-355
Harrison, B. & Widjaja, T.W., (2013) Did the financial crisis impact on the capital structure of firms? Nottingham Trent University, Discussion papers in Economics, No. 2013/5 Henk von Eije & Megginson, W.L. (2008) Dividends and share repurchases in the European Union,
Journal of Financial Economics, 89, pp. 347–374
Hovakimian, A., Opler T. & Titman S. (2011) The Debt-Equity Choice, The Journal of Financial and Quantitative Analysis, Vol. 36, No. 1, pp. 1-24 Johnson, S. (2011) Few reasons to cheer share buy-backs, http://www.ft.com/cms/s/0/22629d1e-7d8d-11e0-b418-00144feabdc0.html#axzz3UGHoLnAd Johnson, S. (2014) People in Fund Management, http://www.ft.com/cms/s/0/2d16bd94-c3bc-11e3-
a8e0-00144feabdc0.html#axzz3UGHoLnAd

Financial Strategy BMBA715.2 W149303021
16
Modigliani, F. (1981) Debt, Dividend Policy, Taxes, Inflation and Market Valuation, The Journal of
Finance, Vol. 37, No. 2, Papers and Proceedings of the Fortieth Annual Meeting of the American
Finance Association, Washington, D.C., pp. 255-273
Modigliani, F. & Miller, M.H., (1958) The cost of capital, corporation finance and the theory of
investment, The American Economic Review, Vol. 48, No. 3, pp. 261-297
Myers, S.C. (1984) The capital structure puzzle, The Journal of Finance, Vol. 39, No. 3, Papers and
Proceedings, Forty-Second Annual Meeting, American Finance Association, San Francisco, CA, pp. 575-
592
Myers, S.C. (2001) Capital structure, The Journal of Finance, Vol. 15, No. 2, pp. 81-102
Skinner, D.J. (2008) The evolving relation between earnings, dividends, and stock repurchases, Journal
of Financial Economics, 87, pp. 582–609
Westerfield, R. and Jordan, J. (2011) Core Principles and Applications of Corporate Finance, Mc Graw
Hill, third edition.

Financial Strategy BMBA715.2 W149303021
17
Appendix 1
Shire: Pric Shire: Prices, Dividend, Div. growth and expected 2015
Date Open High Low Close Volume Adj Close
01/12/2010 1510 1573 1469 1543 1217600 1511.9 01/11/2010 1468 1574 1460 1503 1376400 1472.71
01/10/2010 1425 1514 1393 1471 2099700 1441.35 01/09/2010 1411 1532 1410 1434 1399900 1405.1
02/08/2010 1459 1522 1370 1406 1978000 1376.59
01/07/2010 1358 1502 1329 1455 1749800 1424.57 01/06/2010 1415 1488 1367 1374 1938400 1345.26
03/05/2010 1443 1487 1318 1421 2132300 1391.28 01/04/2010 1460 1508 1400 1443 2030300 1412.82
01/03/2010 1417 1526 1407 1454 1799500 1423.59 01/02/2010 1235 1448 1223 1407 2205700 1372.03
01/01/2010 1210 1276 1204 1237 1469100 1206.25
Average 1,398.62 £13.99 Price
Dividend Paid 7.04 7.04 Pences
Date Open High Low Close Volume Adj Close
01/12/2011 2128 2243 2096 2243 866300 2207.99 01/11/2011 1919 2133.49 1900 2132 1309200 2098.73
03/10/2011 1993 2072 1836 1951 1534100 1920.55
01/09/2011 1985 2034 1896 2010 1205800 1978.63 01/08/2011 2127 2145 1761 1987 2140300 1954.46
01/07/2011 1949 2147 1943 2119 1791500 2084.3 01/06/2011 1929 1947 629.5 1945 1502600 1913.15
03/05/2011 1831 1987 1831 1917 2136900 1885.61 01/04/2011 1814 1911 1683 1850 1714400 1819.71
01/03/2011 1749 1841.98 1713 1811 1631600 1781.34
01/02/2011 1646 1754 1610 1741 1565400 1705.91 04/01/2011 1535 1707 1532 1647 1455900 1613.81
Average 1,913.68 £19.14 Price
Dividend Paid 8.25 8.25 Pences
Date Open High Low Close Volume Adj Close
03/12/2012 1809 1968 1802 1887 1536700 1866.1 01/11/2012 1741 1822.32 1715 1806 1439400 1786

Financial Strategy BMBA715.2 W149303021
18
01/10/2012 1825 1886 1682 1743 2315300 1723.69 03/09/2012 1905 2000 1792 1814 2059900 1793.91
01/08/2012 1840 2058 1834 1916 1197400 1893.05
02/07/2012 1836 1937 1776 1848 1606000 1825.87 01/06/2012 1835 1976.5 1706 1832 2192500 1810.06
01/05/2012 2008 2059 1816 1828 1674600 1806.11 02/04/2012 2000 2066.82 1928 2010 2481200 1985.93
01/03/2012 2193 2270 2006 2020 2506000 1995.81 01/02/2012 2105 2316 2074.41 2198 2081800 2163.7
02/01/2012 2243 2278 2090 2106 1064300 2073.13
Average 1,893.61 £18.94 Price
Dividend Paid
9.70
9.70 Pences
Date Open High Low Close Volume Adj Close
02/12/2013 2730 2865 2620 2852 1436300 2835.46 01/11/2013 2763 2939 2738 2772 1769200 2755.92
01/10/2013 2473 2885 2373 2751 1635000 2735.04 02/09/2013 2395 2602 2384 2478 1360400 2463.63
01/08/2013 2415 2470 2356 2377 1251200 2361.28
01/07/2013 2088 2430.71 2069 2402 1513800 2386.12 03/06/2013 2158 2170 1978 2085 1581200 2071.21
01/05/2013 2009 2235 1853 2170 2460900 2155.65 01/04/2013 2004 2039 1891.68 2002 1727900 1988.76
01/03/2013 2065 2117 1961 2004 1624100 1990.75 01/02/2013 2116 2173 1996 2065 1793500 2042.13
01/01/2013 1887 2133 1887 2113 1453700 2089.6
Average 2,322.96 £23.23 Price
Dividend Paid 11.34 11.34 Pences
Date Open High Low Close Volume Adj Close
01/12/2014 4553 4739 4333 4533 1407500 4522.19 03/11/2014 4153 4582 4060 4557 1941800 4546.13
01/10/2014 5310 5470 3448.28 4163 5547500 4153.07 01/09/2014 4904 5425 4844 5340 1974300 5327.26
01/08/2014 4870 4934 4500 4923 2412300 4909.02 01/07/2014 4522 5050 4386 4891 4924100 4877.11
02/06/2014 3409 4686.02 3357 4570 2826200 4557.02
01/05/2014 3393 4133 3227 3414 1653800 3404.3 01/04/2014 2964 3491 2827 3378 2458000 3368.41
Financial Strategy BMBA715.2 W149303021
19
03/03/2014 3279 3444 2937 2945 2449400 2936.64 03/02/2014 3047 3426 2983 3320 2533100 3300.74
01/01/2014 2852 3055 2815 3043 1348000 3025.35
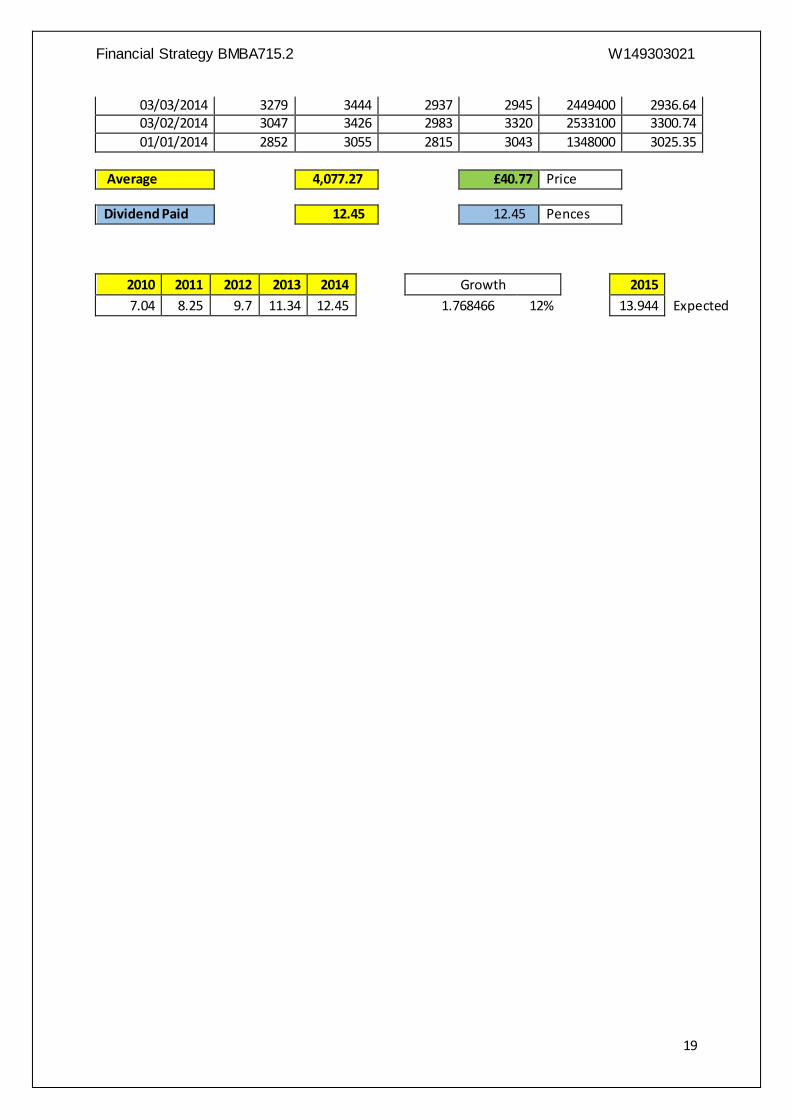
Average 4,077.27 £40.77 Price
Dividend Paid 12.45 12.45 Pences
2010 2011 2012 2013 2014 Growth 2015
7.04 8.25 9.7 11.34 12.45 1.768466 12% 13.944 Expected

Financial Strategy BMBA715.2 W149303021
20
Appendix 2
Shire: Balance Sheet 2010-2014
Period End Date 31-Dec-14 31-Dec-13 31-Dec-12 31-Dec-11 31-Dec-10
Accounting Standard
U.S.
standards
(GAAP)
U.S.
standards
(GAAP)
U.S.
standards
(GAAP)
U.S. standards
(GAAP)
U.S. standards
(GAAP)
Annual Balance Sheet: (GBP, In millions)
Cash and Short Term Investments 1,947.73 1,365.49 922.36 412.2 368.79
Cash 1,947.73 1,365.49 10.52 13.26 368.79
Short Term Investments 0 0 911.84 398.94 0
Total Receivables Net 750.62 696.21 600.25 586.83 483.12
Net Receivables 663.84 580.35 507.04 543.72 442.31
Accounts Receivable Gross 694.95 609.27 532.7 563.73 457.25
Provision for Bad Debt -31.1 -28.92 -25.65 -20.01 -14.95
Other Receivables 86.77 115.86 93.2 43.11 40.81
Total Inventories 349.4 274.9 268.78 218.84 166.07
Finished Goods 87.22 94.55 76.53 64.28 58.7
Raw Materials 66.38 35.14 56.54 49.93 34.62
Work In Process 195.8 145.21 135.71 104.63 72.75
Other Current Assets 276.35 252.56 184.68 203.01 182.99
Prepaid Expenses 23.67 17.75 19.5 30.18 28.81
Miscellaneous Current Assets 252.69 234.81 165.18 172.83 154.19
Total Current Assets 3,324.10 2,589.16 1,976.07 1,420.89 1,200.97
Net Property, Plant and Equipment 537.12 538.45 588 599.77 545.08
Property, Plant and Equipment -
Gross990.99 895.88 901.88 900.65 818.77
Buildings 459.9 419.62 431.37 455.57 440.65
Machinery/Equipment 185.99 166.76 176.68 174.96 76.26
Construction in Progress 28.15 27.53 57.71 52.57 107.11
Other Property/Plant/Equipment 316.95 281.96 236.11 217.55 194.74
Accumulated Depreciation 453.87 357.43 313.87 300.88 273.69
Total Investments and Advances 28.03 19.2 23.81 19.24 64.89
Long Term Investments 0 19.2 20.06 13 57.36
Investments in Associated
Companies28.03 -- 3.75 6.24 7.54
Intangible Assets 4,751.84 1,773.40 1,865.64 1,985.46 1,521.03
Goodwill- Net 1,587.24 377.12 396.49 381.31 257.08
Other Intangible Assets 3,164.60 1,396.29 1,469.15 1,604.14 1,263.95
Deferred Tax Assets 71.89 85.19 28.61 32.62 70.51
Other Assets 29.76 19.8 19.38 47.42 38.64
Other Tangible Assets 29.76 19.8 19.38 47.42 38.64
Total Assets 8,742.73 5,025.21 4,501.51 4,105.40 3,441.13

Financial Strategy BMBA715.2 W149303021
21
Period End Date 31-Dec-14 31-Dec-13 31-Dec-12 31-Dec-11 31-Dec-10
ST Debt and Curr Portion LT Debt 545.13 0 0 707.81 0
Short Term Debt 545.13 0 0 0 0
Current Portion of Long Term
Debt/Capital Leases-- 0 0 707.81 --
Accounts Payable 158.86 122.32 128.02 167.04 149.91
Income Taxes Payable 10.39 41.66 48.23 17.82 13.16
Other Current Liabilities 1,223.67 927.58 836.11 738.05 662.98
Accrued Payroll 166.62 126.97 106.74 104.43 89.23
Miscellaneous Current Liabilities 1,057.05 800.6 729.38 633.61 573.76
Total Current Liabilities 1,938.05 1,091.56 1,012.37 1,630.72 826.05
Long-Term Debt 0 0 676.71 0 707.63
Long Term Debt excluding
Capitalized Leases0 0 676.71 0 702.58
Convertible Debt 0 -- 676.71 0 702.58
Captilized Lease Obligations 0 0 0 0 5.05
Provision for Risks and Charges -- 0.6 7.57 9.33 8.62
Deferred Tax Liabilities 776.4 338.48 320.39 332.41 224.89
Other Liabilities 472.47 354.72 141.06 83.52 108.2
Other Liabilities (excl. Deferred
Income)463.62 341.98 126.73 66.66 91.02
Deferred Income 8.85 12.74 14.33 16.86 17.18
Total Liabilities 3,186.92 1,785.36 2,158.11 2,055.98 1,875.39
Common Equity 5,555.81 3,239.85 2,343.40 2,049.42 1,565.74
Common Stock 37.65 35.38 34.27 35.84 35.58
Capital Surplus 2,782.11 2,527.58 1,834.20 1,835.98 1,754.16
Retained Earnings 2,978.10 882.42 612.43 323.6 -102.39
Common Equity ESOP Guarantees -221.84 -272.06 -190.96 -184.8 -176.35
Unrealized Foreign Exchange
Gain/Loss-16.48 66.66 52.35 39.51 54.55
Unrealized Gain/Loss Marketable
Securities-3.72 -0.12 1.11 -0.71 0.19
Other Appropriated Reserves -20.2 0 0 0 --
Total Shareholders Equity 5,555.81 3,239.85 2,343.40 2,049.42 1,565.74
Accumulated Minority Interest 0 0 0 0 0
Total Stockholders' Equity 5,555.81 3,239.85 2,343.40 2,049.42 1,565.74
Total Liabilities and Shareholders Equity 8,742.73 5,025.21 4,501.51 4,105.40 3,441.13

Financial Strategy BMBA715.2 W149303021
22
Appendix 3
Shire: Income Statement 2010-2014
Period End Date 31-Dec-14 31-Dec-13 31-Dec-12 31-Dec-11 31-Dec-10
Accounting Standard
U.S.
standards
(GAAP)
U.S.
standards
(GAAP)
U.S.
standards
(GAAP)
U.S.
standards
(GAAP)
U.S. standards
(GAAP)
Annual Income Statement: (GBP, In millions)
Net Sales or Revenue 3,657.39 3,156.75 2,954.21 2,659.52 2,248.23
Cost of Goods Sold incl. Depreciation 807.44 584.03 581.73 524.87 386.61
Cost of Goods Sold excl. Depreciation 560.08 405.16 386.98 340.97 221.12
Depreciation, Depletion and
Amortization247.36 178.88 194.75 183.9 165.49
Depreciation 99.3 81.63 71.82 79.91 77.21
Amortization of Intangibles 148.07 97.24 122.93 103.99 88.28
Gross Income 2,849.95 2,572.72 2,372.48 2,134.65 1,861.62
Selling, General and Administrative Expense 1,550.39 1,485.96 1,644.09 1,405.30 1,330.57
Research and Development 517.87 569.51 550.17 455.06 428.45
Other Selling, General and
Administrative Expenses1,032.52 916.45 1,093.91 950.24 902.12
Operating Income 1,299.56 1,086.75 728.39 729.35 531.05
Unusual Expense (Income) – Net -671.34 -12.09 140.79 33.69 28.37
Nonoperating Income (Net) - Total 73.97 9.02 11.67 8.73 18.33
Miscellaneous Non-Operating Income
(Expense)- Net58.97 7.68 9.72 7.55 16.78
Non-Operating Interest Income 15 1.34 1.96 1.19 1.55
Interest Expense 18.71 24.37 24.11 24.39 22.73
Interest Expense on Debt 18.71 24.37 24.11 24.39 22.73
Interest Capitalized 0 0 0 0 --
Pretax Income 2,026.17 1,083.49 575.17 680.01 498.28
Income Taxes 34.07 177.79 105.39 141.98 118.33
Total Current Income Taxes 15.91 227.5 142.94 149.9 --
Income Tax - Current - Domestic -176.67 40.56 0 0 --
Income Tax - Current - Foreign 192.58 186.94 142.94 149.9 --
Deferred Income Taxes 18.16 -49.71 -37.55 -7.92 --
Deferred Domestic Income Tax -1.82 7.36 8.2 -0.62 --
Deferred Foreign Income Tax 19.98 -57.07 -45.75 -7.3 --
Equity in Earnings of Affiliated Companies 1.64 2.5 0.63 1.56 0.91
Consolidated Net Income 1,993.74 908.2 470.41 539.59 380.85
Net Income Before Extraordinary Items 1,993.74 908.2 470.41 539.59 380.85
Net Income 1,993.74 908.2 470.41 539.59 380.85


![[47] Strain wave gearing design system wave gearing...167 AMTEC [47] Strain wave gearing design system Fig.47.1 Strain wave gearing design system 47.1 Overview Strain wave gearing](https://img.dokumen.tips/doc/110x75/5e356487029e073cbd586fdc/47-strain-wave-gearing-design-wave-gearing-167-amtec-47-strain-wave-gearing.jpg)