Embed Size (px)
Citation preview
ILO Regional Office for Asia and the PacificILO/EC Project “Monitoring and Assessing Progress on Decent Work” (MAP)
Regional Training and Knowledge Sharing Workshop for Measuring Decent Work in Asia and the PacificWorkshop ReportBangkok, 27-30 November 2012
This document has been produced with the financial assistance of the European Union. The views expressed herein can in no way be taken to reflect the official opinion of the European Union.
ILO/EC Project “Monitoring and Assessing Progress on Decent Work” (MAP)
Monitoring and assessing progress towards decent work is a longstanding concern for the ILO and its constituents. Implemented by the ILO with funding from the European Union, the project “Monitoring and Assessing Progress on Decent Work” (MAP) helps to address this need. Over a period of four years (2009 to 2013), the project works with Ministries of Labour, National Statistical Offices, other government agencies, workers’ and employers’ organizations and research institutions to strengthen the capacity of developing and transition countries to self-monitor and self-assess progress towards decent work. The project facilitates the identification of Decent Work Indicators in line with national priorities; supports data collection; and assists in the analysis of data on decent work in order to make them relevant for policy-makers. The MAP publication series disseminates project outputs to a broad audience in the nine countries covered by the project and beyond.
For more information on the ILO/EC Project “Monitoring and Assessing Progress on Decent Work” (MAP) see http://www.ilo.org/map
ILO REGIONAL OFFICE FOR ASIA AND THE PACIFIC
ILO/EC PROJECT “MONITORING AND ASSESSING PROGRESS ON DECENT WORK” (MAP)
Workshop Report
Regional Training and Knowledge Sharing Workshop for Measuring Decent Work in Asia and the Pacific
27-30 November 2012
Bangkok, Thailand
This document has been prepared by the International Labour Office with funding from the European Union under the ILO/EC Project “Monitoring and Assessing Progress on Decent Work” (MAP).
International Labour Office
Bangkok and Geneva
December 2012
Copyright © International Labour Organization 2013
Publications of the International Labour Office enjoy copyright under Protocol 2 of the Universal Copyright
Convention. Nevertheless, short excerpts from them may be reproduced without authorization, on condition that
the source is indicated. For rights of reproduction or translation, application should be made to the Publications
Bureau (Rights and Permissions), International Labour Office, CH-1211 Geneva 22, Switzerland. The
International Labour Office welcomes such applications.
Libraries, institutions and other users registered in the United Kingdom with the Copyright Licensing Agency,
90 Tottenham Court Road, London W1T 4LP [Fax: (+44) (0)20 7631 5500; email: [email protected]], in the United
States with the Copyright Clearance Center, 222 Rosewood Drive, Danvers, MA 01923 [Fax: (+1) (978) 750
4470; email: [email protected]] or in other countries with associated Reproduction Rights Organizations, may
make photocopies in accordance with the licences issued to them for this purpose.
ILO Cataloguing in Publication Data
Regional training and knowledge sharing Workshop for Measuring Decent Work in Asia and the Pacific:
workshop report, 27-30 November 2012, Bangkok, Thailand / International Labour Office, ILO Regional Office
for Asia and the Pacific, ILO/EC Project "Monitoring and assessing progress on decent work" (MAP).- Bangkok,
Geneva: ILO, 2012
49 p.
ISBN 978-92-2-127082-9 (print); 978-92-2-127083-6 (web pdf)
ILO Regional Office for Asia and the Pacific; Workshop for Measuring Decent Work in Asia and the Pacific
(2012, Thailand)
decent work / employment / wages / measurement / data collecting / labour force survey / questionnaire / Asia /
Pacific
13.01.1
The designations employed in ILO publications, which are in conformity with United Nations practice, and the
presentation of material therein do not imply the expression of any opinion whatsoever on the part of the
International Labour Office concerning the legal status of any country, area or territory or of its authorities, or
concerning the delimitation of its frontiers.
The responsibility for opinions expressed in signed articles, studies and other contributions rests solely with their
authors, and publication does not constitute an endorsement by the International Labour Office of the opinions
expressed in them.
Reference to names of firms and commercial products and processes does not imply their endorsement by the
International Labour Office, and any failure to mention a particular firm, commercial product or process is not a
sign of disapproval.
This document has been produced with the financial assistance of the European Union. The views expressed
herein can in no way be taken to reflect the official opinion of the European Union.
ILO publications can be obtained through major booksellers or ILO local offices in many countries, or direct
from ILO Publications, International Labour Office, CH-1211 Geneva 22, Switzerland. Catalogues or lists of
new publications are available free of charge from the above address, or by email: [email protected]
Visit our website: www.ilo.org/publns and www.ilo.org/map.
Printed by the International Labour Office, Geneva, Switzerland
i
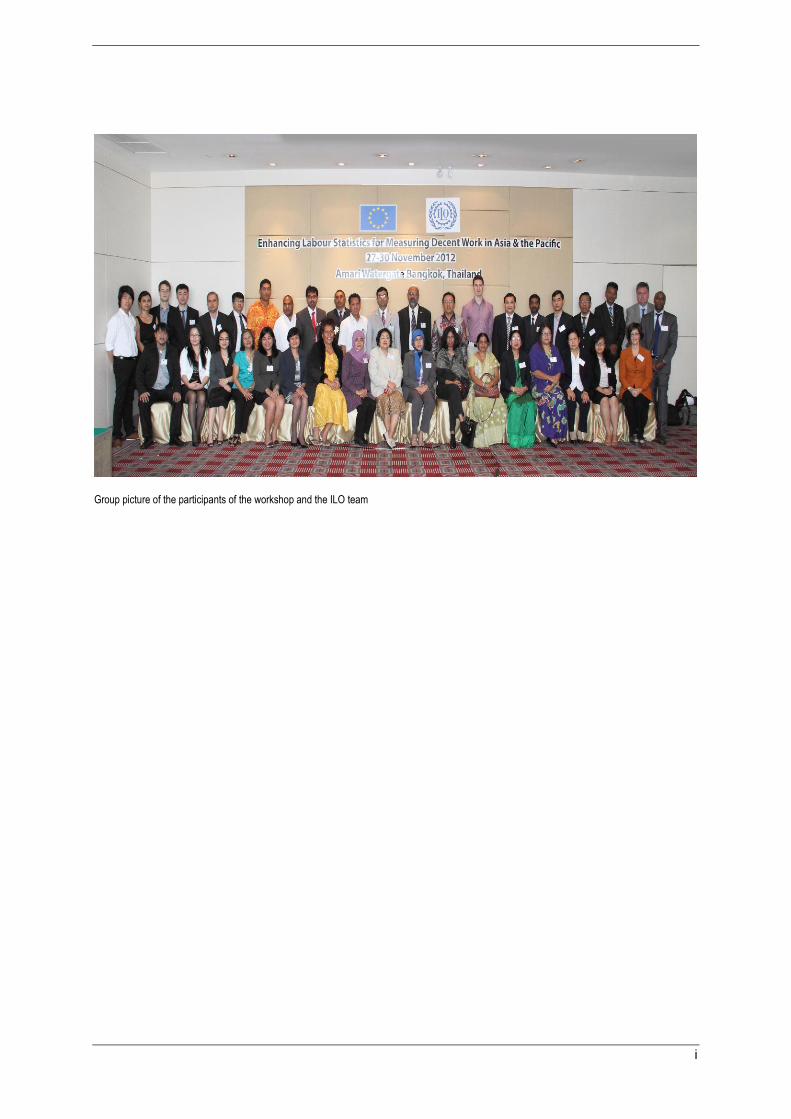
Group picture of the participants of the workshop and the ILO team

iii
Introduction
Monitoring and assessing progress (MAP) towards decent work at the country-level is a
long-standing concern for the ILO and its constituents. Against this background, the ILO
Declaration on Social Justice for a Fair Globalization (2008) recommends the
establishment of appropriate indicators or statistics, if necessary with assistance from the
ILO, to monitor the progress made in the implementation of the ILO Decent Work
Agenda.2
In the past, countries have called for the ILO to support their efforts to monitor and assess
progress towards decent work. In response, the ILO, with funding from the European
Commission, is implementing the technical cooperation project “Monitoring and
Assessing Progress on Decent Work (MAP)”. The project works with Government
agencies, workers‟ and employers‟ organizations and research institutions to strengthen
the national capacity to self-monitor and self-assess progress towards decent work.
The Regional Training and Knowledge Sharing Workshop on Enhancing Labour
Statistics for Measuring Decent Work in Asia and the Pacific which took place in
Bangkok, Thailand from 27th -30
th November 2012 was organized as one of the key
regional activities under the MAP project. The meeting was jointly organized and funded
by the MAP project, the ILO Department of Statistics and the ILO Regional Office for
Asia and the Pacific. It involved 36 participants, including government officials from
ministries of labour and national statistical offices of Bangladesh, Brunei Darussalam,
Cambodia, Indonesia, Malaysia, Mongolia, Myanmar, Nepal, Papua New Guinea, The
Philippines, Thailand, Samoa and Sri Lanka. In addition, workers‟ and employers‟
representatives from the Philippines also participated, as well as and representatives from
the ASEAN and SAARC.
The ILO was represented by Senior Economist from the Regional Economic and Social
Analysis Unit, Bangkok, Senior Economist from the Policy Integration Department,
Geneva, Senior Statistician from Bureau of Statistics, Geneva, Senior Regional
Statistician, Bangkok, and Regional Labour Market Information Officer, Bangkok as well
as national programme officers from Bangladesh, Cambodia and the Philippines. The EC
was represented by the Deputy Head of the EU Delegation to Thailand.
The highly participatory workshop included technical discussions and provided an
opportunity for statisticians and policymakers to exchange country experiences in the
measurement of decent work and the application of Decent Work Indicators in measuring
and monitoring progress on decent work. The participants also received guidance on
statistical and legal Decent Work Indicators, and worked in groups on practical examples
dealing with concepts, definitions, data sources and methods of data collection.
This report provides the key summary of the Workshop discussions and outcomes and
can be a useful reference, for those engaged and interested in the measurement of decent
work.


v
Contents
Introduction .................................................................................................................................... iii
Contents ........................................................................................................................................... v
List of acronyms and abbreviations ............................................................................................... vii
1. Welcome and Opening Session ............................................................................................. 9
1.1. Welcome Address by the EC Representative ............................................................. 9
1.2. Opening Remarks by the ILO representative .............................................................. 9
2. Introduction: Measuring Decent Work in Asia ................................................................... 10
3. National Experiences with Decent Work Indicators ........................................................... 11
3.1. Decent Work Indicators and Monitoring Decent Work in Cambodia ...................... 11
3.2. Manpower Statistics of Indonesia and Decent Work Monitoring ............................. 11
4. Sources of Data Collection .................................................................................................. 13
5. Collecting Decent Work Data from Administrative Records ............................................. 14
5.1. Administrative Data for Policy Making in Sri Lanka ............................................... 14
6. Wage Indicators: Development and Application for Policy Making .................................. 15
6.1. Wage Indicators: Development and Application for Policy Making, The
Philippines ........................................................................................................................... 15
7. Measuring Informality ........................................................................................................ 17
7.1. Measuring Informality: Bangladesh Experience....................................................... 17
7.2. Measuring Informal employment in Nepal: A Case of Nepal Labour Force Survey
2008 18
8. Labour Force Surveys ......................................................................................................... 18
8.1. Labour Force Survey in the Case of Thailand .......................................................... 19
8.2. Labour Force Survey of Mongolia ............................................................................ 19
9. Complementary Surveys For Decent Work Data ................................................................ 19
9.1. Complementary Surveys for Decent Work Data: The Experience of Myanmar‟s
Household Income and Expenditure Survey ....................................................................... 19
9.2. Alternative Sources For Decent Work Data: Experience of Papua New Guinea ..... 20
9.3. Design and Methodology of School to Work Transition Survey with Labour
Market Indicators as well as Samoa Future Plans for Labour Statistics. ............................ 20
10. Questionnaire Design For Decent Work Indicators: Labour Force And Other Household
Surveys .......................................................................................................................................... 21
10.1. Group A .................................................................................................................... 21
10.2. Group B..................................................................................................................... 22
vi
10.3. Group C..................................................................................................................... 22
11. Strengthening Surveys, Building Labour Statistics Systems .............................................. 24
11.1. Indonesian National Labour Force Survey ............................................................... 24
11.2. Provincial Labour Force Survey Design And Development In The Philippines ...... 24
11.3. Data Integration From The Administrative And Survey/ Census Data In Malaysia 25
11.4. Enhancing labour statistics for measuring decent work in Asia and the Pacific ...... 25
12. Analysing and Interpreting Decent Work Data for Policymaking ...................................... 26
12.1. Strengthening the Collection and Management of Decent Work Data for Policy
Making: The Sri Lankan Experience .................................................................................. 27
13. Summary and Ways Forward .............................................................................................. 27
13.1. Closing Remarks ....................................................................................................... 29
Annex I. Workshop Agenda .......................................................................................................... 31
Annex II. List of Participants ........................................................................................................ 34
Regional Training and Knowledge Sharing Workshop: Enhancing Labour Statistics for
Measuring Decent Work in Asia and the Pacific .......................................................................... 34
Amari Watergate Hotel, Bangkok, 27-30 November 2012 ........................................................... 34
Annex III. Summary of Participant Evaluations ........................................................................... 40
Annex IV. ILO Standard List of Decent Work Indicators ............................................................ 43
vii
List of acronyms and abbreviations
ADB Asian Development Bank
ALM ASEAN Labour Minister
ASCC ASEAN Socio-Cultural Community
ASEAN Association of South East Asian Nations
BBS Bangladesh Bureau of Statistics
CAPI Computer Assisted Personal Interviewer
CLS Child Labour Survey
CSO Central Statistical Organization
DHS Demographic Health Survey
DW Decent Work
DW Country Profile Decent Work Country Profile
DWI Decent Work Indicators
EC European Commission
EPU Economic Planning Unit
DOS Department of Statistics
HIES Household Income and Expenditure Survey
ICLS International Conference of Labour Statisticians
ICT Information and Communications Technology
ILO International Labour Organization
ISS Informal Sector Survey
LEP Labour and Employment Plan
LFS Labour Force Survey
LMIS Labour Market Information System
MAP Monitoring and Assessing Progress on Decent Work
MOHR Ministry of Human Resources
MOLE Ministry of Labour and Employment
MOMT Ministry of Manpower and Transmigration
NHREP National Human Resource Employment Policy
NIS National Institute of statistics
NSO National Statistics Office
OSH Occupational Safety and Health
PDP Philippine Development Plan
PNG Papua New Guinea
SAARC South Asian Association for Regional Cooperation
SPC Secretariat of the Pacific Community
TME Tripartite Meeting of Experts
UNDP United Nations Development Programme
UNESCAP United Nations Economic Commission for Asia-Pacific
UNWOMEN United Nations Women


9
1. Welcome and Opening Session
Moderator: Ms Sukti Dasgupta, Senior Economist, Regional Economic and Social
Analysis Unit, ILO Bangkok
1.1. Welcome Address by the EC Representative
Mr Attila Nyitrai, Deputy Head of Delegation, EU Delegation to Thailand
Mr Nyitrai thanked the guest speakers and the ILO Bangkok for organizing the regional
workshop and welcomed all participants. He started by providing some statistics on the
labour market situation in the Asia and the Pacific. He stressed the fact that a majority of
people in the region lived on less than USD 2 a day and many workers did not have access
to social protection. He also noted the difficulties of measuring Decent Work (DW) and
acknowledged the ILO‟s efforts in this area.
In closing, Mr Nyitrai noted that the workshop provided a good opportunity for countries
in Asia and the Pacific to share experiences and present good practices to each other which
would then improve knowledge and enhance national capacities in measuring and
monitoring progress on DW.
1.2. Opening Remarks by the ILO representative
Ms Thetis Mangahas, Deputy Regional Director, ILO Regional Office for Asia and the
Pacific
Ms Mangahas welcomed the participants and thanked the EC for supporting the ILO in its
endeavours to help build capacities of countries in measuring and assessing progress
towards Decent Work. She mentioned that the global economic crisis was still unfolding
and that, according to the ILO‟s estimates, 200 million workers in the world were
unemployed with youth unemployment numbering 75 million. She also noted that although
growth prospects had remained moderate in Asia, there were still 90 million workers
unemployed and a high percentage of people working in low quality jobs. She stressed the
need for data as governments in the region look to design informed policies to deal with
labour market imbalances. Like Mr Nyitrai, she also noted the difficulty in measuring
Decent Work and said that the four-day regional workshop was a good platform for
countries in Asia and the Pacific to come together, share experience gained under the MAP
project and discuss current statistics and ways forward.

10
Opening remarks by Ms Thetis Mangahas, Deputy Regional Director, ILO Regional Office for Asia and the Pacific
2. Introduction: Measuring Decent Work in Asia
Presenter: Mr Nikolai Rogovsky, Senior Economist, Policy Integration Department, ILO
Geneva
Mr Rogovsky stated that the global economic crisis had magnified the importance of
measuring Decent Work as policy makers needed good data more so than ever before for
guidance. He stressed the need to boost capacity for measuring Decent Work through an
internationally recognized methodology that was adopted by the ILO in 2008 and that had
concerted validation and review mechanisms supported by all constituents. He then
introduced the Monitoring and Assessing Progress on Decent Work project (MAP). The
main goals of the project are to assist constituents from developing countries to assess their
progress towards Decent Work, by compiling and analysing both statistical and legal
framework indicators, and to monitor progress made over time. He further stated that the
ILO was compiling a comprehensive set of Decent Work Country Profiles based on
national lists of Decent Work Indicators (DWIs) available on the ILO website and MAP
website. The profiles had been produced with the aim of arming constituents with facts in
order to facilitate and better inform social dialogue and policymaking.
Mr Tite Habiyakare, Senior Regional Statistician, ILO Regional Office for Asia and the
Pacific
Mr Habiyakare reviewed the 18 main Decent Work Indicators, and presented the ILO/EC
Manual on concepts and definitions of Decent Work Indicators1. He mentioned that
participants could consult this document as a means to find sound methods of self-
1 Downloadable here: http://www.ilo.org/stat/Publications/WCMS_183859/lang--en/index.htm
11
assessing progress on DW. He also noted that an important feature of the revised ILO
proposal on Decent Work Indicators is the inclusion as main indicators of statistics on the
proportion of young people not in employment and not in education, a statistic that has
recently generated much interest and discussion, as well as statistics on informal
employment.
3. National Experiences with Decent Work Indicators
Moderator: Ms Sukti Dasgupta, Senior Economist, Regional Economic and Social
Analysis Unit, ILO Bangkok
3.1. Decent Work Indicators and Monitoring Decent Work in Cambodia
Presenters: Mr Heang Kanol, Deputy Director General, National Institute of Statistics,
Cambodia; Mr Hoeung Sophon, Director of Labour Market Information Department,
Ministry of Labour and Vocational Training
Mr Kanol presented a brief overview of the DW country programme in Cambodia. He said
that a framework for monitoring and assessing progress on DW was first discussed at a
„National Tripartite Consultation & Capacity Building Workshop‟ in Cambodia in May
2011, during which tripartite constituents identified a list of 63 indicators and 20 priority
indicators covering working time, earnings, employment quality, poverty, occupational
safety and health, and rights at work. The indicators proposed in the ILO global list for
measuring Decent Work supplemented the indicators identified at the workshop.
Thereafter, an outline for a Decent Work Country Profile was developed with each chapter
having its own set of indicators together with legal framework indicators as per the ILO
standard template.
Mr Kanol also noted that the main achievements for Cambodia in this regard had been the
publication of the Decent Work Country Profile and the completion of the combined
Cambodia Labour Force and Child Labour Survey (LFS-CLS) 2012. This survey included
an enhanced questionnaire which was designed with ILO/MAP assistance, and which now
enables the National Institute of Statistics (NIS) to calculate a number of additional DWIs
that were not available in the Decent Work Country Profile. A new Decent Work Country
Profile would, he noted, be developed based on the results of the 2012 LFS-CLS.
However, he added that future data collection would be difficult since labour force surveys
were irregular and administrative sources still weak in Cambodia. In concluding, Mr Kanol
noted that the NIS was planning to conduct the LFS more regularly from now on (budget
depending) and was also willing to support improvements to administrative data (collected
usually in other ministries).
3.2. Manpower Statistics of Indonesia and Decent Work Monitoring
Presenter: Ms Selviana, Ministry of Manpower and Transmigration
Ms Selviana stated that measuring Decent Work was part of Indonesia‟s national
development plan. She gave a brief overview of the MAP project in Indonesia explaining
that under the project, a Tripartite Consultation Workshop on Measuring Decent Work was
organized in Jakarta in March 2010, during which national DWIs were identified. Based on
12
the data compilation, the Decent Work Country Profile had been completed, which
illustrated recent Decent Work trends in Indonesia.
Ms Selviana noted that the objective of the Profile was to take stock of the progress made
in Indonesia since 1996, and assess the remaining challenges and provide insights into the
policies required to address them. The profile covers eleven thematic areas of Decent
Work, and drew on relevant statistics and presented important aspects of the legal
framework for Decent Work in Indonesia. Data was compiled based on national surveys
and administrative records. She highlighted the two major surveys carried out regularly in
Indonesia: the National Labour Force Survey (SAKERNAS) conducted twice a year, and
the National Socio-Economic Survey (SUSENAS), a multi-purpose survey with a complex
methodology.
Ms Selviana also stated that Indonesia is currently working on developing DW profiles at
regional and provincial levels (with ILO-MAP support). She noted that one of the main
challenges that the country faced in terms of data collection and production was that
regional and provincial staff lacked training and resources. This also meant that there was
no proper communication and coordination between central and provincial offices of the
Ministry of Manpower and Transmigration (MoMT). In this regard, Indonesia planned to
improve capacity of staff at regional and provincial levels and facilitate better
communication and data flows between MoMT and its subnational offices.
Plenary Discussion
Ms Sukti Dasgupta of the ILO said that Indonesia was a very mature example of a
statistical system and contained much of what the ILO/MAP would want to see –
regular data collection systems for all key decent work indicators and political
awareness of and support for the process. She noted that Indonesia‟s work on
developing Provincial Decent Work Profiles was very commendable and could
make sense for a number of other countries, where geographical disparities in
Decent Work may be highly significant.
A participant from Bangladesh raised an important issue regarding difficulties in
measuring Decent Work in developing countries like Bangladesh where
statisticians lacked adequate training. He suggested that pilot study must be done
before carrying out new survey and enumerators must be trained. Also, he further
mentioned that another major challenge for Bangladesh was that at the country
level, there was not much attention given to the process of data collection and not
everyone working at the Ministry of Labour was committed. Hence, he proposed
that further training should be provided at this level in order to strengthen the
capacity of the staff at the Ministry of Labour.

13
4. Sources of Data Collection
Moderator/speaker: Ms Sophia Lawrence, Department of Statistics, ILO Geneva
Ms Lawrence stated that there were different types of data sources and different
government actors would often have to work together to get the full set of indicators for
measuring decent work (and developing national assessments like the Profiles). She stated
that the three broad, primary types of sources of data were: surveys or censuses of
individuals and households; of establishments and businesses; and administrative records.
She noted that official statistical sources such as labour force surveys, establishment
surveys, the population census or population registers (in some countries) were part of the
regular data collection system in countries. She also said that administrative records kept
for institutional purposes needed to be turned into a useful statistical source, as, it must be
noted that they only reflected a reference population covered by the particular
administrative system. For additional coverage, estimates may have to be developed to
simulate full coverage.
Ms Lawrence also noted a coverage problem in Asia: that many surveys did not include
important groups of workers, such as migrant workers, informal workers, temporary,
sporadic or casual workers. Regarding standard establishment surveys, she added that they
often did not contain seemingly key information such as employees‟ sex (as this was not
needed for payrolls). A key factor here is to design all of the applicable surveys to use
comparable classifications (industry, occupation, status in employment, age-groups etc.) in
order to make them comparable, hence more relevant and useful for measuring DW.
Ms Lawrence mentioned that until the 2000s, the population census did not include many
questions to capture labour force characteristics of the economically active population.
However, where other data sources were rare or non-existent, many countries were
recognizing how useful population censuses were as an information source when others
were lacking and how important they might be, especially for small area estimates.
Regarding Labour force surveys, properly designed questions with follow-up probing
questions could generate useful information covering “ambiguous” economic activities that
might otherwise not be captured. Choosing the right questions, she stressed, was therefore
a key element in questionnaire design. Ms Lawrence also said that the census was used as
benchmark for the LFS and administrative records were useful to adjust, in turn, the LFS
results.
Plenary discussion
Ms Lawrence added that a common problem was that different government offices
might often use different sectoral classifications, leading to data incompatibility
and incoherence within the country. Training might thus be required in order to
remedy this, through better coordination to ensure national harmony. Countries
might base these variables either on a national classification or on the international
standard classifications and using international guidelines.
Ms Lawrence noted that in other cases, certain ministries might not have the
authority to collect certain data. In these cases, and in general she recommended
the establishment of inter-ministerial steering committees/boards (together with
related capacity building training), which would help build consensus and promote
coherence and cooperation in data collection/production across government.
Ms Lawrence said that the concept of unemployment was really one of zero-hours
worked, which many people in the developing world simply could not afford –
making the concept very unhelpful for many countries. The existing concept of

14
underemployment was more relevant in these circumstances. Also new concepts
such as „unmet need for employment‟ or „marginally attached persons‟ i.e. those
available for work but not seeking it and those who want to work more but are not
available, were emerging as useful alternatives. The aim is to shift the focus away
from the traditional use of „unemployment‟ as a key variable towards taking a
more nuanced and insightful look at this phenomenon of unmet need for
employment together with unemployment and disaggregating it in more relevant
ways.
5. Collecting Decent Work Data from Administrative Records
Moderator: Mr Tite Habiyakare, ILO Bangkok
5.1. Administrative Data for Policy Making in Sri Lanka
Presenters: Ms Chandani Amarathunga, Additional Commissioner General of Labour,
Department of Labour, Sri Lanka; Mr Weerasinghe Premakumara, Director of Statistics,
Department of Census and Statistics
Ms Amarathunga said that administrative data played an important role in the statistical
system in Sri Lanka. With regard to DWIs, administrative data is mostly collected from the
Ministry of Labour and Labour Relations, and Ministry of Education. Some of the data
collected include labour inspection data, fatal and non- fatal accidents, trade unions,
industrial disputes, social security and so on.
However, she noted that collecting good administrative data was not easy and Sri Lanka
faced a number of challenges. One such challenge was timeliness and accuracy of
reporting. Primary reporters often did not strictly follow the time schedule planned, and
accuracy of the information filled by them was affected by a lack of training. Another
challenge they face is a lack of coordination among various government divisions the due
to the absence of a centralized database system.
Ms Amarathunga said that some of the steps taken by the Sri Lankan government in order
to address these issues included computerization and consolidation of various
administrative data sources, as well as training and workshops for labour officers.
Furthermore, Sri Lanka was drafting a labour inspection guide in order to assist labour
officers during inspection and it was also preparing an ILO training manual on collection
of administrative data.
Plenary Discussion
Ms Sophia Lawrence of ILO Geneva noted that Indonesia seemed to have a fairly
robust „vertical‟ system for gathering statistical data from largely autonomous
regional or provincial statistical bodies into a central organization (BPS –or
Statistics Indonesia). However, as this system did not extend to administrative
records, these often therefore remained „locked‟ within the regions. As a result,
there might be some coordination issues involved to enable the use of
administrative sources from decentralized bodies, especially in larger countries
like Indonesia and so a national statistical „law‟ in support of international
„guidelines‟ were useful to ensure this..
Mr Tite Habiyakare of the ILO used the example of Indonesia where provinces
have an administrative autonomy and therefore have no obligation in reporting
15
data from administrative records to the central government. The ILO‟s
recommendation in collecting such data would be to refer to the national statistics
law/act, which government institutions should not see as a threat but as an added
value for improving the collection of labour statistics from administrative records.
Where administrative decentralisation is very strong National Statistical Offices
(NSOs) would be the best to collect data from administrative records provided this
is clearly indicated in their mandate. Citing Sri Lanka‟s example where district
offices were directly under the central government, Mr Habiyakare said that even
in such cases some regulations were needed on how labour data from various
administrative records could be gathered at a central level, and this may need some
agreement between all national authorities and stakeholders.
Ms Sophia Lawrence of ILO Geneva said that as administrative records already
existed within institutions their use for labour statistics was usually free; they were
also very useful sources of data to provide information on the function of the
concerned institutions. If the ILO could help to strengthen national government
capacities and mobilize resources and action, data collection/production of labour
statistics would be greatly improved.
6. Wage Indicators: Development and Application for Policy Making
Moderator: Mr Tite Habiyakare, ILO Bangkok
Mr Habiyakare first spoke of the 12th International Conference of Labour Statisticians
(ICLS) of 1973 with the resolution concerning an integrated system of wages statistics that
defined the concept of „wage‟ still in use today. The ILO‟s Convention 160 in 1985
broadened the scope of this in terms of measurement and data production, and the 16th
ICLS in 1998 took the wage concept further to define income from employment. He added
that the definition of wage covers all gross remuneration in cash, allowances regularly
received and payment in kind, but still excluded employers‟ contributions paid to social
security and pension schemes or certain bonuses paid at retirement or resignation. The
concept of „total labour cost‟ was rather broad and included family care, health insurance,
social security and all other employer costs collectable by the individual employee.
Mr Habiyakare added that the ILO encouraged the publication of both the average and the
median wage for the calculation of certain indicators and analysis of wage distributions.2
6.1. Wage Indicators: Development and Application for Policy Making, The Philippines
Presenter: Ms Teresa V. Peralta, Director, Bureau of Labour and Employment Statistics
Ms Teresa Peralta opened her presentation by speaking about the development of the
Philippine statistical indicators on adequate earnings and productive work, which took
guidance from the recommended list of indicators of the International Tripartite Meeting of
Experts (TME) on the Measurement of Decent Work in 2008.
2 The ILO‟s latest Global Wage Report comes out on 5
th December 2012 and participants are
encouraged to access it.
16
Furthermore, she said that The Labour Force Survey (LFS), conducted by the National
Statistics Office (NSO), was the source of wage statistics on the decent work element of
adequate earnings and productive work. The survey covered around 51,000 sample
households nationwide.
The compilation of the DWIs on adequate earnings and productive work involved the
following activities:
1. Assessment of the availability of data on the statistical indicators recommended
by the TME (2008);
2. Determination of proxy statistical indicator as earlier discussed:
3. Preparation of the annotated outline on the tabulations;
4. Data research/tabulations for indicators that are not “off-the-shelf” or those that
required further disaggregation. The public-use files or micro data of the LFS
facilitated data compilation.
Indicators on adequate earnings and productive work together with the other indicators of
the decent work framework were presented in a tripartite validation workshop in March
2012 prior to the finalization of the Decent Work Country Profile, with ILO/MAP support.
Ms Peralta also noted that The Philippine Development Plan (PDP 2011-2016), which
provides the strategic policy framework for the country, placed emphasis on inclusive
growth and poverty reduction –central to which is the concept of decent work. She also
added that the key national framework concerning decent work, the Philippine Labour and
Employment Plan (LEP), was crafted through “tripartite plus” consultations (meaning the
tripartite constituents plus additional stakeholders), and that this elaborated on policies and
programs that underscore the strategic objectives of the decent work agenda (i.e. full and
productive employment, rights at work, social protection and the promotion of social
dialogue).
Ms Peralta added that the national LFS offered some robust wage data, including special
modules on domestic workers (in 2007 and 2011) that have produced important evidence,
for example, in the lead up to the Philippines passing the ILO Convention 189 on
Domestic Workers. The Philippines was also planning to design and develop provincial-
based LFS that is expected to begin in 2014.
Plenary Discussion
A participant from Cambodia said that in countries such as his, wages also
included benefits such as bonuses, loans and other allowances. The participant
asked whether such benefits should be counted as wages or not. Mr Habiyakare of
the ILO responded that with the exception of loans, if such allowances are directly
paid to the employees and are not employers‟ contribution to social security
schemes, they should be counted in wages.
A participant asked Ms Peralta on how they managed to set up a national
minimum wage. She replied that, in the Philippines, representatives from the
Employers‟ organization, workers‟ organization and the government had regular
consultations on the issues of jobs, wages, and labour productivity through the
Tripartite Wages and Productivity Commission. So, the recommendation from the
Philippines to other countries in this regard would be to work towards an
institutionalized system of regular social dialogue, to gain mutual trust and
cooperation between parties.

17
7. Measuring Informality
Moderator: Mr Tite Habiyakare, ILO Bangkok
Mr Habiyakare introduced the session by summarising the conceptual framework for
measuring employment informality. The resolution concerning statistics of employment in
the informal sector that was adopted by the 15th ICLS in 1993, and the guidelines
concerning the statistical definition of informal employment were adopted by the 17th
ICLS in 2003. Furthermore, the ILO has released a pre-edited version of a manual titled
Measuring Informality: a new Statistical Manual on the informal sector and informal
employment3 to help constituents, especially in statistical offices and ministries of labour,
to define, quantify and characterize the contribution of the informal sector and informal
employment in total employment as well into national accounts.
7.1. Measuring Informality: Bangladesh Experience
Presenters: Mr Muhammad Shamsul Alam, Bangladesh Bureau of Statistics, Mr
Muhammad Aminul Islam, Department of Labour and Employment
Mr Alam said that many people were employed in the informal sector in Bangladesh.
However, he noted that informal jobs were associated with lower productivity and wages,
less social protection and high vulnerability to poverty. Moreover, he noted that informal
sector and informal employment statistics had not yet been regularly collected nor included
in Bangladesh‟s official labour force statistics.
He also said that Bangladesh Informal Sector Survey (ISS) 2010 was conducted alongside
the 2010 Labour Force Survey with support from the Asian Development Bank (ADB).
This joint undertaking, using the mixed survey approach, was cost effective, and it also
allowed collection of valuable data on the informal economy. Mr Alam noted that the
Bangladesh Bureau of Statistics (BBS) was planning to combine both the surveys from
now on.
However, he noted that lack of training among survey staff resulted in a number of data
inconsistencies that made data integration between the datasets for ISS and LFS more time
consuming. Hence, he stressed that survey staff should be properly trained in future.
Mr Alam concluded his presentation by saying that the BBS was planning to conduct the
national LFS more frequently from now on and next LFS was planned for 2013 with ILO-
MAP support. BBS also planned to obtain administrative data from agencies that were
under Ministry of Labour and Employment (MoLE) and had already started dialogue with
the stakeholders for generating relevant data on DWIs.
3 Downloadable here: www.ilo.org/stat/Publications/WCMS_182300/lang--en/index.htm
18
7.2. Measuring Informal employment in Nepal: A Case of Nepal Labour Force Survey 2008
Presenters: Ms Ganga Devi Dabadi, Central Bureau of Statistics (Nepal), National
Planning Commission Secretariat, Mr Indra Prasad Bashyal, Under Secretary, Ministry of
Labour and Employment (Nepal)
Ms Dabadi started by introducing the Nepal LFS 2008. She said that it was the second and
the most recent LFS conducted by Nepal and the concepts and definitions followed the
ILO guidelines. She also stated that informal employment measurement was conducted for
the first time in in the 2008 survey, even though it only measured the non-agricultural
sector in this regard.
Ms Dabadi noted that the 2008 LFS survey results had identified the informal sector as an
important contributor to the economy and efforts were being made by the government to
bring informal enterprises under formal jurisdiction (i.e. law). She added that a new labour
law was being drafted and all enterprises would be brought under the law regardless of
their size. Furthermore, she stressed that the Social Security Act currently being drafted
would further encourage formal rather than informal employment. Lastly, she noted that an
annual household budget survey would be carried out from 2013 and this survey will
further help collect employment information.
Plenary Discussion
A participant from the Philippines said their National Statistics Office (NSO) also
published an LFS-based ISS in 2008, using almost the same definition as Nepal,
based on the 2003 ICLS guidelines.. However, unlike Nepal they also covered the
agricultural sector and other industries. One problem they found was that for
family workers, employee income was often not distinguished from normal family
costs. In the Philippines, the only type of registration they count as an indicator of
formality is business registration and they do not rely on any other type of
registration, such as social security or regulatory bodies.
A representative from Indonesia said that in the absence of a direct measurement
of informal employment, the BPS used proxy statistical estimates through cross-
tabulations of two variables, employment status and occupation. However, in order
to measure informal employment directly, the BPS and ADB had recently
conducted a pilot survey on the informal sector and employment in two provinces:
Yogyakarta and Banten.
8. Labour Force Surveys
Moderator: Sophia Lawrence, ILO Geneva
Ms Sophia Lawrence provided a brief introduction of the Labour Force Surveys (LFS).
She noted that these household surveys were very important for measuring DW indicators
and that the majority of the DW indicators had a household survey as a main source. She
noted that DW indicators are advantageously measured through LFS and often based on
the standards adopted by the ICLS. She developed further on how to formulate questions
for a standard LFS questionnaire. Providing examples of Cambodia LFS 2012 and
Philippines DW indicators on precarious work, she showed how core LFS questions were
derived in these countries based on key issues pertaining to these countries and as well as
international standards.
19
8.1. Labour Force Survey in the Case of Thailand
Presenter: Mr Anon Juntavich, Statistician, National Statistics Office
Mr Juntavich stated that in Thailand, the monthly LFS was a major source of labour
statistics. He said that data was collected between 1st and 12
th of every month and there
were over 900 enumerators nationwide. Time lags were 2 months and 1 month after field
operations for quarterly and monthly surveys, respectively. The central office (NSO)
produced the reports collected from regional/provincial levels. Also, Thailand was now
planning to introduce paperless questionnaires (enumerators would input question answers
on a tablet computer) in order to improve data quality and save time.
In closing, Mr Juntavich mentioned that conducting LFS regularly on a monthly basis had
helped policy makers monitor the Thai Labour Development Plan and to measure the
impact of economic crisis. Furthermore, it had also helped to facilitate comparisons with
international labour statistics.
8.2. Labour Force Survey of Mongolia
Presenter: Ms E. Gantuya, Officer of Population and Social Statistics Department of
National Statistics
Ms Gantuya spoke about the Mongolia LFS, noting that Mongolia conducted its first LFS
in 2002-2003 and since then had conducted it on a regular (quarterly) basis. In addition,
Child Labour Survey (CLS) and Informal Sector Survey (ISS) were also carried out on a
regular basis. In closing, she stated that Mongolia planned to revise the methodology,
concepts, definitions and indicators of labour statistics and LFS in line with the Mongolian
context.
Plenary Discussion
A participant from the audience asked how the NSO (Mongolia) managed to
attract consistent government funding to the national statistics team to collect data
and to conduct regular labour force surveys. Ms Gantuya responded by saying that
they had a national statistics law, meaning the government was obliged to allocate
budgets for statistics and surveys.
9. Complementary Surveys For Decent Work Data
Moderator: Mr Nikolai Rogovsky, ILO Geneva
9.1. Complementary Surveys for Decent Work Data: The Experience of Myanmar’s Household Income and Expenditure Survey
Presenter: Ms Thaingiyehtun, Ministry of Labour
Ms Thaingiyehtun began her presentation by giving a brief introduction of the statistical
information system of the Central Statistical Organization (CSO) of Myanmar. She stated
that the major surveys conducted by CSO were Household Income and Expenditure
Survey (HIES), Price Survey, National Mortality Survey and Manufacturing Survey for
Private Industry Zone. She further added that the CSO was also planning to conduct a
Private Sector Construction Survey (2013-2014), Mass Media Survey (2014-2015), a
20
Household Assets and Liabilities Survey (2014-2015) and an Informal Sector Survey
(2014-2015).
9.2. Alternative Sources For Decent Work Data: Experience of Papua New Guinea
Presenters: Mr Roko Koloma Vanua, National Statistics Office, Mr Geno Rua, Department
of Labour and Industrial Relations
Mr Vanua stated that In Papua New Guinea (PNG), labour data could be obtained from
other complementary surveys and censuses such as the Population and Housing Census,
the Demography and Health Survey, the Household Income and Expenditure Survey
(HIES), and the Agriculture Sample Survey.
However, he added that PNG had yet to conduct a national LFS. He also noted that data on
DW was important for the development of the country‟s poverty reduction strategy, and
for its employment policies. In addition, he noted that with the recent upturn in economic
activity in PNG fuelled by major investment projects (liquefied natural gas & mining in
particular) the need for a national Labour Market Information System (LMIS) was
becoming increasingly important for both government and investors alike. Hence, in this
regard, the NSO is planning to develop a strategy to develop statistics in PNG and conduct
an LFS –budgetary support depending- in the near future.
9.3. Design and Methodology of School to Work Transition Survey with Labour Market Indicators as well as Samoa Future Plans for Labour Statistics.
Presenters: Ms Taupisioletoga Faamau, Assistant Chief Executive Officer, Ministry of
Commerce Industries and Labour and Mr Ponifasio Vasa, Chief Programmer/Principal
Statistician, Samoa Bureau of Statistics
Ms Taupisioletoga Famau gave a brief overview of major surveys carried out in Samoa.
She stated that major surveys conducted in Samoa were the Household Income and
Expenditure Survey (HIES, in every 5 years), the Business and Activity Survey (every 3
years), the Demographic Health Survey (DHS, every 5 years), and the Labour Market
Survey and the Minimum Wage Survey.
Ms Famau then noted that the new Employment Relations Bill 2012 had recently been
enacted as a law. In addition, a national LFS project was now underway with technical and
financial support from the ILO and was planned for completion in 2015. She said that ILO
would assist the Ministry of Commerce, Industry and Labour Corporate in setting up the
centralized unit for the effective and efficient operation of a labour market information
system for employers and workers through their establishment survey.
21
10. Questionnaire Design For Decent Work Indicators: Labour Force And Other Household Surveys
Moderators: Mr Tite Habiyakare, ILO Bangkok and Sophia Lawrence, ILO Geneva
In this session, the participants were divided into three groups for group work exercise.
Each group was asked to examine from three national questionnaires and an ILO sample
questionnaire, specific questions pertaining to key decent work concepts [i.e. currently
employed, unemployed, and persons not in the labour force; informal employment; time
related underemployment working time and earnings], and determine which specific DWIs
could be derived from those questions. Where they thought certain DWIs could not be
calculated, groups were asked to propose modifications/amendments to the survey
questions, including supplementary probing questions, so as to capture the information
needed to derive the indicators.
Finally, participants were asked to recommend a possible “core” set of LFS questions for
each of the given decent work concepts, for a better measurement of the key DWIs and to
enhance comparability of surveys in the Asia-Pacific region. Each group was given 30
minutes to discuss their exercise and then was asked to present their results to the plenary.
Each group nominated one team leader and one presenter.
Below are the questions given to each group followed by the presentations:
10.1. Group A
Identification of persons currently employed, unemployed, and persons not in the labour
force: core questions for the two separate sections (example: Section A and Section G of
the ILO proposed individual questionnaire)
DWI: M-1, M-2, and M-3
The group first looked at the sample questionnaires and attempted to map the different
question formulations used to determine key employment indicators. They constructed a
matrix to show different questions used for measuring employment, unemployment and
person not in the labour force across different countries: the Philippines, Bangladesh,
Cambodia and Indonesia. From this, they sought to learn from each other. They concluded
that all questionnaires used would be able to derive the following key employment
indicators: -
Employment – to – population ratio
Unemployment rate
Youth not in education and not in employment
Informal employment
Labour force participation rate
Youth unemployment rate
Proportion of own-account workers and contributing family workers in total
employment

22
However, due to time constraint, the group was not able to come up with recommendations
on core LFS model questions for the Asia-Pacific region, but noted that this should be
work in progress spearheaded by ILO.
10.2. Group B
Characteristics of main job and informal employment: example from Section B of the ILO
proposed individual questionnaire.
DWI: M-4, M-8, M-9, M-10, M-11, M-13, and M-15
Group B approached the exercise differently than group A. They went through each of the
questions from the section B of the ILO proposed questionnaire and discussed about how
to get more information directly for policy making.
Also, based on the questionnaire, the group came up with the following indicators: -
a) Informal Employment
b) Child Labour
c) Stability & Security of Work
d) Proportion of Own account
e) Contributing family workers
f) Occupational Segregation by sex
g) Female share of employer
h) Paid leave & sick
i) Union density
10.3. Group C
Hours of work (example from Section D), Time related underemployment (example from
Section E of the ILO proposed individual questionnaire). This group also worked on
earnings questions, using examples from national LFS sample questions from countries
such as Bangladesh, Cambodia, Indonesia, Philippines, Thailand, etc.
On hours of work, the group looked at questions such as total working days and total
number of working hours of all jobs during the previous week. In measuring hours of
work, the group suggested on calculating normal working hours per day for each of the last
seven days on the basis that normal working hours varied in each country.
For time related underemployment, the group proposed the same questions as
recommended by the ILO, combined with information on the number of additional hours
being sought from a) current job held, b) additional job, and c) new job that would replace
original job in hours worked. They noted that all three of these must be outlined in the
questionnaire to make it clear, as per ILO recommendations.
As per earnings, the group said that in Indonesia, the LFS asked employees net salary per
month, whereas in the Philippines, the payment of wages was calculated on a daily basis.
23
Hence, whether wages are requested as gross or net varied across countries and also
payment of wages could vary in different countries.
Plenary discussion
Ms Sophia Lawrence of the ILO clarified the concept of normal working hours.
She noted that the concept was actually based on national legislation and it was a
set number of hours for a specific reference period. So, normal working hours, she
noted, was a good reference with which to establish a threshold for calculating
time related underemployment –and thus, to avoid capturing in the measurement
those stating themselves as underemployed who might actually be working
excessive hours already. Applying this concept, she added, is therefore a matter of
national interpretation (and may well differ across sectors within countries), but
there remain international guidelines for all working time concepts (set out by the
ILO – 18th ICLS, 2008).
In some sectors, particularly government service, “hours worked” are pre-specified
(they may also be set by collective agreements in the private sector), but may
differ in reality from that specification. In these cases, the ILO would therefore
recommend to ask questions such as „hours actually worked‟ day-by-day in the last
seven days as part of the labour force survey questionnaire (or equivalent
household-based survey) or the „hours usually worked‟ over a longer reference
period.
Also, in terms of calculating earnings, Ms Lawrence noted that as is the case in
most establishment surveys where we only obtain information on wage employees,
we are missing a large group of self-employed people. Therefore, the LFS, despite
its difficulties to obtain sensitive information, could be used for earnings from all
status in employment categories, countries should therefore take this into
consideration when preparing questions on earnings.

24
11. Strengthening Surveys, Building Labour Statistics Systems
Moderator: Ms Sophia Lawrence, ILO Geneva
11.1. Indonesian National Labour Force Survey
Presenter: Ms Krismawati, Head of Subdirectorate of Wages and Income
Ms Krismawati spoke about the development of the system of measuring labour statistics
in Indonesia over time. She mainly spoke about the history of the National Labour Force
Survey (SAKERNAS) and showed how SAKERNAS had evolved and improved over time
and that the data collection had become more frequent.
She noted that SAKERNAS had a household survey approach and collected mainly
employment data. Also, since 2011, SAKERNAS had been conducted on a quarterly basis
and was a key indicator of labour market. She further noted that the sample design for
survey planning had been redesigned recently to fit quarterly survey using 2010 Population
Census data.
Ms Krismawati also spoke about Indonesia‟s plan on improving the current state of
SAKERNAS. Regarding survey design, she noted that new sample design would be
evaluated and the quality and the relevance of quarterly statistics would be improved from
a more efficient sample design. Indonesia was also planning to provide training to
SAKERNAS officers and introduce Computer Assisted Personal Interviewer (CAPI) for
data collection. Furthermore, with regard to data processing, Indonesia planned to use
Information and Communications Technology (ICT) to improve timeliness, efficiency and
quality management.
11.2. Provincial Labour Force Survey Design And Development In The Philippines
Presenter: Mr Florante C. Varona, National Statistics Office
Mr Varona spoke about the design of the 2003 master sample. In the Philippines, the
National Statistics Office (NSO) had employed the concept of a master sample in the
design and conduct of its household surveys. A master sample is a sample from which
subsamples can be selected to serve the needs of different surveys. It promotes efficiency
on the use of limited resources and allows the linking of different survey variables.
He noted that the 2003 master sample would be used for a period of 10 years and so
sample elements should be replaced by a new set at certain points in time. He further said
that there was a need for a new master sample with provinces and highly urbanized cities
as major domains in order to generate provincial level estimates in response to the growing
demand for statistics, especially at the sub-national level. He also added that ILO/MAP
had already supported pilot LFS in Agusan Sur and Antique provinces. Lastly, Mr Varona
said that the Philippines Government was planning to conduct Provincial Labour Force
Survey starting 2014 and Provincial Family Income and Expenditure Survey in 2015.

25
11.3. Data Integration From The Administrative And Survey/ Census Data In Malaysia
Presenter: Mr Ab. Razak Othman, Senior Assistance Director, Institute of Labour Market
Analysis & Information, Ministry of Human Resources Division
Mr Othman stated that there are various sources of administrative data in Malaysia such as
data collected by the Ministry of Human Resources (MOHR), the Department of Statistics
(DOS), the Economic Planning Unit (EPU) and so on. In order to fully utilize the data
from these various sources, the MOHR as planning to collect data from multiple sources
and registers as opposed to collecting data from a single “best” source. He further noted
that the MOHR planned to augment survey and census data with administrative data from
government sources. Furthermore, it was planning to construct a data warehouse consisting
of sample representatives from the entire labour market and data cleansing, codification
and deployment of analysis and data mining tools.
11.4. Enhancing labour statistics for measuring decent work in Asia and the Pacific
Presenter: Ms Ruri Narita Artiesa, ASEAN Secretariat
Ms Artiesa began her presentation by providing a brief introduction of the ASEAN
community. Adding further, she noted that since 2000, the ASEAN Labour Ministers
(ALM) Work Programme had guided ASEAN‟s work on labour and human resources.
With ASEAN‟s labour force currently totalling 285 million, the bloc recognised the
importance of job creation, developing the quality of the workforce, and providing social
security to all workers regardless of their status and background. Furthermore, she added
that ASEAN had made a ground-breaking move to address the issue of migrant workers in
January 2007, when its Leaders signed the ASEAN Declaration on the Protection and
Promotion of the Rights of Migrant Workers. The Declaration mandates ASEAN countries
to promote equitable and appropriate employment protection, payment of wages, and
adequate access to decent working and living conditions for migrant workers.
Ms Artiesa also noted that one of the key ASEAN Socio Cultural Community (ASCC)
Blueprint‟s strategic objectives, envisioned for the implementation of the Roadmap for an
ASEAN Community (2009-2015), was to incorporate Decent Work Principles in to
ASEAN work culture (including workplace safety and health) and ensure that the
promotion of entrepreneurship becomes an integral part of the organisation‟s “forward
looking” labour market and employment policy. For this purpose, the ASEAN
Secretariat had come up with an ASCC Scorecard as a monitoring system of the ASCC
Blueprint's Strategic Objectives. She also mentioned that a list of scorecard indicators had
been prepared in consultation with the delegates from ASEAN member states, the
Secretariat and representatives from ILO, UNDP, UNESCAP, and UNWOMEN. Below is
the list of “scorecard” indicators under the strategic objective related to the promotion of
Decent Work: -
a) Employment-to- population ratio, 15 years and over
b) Unemployment rate
c) Low pay rate (below 2/3 median earning)
d) Excessive hours
e) Occupational injuries
26
f) Union density rate
Plenary Discussion
The participants commended Indonesia‟s efforts to collect labour force survey data
on a quarterly basis. The representatives of Indonesia said that employment data is
of specific strategic importance, since it was needed not only by government
policymakers but also the President himself. Hence, improving data quality is
politically very important, too. The representatives also added that as part of their
on-going improvements to the national statistical set-up, Indonesia would by 2015
move to a monthly SAKERNAS (labour force survey).
A participant from Bangladesh asked about the usefulness of collecting the
employment data on a quarterly –or even monthly- basis given the high costs
associated with the collection process. Mr Habiyakare of the ILO responded by
noting that in more developed economies in particular, people are gaining and
losing jobs on a daily basis, making the labour market highly dynamic and prone
to rapid adjustments. Therefore, collecting employment data more frequently
would give a more accurate national picture for continuous monitoring of
employment issues.
A representative from SAARC asked about the funding mechanisms of ASEAN.
The ASEAN representative responded by saying that ASEAN member states are
very active and ASEAN activities are funded through cost sharing of member
states.
Ms Sophia Lawrence of the ILO noted that in this globalized world, one needed to
coordinate and communicate and a lot can be learned from South- South
cooperation.
12. Analysing and Interpreting Decent Work Data for Policymaking
Presenter: Mr Nikolai Rogovsky, ILO Geneva
Mr Rogovsky introduced the ILO Knowledge Management Gateway to the participants.
He noted that the gateway was a one-stop access to country specific information on decent
work, aggregated by policy components and descriptors. He said that it would support the
wider knowledge management efforts of the ILO, as it would improve the accessibility and
usability of ILO databases and information sources. He added that the Gateway would
help answer the key question of what Decent Work policies work well and where, for all
countries to see. He also noted that the three main „pillars‟ of the Gateway are ILO-STAT
database, NORMLEX and Policy databases and Gateway had direct links to all them.
Adding further, he said that the Gateway would also contain various links beyond its three
„pillars‟; including reports and publications, evaluations, and the role of social partners.
The Gateway would benefit the ILO, its constituents and the public, as it would provide
user-friendly access to important policy-oriented information. It would also bridge the
information gap between the Headquarters, regional offices and country offices. Mr
Rogovsky also mentioned that as of now, the Gateway was running in prototype form only,
and that the ILO is aiming for it to cover up to 30 countries by 2015. Finally, he noted that
the Gateway was one way of exploring opportunities for involving constituents more
proactively in information provision and updating.
27
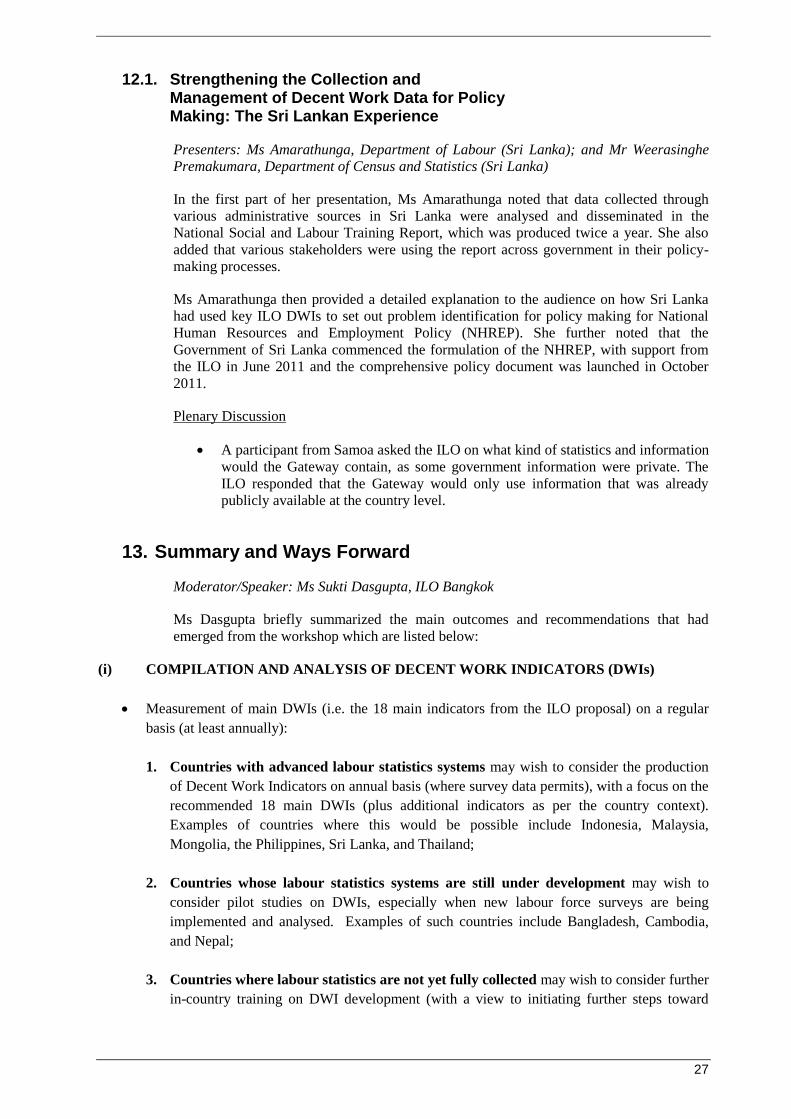
12.1. Strengthening the Collection and Management of Decent Work Data for Policy Making: The Sri Lankan Experience
Presenters: Ms Amarathunga, Department of Labour (Sri Lanka); and Mr Weerasinghe
Premakumara, Department of Census and Statistics (Sri Lanka)
In the first part of her presentation, Ms Amarathunga noted that data collected through
various administrative sources in Sri Lanka were analysed and disseminated in the
National Social and Labour Training Report, which was produced twice a year. She also
added that various stakeholders were using the report across government in their policy-
making processes.
Ms Amarathunga then provided a detailed explanation to the audience on how Sri Lanka
had used key ILO DWIs to set out problem identification for policy making for National
Human Resources and Employment Policy (NHREP). She further noted that the
Government of Sri Lanka commenced the formulation of the NHREP, with support from
the ILO in June 2011 and the comprehensive policy document was launched in October
2011.
Plenary Discussion
A participant from Samoa asked the ILO on what kind of statistics and information
would the Gateway contain, as some government information were private. The
ILO responded that the Gateway would only use information that was already
publicly available at the country level.
13. Summary and Ways Forward
Moderator/Speaker: Ms Sukti Dasgupta, ILO Bangkok
Ms Dasgupta briefly summarized the main outcomes and recommendations that had
emerged from the workshop which are listed below:
(i) COMPILATION AND ANALYSIS OF DECENT WORK INDICATORS (DWIs)
Measurement of main DWIs (i.e. the 18 main indicators from the ILO proposal) on a regular
basis (at least annually):
1. Countries with advanced labour statistics systems may wish to consider the production
of Decent Work Indicators on annual basis (where survey data permits), with a focus on the
recommended 18 main DWIs (plus additional indicators as per the country context).
Examples of countries where this would be possible include Indonesia, Malaysia,
Mongolia, the Philippines, Sri Lanka, and Thailand;
2. Countries whose labour statistics systems are still under development may wish to
consider pilot studies on DWIs, especially when new labour force surveys are being
implemented and analysed. Examples of such countries include Bangladesh, Cambodia,
and Nepal;
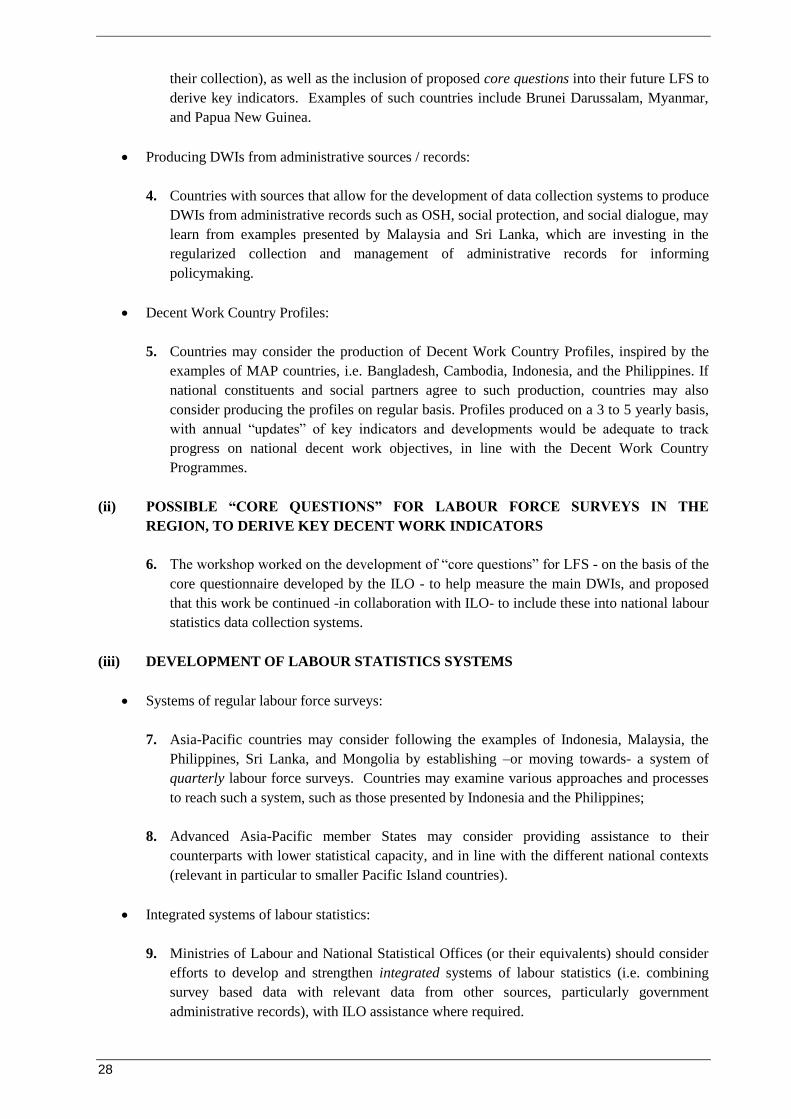
3. Countries where labour statistics are not yet fully collected may wish to consider further
in-country training on DWI development (with a view to initiating further steps toward
28
their collection), as well as the inclusion of proposed core questions into their future LFS to
derive key indicators. Examples of such countries include Brunei Darussalam, Myanmar,
and Papua New Guinea.
Producing DWIs from administrative sources / records:
4. Countries with sources that allow for the development of data collection systems to produce
DWIs from administrative records such as OSH, social protection, and social dialogue, may
learn from examples presented by Malaysia and Sri Lanka, which are investing in the
regularized collection and management of administrative records for informing
policymaking.
Decent Work Country Profiles:
5. Countries may consider the production of Decent Work Country Profiles, inspired by the
examples of MAP countries, i.e. Bangladesh, Cambodia, Indonesia, and the Philippines. If
national constituents and social partners agree to such production, countries may also
consider producing the profiles on regular basis. Profiles produced on a 3 to 5 yearly basis,
with annual “updates” of key indicators and developments would be adequate to track
progress on national decent work objectives, in line with the Decent Work Country
Programmes.
(ii) POSSIBLE “CORE QUESTIONS” FOR LABOUR FORCE SURVEYS IN THE
REGION, TO DERIVE KEY DECENT WORK INDICATORS
6. The workshop worked on the development of “core questions” for LFS - on the basis of the
core questionnaire developed by the ILO - to help measure the main DWIs, and proposed
that this work be continued -in collaboration with ILO- to include these into national labour
statistics data collection systems.
(iii) DEVELOPMENT OF LABOUR STATISTICS SYSTEMS
Systems of regular labour force surveys:
7. Asia-Pacific countries may consider following the examples of Indonesia, Malaysia, the
Philippines, Sri Lanka, and Mongolia by establishing –or moving towards- a system of
quarterly labour force surveys. Countries may examine various approaches and processes
to reach such a system, such as those presented by Indonesia and the Philippines;
8. Advanced Asia-Pacific member States may consider providing assistance to their
counterparts with lower statistical capacity, and in line with the different national contexts
(relevant in particular to smaller Pacific Island countries).
Integrated systems of labour statistics:
9. Ministries of Labour and National Statistical Offices (or their equivalents) should consider
efforts to develop and strengthen integrated systems of labour statistics (i.e. combining
survey based data with relevant data from other sources, particularly government
administrative records), with ILO assistance where required.

29
The role of regional bodies (ASEAN, SAARC, SPC):
10. Regional bodies such as the Association of Southeast Asian Nations (ASEAN), the South
Asian Association for Regional Cooperation (SAARC) and the Secretariat of the Pacific
Community (SPC) should consider supporting and promoting harmonization of labour
statistics and decent work indicators among member States.
11. Regional bodies should consider providing support to and advocate for integrated labour
statistics systems among their member States;
12. Regional bodies should consider supporting the development of a regional system of
statistical decent work indicators.
13. Regional bodies may also consider including the measurement of selected main decent
work indicators into their programme monitoring systems, in line with their labour related
priorities. ASEAN‟s recent experience with its recently developed “scorecard indicator”
system for the labour market may provide insights in this regard.
14. Regional bodies should consider promoting funding of labour statistics activities in member
States through cost-sharing and South-South cooperation mechanisms, with ILO assistance
if required.
The role of the ILO and social partners:
15. ILO social partners (employers‟ and workers‟ organizations) have a major role to play in
the development of functional labour statistics systems, and may produce statistics and
decent work indicators covering their work programme, particularly those on social
dialogue (trade union density and collective bargaining coverage). Social partners may also
consider supporting and promoting the production and harmonization of labour statistics
and indicators by all Asia-Pacific member States, as well as contributing to integrated
labour statistics systems at the national level;
16. ILO may consider expanding its capacity building programme in the Asia-Pacific region
toward the collection and enhancement of labour statistics, with a particular emphasis on
regular production of the main decent work indicators and related national assessments of
progress made towards decent work. ILO should also continue supporting regional
knowledge-sharing initiatives among Asia-Pacific member States; participants at this
workshop requested the ILO to advise a follow-up and sustainability strategy to the MAP
Project before its completion in 2013.
13.1. Closing Remarks
Ms Sophia Lawrence thanked all the participants and shared her conclusions of the
workshop. She suggested that participants think about the outcomes and recommendations
of the workshop and its link with policy making and development in their countries. She
said that, in Geneva, the main goal and mandate of ILO-STATISTICS was to enhance
labour statistics and in order to have a statistical system of programmes and indicators,
30
ILO would need to reinforce the capacity of countries at different levels of statistical
development.
She also noted the complexity of developing questionnaires for capturing DW elements
through LFS and further said that ILO-STATISTICS was also working on other sources of
statistics, as coherent data system is the one that draws from all sources. She also
highlighted the importance of administrative data to the participants and mentioned that
ILO-STATISTICS was also working on projects regarding a sources and methods
compilation for administrative data, and eventually on migrant labour statistics. She further
added that ILO Geneva was preparing for the next International Conference of Labour
Statisticians to be held in October 2013. Therefore also, in terms of sustainability of DW
indicators, she suggested the participants go back to their countries and brief their
governments on issues relating to the sustainability of data production; allowing their
governments to in turn share their concerns through the ICLS in Geneva.
Mr Rogovsky of ILO Geneva thanked the ILO Bangkok for organizing the workshop. He
highlighted the cultural and geographical diversity of Asia-Pacific region and noted the
importance of knowledge sharing in this region through these kinds of workshops. He also
talked about the links between data and policy and stressed that data should not only be
collected for the purpose of collecting but should be analysed and used for making policy
decisions. He also spoke about the Policy Integration Department website of the ILO and
said that that it contained a lot of information on Decent Work and also other areas of work
of the department. He also presented the new MAP project website including various
documents and reports on the experience gained from the MAP countries on the
measurement of decent work.
Mr Habiyakare of ILO Bangkok thanked all the participants and acknowledged the high
dynamic of the Region in the production of labour statistics, despite the persistent capacity
issues in certain countries. He acknowledged the participants who raised the issue on the
funding constraints in their countries in the area of measuring labour statistics, and
indicated the importance of national commitment in putting in place a sustainable labour
statistics system. He indicated that ILO‟s main role is on building the capacity of countries
in the collection and analysis of labour statistics, and that the ILO is not a funding agency.
He stressed that due to limited resources the ILO assistance is mostly demand-driven, with
priority on technical assistance given to selected countries where capacity is considered as
low; the aim is to ensure that all countries in the region are brought to certain similar levels
in the collection and dissemination of labour statistics. He further highlighted the role of
regional community and the role of social partners in developing and strengthening the
national statistical system.
Ms Dasgupta first of all thanked the representatives from ILO Geneva, Ms Sophia
Lawrence and Mr Nikolai Rogovsky for their time and contribution to the workshop. She
then thanked Mr Tite Habiyakare, Mr David Williams of ILO/MAP Bangkok for
successfully organizing this workshop. She then thanked all the participants for taking the
time out from their busy schedules back home and participating in this workshop.
She stressed the importance of data for informed policy making. She provided an example
of Cambodia where the government had requested the ILO to conduct the national LFS
after 11 years because it lacked labour market data in order to design an employment
policy. She also recommended that the participants brief their governments and
constituents back home on the sustainability of statistical systems so they can raise their
concerns in Geneva.
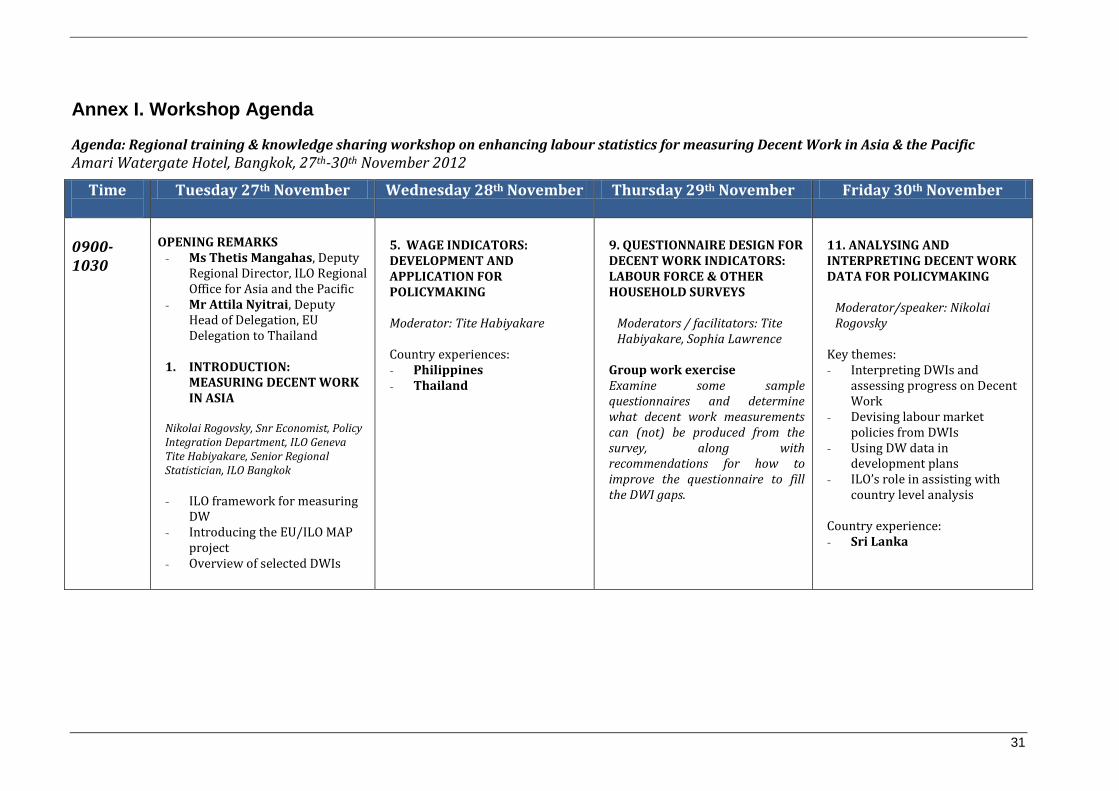
31
Annex I. Workshop Agenda
Agenda: Regional training & knowledge sharing workshop on enhancing labour statistics for measuring Decent Work in Asia & the Pacific
Amari Watergate Hotel, Bangkok, 27th-30th November 2012
Time
Tuesday 27th November Wednesday 28th November Thursday 29th November Friday 30th November
0900-1030
OPENING REMARKS
- Ms Thetis Mangahas, Deputy Regional Director, ILO Regional Office for Asia and the Pacific
- Mr Attila Nyitrai, Deputy Head of Delegation, EU Delegation to Thailand
1. INTRODUCTION:
MEASURING DECENT WORK IN ASIA
Nikolai Rogovsky, Snr Economist, Policy Integration Department, ILO Geneva Tite Habiyakare, Senior Regional Statistician, ILO Bangkok
- ILO framework for measuring
DW - Introducing the EU/ILO MAP
project - Overview of selected DWIs
5. WAGE INDICATORS: DEVELOPMENT AND APPLICATION FOR POLICYMAKING Moderator: Tite Habiyakare
Country experiences: - Philippines - Thailand
9. QUESTIONNAIRE DESIGN FOR DECENT WORK INDICATORS: LABOUR FORCE & OTHER HOUSEHOLD SURVEYS
Moderators / facilitators: Tite Habiyakare, Sophia Lawrence
Group work exercise Examine some sample questionnaires and determine what decent work measurements can (not) be produced from the survey, along with recommendations for how to improve the questionnaire to fill the DWI gaps.
11. ANALYSING AND INTERPRETING DECENT WORK DATA FOR POLICYMAKING
Moderator/speaker: Nikolai Rogovsky
Key themes: - Interpreting DWIs and
assessing progress on Decent Work
- Devising labour market policies from DWIs
- Using DW data in development plans
- ILO’s role in assisting with country level analysis
Country experience: - Sri Lanka
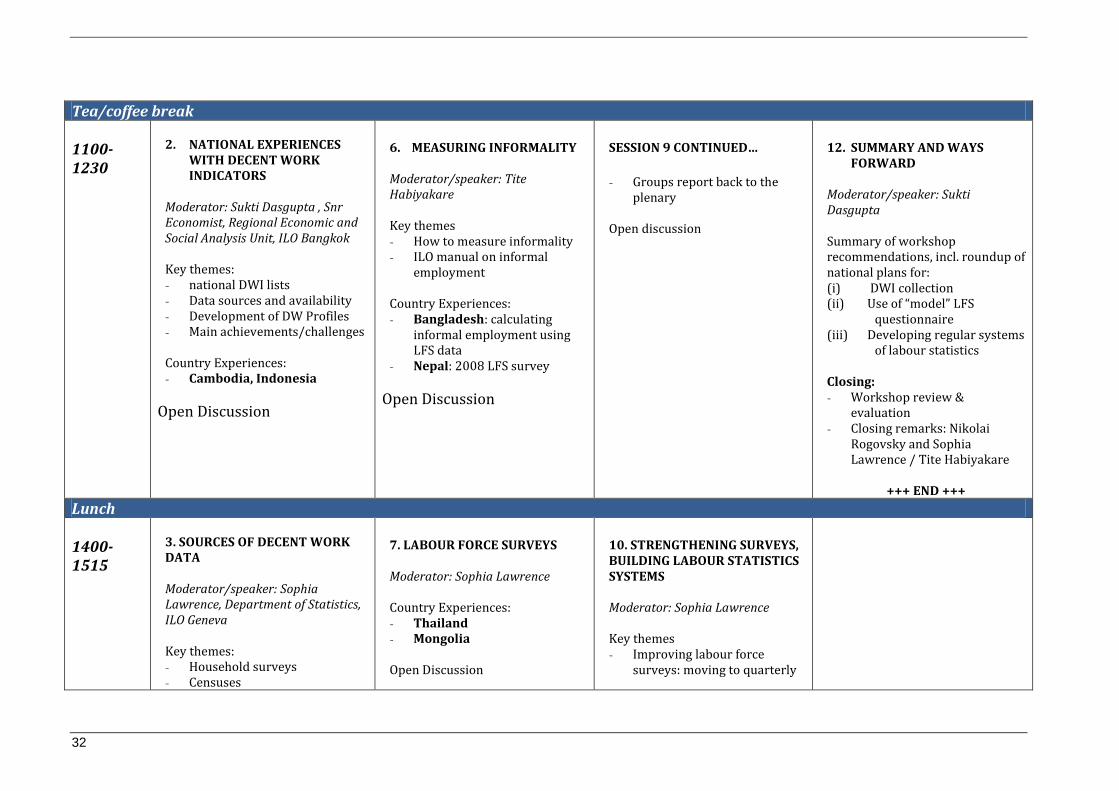
32
Tea/coffee break 1100-1230
2. NATIONAL EXPERIENCES
WITH DECENT WORK INDICATORS
Moderator: Sukti Dasgupta , Snr Economist, Regional Economic and Social Analysis Unit, ILO Bangkok Key themes: - national DWI lists - Data sources and availability - Development of DW Profiles - Main achievements/challenges Country Experiences: - Cambodia, Indonesia
Open Discussion
6. MEASURING INFORMALITY Moderator/speaker: Tite Habiyakare Key themes - How to measure informality - ILO manual on informal
employment Country Experiences: - Bangladesh: calculating
informal employment using LFS data
- Nepal: 2008 LFS survey
Open Discussion
SESSION 9 CONTINUED…
- Groups report back to the
plenary Open discussion
12. SUMMARY AND WAYS
FORWARD Moderator/speaker: Sukti Dasgupta Summary of workshop recommendations, incl. roundup of national plans for: (i) DWI collection (ii) Use of “model” LFS
questionnaire (iii) Developing regular systems
of labour statistics Closing: - Workshop review &
evaluation - Closing remarks: Nikolai
Rogovsky and Sophia Lawrence / Tite Habiyakare
+++ END +++
Lunch 1400-1515
3. SOURCES OF DECENT WORK DATA Moderator/speaker: Sophia Lawrence, Department of Statistics, ILO Geneva Key themes: - Household surveys - Censuses
7. LABOUR FORCE SURVEYS Moderator: Sophia Lawrence Country Experiences: - Thailand - Mongolia Open Discussion
10. STRENGTHENING SURVEYS, BUILDING LABOUR STATISTICS SYSTEMS Moderator: Sophia Lawrence Key themes - Improving labour force
surveys: moving to quarterly

33
- Establishment Surveys - Administrative records Open Discussion
/ provincial level data collection
Country experiences: - Indonesia, Philippines Open Discussion
Tea/coffee break 1545-1700
4. COLLECTING DECENT WORK DATA FROM ADMINISTRATIVE RECORDS Moderator: Tite Habiyakare Key themes: - How to collect administrative
data: challenges and strategies - Country experience: Sri Lanka
Open Discussion
1800hrs – Welcome Reception @ 8th floor garden
8. COMPLEMENTARY SURVEYS FOR DECENT WORK DATA Moderator: Nikolai Rogovsky Country Experiences: - Myanmar - Papua New Guinea - Samoa Open Discussion
SESSION 10 CONTINUED… Key themes - Developing integrated
databases of labour statistics
National/regional experiences: - Indonesia - Malaysia - ASEAN: Developing common
labour indicators for member states
Open Discussion
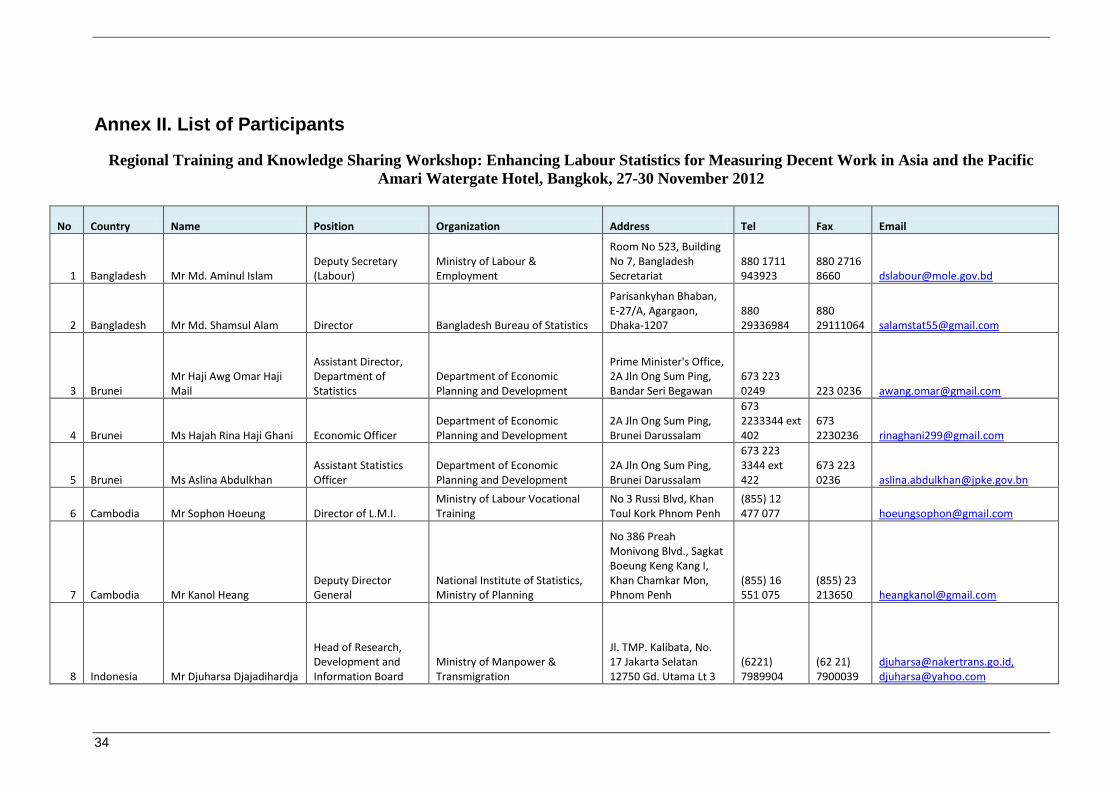
34
Annex II. List of Participants
Regional Training and Knowledge Sharing Workshop: Enhancing Labour Statistics for Measuring Decent Work in Asia and the Pacific
Amari Watergate Hotel, Bangkok, 27-30 November 2012
No Country Name Position Organization Address Tel Fax Email
1 Bangladesh Mr Md. Aminul Islam Deputy Secretary (Labour)
Ministry of Labour & Employment
Room No 523, Building No 7, Bangladesh Secretariat
880 1711 943923
880 2716 8660 [email protected]
2 Bangladesh Mr Md. Shamsul Alam Director Bangladesh Bureau of Statistics
Parisankyhan Bhaban, E-27/A, Agargaon, Dhaka-1207
880 29336984
880 29111064 [email protected]
3 Brunei Mr Haji Awg Omar Haji Mail
Assistant Director, Department of Statistics
Department of Economic Planning and Development
Prime Minister's Office, 2A Jln Ong Sum Ping, Bandar Seri Begawan
673 223 0249 223 0236 [email protected]
4 Brunei Ms Hajah Rina Haji Ghani Economic Officer Department of Economic Planning and Development
2A Jln Ong Sum Ping, Brunei Darussalam
673 2233344 ext 402
673 2230236 [email protected]
5 Brunei Ms Aslina Abdulkhan Assistant Statistics Officer
Department of Economic Planning and Development
2A Jln Ong Sum Ping, Brunei Darussalam
673 223 3344 ext 422
673 223 0236 [email protected]
6 Cambodia Mr Sophon Hoeung Director of L.M.I. Ministry of Labour Vocational Training
No 3 Russi Blvd, Khan Toul Kork Phnom Penh
(855) 12 477 077 [email protected]
7 Cambodia Mr Kanol Heang Deputy Director General
National Institute of Statistics, Ministry of Planning
No 386 Preah Monivong Blvd., Sagkat Boeung Keng Kang I, Khan Chamkar Mon, Phnom Penh
(855) 16 551 075
(855) 23 213650 [email protected]
8 Indonesia Mr Djuharsa Djajadihardja
Head of Research, Development and Information Board
Ministry of Manpower & Transmigration
Jl. TMP. Kalibata, No. 17 Jakarta Selatan 12750 Gd. Utama Lt 3
(6221) 7989904
(62 21) 7900039
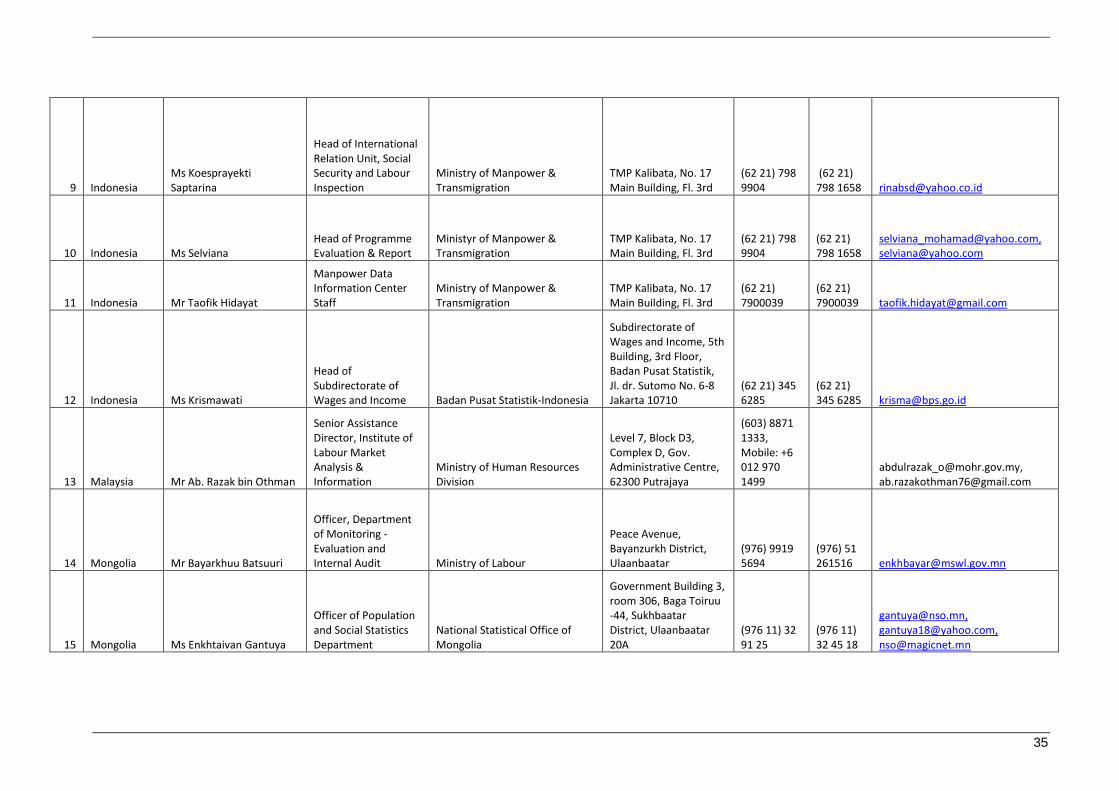
35
9 Indonesia Ms Koesprayekti Saptarina
Head of International Relation Unit, Social Security and Labour Inspection
Ministry of Manpower & Transmigration
TMP Kalibata, No. 17 Main Building, Fl. 3rd
(62 21) 798 9904
(62 21) 798 1658 [email protected]
10 Indonesia Ms Selviana Head of Programme Evaluation & Report
Ministyr of Manpower & Transmigration
TMP Kalibata, No. 17 Main Building, Fl. 3rd
(62 21) 798 9904
(62 21) 798 1658
[email protected], [email protected]
11 Indonesia Mr Taofik Hidayat
Manpower Data Information Center Staff
Ministry of Manpower & Transmigration
TMP Kalibata, No. 17 Main Building, Fl. 3rd
(62 21) 7900039
(62 21) 7900039 [email protected]
12 Indonesia Ms Krismawati
Head of Subdirectorate of Wages and Income Badan Pusat Statistik-Indonesia
Subdirectorate of Wages and Income, 5th Building, 3rd Floor, Badan Pusat Statistik, Jl. dr. Sutomo No. 6-8 Jakarta 10710
(62 21) 345 6285
(62 21) 345 6285 [email protected]
13 Malaysia Mr Ab. Razak bin Othman
Senior Assistance Director, Institute of Labour Market Analysis & Information
Ministry of Human Resources Division
Level 7, Block D3, Complex D, Gov. Administrative Centre, 62300 Putrajaya
(603) 8871 1333, Mobile: +6 012 970 1499
[email protected], [email protected]
14 Mongolia Mr Bayarkhuu Batsuuri
Officer, Department of Monitoring -Evaluation and Internal Audit Ministry of Labour
Peace Avenue, Bayanzurkh District, Ulaanbaatar
(976) 9919 5694
(976) 51 261516 [email protected]
15 Mongolia Ms Enkhtaivan Gantuya
Officer of Population and Social Statistics Department
National Statistical Office of Mongolia
Government Building 3, room 306, Baga Toiruu -44, Sukhbaatar District, Ulaanbaatar 20A
(976 11) 32 91 25
(976 11) 32 45 18
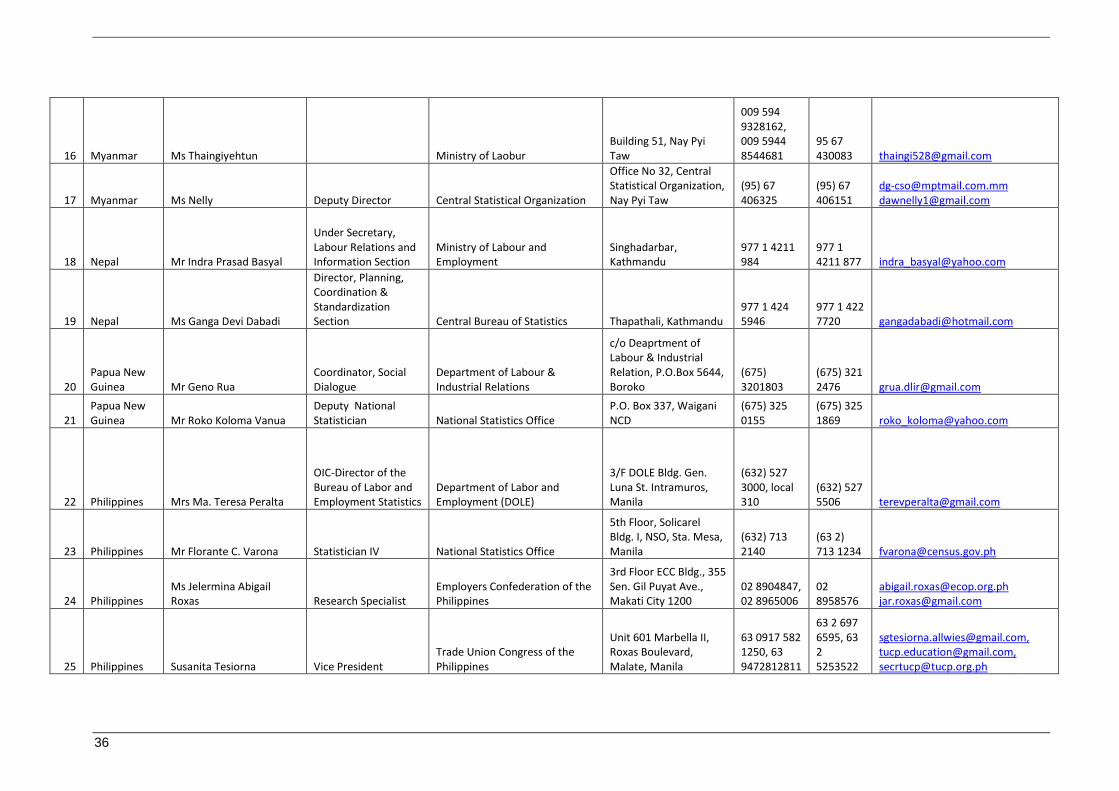
36
16 Myanmar Ms Thaingiyehtun Ministry of Laobur Building 51, Nay Pyi Taw
009 594 9328162, 009 5944 8544681
95 67 430083 [email protected]
17 Myanmar Ms Nelly Deputy Director Central Statistical Organization
Office No 32, Central Statistical Organization, Nay Pyi Taw
(95) 67 406325
(95) 67 406151
[email protected] [email protected]
18 Nepal Mr Indra Prasad Basyal
Under Secretary, Labour Relations and Information Section
Ministry of Labour and Employment
Singhadarbar, Kathmandu
977 1 4211 984
977 1 4211 877 [email protected]
19 Nepal Ms Ganga Devi Dabadi
Director, Planning, Coordination & Standardization Section Central Bureau of Statistics Thapathali, Kathmandu
977 1 424 5946
977 1 422 7720 [email protected]
20 Papua New Guinea Mr Geno Rua
Coordinator, Social Dialogue
Department of Labour & Industrial Relations
c/o Deaprtment of Labour & Industrial Relation, P.O.Box 5644, Boroko
(675) 3201803
(675) 321 2476 [email protected]
21 Papua New Guinea Mr Roko Koloma Vanua
Deputy National Statistician National Statistics Office
P.O. Box 337, Waigani NCD
(675) 325 0155
(675) 325 1869 [email protected]
22 Philippines Mrs Ma. Teresa Peralta
OIC-Director of the Bureau of Labor and Employment Statistics
Department of Labor and Employment (DOLE)
3/F DOLE Bldg. Gen. Luna St. Intramuros, Manila
(632) 527 3000, local 310
(632) 527 5506 [email protected]
23 Philippines Mr Florante C. Varona Statistician IV National Statistics Office
5th Floor, Solicarel Bldg. I, NSO, Sta. Mesa, Manila
(632) 713 2140
(63 2) 713 1234 [email protected]
24 Philippines Ms Jelermina Abigail Roxas Research Specialist
Employers Confederation of the Philippines
3rd Floor ECC Bldg., 355 Sen. Gil Puyat Ave., Makati City 1200
02 8904847, 02 8965006
02 8958576
[email protected] [email protected]
25 Philippines Susanita Tesiorna Vice President Trade Union Congress of the Philippines
Unit 601 Marbella II, Roxas Boulevard, Malate, Manila
63 0917 582 1250, 63 9472812811
63 2 697 6595, 63 2 5253522
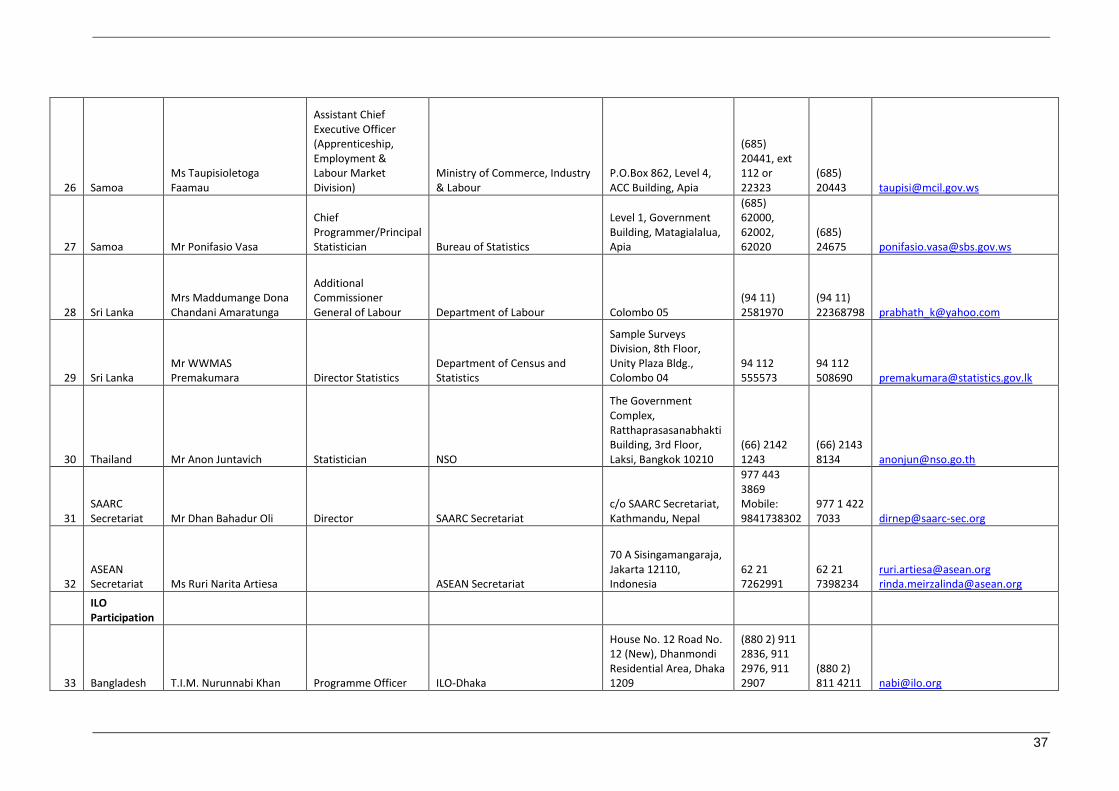
37
26 Samoa Ms Taupisioletoga Faamau
Assistant Chief Executive Officer (Apprenticeship, Employment & Labour Market Division)
Ministry of Commerce, Industry & Labour
P.O.Box 862, Level 4, ACC Building, Apia
(685) 20441, ext 112 or 22323
(685) 20443 [email protected]
27 Samoa Mr Ponifasio Vasa
Chief Programmer/Principal Statistician Bureau of Statistics
Level 1, Government Building, Matagialalua, Apia
(685) 62000, 62002, 62020
(685) 24675 [email protected]
28 Sri Lanka Mrs Maddumange Dona Chandani Amaratunga
Additional Commissioner General of Labour Department of Labour Colombo 05
(94 11) 2581970
(94 11) 22368798 [email protected]
29 Sri Lanka Mr WWMAS Premakumara Director Statistics
Department of Census and Statistics
Sample Surveys Division, 8th Floor, Unity Plaza Bldg., Colombo 04
94 112 555573
94 112 508690 [email protected]
30 Thailand Mr Anon Juntavich Statistician NSO
The Government Complex, Ratthaprasasanabhakti Building, 3rd Floor, Laksi, Bangkok 10210
(66) 2142 1243
(66) 2143 8134 [email protected]
31 SAARC Secretariat Mr Dhan Bahadur Oli Director SAARC Secretariat
c/o SAARC Secretariat, Kathmandu, Nepal
977 443 3869 Mobile: 9841738302
977 1 422 7033 [email protected]
32 ASEAN Secretariat Ms Ruri Narita Artiesa ASEAN Secretariat
70 A Sisingamangaraja, Jakarta 12110, Indonesia
62 21 7262991
62 21 7398234
[email protected] [email protected]
ILO Participation
33 Bangladesh T.I.M. Nurunnabi Khan Programme Officer ILO-Dhaka
House No. 12 Road No. 12 (New), Dhanmondi Residential Area, Dhaka 1209
(880 2) 911 2836, 911 2976, 911 2907
(880 2) 811 4211 [email protected]

38
34 Cambodia Tun Sophorn National Coordinator ILO-Phnom Penh
Phnom Penh Center, Building F, 2nd Floor, Corner Sihanouk (274) and Sothearos (3) Boulevard, Chamcamorn
(855 23) 220817
(855 23) 221 536 [email protected]
35 Philippines Lourdes Kathleen Santos
Programme Assistant (Employment Promotion) ILO-Manila
19th Floor, Yuchengco Tower, RCBC Plaza 6819 Ayala Avenue, Makati City 1200
(632) 580 9900, 580 9901-2
(63 2) 856 7597 [email protected]
Resource Persons
36 Switzerland Nikolai Rogovsky Senior Economist INTEGRATION, ILO-Geneva CH-1211, Geneva 22 (41 22) 799 6116
(41 22) 799 8451 [email protected]
37 Switzerland Sophia Lawrence Statistician STATISTICS, ILO-Geneva CH-1211, Geneva 22 (41 22) 799 6384
(41 22) 799 6957 [email protected]
Consultants
38 Nepal Ms Pooja Pokhrel Report Writer [email protected]
EU
39 Thailand Mr Attila Nyitrai Deputy Head of Delegation
Delegation of the European Union to Thailand
Kian Gwan House II, 19th Floor, 140/1 Wireless Road; Bangkok 10330 (66 2) 305
2600 (66 2) 305 9113 [email protected]
40 Thailand Mr Luca Pierantoni Attache (Cooperation)
Delegation of the European Union to Thailand
Kian Gwan House II, 19th Floor, 140/1 Wireless Road; Bangkok 10330
(66 2) 305 2600
(66 2) 305 9113 [email protected]
ILO Bangkok
41 Thailand Thetis Mangahas Deputy Regional Director ILO-Bangkok
c/o United Nations Building, Rajdamnern Nok Avenue, Bangkok 10200
(66 2) 288 1722
(66 2) 288 1076 [email protected]

39
42 Thailand Ms Sukti Dasgupta Senior Economist ILO-Bangkok
c/o United Nations Building, Rajdamnern Nok Avenue, Bangkok 10200
(66 2) 288 1792
(66 2) 288 1076 [email protected]
43 Thailand Mr Tite Habiyakare Regional Labour Statistician ILO-Bangkok
c/o United Nations Building, Rajdamnern Nok Avenue, Bangkok 10200
(66 2) 288 2246
(66 2) 288 1076 [email protected]
44 Thailand Mr David Williams Labour Market Information Officer ILO-Bangkok
c/o United Nations Building, Rajdamnern Nok Avenue, Bangkok 10200
(66 2) 288 1459
(66 2) 288 1076 [email protected]
45 Thailand Ms Rakawin Leechanavanichpan Programme Officer ILO-Bangkok
c/o United Nations Building, Rajdamnern Nok Avenue, Bangkok 10200
(66 2) 288 1732
(66 2) 288 1076 [email protected]
46 Thailand Mr Marko Stermsek Intern ILO-Bangkok
c/o United Nations Building, Rajdamnern Nok Avenue, Bangkok 10200
(66 2) 288 1076 [email protected]
47 Thailand Mr Tiraphap Fakthong Intern ILO-Bangkok
c/o United Nations Building, Rajdamnern Nok Avenue, Bangkok 10200
(66 2) 288 1076 [email protected]
48 Thailand Ms Monrudee Sucharitakul Senior Secretary ILO-Bangkok
c/o United Nations Building, Rajdamnern Nok Avenue, Bangkok 10200
(66 2) 288 2277
(66 2) 288 1076 [email protected]
49 Thailand Ms Sarah McLeish Intern DWT-Bangkok
c/o United Nations Building, Rajdamnern Nok Avenue, Bangkok 10200
(66 2) 288 1076 [email protected]

40
Annex III. Summary of Participant Evaluations
Total number of participants = 36

41
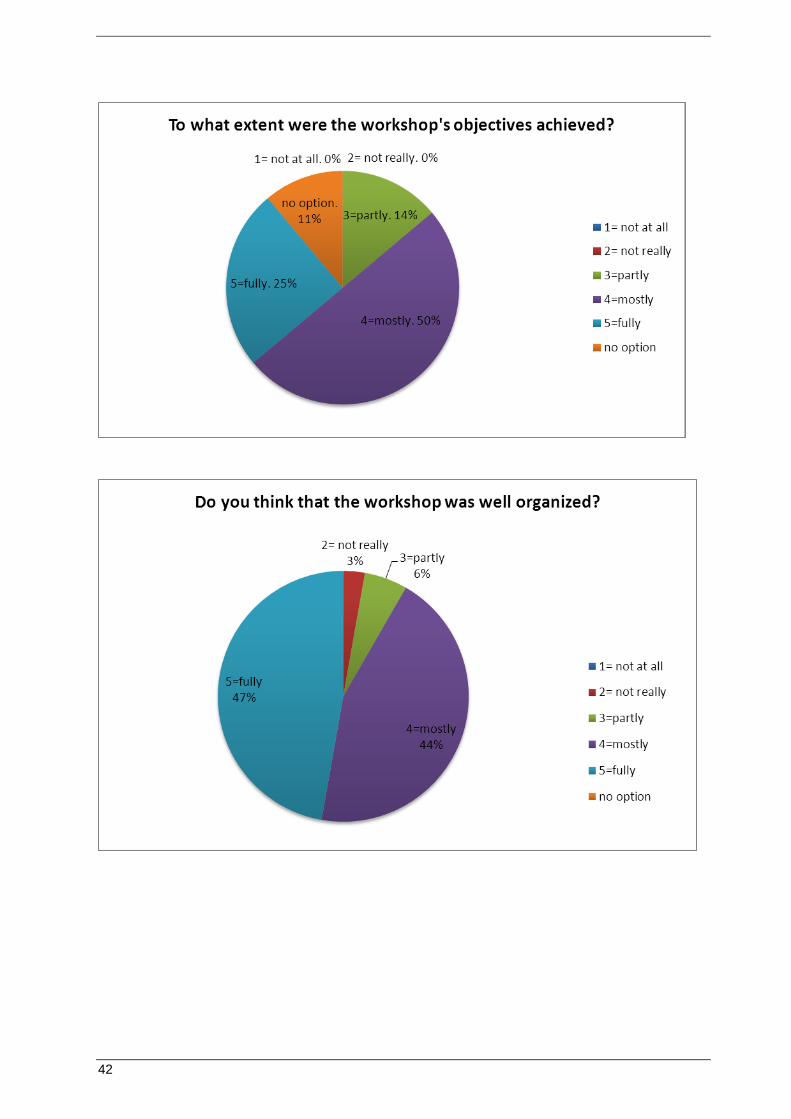
42
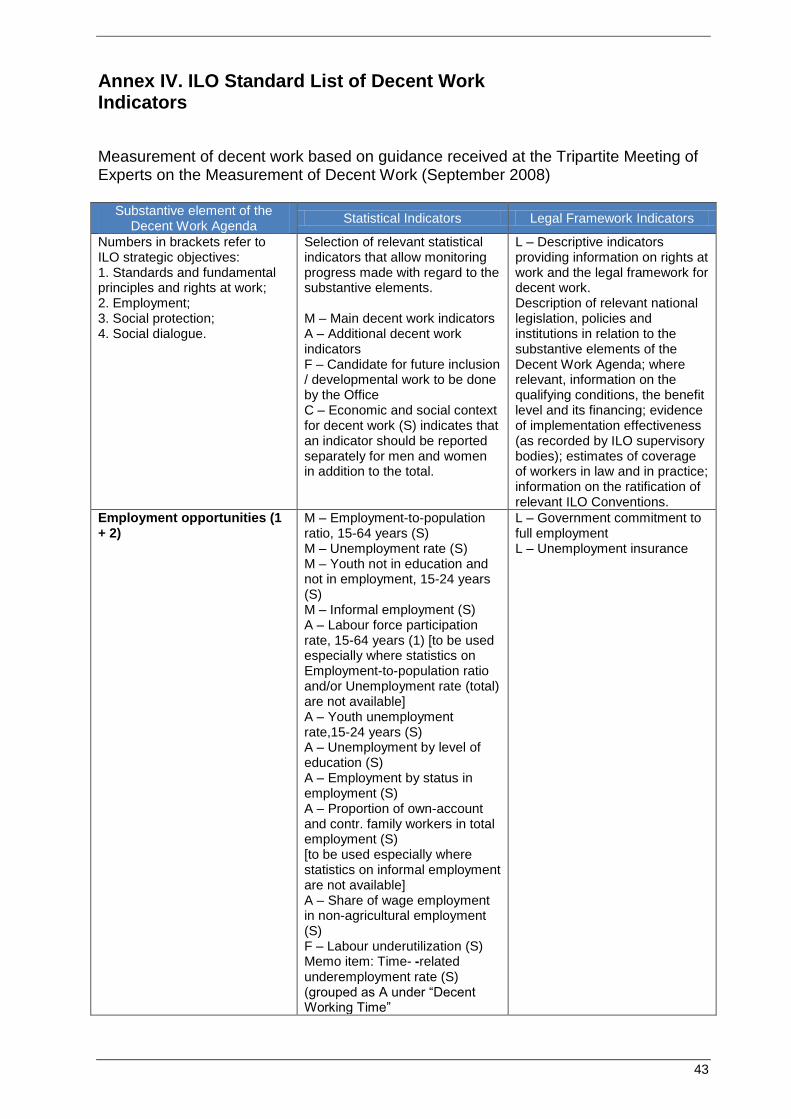
43
Annex IV. ILO Standard List of Decent Work Indicators
Measurement of decent work based on guidance received at the Tripartite Meeting of Experts on the Measurement of Decent Work (September 2008)
Substantive element of the Decent Work Agenda
Statistical Indicators Legal Framework Indicators
Numbers in brackets refer to ILO strategic objectives: 1. Standards and fundamental principles and rights at work; 2. Employment; 3. Social protection; 4. Social dialogue.
Selection of relevant statistical indicators that allow monitoring progress made with regard to the substantive elements. M – Main decent work indicators A – Additional decent work indicators F – Candidate for future inclusion / developmental work to be done by the Office C – Economic and social context for decent work (S) indicates that an indicator should be reported separately for men and women in addition to the total.
L – Descriptive indicators providing information on rights at work and the legal framework for decent work. Description of relevant national legislation, policies and institutions in relation to the substantive elements of the Decent Work Agenda; where relevant, information on the qualifying conditions, the benefit level and its financing; evidence of implementation effectiveness (as recorded by ILO supervisory bodies); estimates of coverage of workers in law and in practice; information on the ratification of relevant ILO Conventions.
Employment opportunities (1 + 2)
M – Employment-to-population ratio, 15-64 years (S) M – Unemployment rate (S) M – Youth not in education and not in employment, 15-24 years (S) M – Informal employment (S) A – Labour force participation rate, 15-64 years (1) [to be used especially where statistics on Employment-to-population ratio and/or Unemployment rate (total) are not available] A – Youth unemployment rate,15-24 years (S) A – Unemployment by level of education (S) A – Employment by status in employment (S) A – Proportion of own-account and contr. family workers in total employment (S) [to be used especially where statistics on informal employment are not available] A – Share of wage employment in non-agricultural employment (S) F – Labour underutilization (S) Memo item: Time- -related underemployment rate (S) (grouped as A under “Decent Working Time”
L – Government commitment to full employment L – Unemployment insurance
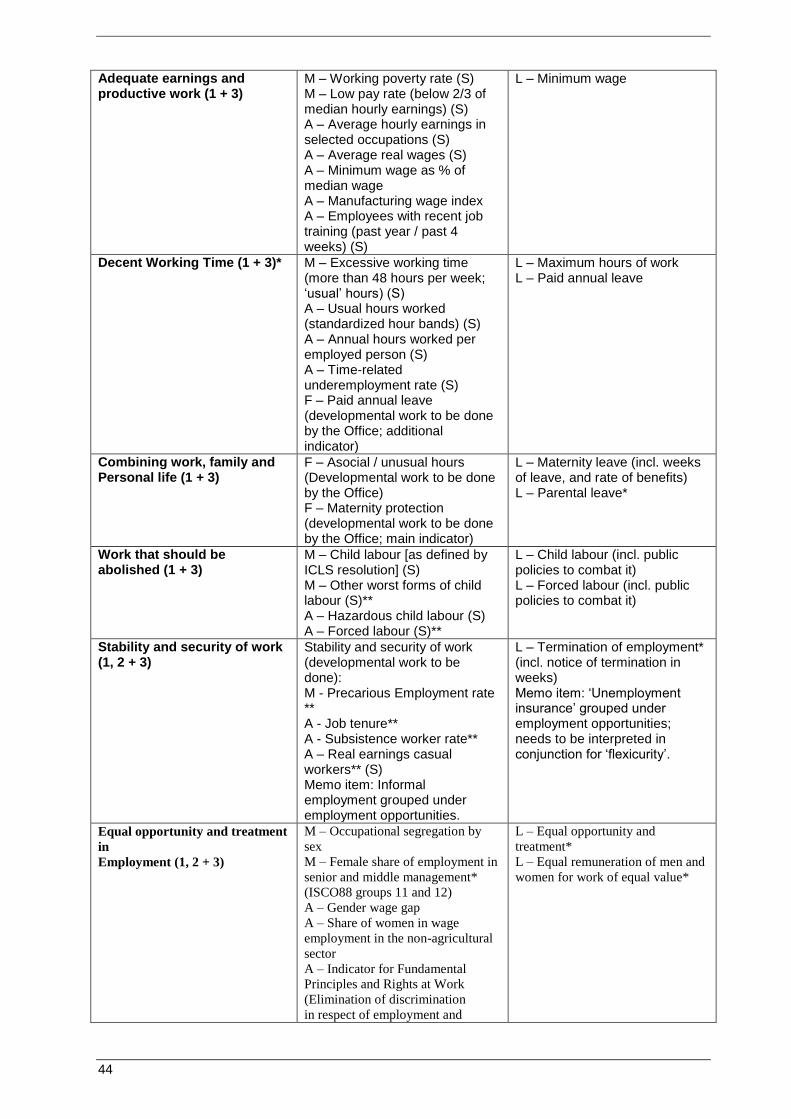
44
Adequate earnings and productive work (1 + 3)
M – Working poverty rate (S) M – Low pay rate (below 2/3 of median hourly earnings) (S) A – Average hourly earnings in selected occupations (S) A – Average real wages (S) A – Minimum wage as % of median wage A – Manufacturing wage index A – Employees with recent job training (past year / past 4 weeks) (S)
L – Minimum wage
Decent Working Time (1 + 3)* M – Excessive working time (more than 48 hours per week; „usual‟ hours) (S) A – Usual hours worked (standardized hour bands) (S) A – Annual hours worked per employed person (S) A – Time-related underemployment rate (S) F – Paid annual leave (developmental work to be done by the Office; additional indicator)
L – Maximum hours of work L – Paid annual leave
Combining work, family and Personal life (1 + 3)
F – Asocial / unusual hours (Developmental work to be done by the Office) F – Maternity protection (developmental work to be done by the Office; main indicator)
L – Maternity leave (incl. weeks of leave, and rate of benefits) L – Parental leave*
Work that should be abolished (1 + 3)
M – Child labour [as defined by ICLS resolution] (S) M – Other worst forms of child labour (S)** A – Hazardous child labour (S) A – Forced labour (S)**
L – Child labour (incl. public policies to combat it) L – Forced labour (incl. public policies to combat it)
Stability and security of work (1, 2 + 3)
Stability and security of work (developmental work to be done): M - Precarious Employment rate ** A - Job tenure** A - Subsistence worker rate** A – Real earnings casual workers** (S) Memo item: Informal employment grouped under employment opportunities.
L – Termination of employment* (incl. notice of termination in weeks) Memo item: „Unemployment insurance‟ grouped under employment opportunities; needs to be interpreted in conjunction for „flexicurity‟.
Equal opportunity and treatment
in
Employment (1, 2 + 3)
M – Occupational segregation by
sex
M – Female share of employment in
senior and middle management*
(ISCO88 groups 11 and 12)
A – Gender wage gap
A – Share of women in wage
employment in the non-agricultural
sector
A – Indicator for Fundamental
Principles and Rights at Work
(Elimination of discrimination
in respect of employment and
L – Equal opportunity and
treatment*
L – Equal remuneration of men and
women for work of equal value*
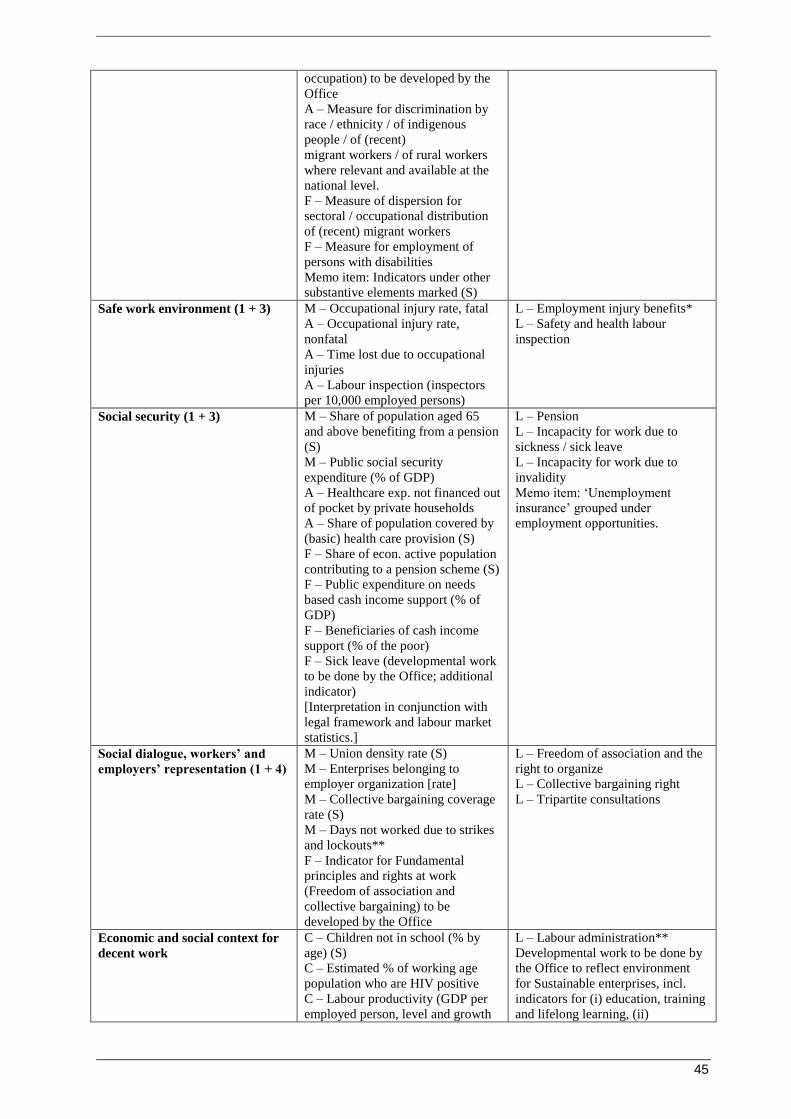
45
occupation) to be developed by the
Office
A – Measure for discrimination by
race / ethnicity / of indigenous
people / of (recent)
migrant workers / of rural workers
where relevant and available at the
national level.
F – Measure of dispersion for
sectoral / occupational distribution
of (recent) migrant workers
F – Measure for employment of
persons with disabilities
Memo item: Indicators under other
substantive elements marked (S)
Safe work environment (1 + 3) M – Occupational injury rate, fatal
A – Occupational injury rate,
nonfatal
A – Time lost due to occupational
injuries
A – Labour inspection (inspectors
per 10,000 employed persons)
L – Employment injury benefits*
L – Safety and health labour
inspection
Social security (1 + 3) M – Share of population aged 65
and above benefiting from a pension
(S)
M – Public social security
expenditure (% of GDP)
A – Healthcare exp. not financed out
of pocket by private households
A – Share of population covered by
(basic) health care provision (S)
F – Share of econ. active population
contributing to a pension scheme (S)
F – Public expenditure on needs
based cash income support (% of
GDP)
F – Beneficiaries of cash income
support (% of the poor)
F – Sick leave (developmental work
to be done by the Office; additional
indicator)
[Interpretation in conjunction with
legal framework and labour market
statistics.]
L – Pension
L – Incapacity for work due to
sickness / sick leave
L – Incapacity for work due to
invalidity
Memo item: „Unemployment
insurance‟ grouped under
employment opportunities.
Social dialogue, workers’ and
employers’ representation (1 + 4)
M – Union density rate (S)
M – Enterprises belonging to
employer organization [rate]
M – Collective bargaining coverage
rate (S)
M – Days not worked due to strikes
and lockouts**
F – Indicator for Fundamental
principles and rights at work
(Freedom of association and
collective bargaining) to be
developed by the Office
L – Freedom of association and the
right to organize
L – Collective bargaining right
L – Tripartite consultations
Economic and social context for
decent work
C – Children not in school (% by
age) (S)
C – Estimated % of working age
population who are HIV positive
C – Labour productivity (GDP per
employed person, level and growth
L – Labour administration**
Developmental work to be done by
the Office to reflect environment
for Sustainable enterprises, incl.
indicators for (i) education, training
and lifelong learning, (ii)
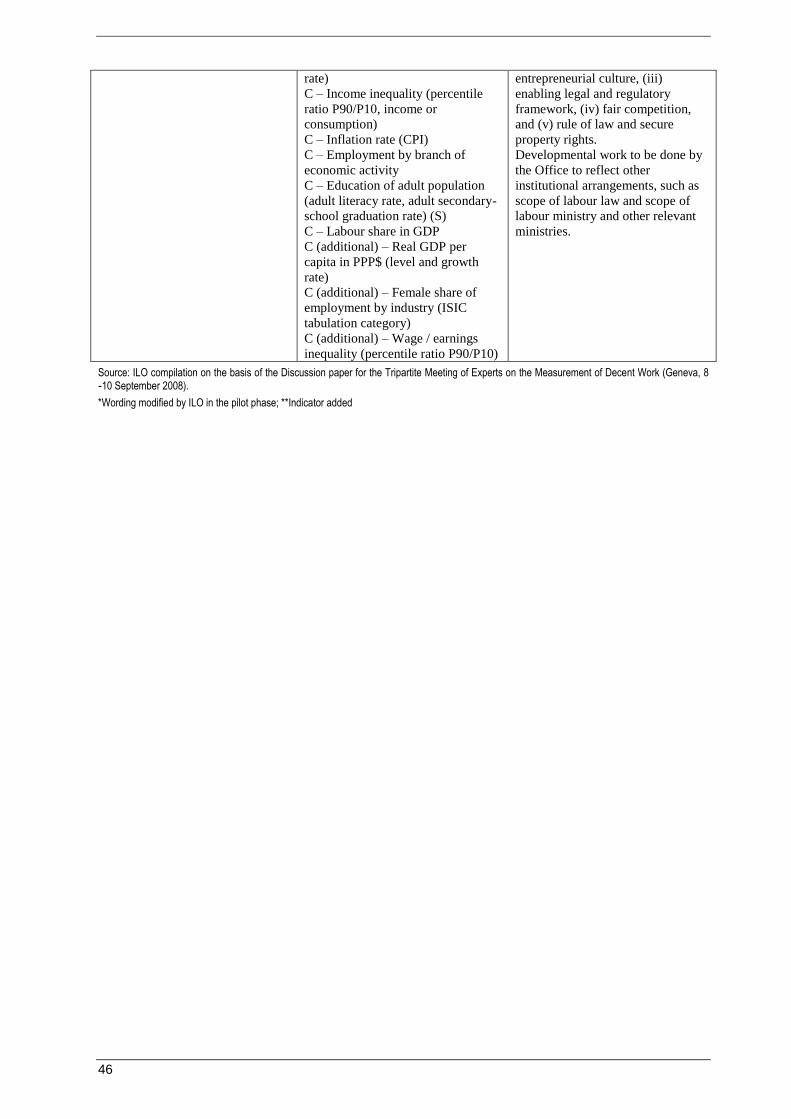
46
rate)
C – Income inequality (percentile
ratio P90/P10, income or
consumption)
C – Inflation rate (CPI)
C – Employment by branch of
economic activity
C – Education of adult population
(adult literacy rate, adult secondary-
school graduation rate) (S)
C – Labour share in GDP
C (additional) – Real GDP per
capita in PPP$ (level and growth
rate)
C (additional) – Female share of
employment by industry (ISIC
tabulation category)
C (additional) – Wage / earnings
inequality (percentile ratio P90/P10)
entrepreneurial culture, (iii)
enabling legal and regulatory
framework, (iv) fair competition,
and (v) rule of law and secure
property rights.
Developmental work to be done by
the Office to reflect other
institutional arrangements, such as
scope of labour law and scope of
labour ministry and other relevant
ministries.
Source: ILO compilation on the basis of the Discussion paper for the Tripartite Meeting of Experts on the Measurement of Decent Work (Geneva, 8 ‐10 September 2008).
*Wording modified by ILO in the pilot phase; **Indicator added