Embed Size (px)
Citation preview

Illinois report cardsAdvisory Committee Meeting - APPENDIX
April 8, 2011
11325 ISBE reportcard Leadership Team Mtg 1 vSENT.pptx 1
Draft – For discussion only
Copyr
ight
© 2
011 b
y T
he B
osto
n C
onsultin
g G
roup,
Inc.
All
rights
reserv
ed.
Appendix
• Project design and approach supporting slides
• Guiding questions' link to ISBE goals
• Report Card Advisory Committee first meeting notes
• Preliminary metric benchmarking
• Current IL school evaluation vehicles
• Benchmarking report card examples

11325 ISBE reportcard Leadership Team Mtg 1 vSENT.pptx 2
Draft – For discussion only
Copyr
ight
© 2
011 b
y T
he B
osto
n C
onsultin
g G
roup,
Inc.
All
rights
reserv
ed.
External benchmarks will inform report card
development throughout first two phases of project
Benchmarking plan
Benchmark broad set of state/ city
report cards to understand:
• What are the categories?
• What are the metrics?
• What is performance compared
against? (district, state, peer schools,
district or school-specific goals, etc)
• Is there a school score
communicated? If yes, how?
– If not, how is holistic performance
communicated?
• What are the differences/ similarities
between school and district report
cards?
• How dynamic is the report card?
• How accessible is the report card?
Deep-dive on
specific state/city
report cards to:
• Compare
calculation
rubric options
• Compare key
design choices
Leverage report
card language to
gather
communication/
messaging
preferences in
focus groups with
teachers,
principals,
parents
• N/A
States Cities
Project design and approach supporting slides:
Analysis and benchmarking
Note: Benchmark states/ cities selected based on previous BCG experience and committees' interests; will build broader set of benchmarks to ensure comprehensiveness.
DevelopmentRefinement and
validation
Legislation
preparation
11325 ISBE reportcard Leadership Team Mtg 1 vSENT.pptx 3
Draft – For discussion only
Copyr
ight
© 2
011 b
y T
he B
osto
n C
onsultin
g G
roup,
Inc.
All
rights
reserv
ed.
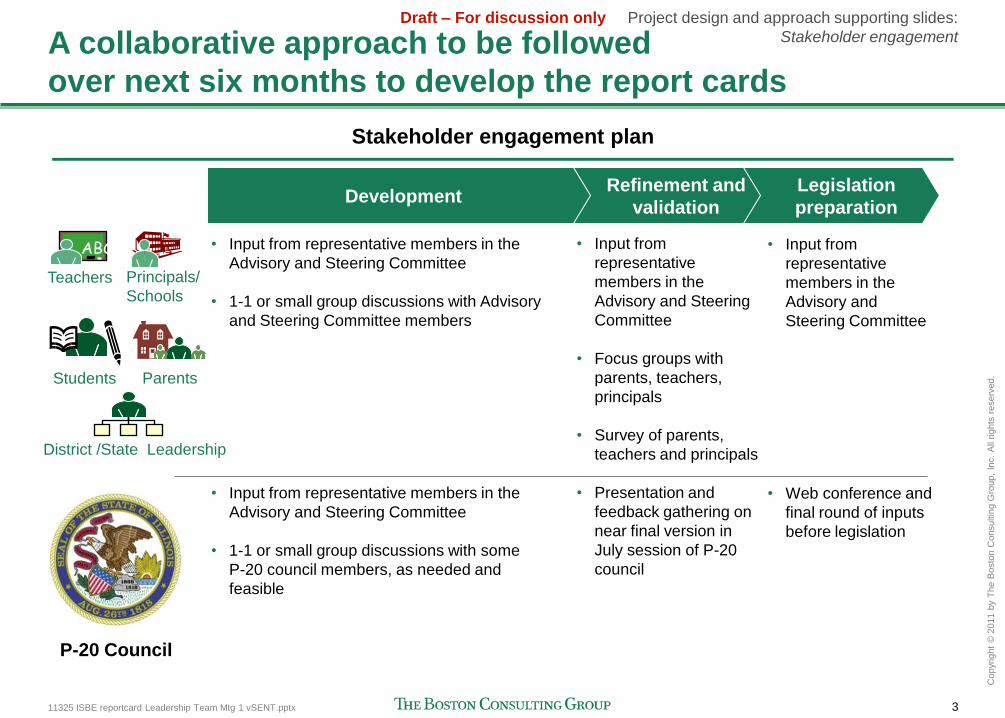
A collaborative approach to be followed
over next six months to develop the report cards
Stakeholder engagement plan
• Input from representative members in the
Advisory and Steering Committee
• 1-1 or small group discussions with Advisory
and Steering Committee members
• Input from representative members in the
Advisory and Steering Committee
• 1-1 or small group discussions with some
P-20 council members, as needed and
feasible
• Input from
representative
members in the
Advisory and Steering
Committee
• Focus groups with
parents, teachers,
principals
• Survey of parents,
teachers and principals
• Presentation and
feedback gathering on
near final version in
July session of P-20
council
• Input from
representative
members in the
Advisory and
Steering Committee
• Web conference and
final round of inputs
before legislation
ABC
Teachers Principals/
Schools
Students Parents
District /State Leadership
P-20 Council
Project design and approach supporting slides:
Stakeholder engagement
DevelopmentRefinement and
validation
Legislation
preparation

11325 ISBE reportcard Leadership Team Mtg 1 vSENT.pptx 4
Draft – For discussion only
Copyr
ight
© 2
011 b
y T
he B
osto
n C
onsultin
g G
roup,
Inc.
All
rights
reserv
ed.
Team governance structure established for
decision-making and broad involvement of key stakeholders
• Manage day-to-day activities
• Control progress and results
• Synthesize findings
• Conduct data gathering and analysis
• Conduct interviews and focus groups
with key stakeholders
• Identify and raise roadblocks
Max McGee1
Darren Reisberg
Robin Steans1
Larry Frank
Dan Harris
Michael Jacoby
Melissa Mitchell
Amy Nowell
Kathy Ryg
Harvey Smith
Deb Strauss
Rich Voltz
Ben Boer1 (Advance IL)
Dan Brown1 (ISBE)
Steve Pearson (Advance IL)
Project team
Steering committee• Provide strategic and tactical
direction; take key decisions
• Overall responsibility for BCG
support
• Remove roadblocks
IEA/CEC
IFT
IPA
LUDA
Voices3
PTA
Fed. Of Cmty Schools
IASA
IASB
IASBO
ISAC
IBHE
IBHE
ICCB
Early Learning Council4
Civic Committee
Boeing5
IBRT
IIRC
P-20 University Leader
ISBE
Advance Illinois
CPS
CTU
Stand for Children
IMSA/P20 Council
ROE 20
ROE
Ed-Red
LEND/SCOPE
Illinois Resource Center
P20 Council
Legislative Staff
TARGET AreaDevCorp
Advisory committee
1. Leadership team members. 2. Composition of team may vary over time; 3. P-20 Family & Community Outreach; 4. P-20 Early Learning Rep; 5. P20 Business Leader
Shalini Unnikrishnan
Colleen Donovan2
P-20 Council• Overall leadership on project
Marin Gjaja
Nneka Rimmer
Michelle Russell
Project design and approach supporting slides:
Governance structure
11325 ISBE reportcard Leadership Team Mtg 1 vSENT.pptx 5
Draft – For discussion only
Copyr
ight
© 2
011 b
y T
he B
osto
n C
onsultin
g G
roup,
Inc.
All
rights
reserv
ed.
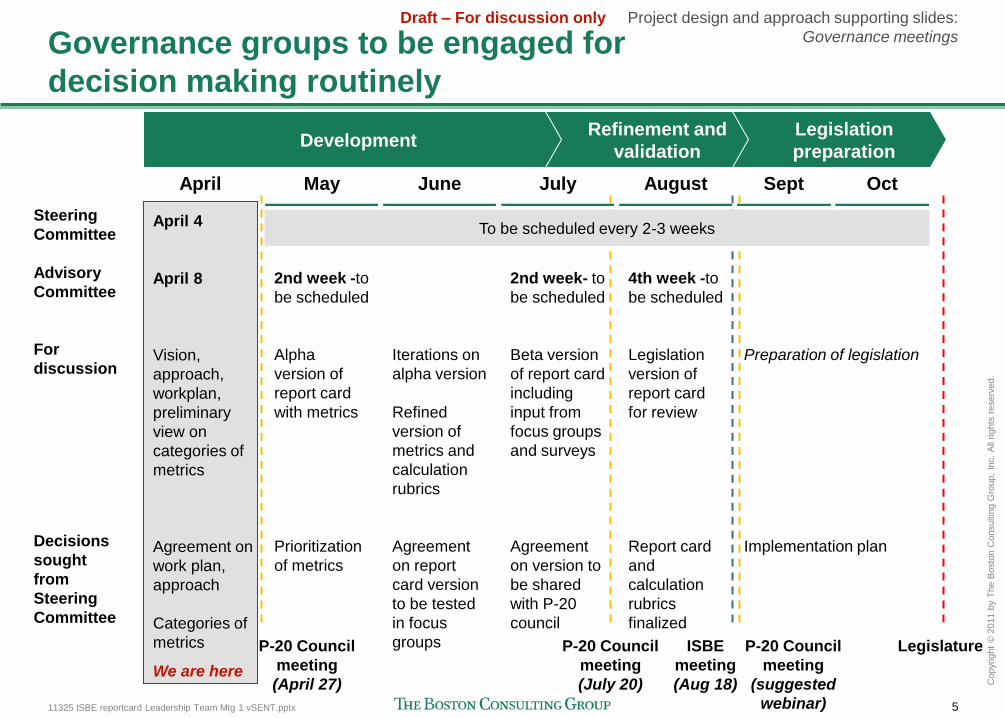
Oct
Governance groups to be engaged for
decision making routinely
Steering
Committee
Advisory
Committee
For
discussion
Decisions
sought
from
Steering
Committee
April
April 4
April 8
Vision,
approach,
workplan,
preliminary
view on
categories of
metrics
Agreement on
work plan,
approach
Categories of
metrics
We are here
May
2nd week -to
be scheduled
Alpha
version of
report card
with metrics
Prioritization
of metrics
June
Iterations on
alpha version
Refined
version of
metrics and
calculation
rubrics
Agreement
on report
card version
to be tested
in focus
groups
July
2nd week- to
be scheduled
Beta version
of report card
including
input from
focus groups
and surveys
Agreement
on version to
be shared
with P-20
council
August
4th week -to
be scheduled
Legislation
version of
report card
for review
Report card
and
calculation
rubrics
finalized
Sept
P-20 Council
meeting
(July 20)
P-20 Council
meeting
(suggested
webinar)
Legislature
Preparation of legislation
Implementation plan
DevelopmentRefinement and
validation
Legislation
preparation
Project design and approach supporting slides:
Governance meetings
P-20 Council
meeting
(April 27)
ISBE
meeting
(Aug 18)
To be scheduled every 2-3 weeks
11325 ISBE reportcard Leadership Team Mtg 1 vSENT.pptx 6
Draft – For discussion only
Copyr
ight
© 2
011 b
y T
he B
osto
n C
onsultin
g G
roup,
Inc.
All
rights
reserv
ed.
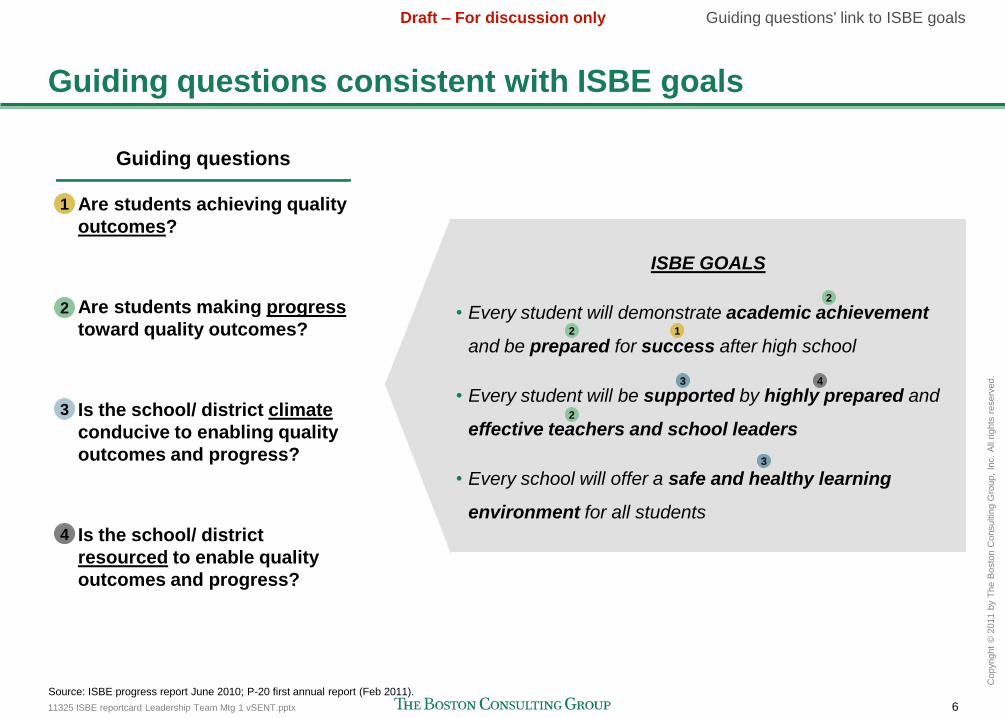
Guiding questions consistent with ISBE goals
Guiding questions' link to ISBE goals
ISBE GOALS
• Every student will demonstrate academic achievement
and be prepared for success after high school
• Every student will be supported by highly prepared and
effective teachers and school leaders
• Every school will offer a safe and healthy learning
environment for all students
2
4
1
3
3
Source: ISBE progress report June 2010; P-20 first annual report (Feb 2011).
2
Are students achieving quality
outcomes?
Are students making progress
toward quality outcomes?
Is the school/ district climate
conducive to enabling quality
outcomes and progress?
Is the school/ district
resourced to enable quality
outcomes and progress?
1
2
3
4
Guiding questions
2

11325 ISBE reportcard Leadership Team Mtg 1 vSENT.pptx 7
Draft – For discussion only
Copyr
ight
© 2
011 b
y T
he B
osto
n C
onsultin
g G
roup,
Inc.
All
rights
reserv
ed.
In first meeting, Advisory Committee reviewed report card
vision and 4 objectives (I)
"Provide information that can be used by parents, teachers, policymakers,
taxpayers, researchers, and students to make changes at a local level to improve
teaching and learning"Vision
Source: Illinois P-20 Council Advisory Committee on School Report Card 2/15/2011 meeting minutes.
Advisory Committee 1st meeting notes
1. Develop a list of indicators to add, remove, or amend
2. Recommend methodology to calculate new or complicated measures
3. Craft guidelines for communication and release of report card each year
4. Make design suggestions to make the report more user-friendly
4 objectives
11325 ISBE reportcard Leadership Team Mtg 1 vSENT.pptx 8
Draft – For discussion only
Copyr
ight
© 2
011 b
y T
he B
osto
n C
onsultin
g G
roup,
Inc.
All
rights
reserv
ed.
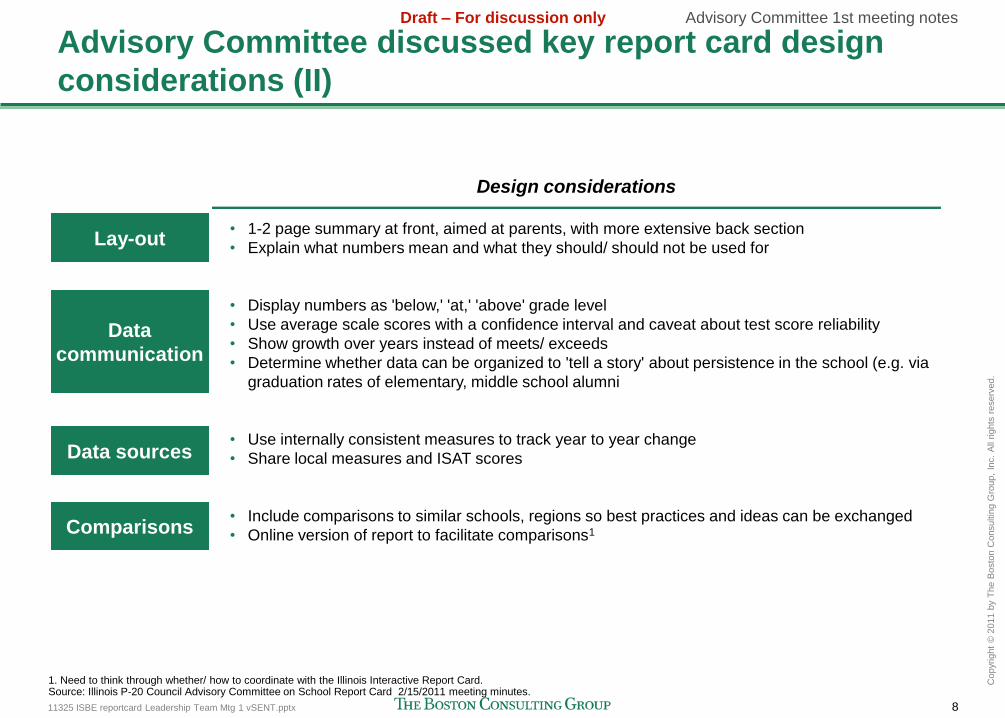
• 1-2 page summary at front, aimed at parents, with more extensive back section
• Explain what numbers mean and what they should/ should not be used for
• Display numbers as 'below,' 'at,' 'above' grade level
• Use average scale scores with a confidence interval and caveat about test score reliability
• Show growth over years instead of meets/ exceeds
• Determine whether data can be organized to 'tell a story' about persistence in the school (e.g. via
graduation rates of elementary, middle school alumni
• Use internally consistent measures to track year to year change
• Share local measures and ISAT scores
• Include comparisons to similar schools, regions so best practices and ideas can be exchanged
• Online version of report to facilitate comparisons1
1. Need to think through whether/ how to coordinate with the Illinois Interactive Report Card.Source: Illinois P-20 Council Advisory Committee on School Report Card 2/15/2011 meeting minutes.
Lay-out
Data
communication
Comparisons
Data sources
Design considerations
Advisory Committee discussed key report card design
considerations (II)
Advisory Committee 1st meeting notes

11325 ISBE reportcard Leadership Team Mtg 1 vSENT.pptx 9
Draft – For discussion only
Copyr
ight
© 2
011 b
y T
he B
osto
n C
onsultin
g G
roup,
Inc.
All
rights
reserv
ed.
Advisory Committee discussed potential metric changes and
additions – in context of current IL Report Card categories (III)
1. Using new federally approved measure. 2.Discussed potential for other finance-related items to be placed not on "one pager," but in full report: EAV per pupil over time; school tax rate over time; education fund spending broken down by administration, instructional delivery, etc; average teacher and administrator salary/benefits; special education spending, revenue by source, breakdown of General State Aid; interest in reporting other school expenditures as 3 yr averages to account for capital spending hikes; interest in relating staffing changes to enrollment changes. 3. Did not discuss in depth.
Academic
performance
Student
information
• AP taking/ passing rate
• IB/ dual credit taking rate
• ACT performance (average; % who earn 'college ready score')
• NAEP performance
• WorkKeys performance
• College-ready course completion (students who took x years of
math, sci, etc)
• Course-taking info related to test performance (e.g. % who took
Algebra II before ACT)
Instructional
setting
District finances
Additions
• Graduation rates1
• College readiness
• Post-secondary matriculation rates
• Post-secondary remediation rates
• Student growth
• Kindergarten readiness
• Freshman on-track rate
• High school readiness (e.g. 8th graders taking/ passing Algebra I)
• Graduation rates of elementary, middle school alumni
• Average class size (instead of pupil: teacher ratio)
• Staff by type
• Teachers by certification level
• Teacher evaluation metric breakdown
• Teacher attendance
• Teacher turnover
• Instructional time dedicated to core subjects
• Mobility
• Attendance (not truancy)
• Demographics
• Enrollment
• Per pupil instructional expenditure2
• Per pupil operational expenditure2
• Parent involvement & parent survey3
• School safety, climate, & learning conditions 3
• Narrative of school improvement plans
Metric changes and additions
Advisory Committee 1st meeting notes
11325 ISBE reportcard Leadership Team Mtg 1 vSENT.pptx 10
Draft – For discussion only
Copyr
ight
© 2
011 b
y T
he B
osto
n C
onsultin
g G
roup,
Inc.
All
rights
reserv
ed.
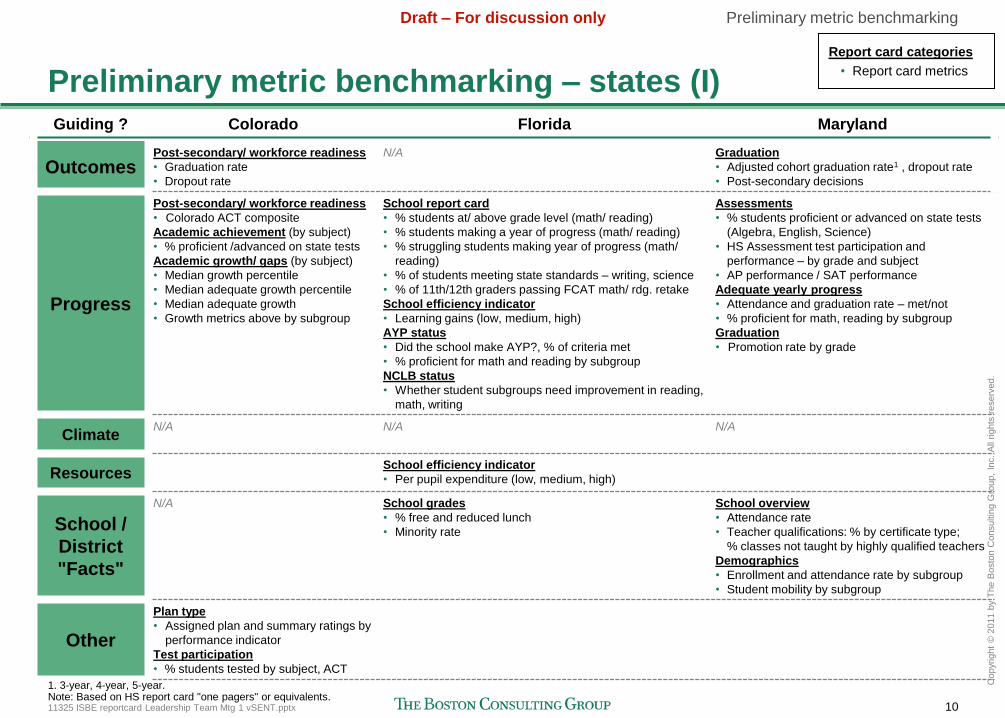
Guiding ? Colorado Florida Maryland
OutcomesPost-secondary/ workforce readiness
• Graduation rate
• Dropout rate
N/A Graduation
• Adjusted cohort graduation rate1 , dropout rate
• Post-secondary decisions
Progress
Post-secondary/ workforce readiness
• Colorado ACT composite
Academic achievement (by subject)
• % proficient /advanced on state tests
Academic growth/ gaps (by subject)
• Median growth percentile
• Median adequate growth percentile
• Median adequate growth
• Growth metrics above by subgroup
School report card
• % students at/ above grade level (math/ reading)
• % students making a year of progress (math/ reading)
• % struggling students making year of progress (math/
reading)
• % of students meeting state standards – writing, science
• % of 11th/12th graders passing FCAT math/ rdg. retake
School efficiency indicator
• Learning gains (low, medium, high)
AYP status
• Did the school make AYP?, % of criteria met
• % proficient for math and reading by subgroup
NCLB status
• Whether student subgroups need improvement in reading,
math, writing
Assessments
• % students proficient or advanced on state tests
(Algebra, English, Science)
• HS Assessment test participation and
performance – by grade and subject
• AP performance / SAT performance
Adequate yearly progress
• Attendance and graduation rate – met/not
• % proficient for math, reading by subgroup
Graduation
• Promotion rate by grade
ClimateN/A N/A N/A
ResourcesSchool efficiency indicator
• Per pupil expenditure (low, medium, high)
School /
District
"Facts"
N/A School grades
• % free and reduced lunch
• Minority rate
School overview
• Attendance rate
• Teacher qualifications: % by certificate type;
% classes not taught by highly qualified teachers
Demographics
• Enrollment and attendance rate by subgroup
• Student mobility by subgroup
Other
Plan type
• Assigned plan and summary ratings by
performance indicator
Test participation
• % students tested by subject, ACT
Preliminary metric benchmarking – states (I)Report card categories
• Report card metrics
Preliminary metric benchmarking
1. 3-year, 4-year, 5-year.Note: Based on HS report card "one pagers" or equivalents.
11325 ISBE reportcard Leadership Team Mtg 1 vSENT.pptx 11
Draft – For discussion only
Copyr
ight
© 2
011 b
y T
he B
osto
n C
onsultin
g G
roup,
Inc.
All
rights
reserv
ed.
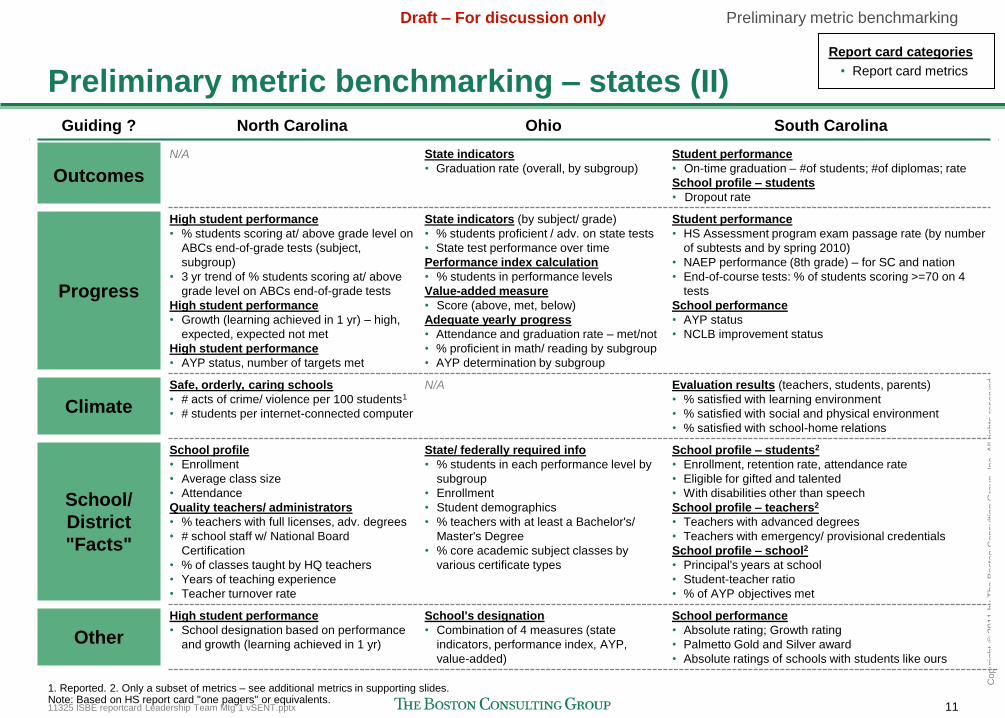
Guiding ? North Carolina Ohio South Carolina
Outcomes
N/A State indicators
• Graduation rate (overall, by subgroup)
Student performance
• On-time graduation – #of students; #of diplomas; rate
School profile – students
• Dropout rate
Progress
High student performance
• % students scoring at/ above grade level on
ABCs end-of-grade tests (subject,
subgroup)
• 3 yr trend of % students scoring at/ above
grade level on ABCs end-of-grade tests
High student performance
• Growth (learning achieved in 1 yr) – high,
expected, expected not met
High student performance
• AYP status, number of targets met
State indicators (by subject/ grade)
• % students proficient / adv. on state tests
• State test performance over time
Performance index calculation
• % students in performance levels
Value-added measure
• Score (above, met, below)
Adequate yearly progress
• Attendance and graduation rate – met/not
• % proficient in math/ reading by subgroup
• AYP determination by subgroup
Student performance
• HS Assessment program exam passage rate (by number
of subtests and by spring 2010)
• NAEP performance (8th grade) – for SC and nation
• End-of-course tests: % of students scoring >=70 on 4
tests
School performance
• AYP status
• NCLB improvement status
Climate
Safe, orderly, caring schools
• # acts of crime/ violence per 100 students1
• # students per internet-connected computer
N/A Evaluation results (teachers, students, parents)
• % satisfied with learning environment
• % satisfied with social and physical environment
• % satisfied with school-home relations
School/
District
"Facts"
School profile
• Enrollment
• Average class size
• Attendance
Quality teachers/ administrators
• % teachers with full licenses, adv. degrees
• # school staff w/ National Board
Certification
• % of classes taught by HQ teachers
• Years of teaching experience
• Teacher turnover rate
State/ federally required info
• % students in each performance level by
subgroup
• Enrollment
• Student demographics
• % teachers with at least a Bachelor's/
Master's Degree
• % core academic subject classes by
various certificate types
School profile – students2
• Enrollment, retention rate, attendance rate
• Eligible for gifted and talented
• With disabilities other than speech
School profile – teachers2
• Teachers with advanced degrees
• Teachers with emergency/ provisional credentials
School profile – school2
• Principal's years at school
• Student-teacher ratio
• % of AYP objectives met
Other
High student performance
• School designation based on performance
and growth (learning achieved in 1 yr)
School's designation
• Combination of 4 measures (state
indicators, performance index, AYP,
value-added)
School performance
• Absolute rating; Growth rating
• Palmetto Gold and Silver award
• Absolute ratings of schools with students like ours
Preliminary metric benchmarking – states (II)
1. Reported. 2. Only a subset of metrics – see additional metrics in supporting slides.Note: Based on HS report card "one pagers" or equivalents.
Report card categories
• Report card metrics
Preliminary metric benchmarking
11325 ISBE reportcard Leadership Team Mtg 1 vSENT.pptx 12
Draft – For discussion only
Copyr
ight
© 2
011 b
y T
he B
osto
n C
onsultin
g G
roup,
Inc.
All
rights
reserv
ed.
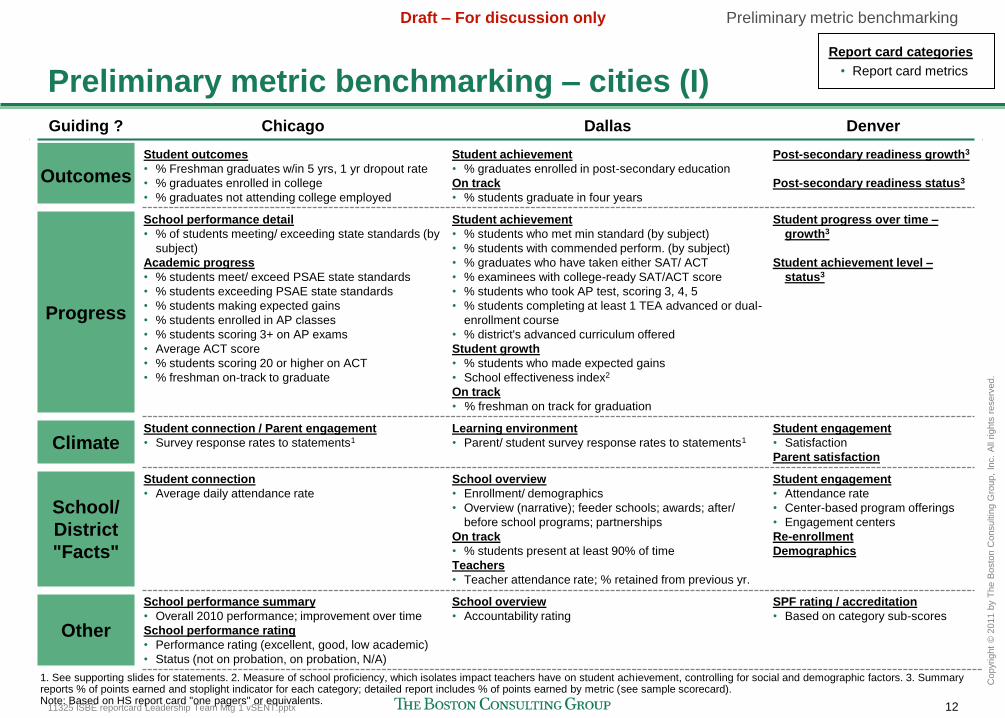
Guiding ? Chicago Dallas Denver
Outcomes
Student outcomes
• % Freshman graduates w/in 5 yrs, 1 yr dropout rate
• % graduates enrolled in college
• % graduates not attending college employed
Student achievement
• % graduates enrolled in post-secondary education
On track
• % students graduate in four years
Post-secondary readiness growth3
Post-secondary readiness status3
Progress
School performance detail
• % of students meeting/ exceeding state standards (by
subject)
Academic progress
• % students meet/ exceed PSAE state standards
• % students exceeding PSAE state standards
• % students making expected gains
• % students enrolled in AP classes
• % students scoring 3+ on AP exams
• Average ACT score
• % students scoring 20 or higher on ACT
• % freshman on-track to graduate
Student achievement
• % students who met min standard (by subject)
• % students with commended perform. (by subject)
• % graduates who have taken either SAT/ ACT
• % examinees with college-ready SAT/ACT score
• % students who took AP test, scoring 3, 4, 5
• % students completing at least 1 TEA advanced or dual-
enrollment course
• % district's advanced curriculum offered
Student growth
• % students who made expected gains
• School effectiveness index2
On track
• % freshman on track for graduation
Student progress over time –
growth3
Student achievement level –
status3
ClimateStudent connection / Parent engagement
• Survey response rates to statements1
Learning environment
• Parent/ student survey response rates to statements1
Student engagement
• Satisfaction
Parent satisfaction
School/
District
"Facts"
Student connection
• Average daily attendance rate
School overview
• Enrollment/ demographics
• Overview (narrative); feeder schools; awards; after/
before school programs; partnerships
On track
• % students present at least 90% of time
Teachers
• Teacher attendance rate; % retained from previous yr.
Student engagement
• Attendance rate
• Center-based program offerings
• Engagement centers
Re-enrollment
Demographics
Other
School performance summary
• Overall 2010 performance; improvement over time
School performance rating
• Performance rating (excellent, good, low academic)
• Status (not on probation, on probation, N/A)
School overview
• Accountability rating
SPF rating / accreditation
• Based on category sub-scores
1. See supporting slides for statements. 2. Measure of school proficiency, which isolates impact teachers have on student achievement, controlling for social and demographic factors. 3. Summary reports % of points earned and stoplight indicator for each category; detailed report includes % of points earned by metric (see sample scorecard).Note: Based on HS report card "one pagers" or equivalents.
Preliminary metric benchmarking – cities (I)Report card categories
• Report card metrics
Preliminary metric benchmarking

11325 ISBE reportcard Leadership Team Mtg 1 vSENT.pptx 13
Draft – For discussion only
Copyr
ight
© 2
011 b
y T
he B
osto
n C
onsultin
g G
roup,
Inc.
All
rights
reserv
ed.
Guiding ? Seattle Los Angeles New York City
Outcomes
Academic growth & student outcomes
• % students graduating in <=4 yrs, <= 6 yrs
• % grads prepared for 4 yr college
• % grads enrolling in higher education w/in 1 yr
• % students with advanced career prep
Readiness
• % 9th graders graduating in 4 yrs
Student performance
• Graduation rate (4 yr / 6 yr)
• Weighted diploma rate (4 yr / 6 yr)
Progress
Academic growth & student outcomes
• % 10th graders proficient on state tests (by subject)
• % 10th gr. making gains on state tests (by subject)
• % proficient on state tests by subgroup (by subject)
• % grads taking AP/IB course during high school
• % test-takers passing AP/IB test during high school
• First-time/ repeat 9th graders earning suff. credit
• % students taking SAT/ ACT tests
• % students scoring above average on SAT/ ACT
Accountability & School performance
• AYP status, % of AYP criteria met
Progress
• % students scoring proficient/ adv.on state tests
• % students passing state exit exam in 10th grade
• Academic growth over time
• % students who took SAT/ ACT
• % students scoring >=1400 on SAT, 19 on ACT
Readiness
• % 9th graders still working toward diploma
Student groups
• % students scoring proficient/ advanced on state
tests by subgroup (ELA, math)
• % English learners scoring proficient on CELDT/
ELA state test, passing ELA classes w/ "C"+
Learn more – AYP status
• AYP status, # of AYP criteria met, PI status
Closing achievement gap credits
• Exemplary proficiency gains by subgroup
Student progress
• Weighted regents pass rate (by subject)
• % students earning 10+ credits in 1st /
2nd/ 3rd yr
• % students in school's lowest 1/3 earning
10+ credits in 1st/ 2nd/ 3rd yr
Grade
• AYP status
ClimateStudent/ family/ staff climate & engagement
• Survey response rate to statements1
School demographics (% by subgroup)
Learning environment
• Student/ parent survey response rate to
statements1
School environment (survey responses)
• Acad. expectations; Communications;
Engagement; Safety and respect
ResourcesSchool profile
• Budget report
School/
District
"Facts"
Student climate & engagement
• Students with <10 absences per yr
School profile
• Student enrollment, number of teachers/ other staff
• Average class size, daily attendance
• Mission statement, goals, description, plan to
achieve goals
Learning environment
• % students suspended 1 or more times
• % teachers at school for at least 3 yrs
• % staff/ students with 96% or higher attendance
• % courses taught by NCLB HQ teacher
Learn more
• Enrollment, demographics
School environment
• Attendance
Other
Accountability and school performance
• Seattle Public Schools segmentation level
Progress
• API score
Grade
• School grade and 'what grade means'
• Category-specific grade summary
• Peer index
Preliminary metric benchmarking – cities (II)Report card categories
• Report card metrics
1. See supporting slides for statements.Note: Based on HS report card "one pagers" or equivalents.
Preliminary metric benchmarking
11325 ISBE reportcard Leadership Team Mtg 1 vSENT.pptx 14
Draft – For discussion only
Copyr
ight
© 2
011 b
y T
he B
osto
n C
onsultin
g G
roup,
Inc.
All
rights
reserv
ed.
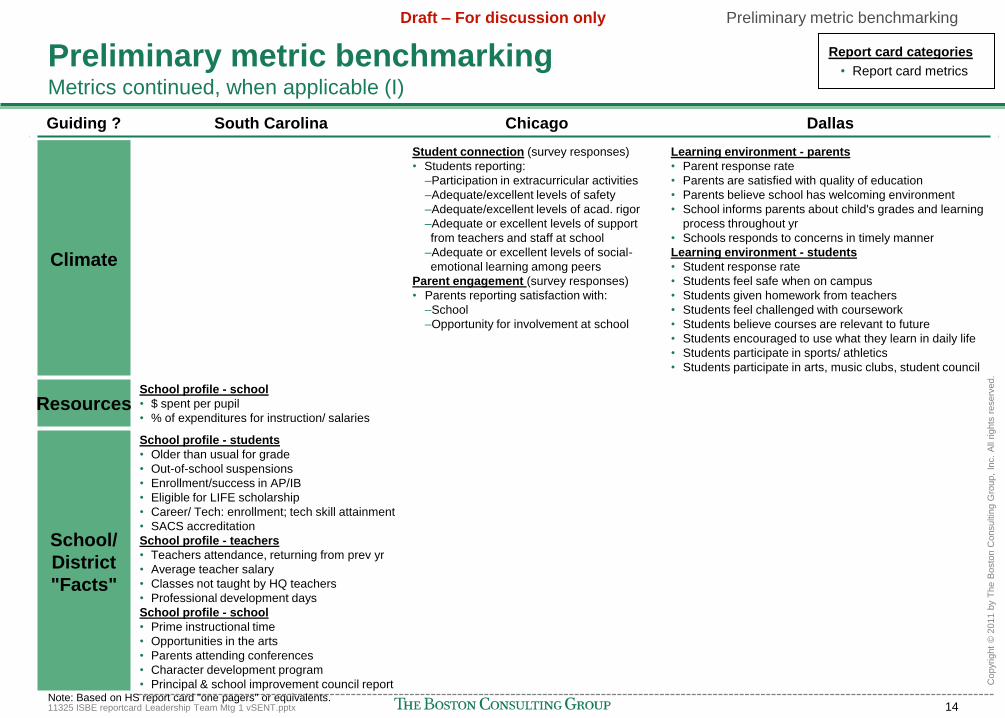
Guiding ? South Carolina Chicago Dallas
Climate
Student connection (survey responses)
• Students reporting:
–Participation in extracurricular activities
–Adequate/excellent levels of safety
–Adequate/excellent levels of acad. rigor
–Adequate or excellent levels of support
from teachers and staff at school
–Adequate or excellent levels of social-
emotional learning among peers
Parent engagement (survey responses)
• Parents reporting satisfaction with:
–School
–Opportunity for involvement at school
Learning environment - parents
• Parent response rate
• Parents are satisfied with quality of education
• Parents believe school has welcoming environment
• School informs parents about child's grades and learning
process throughout yr
• Schools responds to concerns in timely manner
Learning environment - students
• Student response rate
• Students feel safe when on campus
• Students given homework from teachers
• Students feel challenged with coursework
• Students believe courses are relevant to future
• Students encouraged to use what they learn in daily life
• Students participate in sports/ athletics
• Students participate in arts, music clubs, student council
ResourcesSchool profile - school
• $ spent per pupil
• % of expenditures for instruction/ salaries
School/
District
"Facts"
School profile - students
• Older than usual for grade
• Out-of-school suspensions
• Enrollment/success in AP/IB
• Eligible for LIFE scholarship
• Career/ Tech: enrollment; tech skill attainment
• SACS accreditation
School profile - teachers
• Teachers attendance, returning from prev yr
• Average teacher salary
• Classes not taught by HQ teachers
• Professional development days
School profile - school
• Prime instructional time
• Opportunities in the arts
• Parents attending conferences
• Character development program
• Principal & school improvement council report
Preliminary metric benchmarking Metrics continued, when applicable (I)
Report card categories
• Report card metrics
Preliminary metric benchmarking
Note: Based on HS report card "one pagers" or equivalents.
11325 ISBE reportcard Leadership Team Mtg 1 vSENT.pptx 15
Draft – For discussion only
Copyr
ight
© 2
011 b
y T
he B
osto
n C
onsultin
g G
roup,
Inc.
All
rights
reserv
ed.
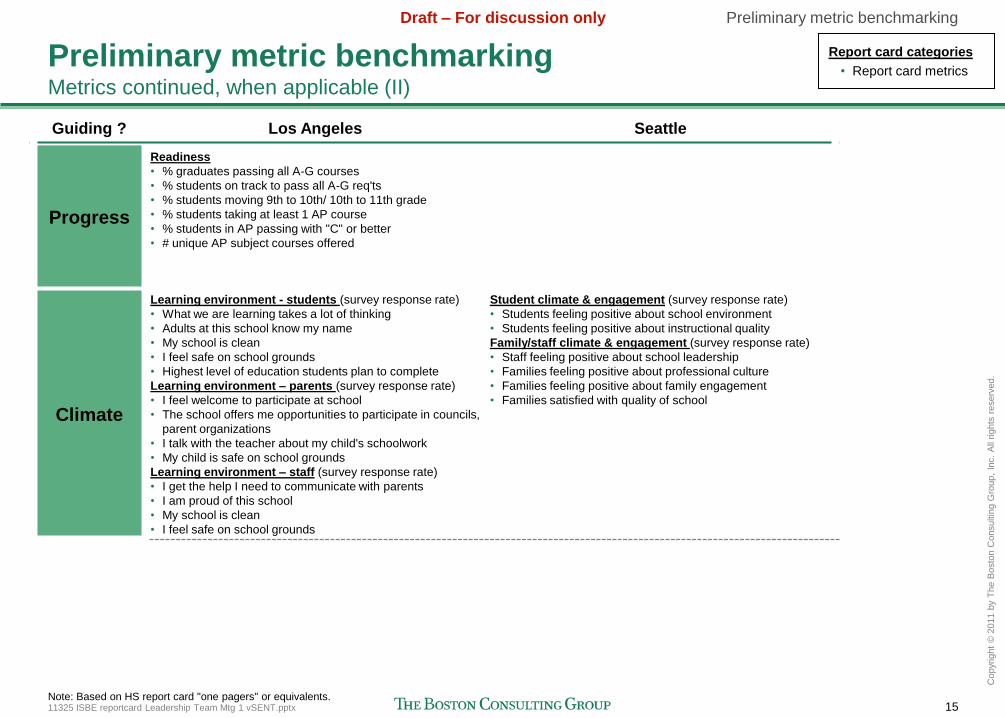
Guiding ? Los Angeles Seattle
Progress
Readiness
• % graduates passing all A-G courses
• % students on track to pass all A-G req'ts
• % students moving 9th to 10th/ 10th to 11th grade
• % students taking at least 1 AP course
• % students in AP passing with "C" or better
• # unique AP subject courses offered
Climate
Learning environment - students (survey response rate)
• What we are learning takes a lot of thinking
• Adults at this school know my name
• My school is clean
• I feel safe on school grounds
• Highest level of education students plan to complete
Learning environment – parents (survey response rate)
• I feel welcome to participate at school
• The school offers me opportunities to participate in councils,
parent organizations
• I talk with the teacher about my child's schoolwork
• My child is safe on school grounds
Learning environment – staff (survey response rate)
• I get the help I need to communicate with parents
• I am proud of this school
• My school is clean
• I feel safe on school grounds
Student climate & engagement (survey response rate)
• Students feeling positive about school environment
• Students feeling positive about instructional quality
Family/staff climate & engagement (survey response rate)
• Staff feeling positive about school leadership
• Families feeling positive about professional culture
• Families feeling positive about family engagement
• Families satisfied with quality of school
Preliminary metric benchmarking Metrics continued, when applicable (II)
Note: Based on HS report card "one pagers" or equivalents.
Report card categories
• Report card metrics
Preliminary metric benchmarking
11325 ISBE reportcard Leadership Team Mtg 1 vSENT.pptx 16
Draft – For discussion only
Copyr
ight
© 2
011 b
y T
he B
osto
n C
onsultin
g G
roup,
Inc.
All
rights
reserv
ed.
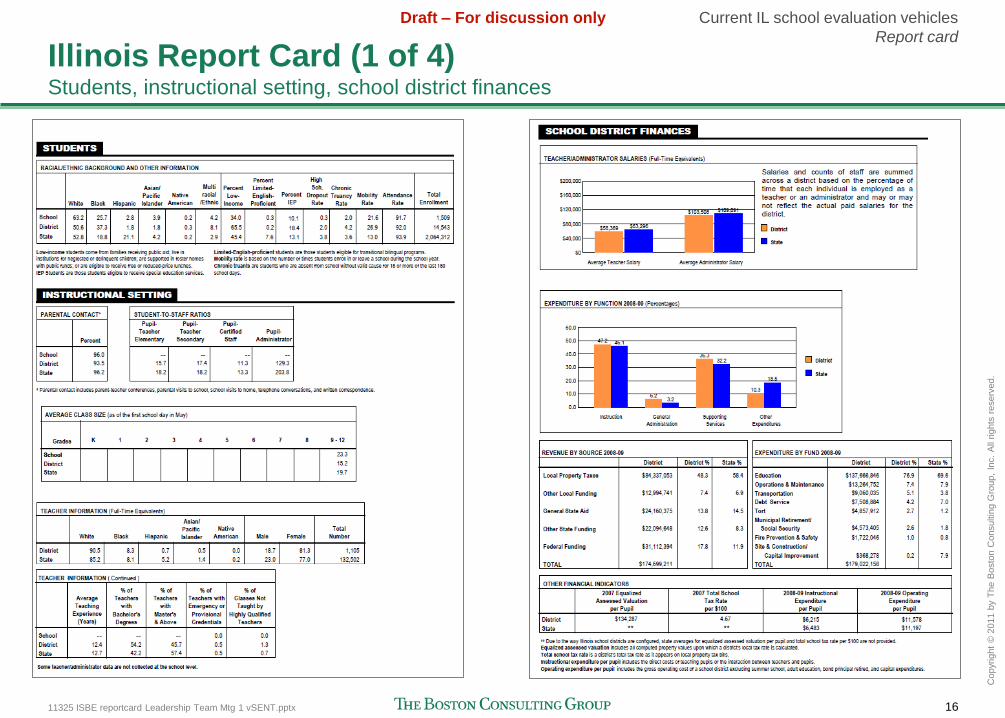
Illinois Report Card (1 of 4)Students, instructional setting, school district finances
Current IL school evaluation vehicles
Report card

11325 ISBE reportcard Leadership Team Mtg 1 vSENT.pptx 17
Draft – For discussion only
Copyr
ight
© 2
011 b
y T
he B
osto
n C
onsultin
g G
roup,
Inc.
All
rights
reserv
ed.
Illinois Report Card (2 of 4)Academic performance: ACTs, graduation, all state tests, PSAE, IAA
Current IL school evaluation vehicles
Report card
11325 ISBE reportcard Leadership Team Mtg 1 vSENT.pptx 18
Draft – For discussion only
Copyr
ight
© 2
011 b
y T
he B
osto
n C
onsultin
g G
roup,
Inc.
All
rights
reserv
ed.
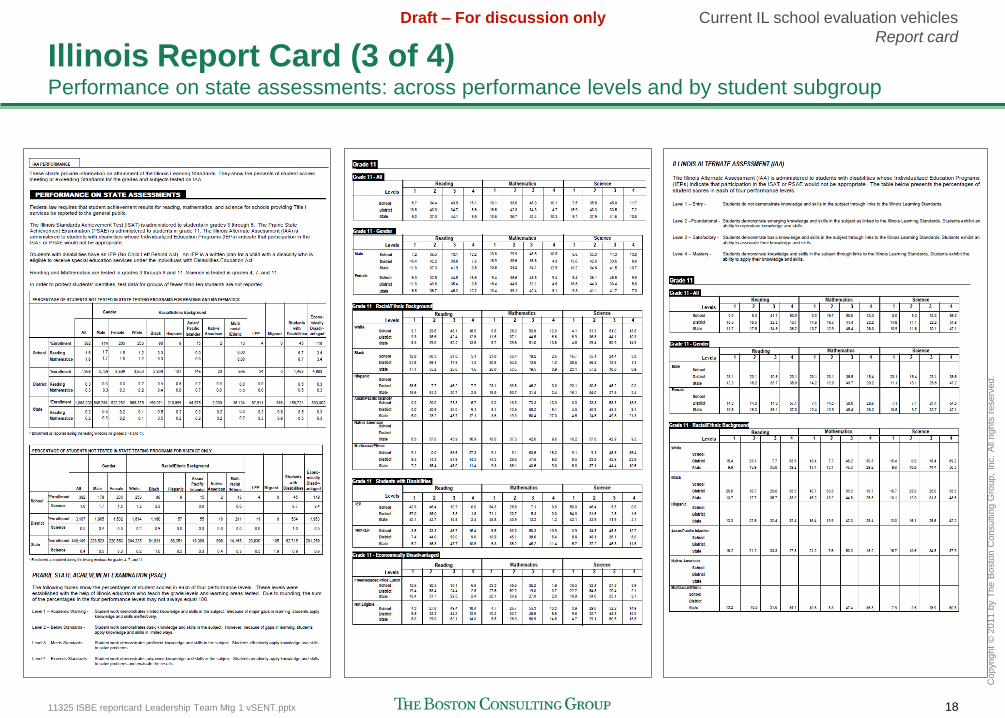
Illinois Report Card (3 of 4)Performance on state assessments: across performance levels and by student subgroup
Current IL school evaluation vehicles
Report card
11325 ISBE reportcard Leadership Team Mtg 1 vSENT.pptx 19
Draft – For discussion only
Copyr
ight
© 2
011 b
y T
he B
osto
n C
onsultin
g G
roup,
Inc.
All
rights
reserv
ed.
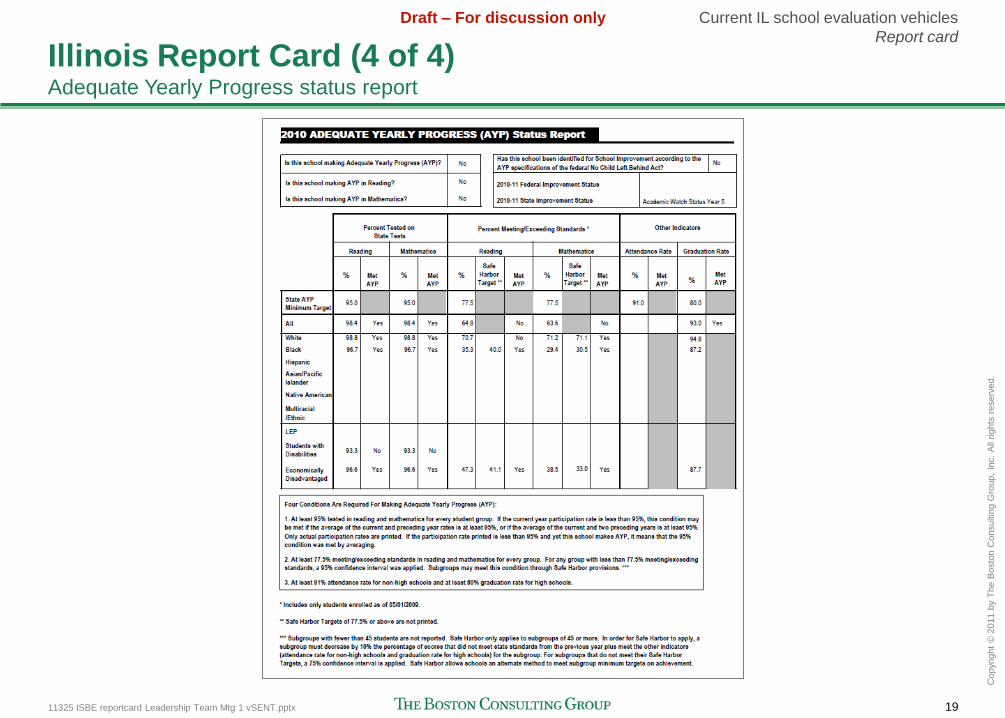
Illinois Report Card (4 of 4)Adequate Yearly Progress status report
Current IL school evaluation vehicles
Report card
11325 ISBE reportcard Leadership Team Mtg 1 vSENT.pptx 20
Draft – For discussion only
Copyr
ight
© 2
011 b
y T
he B
osto
n C
onsultin
g G
roup,
Inc.
All
rights
reserv
ed.
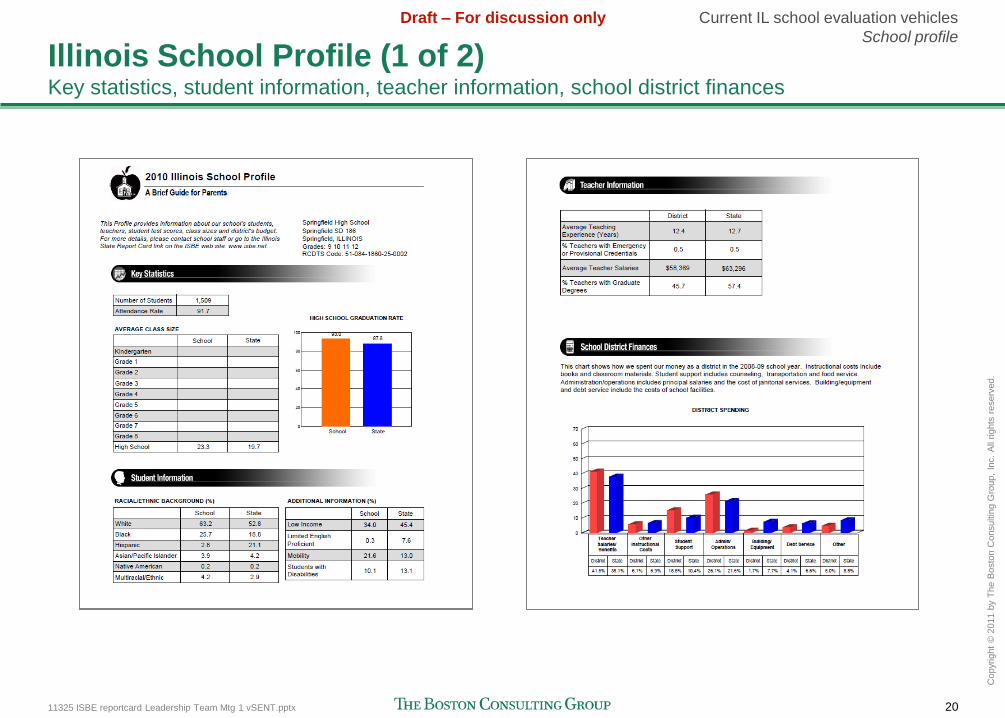
Illinois School Profile (1 of 2)Key statistics, student information, teacher information, school district finances
Current IL school evaluation vehicles
School profile
11325 ISBE reportcard Leadership Team Mtg 1 vSENT.pptx 21
Draft – For discussion only
Copyr
ight
© 2
011 b
y T
he B
osto
n C
onsultin
g G
roup,
Inc.
All
rights
reserv
ed.
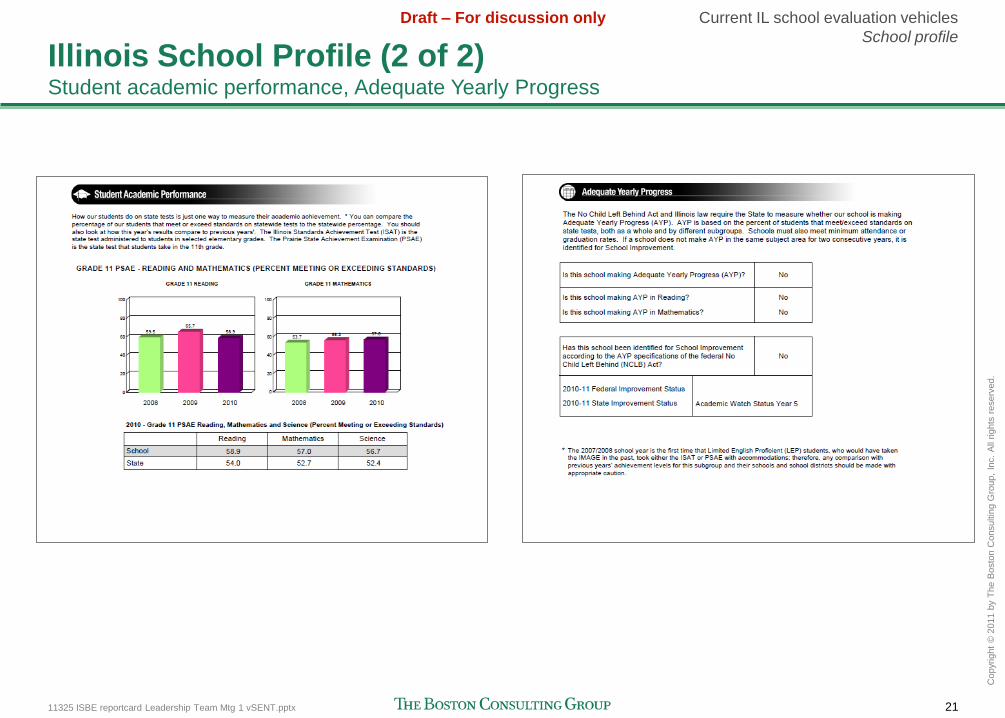
Illinois School Profile (2 of 2)Student academic performance, Adequate Yearly Progress
Current IL school evaluation vehicles
School profile
11325 ISBE reportcard Leadership Team Mtg 1 vSENT.pptx 22
Draft – For discussion only
Copyr
ight
© 2
011 b
y T
he B
osto
n C
onsultin
g G
roup,
Inc.
All
rights
reserv
ed.
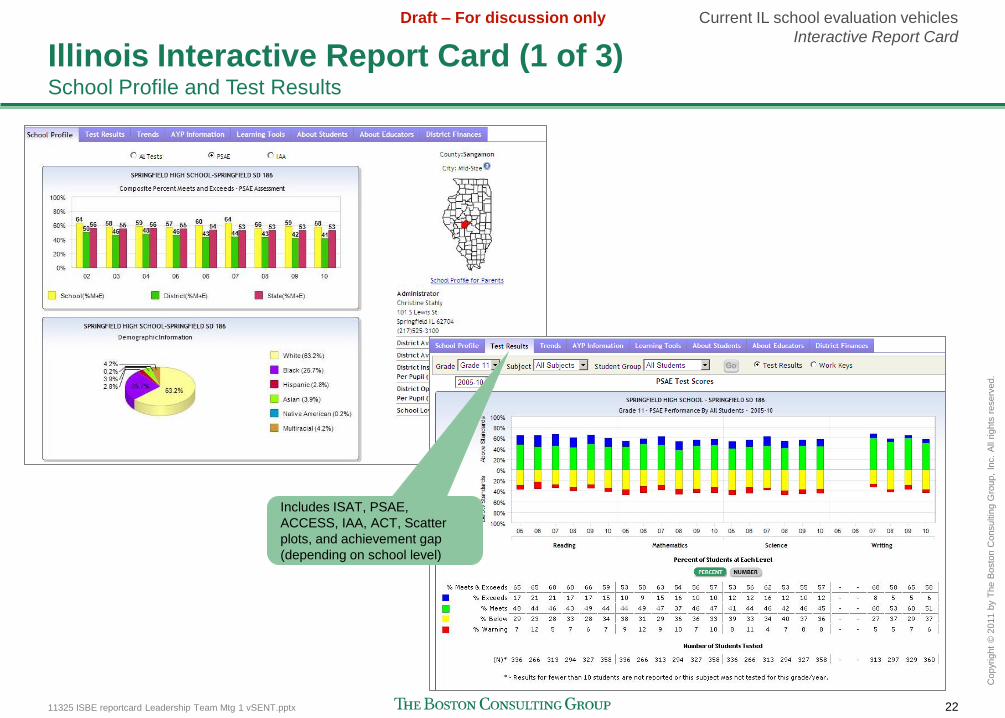
Illinois Interactive Report Card (1 of 3)School Profile and Test Results
Current IL school evaluation vehicles
Interactive Report Card
Includes ISAT, PSAE,
ACCESS, IAA, ACT, Scatter
plots, and achievement gap
(depending on school level)
11325 ISBE reportcard Leadership Team Mtg 1 vSENT.pptx 23
Draft – For discussion only
Copyr
ight
© 2
011 b
y T
he B
osto
n C
onsultin
g G
roup,
Inc.
All
rights
reserv
ed.
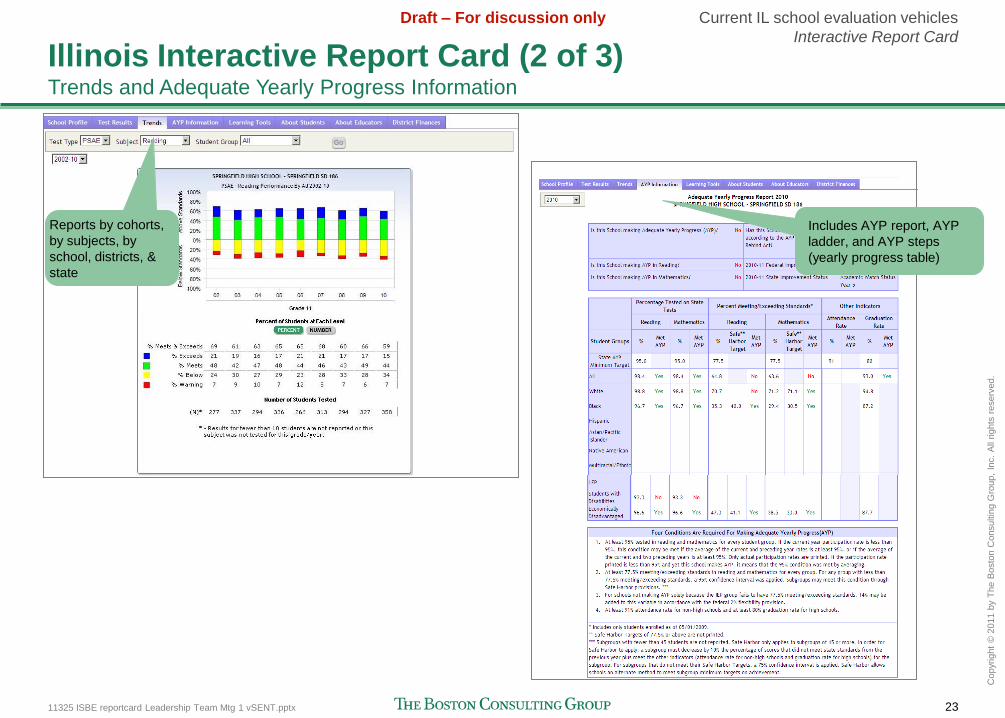
Illinois Interactive Report Card (2 of 3)Trends and Adequate Yearly Progress Information
Current IL school evaluation vehicles
Interactive Report Card
Reports by cohorts,
by subjects, by
school, districts, &
state
Includes AYP report, AYP
ladder, and AYP steps
(yearly progress table)
11325 ISBE reportcard Leadership Team Mtg 1 vSENT.pptx 24
Draft – For discussion only
Copyr
ight
© 2
011 b
y T
he B
osto
n C
onsultin
g G
roup,
Inc.
All
rights
reserv
ed.
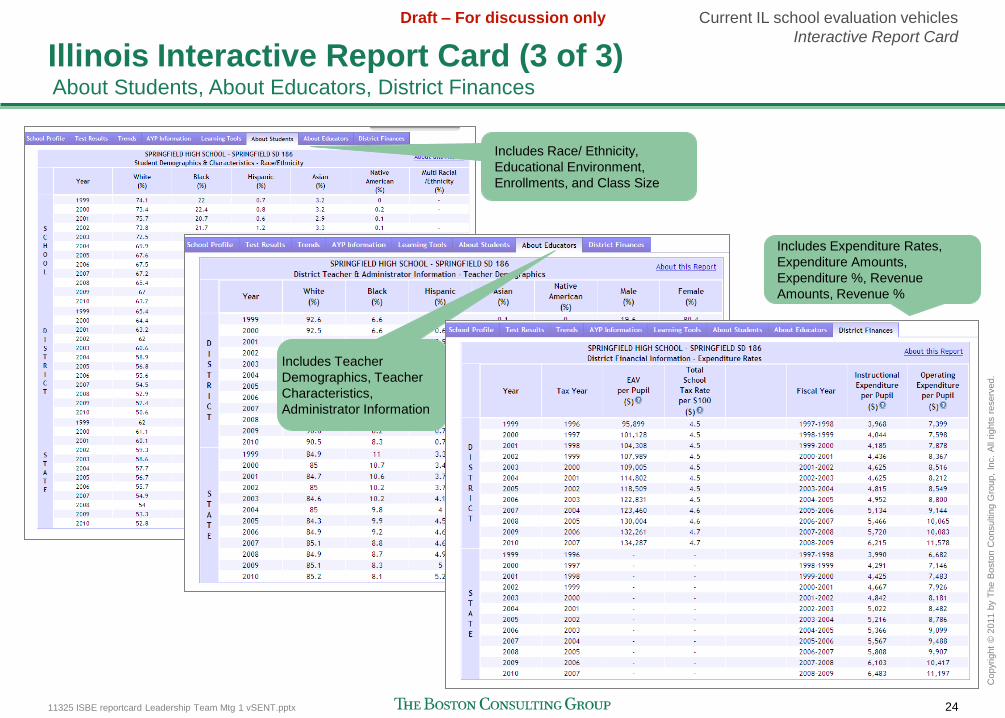
Illinois Interactive Report Card (3 of 3)About Students, About Educators, District Finances
Current IL school evaluation vehicles
Interactive Report Card
Includes Race/ Ethnicity,
Educational Environment,
Enrollments, and Class Size
Includes Teacher
Demographics, Teacher
Characteristics,
Administrator Information
Includes Expenditure Rates,
Expenditure Amounts,
Expenditure %, Revenue
Amounts, Revenue %

11325 ISBE reportcard Leadership Team Mtg 1 vSENT.pptx 25
Draft – For discussion only
Copyr
ight
© 2
011 b
y T
he B
osto
n C
onsultin
g G
roup,
Inc.
All
rights
reserv
ed.
Colorado (1 of 2)
Report card example—Colorado
"Plan" assigned to
school based on overall
framework score
Measure definitions to aid
reader comprehension

11325 ISBE reportcard Leadership Team Mtg 1 vSENT.pptx 26
Draft – For discussion only
Copyr
ight
© 2
011 b
y T
he B
osto
n C
onsultin
g G
roup,
Inc.
All
rights
reserv
ed.
Colorado (2 of 2)
Report card example—Colorado
Reports growth
percentiles and
resultant points
earned/ rating
Extensive
demographic
breakdowns of
performance
11325 ISBE reportcard Leadership Team Mtg 1 vSENT.pptx 27
Draft – For discussion only
Copyr
ight
© 2
011 b
y T
he B
osto
n C
onsultin
g G
roup,
Inc.
All
rights
reserv
ed.
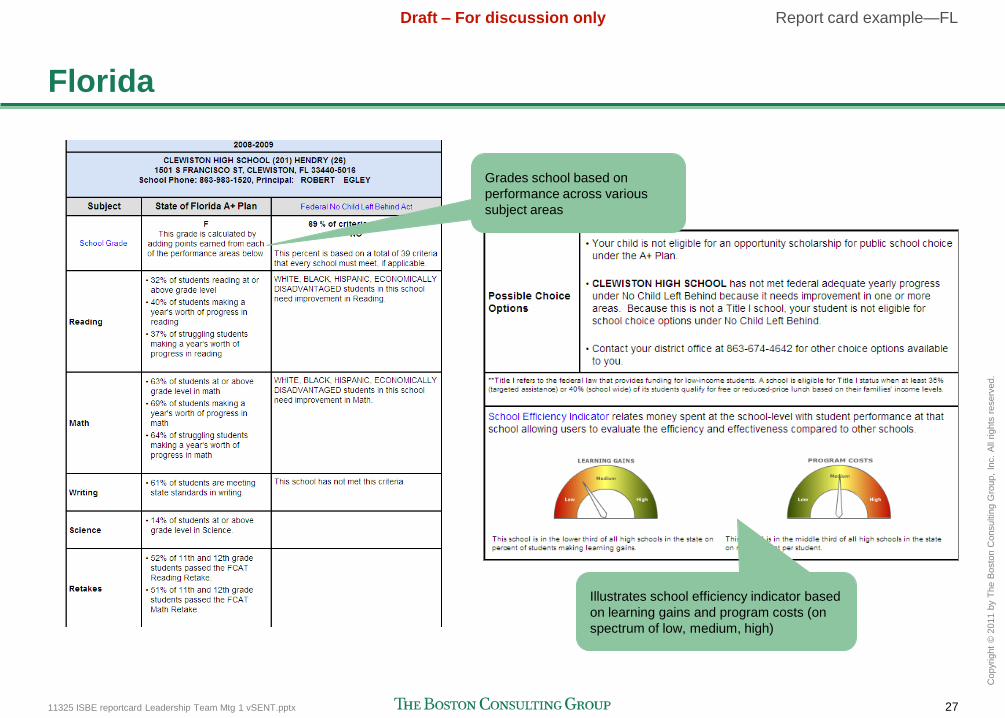
Florida
Report card example—FL
Grades school based on
performance across various
subject areas
Illustrates school efficiency indicator based
on learning gains and program costs (on
spectrum of low, medium, high)

11325 ISBE reportcard Leadership Team Mtg 1 vSENT.pptx 28
Draft – For discussion only
Copyr
ight
© 2
011 b
y T
he B
osto
n C
onsultin
g G
roup,
Inc.
All
rights
reserv
ed.
Maryland (1 of 2)
Report card example—MD
Click-through or selection
allows deep-dive into
demographic breakdowns of
performance
Tabs highlight 4
main sections
Can easily roll-up for
state or county view

11325 ISBE reportcard Leadership Team Mtg 1 vSENT.pptx 29
Draft – For discussion only
Copyr
ight
© 2
011 b
y T
he B
osto
n C
onsultin
g G
roup,
Inc.
All
rights
reserv
ed.
Maryland (2 of 2)
Report card example—MD
Provides on-track
indicators
Additional documents
offer supplementary
information, including
Grade 12 documented
decisions

11325 ISBE reportcard Leadership Team Mtg 1 vSENT.pptx 30
Draft – For discussion only
Copyr
ight
© 2
011 b
y T
he B
osto
n C
onsultin
g G
roup,
Inc.
All
rights
reserv
ed.
North Carolina
Report card example—NC
Includes academic performance
by student subgroup
Designates school based on student
performance and growth
Offers view of
school climate
via facts
regarding
school safety
and access to
technology

11325 ISBE reportcard Leadership Team Mtg 1 vSENT.pptx 31
Draft – For discussion only
Copyr
ight
© 2
011 b
y T
he B
osto
n C
onsultin
g G
roup,
Inc.
All
rights
reserv
ed.
Ohio
Overall school
designation
Adequate Yearly
Progress
measures include
test scores,
attendance and
graduation rates
Teacher
information
focuses on
qualifications
Performance
tracked by
group (ethnic
group, EL,
etc.)
First several
pages center
around test
scores
Report card example – Ohio

11325 ISBE reportcard Leadership Team Mtg 1 vSENT.pptx 32
Draft – For discussion only
Copyr
ight
© 2
011 b
y T
he B
osto
n C
onsultin
g G
roup,
Inc.
All
rights
reserv
ed.
South Carolina (1 of 2)
Report card example—SC
Offers ratings for absolute
performance and growth
and snapshot of peer school
performance
Reports performance graphically
and by performance level (below
basic, basic, proficient, advanced)
Approx. 9 page "Full Report"
includes more detailed
information about academic
performance
11325 ISBE reportcard Leadership Team Mtg 1 vSENT.pptx 33
Draft – For discussion only
Copyr
ight
© 2
011 b
y T
he B
osto
n C
onsultin
g G
roup,
Inc.
All
rights
reserv
ed.
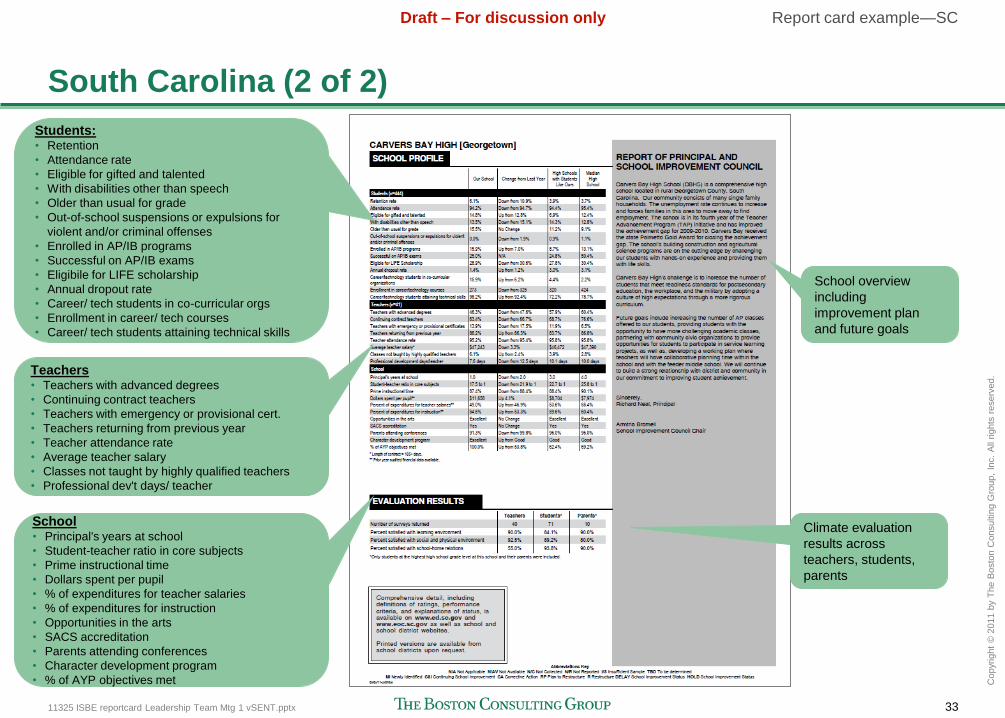
South Carolina (2 of 2)
Report card example—SC
Students:• Retention
• Attendance rate
• Eligible for gifted and talented
• With disabilities other than speech
• Older than usual for grade
• Out-of-school suspensions or expulsions for
violent and/or criminal offenses
• Enrolled in AP/IB programs
• Successful on AP/IB exams
• Eligibile for LIFE scholarship
• Annual dropout rate
• Career/ tech students in co-curricular orgs
• Enrollment in career/ tech courses
• Career/ tech students attaining technical skills
Teachers• Teachers with advanced degrees
• Continuing contract teachers
• Teachers with emergency or provisional cert.
• Teachers returning from previous year
• Teacher attendance rate
• Average teacher salary
• Classes not taught by highly qualified teachers
• Professional dev't days/ teacher
School• Principal's years at school
• Student-teacher ratio in core subjects
• Prime instructional time
• Dollars spent per pupil
• % of expenditures for teacher salaries
• % of expenditures for instruction
• Opportunities in the arts
• SACS accreditation
• Parents attending conferences
• Character development program
• % of AYP objectives met
Climate evaluation
results across
teachers, students,
parents
School overview
including
improvement plan
and future goals

11325 ISBE reportcard Leadership Team Mtg 1 vSENT.pptx 34
Draft – For discussion only
Copyr
ight
© 2
011 b
y T
he B
osto
n C
onsultin
g G
roup,
Inc.
All
rights
reserv
ed.
Chicago (current version)
Report card example—Chicago (current)
Tabs offer supplemental
information regarding
demographics; support/
resource programs;
extracurriculars
including arts and ports
and fitness
Overall performance
communicated as above
average, average, or
below average
CPS
average
performance
offered as
comparison
Student
connection
and parent
engagement
provide view
of climate

11325 ISBE reportcard Leadership Team Mtg 1 vSENT.pptx 35
Draft – For discussion only
Copyr
ight
© 2
011 b
y T
he B
osto
n C
onsultin
g G
roup,
Inc.
All
rights
reserv
ed.
Chicago (prior version)
Some metrics under
construction
4 key categories
and limited
number of metrics
within each
CPS rank
contextualizes
performance
3-year history of
performance offers
view of trends
Report card example—Chicago (prior)

11325 ISBE reportcard Leadership Team Mtg 1 vSENT.pptx 36
Draft – For discussion only
Copyr
ight
© 2
011 b
y T
he B
osto
n C
onsultin
g G
roup,
Inc.
All
rights
reserv
ed.
Dallas
Report card example—Dallas
Uses stars to
put schools into
quartiles for
each metric
Opening page highlights school
overview, enrollment and demographics,
feeder schools, awards, programs,
partnerships, extra-curriculars
Climate survey
responses offered
by parents and
students

11325 ISBE reportcard Leadership Team Mtg 1 vSENT.pptx 37
Draft – For discussion only
Copyr
ight
© 2
011 b
y T
he B
osto
n C
onsultin
g G
roup,
Inc.
All
rights
reserv
ed.
Denver
Report card example—Denver
Accreditation given
based on growth,
student achievement,
post-secondary
readiness growth and
status, student
engagement, re-
enrollment, and
parent satisfaction
Detailed information for each
scoring category – points
earned and possible reported
11325 ISBE reportcard Leadership Team Mtg 1 vSENT.pptx 38
Draft – For discussion only
Copyr
ight
© 2
011 b
y T
he B
osto
n C
onsultin
g G
roup,
Inc.
All
rights
reserv
ed.
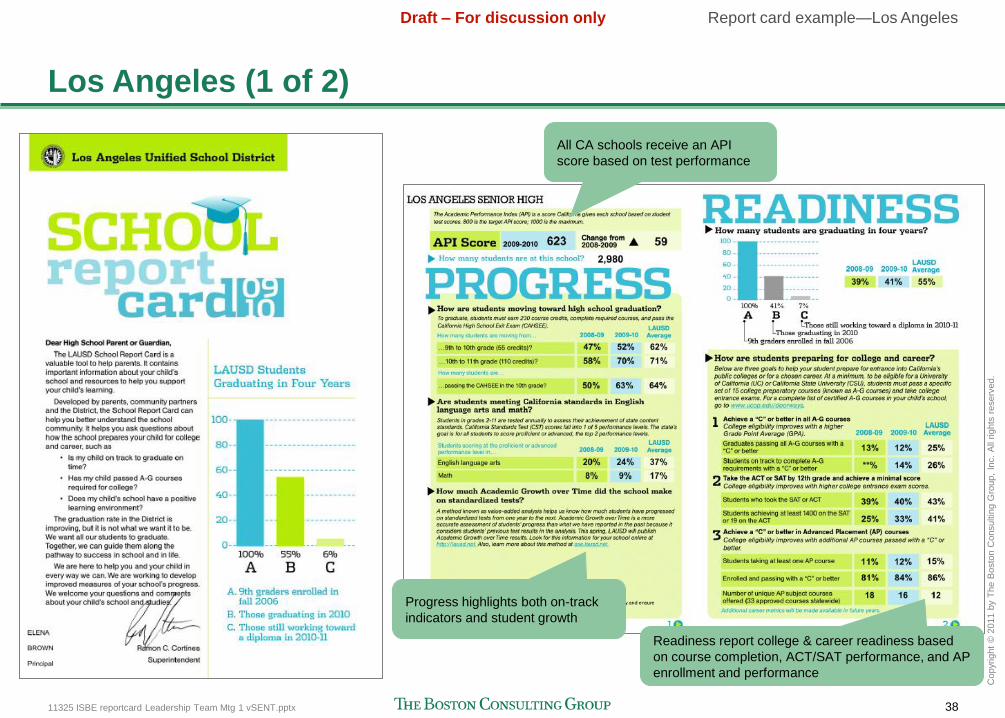
Los Angeles (1 of 2)
Report card example—Los Angeles
All CA schools receive an API
score based on test performance
Progress highlights both on-track
indicators and student growth
Readiness report college & career readiness based
on course completion, ACT/SAT performance, and AP
enrollment and performance
11325 ISBE reportcard Leadership Team Mtg 1 vSENT.pptx 39
Draft – For discussion only
Copyr
ight
© 2
011 b
y T
he B
osto
n C
onsultin
g G
roup,
Inc.
All
rights
reserv
ed.
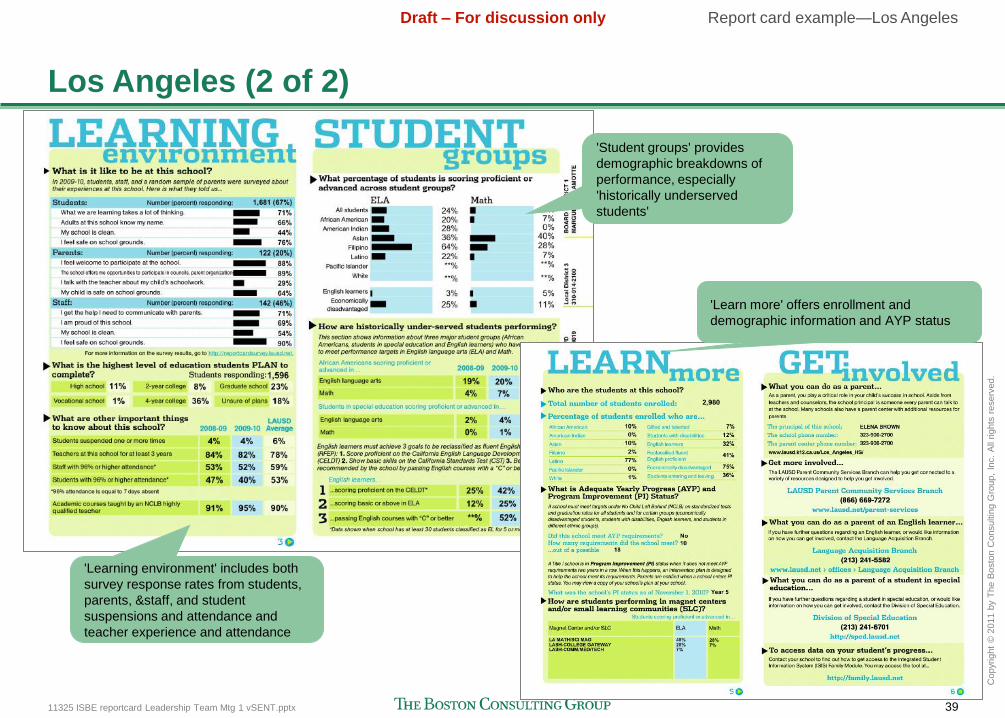
Los Angeles (2 of 2)
Report card example—Los Angeles
'Learning environment' includes both
survey response rates from students,
parents, &staff, and student
suspensions and attendance and
teacher experience and attendance
'Student groups' provides
demographic breakdowns of
performance, especially
'historically underserved
students'
'Learn more' offers enrollment and
demographic information and AYP status
11325 ISBE reportcard Leadership Team Mtg 1 vSENT.pptx 40
Draft – For discussion only
Copyr
ight
© 2
011 b
y T
he B
osto
n C
onsultin
g G
roup,
Inc.
All
rights
reserv
ed.
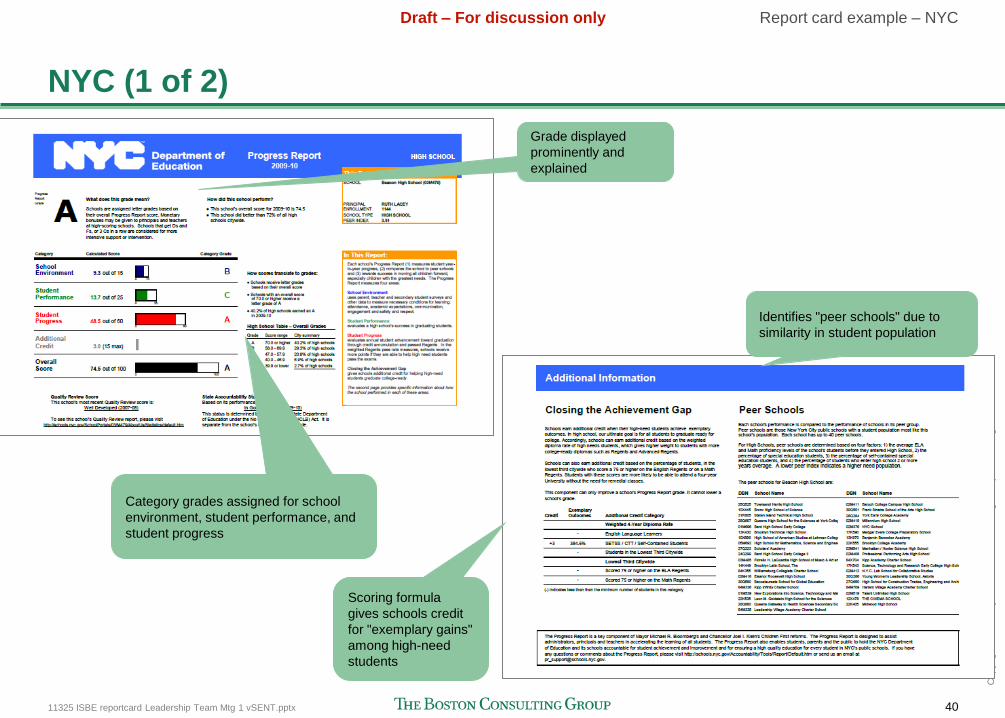
NYC (1 of 2)
Report card example – NYC
Scoring formula
gives schools credit
for "exemplary gains"
among high-need
students
Grade displayed
prominently and
explained
Category grades assigned for school
environment, student performance, and
student progress
Identifies "peer schools" due to
similarity in student population
11325 ISBE reportcard Leadership Team Mtg 1 vSENT.pptx 41
Draft – For discussion only
Copyr
ight
© 2
011 b
y T
he B
osto
n C
onsultin
g G
roup,
Inc.
All
rights
reserv
ed.
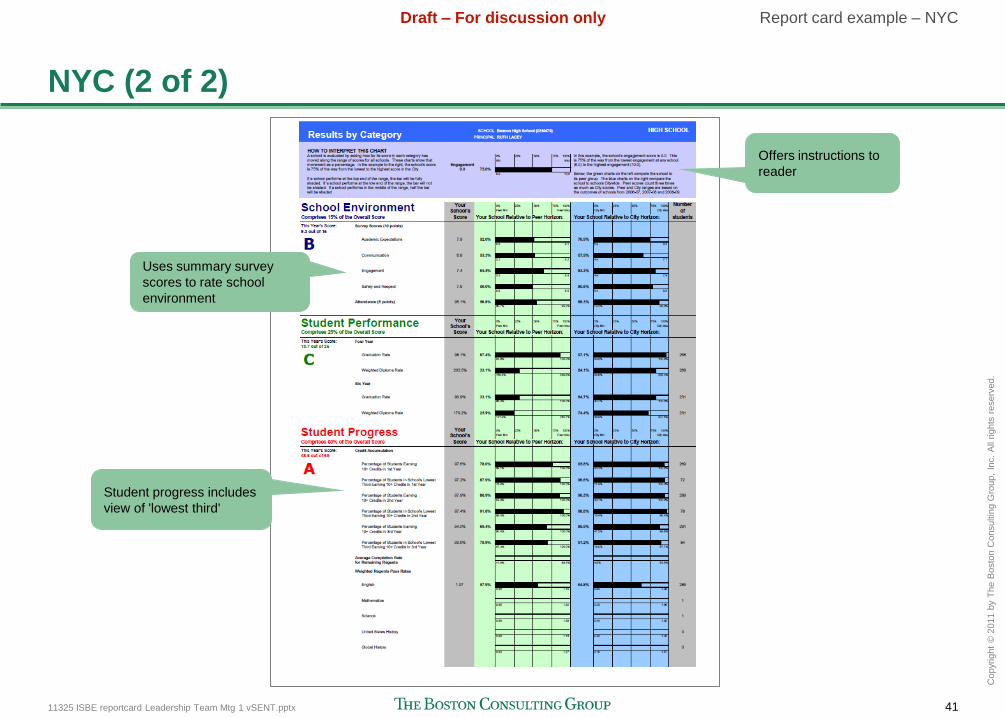
NYC (2 of 2)
Report card example – NYC
Uses summary survey
scores to rate school
environment
Offers instructions to
reader
Student progress includes
view of 'lowest third'

11325 ISBE reportcard Leadership Team Mtg 1 vSENT.pptx 42
Draft – For discussion only
Copyr
ight
© 2
011 b
y T
he B
osto
n C
onsultin
g G
roup,
Inc.
All
rights
reserv
ed.
Seattle
Report card example—Seattle
Displays data
using graphs and
also offers district
average
performance
Provides view on
climate from both
students and
family/ staff
2nd page highlights school mission,
goals, description and plans to achieve
goals, annual budget, and district
mission statement