Embed Size (px)
Citation preview

Introduction to Six SigmaILC Fall Conference
1 November, 2019

How do you problem solve today?
2

3

Agenda
4
Define
Project charter
Develop project plan
Process mapping
Measure
Gather baseline data
Descriptive statistics
Visualize data by charting
Measurement System Analysis
Analyze
Cause and effect analysis
5 Why’s
Improve
Brainstorming Techniques
Corrective actions
Control
Standard work instructions
Visual management
Poke-Yoke
Engineering Controls
SPC
Change management

Six Sigma
5
1σ2σ3σ4σ5σ6σ 1σ 2σ 3σ 4σ 5σ 6σ
LSL USL
Average

Six Sigma
6
187,800,000 pieces mail/day
Defect Rate(/million)
6σ 3.4 99.99966% 6395σ 230 99.97700% 431944σ 6,210 99.38000% 1,164,3603σ 66,800 93.33000% 12,526,2602σ 308,000 69.10000% 58,030,200
Sigma Level Yield Mail Errors (/day)

Standard Pork
7
Draw a pig
Tape the pig to the wall when you are done
You have 40 seconds – start now!

Standard Pork Activity
•Do the pigs look like each other? •Which pig is the right pig?
8

Define
9

Define – Project CharterBusiness ImpactWhy should the business do this?
How does this tie into company goals/ initiatives?
Opportunity/ Problem StatementWhat is occurring, what “pain” are people experiencing? What is the magnitude of the problem? When did the problem start?Where is the problem occurring?Why do we think we can generate value?
Key MetricsWhat are the improvement objectives and targets?
How do you measure success?Y = f(x)
Project ScopeScope in - what are the boundaries of the project?
Scope out - what areas will not be addressed?
Project Plan
When do you plan to hit key milestones?
Team Selection
Who is leading, co-leading and member of your team? Time commitment for each member
10
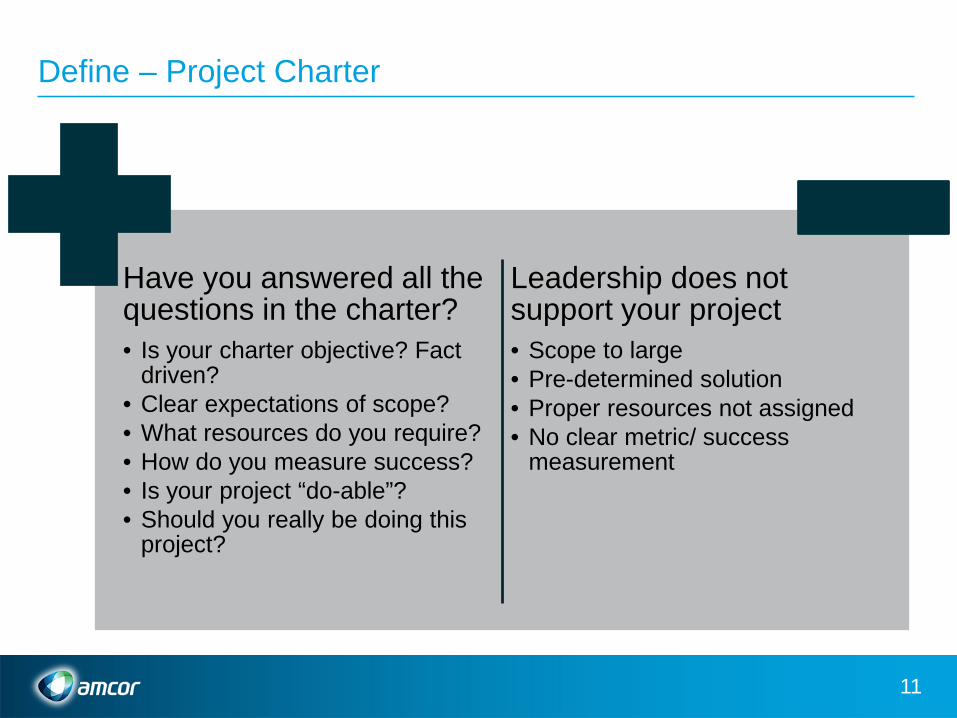
Define – Project Charter
Have you answered all the questions in the charter? • Is your charter objective? Fact
driven? • Clear expectations of scope? • What resources do you require? • How do you measure success?• Is your project “do-able”?• Should you really be doing this
project?
Leadership does not support your project• Scope to large• Pre-determined solution • Proper resources not assigned• No clear metric/ success
measurement
11

Define – Project CharterBusiness Impact
Uniform pigs are needed to ensure that they can easily fit into their pig crates in order to be taken to the Iowa State Fair.
Opportunity/ Problem Statement
Everyone’s pig looks different from each other, and we don’t know which pig is the correct pig. The problem started when everyone finished drawing their pigs at the ILC Fall Conference.
We can generate value by uniform pig pictures!
Key MetricsY = f(x)Pig Uniformity = f (height, overall shape)
Height Spec = 4.25” +/- 0.25”
Project ScopeScope in – Pig height and overall shape
Scope out – color of pig, paper type, writing material, thickness of lines
Project Plan
Complete by end of workshop on Tuesday, October 29th per project agenda
Team Selection
Leader: Ann BuckCo-leader: Theresa KoziolMembers: Workshop attendees
12

Project Agenda
13
Time Description Leader Notes9:00 AM Define Buck Project Plan, Project Charter, Process Mapping9:15 AM9:30 AM9:45 AM
10:00 AM10:15 AM10:30 AM10:45 AM11:00 AM11:15 AM11:30 AM11:45 AM12:00 PM
ImproveBuck
Prioritization, Corrective Actions
ControlBuck
Standard Work Instructions, Visual Management, Change Management
Baseline Data, Descriptive Statistics, Visualize Data, Measurement System Analysis
MeasureBuck
AnalyzeBuck
Cause and Effect Analysis, 5 Why's, FMEA

Define – Process Mapping
14
Process• Equipment• People• Materials• Measurements• Processes
Inputs = X’s Outputs = Y’s
• Y1• Y2• Y3• Y…• Yn

Process Map
15
Draw Pig• Paper• Pen• Tape Measure • Stop Watch
• Pig Shape• Pig Dimensions
Inputs = X’s Outputs = Y’s

Measure
16

Measure – Gather Baseline Data
Continuous Data
Variable measured on a scale that can be infinitely divided
• Temperature• Weight• Length• Cost • Time
Discrete Data
Counts
• Number of defects• Machine Center• Operators
17

Measure – Descriptive Statistics
Central Tendency
• Property that data tends to group around a “center” point
1. Mean 2. Median 3. Mode
Variability
• Property that the process does not produce the same results every time
1. Range2. Standard Deviation 3. Variance
18

Measure – Descriptive Statistics
Central Tendency
• Mean• Average of a set of data
• Mode• Most frequently observed value in a group
• Median• If you were to arrange your data in ascending or descending order, the data point in the
center
19

Measure – Descriptive Statistics
Variability
• Range• Difference between the max and min value of your data set
• Standard Deviation
• Variance • Square of standard deviation
20
How spread out the data is from the mean
Average degree that each data
point differs from the mean

Measure – Displaying Statistical Data
Time Series Charts
• Individual data values plotted in sequential order
Aggregate Data Charts
• Data values grouped together by their frequency of occurrence
21

Measure – Displaying Statistical Data
Time Series Charts
22
130117104917865523926131
2200
2000
1800
1600
1400
1200
1000
Index
KOV
Time Series Plot of KOV
9181716151413121111
0.048
0.036
0.024
0.012
0.000
Observation
Indi
vidu
al V
alue
_X=0.0278
UCL=0.04827
LCL=0.00733
9181716151413121111
0.03
0.02
0.01
0.00
Observation
Mov
ing
Rang
e
__MR=0.00770
UCL=0.02515
LCL=0
1
1
1
1
I-MR Chart of KOV

23
Measure – Displaying Statistical Data
Aggregate Data Charts
60-38-560-38-460-38-3
4000
3500
3000
2500
2000
1500
1000
KIV_1
KOV
Boxplot of KOV
40000.0
5000.0
0100.0
5100.0
0200.0
5200.0
0300.0
0001 0051 0002 0052 0003 0053 000
2522 301.4 3461517 325.8 741
Mean StDev N
K
ytisneD
VO
12_VIK
020
H lamroN
VOK fo margotsi
60-38-560-38-460-38-3
2100
2000
1900
1800
1700
1600
1500
1400
1300
KIV_1
KOV
Interval Plot of KOV95% CI for the Mean
Individual standard deviations were used to calculate the intervals.
4000350030002500200015001000KOV
Dotplot of KOV
Each symbol represents up to 3 observations.
0.07500.06250.05000.03750.02500.01250.0000
LSL 0Target *USL 0.054Sample Mean 0.0309401Sample N 666StDev(Overall) 0.0127486StDev(Within) 0.0120218
Process Data
Pp 0.71PPL 0.81PPU 0.60Ppk 0.60Cpm *
Cp 0.75CPL 0.86CPU 0.64Cpk 0.64
Potential (Within) Capability
Overall Capability
PPM < LSL 0.00 7613.26 5031.41PPM > USL 33033.03 35239.24 27544.55PPM Total 33033.03 42852.50 32575.95
Observed Expected Overall Expected WithinPerformance
LSL USLOverallWithin
Process Capability Report for Gaugeband_1
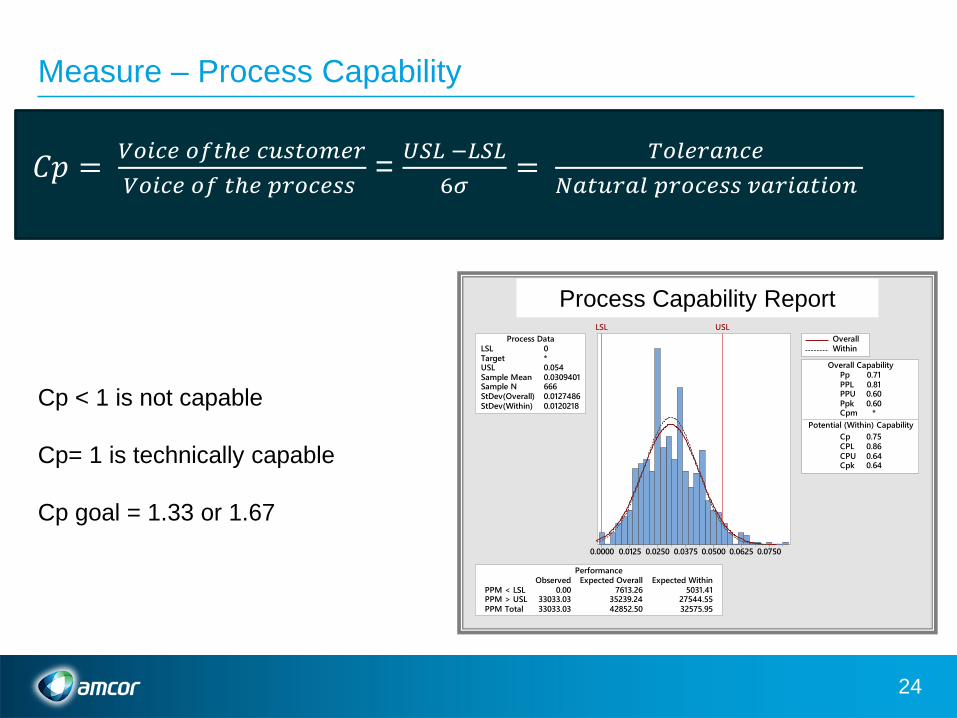
Measure – Process Capability
24
𝐶𝐶𝐶𝐶 = 𝑉𝑉𝑉𝑉𝑉𝑉𝑉𝑉𝑉𝑉 𝑉𝑉𝑜𝑜𝑜𝑜𝑜𝑉𝑉 𝑉𝑉𝑐𝑐𝑐𝑐𝑜𝑜𝑉𝑉𝑐𝑐𝑉𝑉𝑐𝑐𝑉𝑉𝑉𝑉𝑉𝑉𝑉𝑉𝑉𝑉 𝑉𝑉𝑜𝑜 𝑜𝑜𝑜𝑉𝑉 𝑝𝑝𝑐𝑐𝑉𝑉𝑉𝑉𝑉𝑉𝑐𝑐𝑐𝑐
= 𝑈𝑈𝑈𝑈𝑈𝑈 −𝑈𝑈𝑈𝑈𝑈𝑈6𝜎𝜎
= 𝑇𝑇𝑉𝑉𝑇𝑇𝑉𝑉𝑐𝑐𝑇𝑇𝑇𝑇𝑉𝑉𝑉𝑉𝑁𝑁𝑇𝑇𝑜𝑜𝑐𝑐𝑐𝑐𝑇𝑇𝑇𝑇 𝑝𝑝𝑐𝑐𝑉𝑉𝑉𝑉𝑉𝑉𝑐𝑐𝑐𝑐 𝑣𝑣𝑇𝑇𝑐𝑐𝑉𝑉𝑇𝑇𝑜𝑜𝑉𝑉𝑉𝑉𝑇𝑇
Process Capability Report
Cp < 1 is not capable
Cp= 1 is technically capable
Cp goal = 1.33 or 1.67

Measure – Process Capability
Defect Rate(/million)
6σ 3.4 99.99966% 2 6395σ 230 99.97700% 1.67 431944σ 6,210 99.38000% 1.33 1,164,3603σ 66,800 93.33000% 1 12,526,2602σ 308,000 69.10000% 0.33 58,030,200
Sigma Level Yield Mail Errors (/day)Cpk
25

SWI for Measuring Pig
1.Locate your pig and remove from wall2.Obtain measuring device3.Measure height of pig4.Record pig height
26

What can we evaluate?
1.Central Tendency a) Meanb) Medianc) Mode
2.Variability a) Rangeb) Standard Deviation c) Variance
3. Time Seriesa) I-MR
4.Aggregate a) Box Plotb) Histogramc) Interval Plot
5.Process Capability
27

Process Capability
Defect Rate(/million)
6σ 3.4 99.99966% 25σ 230 99.97700% 1.674σ 6,210 99.38000% 1.333σ 66,800 93.33000% 12σ 308,000 69.10000% 0.33
Sigma Level Yield Cpk
28

Measure – Measurement System Analysis
𝜎𝜎 𝑀𝑀𝑉𝑉𝑇𝑇𝑐𝑐𝑐𝑐𝑐𝑐𝑉𝑉𝑐𝑐𝑉𝑉𝑇𝑇𝑜𝑜𝑈𝑈𝑆𝑆𝑐𝑐𝑜𝑜𝑉𝑉𝑐𝑐
2 = 𝜎𝜎𝑅𝑅𝑉𝑉𝑝𝑝𝑉𝑉𝑇𝑇𝑜𝑜𝑇𝑇𝑅𝑅𝑉𝑉𝑇𝑇𝑉𝑉𝑜𝑜𝑆𝑆2 + 𝜎𝜎 𝑅𝑅𝑉𝑉𝑝𝑝𝑐𝑐𝑉𝑉𝑅𝑅𝑐𝑐𝑉𝑉𝑉𝑉𝑅𝑅𝑉𝑉𝑇𝑇𝑉𝑉𝑜𝑜𝑆𝑆2
29
Variation due to Gage
• Same part• Same instrument• Same operator• Same set-up• Same environ.
Variation due to Operators
• Different operators
• Same instrument• Same part

Measure – Setting up MSA
30
1. Decide on basic design - two MSA Standards for Gage R&R
2. Plan for TestChoose study parts that represent the populationChoose operators that would normally perform the testDo not have the operator complete all the replicates in succession
3. Test – Observe the operators
MSA Standard # Parts # Repeats # OperatorsShort Form 5 2 2Long Form 10 3 3

Measure – MSA Form
31
RunOrder Parts Operators Measurement1 2 Operator 12 4 Operator 13 1 Operator 14 5 Operator 15 3 Operator 16 4 Operator 27 3 Operator 28 1 Operator 29 2 Operator 2
10 5 Operator 211 1 Operator 112 4 Operator 113 3 Operator 114 5 Operator 115 2 Operator 116 1 Operator 217 2 Operator 218 4 Operator 219 5 Operator 220 3 Operator 2

Measure – Measurement System Analysis
32
Gage name: Date of study:
Reported by: Tolerance: Misc:
Part-to-PartReprodRepeatGage R&R
80
40
0
Perc
ent
% Contribution% Study Var
10 9 8 7 6 5 4 3 2 110 9 8 7 6 5 4 3 2 110 9 8 7 6 5 4 3 2 1
0.030
0.015
0.000
Parts
Sam
ple
Rang
e
_R=0.00813
UCL=0.02094
LCL=0
Operator 1 Operator 2 Operator 3
10 9 8 7 6 5 4 3 2 110 9 8 7 6 5 4 3 2 110 9 8 7 6 5 4 3 2 1
0.05
0.03
0.01
Parts
Sam
ple
Mea
n
__X=0.02836UCL=0.03668
LCL=0.02003
Operator 1 Operator 2 Operator 3
10987654321
0.050
0.025
0.000
Parts
Operator 3Operator 2Operator 1
0.050
0.025
0.000
Operators
10987654321
0.05
0.03
0.01
Parts
Aver
age
Operator 1Operator 2Operator 3
Operators
Components of Variation
R Chart by Operators
Xbar Chart by Operators
Measurement by Parts
Measurement by Operators
Parts * Operators Interaction
Gage R&R (ANOVA) Report for Measurement• How do we evaluate if our measurement system is capable?
• Measurement System capability index: 1. % Contribution (% Gage R&R)
Compares variation of each group to overall variation
2. % Study Variation Compares measurement system variation to total variation
3. Discrimination Index (# of Distinct Categories) # of divisions that the measurement system can accurately measure across product variation

Results
33
Gage name: Date of study:
Reported by: Tolerance: Misc:
Part-to-PartReprodRepeatGage R&R
100
50
0
Perc
ent
% Contribution% Study Var
5432154321
0.10
0.05
0.00
Parts
Sam
ple
Rang
e
_R=0.038
UCL=0.1242
LCL=0
Operator 1 Operator 2
5432154321
4.8
4.4
4.0
Parts
Sam
ple
Mea
n
__X=4.377UCL=4.448LCL=4.306
Operator 1 Operator 2
54321
4.8
4.4
4.0
Parts
Operator 2Operator 1
4.8
4.4
4.0
Operators
54321
4.8
4.4
4.0
Parts
Aver
age
Operator 1Operator 2
Operators
Components of Variation
R Chart by Operators
Xbar Chart by Operators
Measurement by Parts
Measurement by Operators
Parts * Operators Interaction
Gage R&R (ANOVA) Report for Measurement

Measure – MSA Tips
1. Go back to your notes of your observations during the test
2. Can you standardize any difference you saw?
3. Retrain
4. Re-do Gage R&R
34

Analyze
35

Analyze – Cause and Effect Analysis
36
Problem
Fishbone Diagram

Assessment of Potential Causes
• Start with the highest ranked potential causes
• Define how you can determine if they are actual causes?• Is there data you can review or collect?• Talk to people involved in the process?• Make observations?
• Once you’ve determined actual or potential causes, then proceed to the 5 Why’s…
37

Analyze – 5 Why’s
Cause 1 Cause 2 Cause 3
Why 1?Why 2?Why 3? Why 4?Why 5?
38
Ask “why” 5x’s to get to root cause!
Five Whys Jefferson Memorial Example

Improve
39
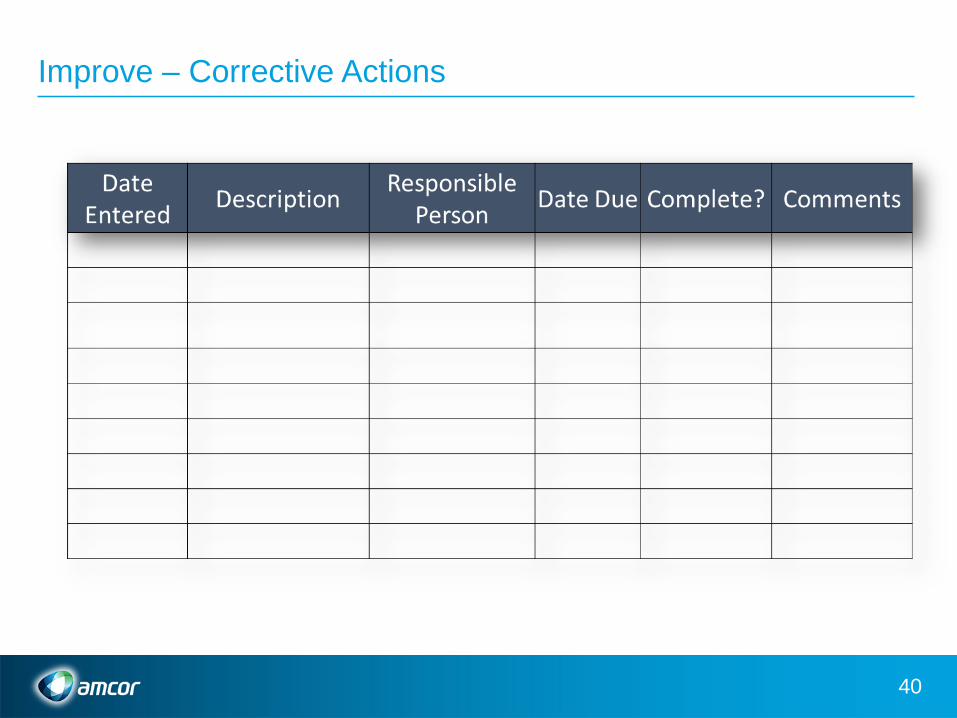
Improve – Corrective Actions
40

Standard Pork
Take a piece of paper and fold it into thirds –both portrait and landscape direction. Unfold it again/lay flat.
41

Standard Pork
42
Draw a pig
Tape the pig to the wall when you are done
You have 40 seconds – when we go to the next slide!

43
1
2 3
4
5
6
7
8
9
10
11
12
13
43

Standard Pork
•Pigs any better in this round? •Where the instructions clear? •Did the instructions set you up for success?
44

Round II: Measure your
pigs height
45

What can we evaluate?
1.Central Tendency a) Meanb) Medianc) Mode
2.Variability a) Rangeb) Standard Deviation c) Variance
3. Time Seriesa) I-MR
4.Aggregate a) Box Plotb) Histogramc) Interval Plot
5.Process Capability
46

Control
47

Control
Engineering Controls
Poke-Yoke
Visual Controls
Standard Work
48

Control – Standard Work Instructions
49

Standard Pork – Standard Work
50
Draw a pig
Tape the pig to the wall when you are done
You have 40 seconds – when we go to the next slide!

Standard Work for Pig Drawing
0. Pick up your pen (1 sec)
1. Draw a letter M at the top left intersection. Bottom center of M touches the intersection. (3 sec)
2. Draw the letter W at the bottom left intersection. Top center of W touches the intersection. (3 sec)
3. Draw the letter W at the bottom right intersection. Top center of W touches the intersection. (3 sec)
4. Draw an arc from the letter M to the top right intersection. (2 sec)
5. Draw another arc from the top right intersection to the bottom right W. (4 sec)
6. Draw an arc between the two bottom W’s. (2 sec)
7. Draw the letter O in the center left box. (3 sec)
8. Draw an arc from the letter M to the tangent of the circle. (2 sec)
9. Draw an arc from the left W to the tangent of the circle. (2 sec)
10. Draw an arc for the eye. Half way between M and circle. (2 sec)
11. Draw an arc for the mouth. Half way between W and circle. Must be a happy pig!! (2 sec)
12. Draw the cursive letter e near the top of arc on the right. (3 sec)
13. And finally draw two dots in the middle of the circle for the pigs nose. (3 sec)
14. Put your pen down and hang up your pig. (5 sec)
51
Total Time Required = 40 sec.

Round III: Measure your
pigs height
52

What can we evaluate?
1.Central Tendency a) Meanb) Medianc) Mode
2.Variability a) Rangeb) Standard Deviation c) Variance
3. Time Seriesa) I-MR
4.Aggregate a) Box Plotb) Histogramc) Interval Plot
5.Process Capability
53

Standard work for pig drawing
54
0. Pick up your pen (1 sec)
1. Draw a letter M at the top left intersection. Bottom center of M touches the intersection. (3 sec)
2. Draw the letter W at the bottom left intersection. Top center of W touches the intersection. (3 sec)
3. Draw the letter W at the bottom right intersection. Top center of W touches the intersection. (3 sec)
4. Draw an arc from the letter M to the top right intersection. (2 sec)
5. Draw another arc from the top right intersection to the bottom right W. (4 sec)
6. Draw an arc between the two bottom W’s. (2 sec)
7. Draw the letter O in the center left box. (3 sec)
8. Draw an arc from the letter M to the tangent of the circle. (2 sec)
9. Draw an arc from the left W to the tangent of the circle. (2 sec)
10. Draw an arc for the eye. Half way between M and circle. (2 sec)
11. Draw an arc for the mouth. Half way between W and circle. Must be a happy pig!! (2 sec)
12. Draw the cursive letter e near the top of arc on the right. (3 sec)
13. And finally draw two dots in the middle of the circle for the pigs nose. (3 sec)
14. Put your pen down and hang up your pig. (5 sec) Total Time Required = 40 sec.
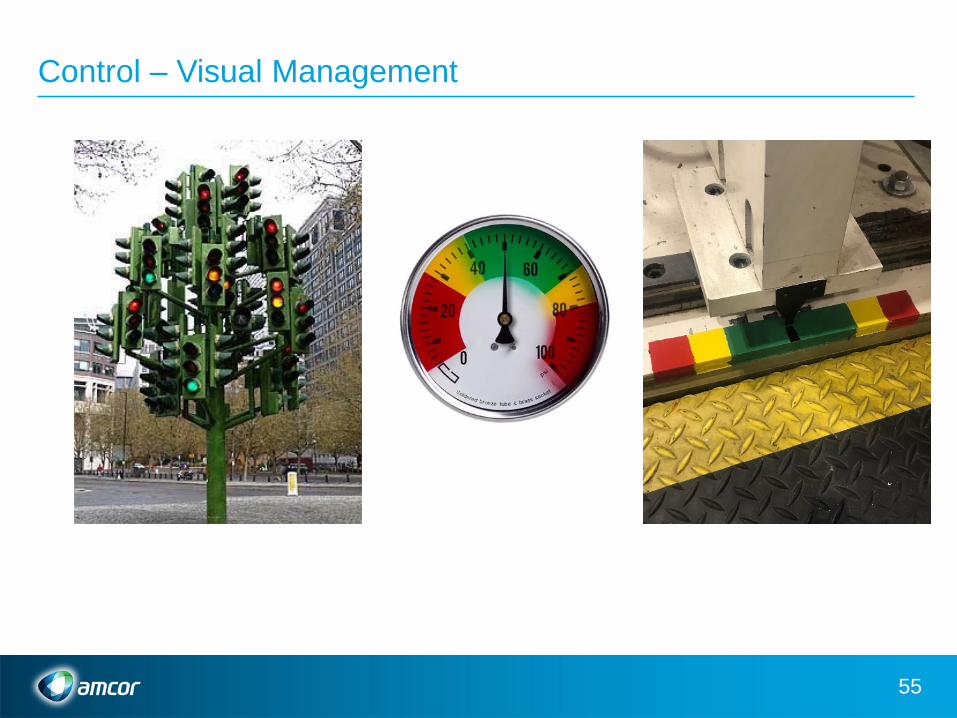
Control – Visual Management
55

Control – Poke-yoke
56

Control – Engineering Controls
57

Control – Statistical Process Control (SPC)
58
9181716151413121111
0.048
0.036
0.024
0.012
0.000
Observation
Indi
vidu
al V
alue
_X=0.0278
UCL=0.04827
LCL=0.00733
9181716151413121111
0.03
0.02
0.01
0.00
Observation
Mov
ing
Rang
e
__MR=0.00770
UCL=0.02515
LCL=0
1
1
1
1
I-MR Chart of KOV

Control - Change Management
1. If you don’t include everything in the numerator, you will have no change
2. The stronger your numerator, the easier it will be to overcome resistance
3. The stronger your resistance, the harder it will be to change
59
𝐶𝐶𝐶𝐶𝐶𝐶𝐶𝐶𝐶𝐶𝐶 =𝑉𝑉𝑉𝑉𝑉𝑉𝑉𝑉𝑉𝑉𝐶𝐶 × 𝐹𝐹𝑉𝑉𝐹𝐹𝑉𝑉𝐹𝐹 𝑆𝑆𝐹𝐹𝐶𝐶𝐶𝐶𝑉𝑉 × 𝐶𝐶𝐶𝐶𝐹𝐹𝐹𝐹𝐶𝐶𝐶𝐶𝐹𝐹 𝑆𝑆𝐹𝐹𝐶𝐶𝐹𝐹𝐶𝐶 × 𝑃𝑃𝐹𝐹𝐶𝐶𝑉𝑉𝑉𝑉𝐶𝐶𝐹𝐹𝐶𝐶 𝐹𝐹𝑉𝑉 𝐶𝐶𝐶𝐶𝐶𝐶𝐶𝐶𝐶𝐶𝐶
𝑅𝑅𝐶𝐶𝑉𝑉𝑉𝑉𝑉𝑉𝐹𝐹𝐶𝐶𝐶𝐶𝑅𝑅𝐶𝐶

Control – Change Management
60

61
Questions?