Embed Size (px)
Citation preview
I'l-l
Me
-A--- T11JNLQF1EI -A ASD
zzr% SUPOR OHIOTY4 lo" '0 C,
~'.C'4. 210
4~biA'174-ft

BestAvailable
Copy
AIRFIELD PAVEMENT EVALUATION
SPRINGFIELD A1NG BASE
OHIO
PREPARED FOR
AIR NATIONAL GUARD
BY
HQ AFCESA PAVEMENT EVALUATION TEAM
CAPT MARK S. BUNCHER, P.E.SMSGT ANTHONY D. MULLINAX
TSGT STEVEN H. HUDSONSSGT TIMOTHY 0. PATRICKMR JOHN T. CLARK III
HQ AIR FORCE CIVIL ENGINEERING SUPPORT AGENCYTYNDALL AIR FORCE BASE
FLORIDA 32403-6001
PUBLISHED SEPTEMBER 1991
Ju t I/ t o
A_ .
Dii T'i .-t ....
I
TABLE OF CONTENTS
Page
EXECUTIVE SUMMARY ..... .. ....... * ** **.............. ii
SECTION I: INTRODUCTION .................................. 1
SECTION II: BACKGROUND DATA ............................... 4
SECTION III: TEST PROCEDURES ................................. 6
SECTION IV: METHODOLOGY OF ANALYSIS ....................... 7
SECTION V: PAVEMENT ASSESSMENT ............................. 11
SECTION VI: CONCLUSIONS/RECOMMENDATIONS ................... 16
GLOSSARY .................................................... .18
CONVERSION FACTORS .................................... 20
REFERENCES .................................................. 21
DISTRIBUTION ................................................ 22
APPENDICES
APPENDIX A - AIRFIELD LAYOUT ........................ A-I
APPENDIX B - CONSTRUCTION HISTORY ........................ B-i
APPENDIX C - FIELD TEST/CORE LOCATIONS AND RESULTS .... C-i
APPENDIX D - CONDITION SURVEY AND PHOTOS .............. D-I
APPENDIX E - SUMMARY OF PHYSICAL PROPERTY DATA........ E-IAND LAB TESTING RESULTS
APPENDIX F - ALLOWABLE GROSS LOADS AND PCN'S .......... F-I
APPENDIX G - RELATED INFORMATION ...................... G-I
i
EXECUTIVE SUMMARY
A Headquarters Air Force Civil Engineering Support Agency(HQ AFCESA) Pavement Evaluation Team conducted a destructivestructural airfield evaluation of Springfield Air NationalGuard Base, Ohio, during 2-9 April 1991. Field testingincluded CBR and plate bearing tests in seven pits, 48 coresand 34 Dynamic Cone Penetrometer tests. The base course onboth runways tested very weak, especially the top few inches.Water is filtering through the cracked asphalt and weakeningthe top few inches. Overall pavement strengths were low on allrunway flexible features because of this weak layer. Thealligator cracking on both runways verifies the pavement hasbeen overloaded. The main runway is in POOR condition but isplanned for reconstruction late this year, which includesrecompacting the base. A serious problem which our lab testingrevealed, however, is that the base material is moderatelyfrost susceptible. The strength during a freeze-thaw periodwill be greatly reduced, even after reconstruction. Thesecondary runway is in VERY POOR condition and has structurallyfailed due to the weak base. Only very light aircraft shouldoperate here. The majority of taxiways and the parking apronrate VERY GOOD; however, crack sealing is required to preventfurther deteriortion. Wide shrinkage cracks on the asphalttaxiways must be repaired to prevent water from washing awaythe base. Thin structural cracks on the concrete apron shouldbe routed and sealed to prevent spalling. Repairing thesecracks will be even more critical when the 178 TFG convertsfrom A-7s to F-16s in 1993, since the F-16 is very FODsusceptible.
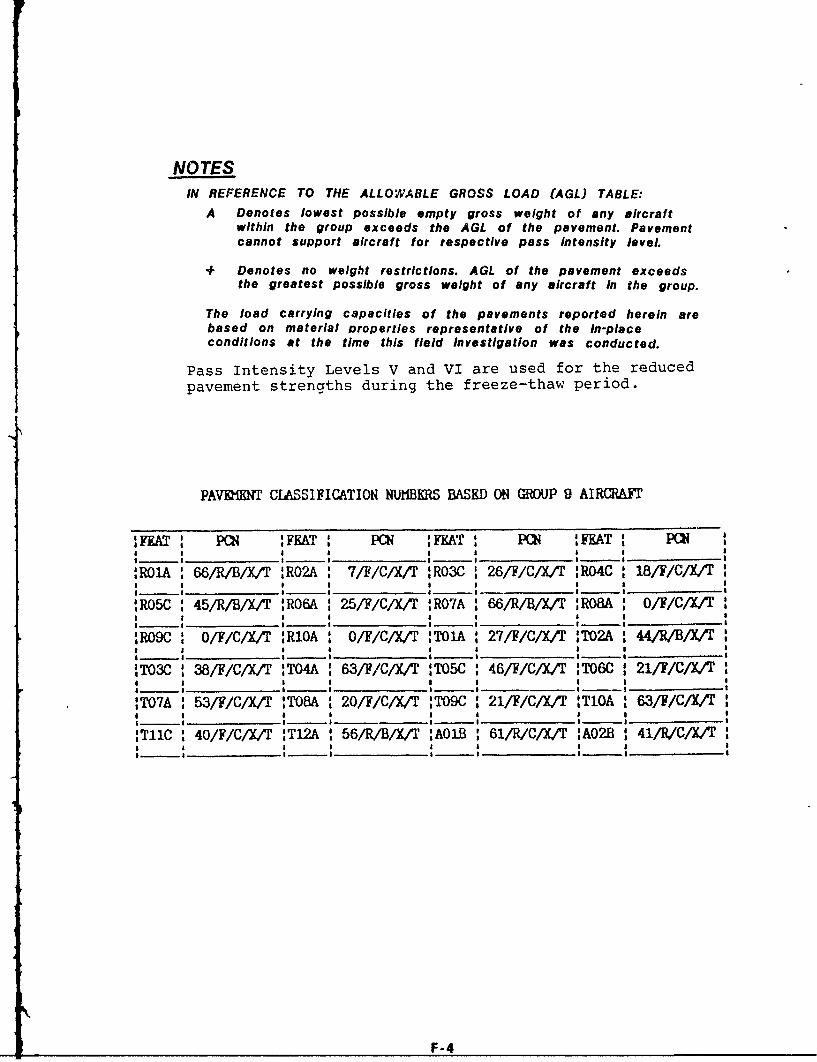
The "Runway PCN" which is to be reported in the FLIP chart forRunway 06/24 is 18/F/C/X/T. This will increase once theplanned runway reconstruction project is completed in late 1992.
SECTION I: INTRODUCTION
A. 9gp
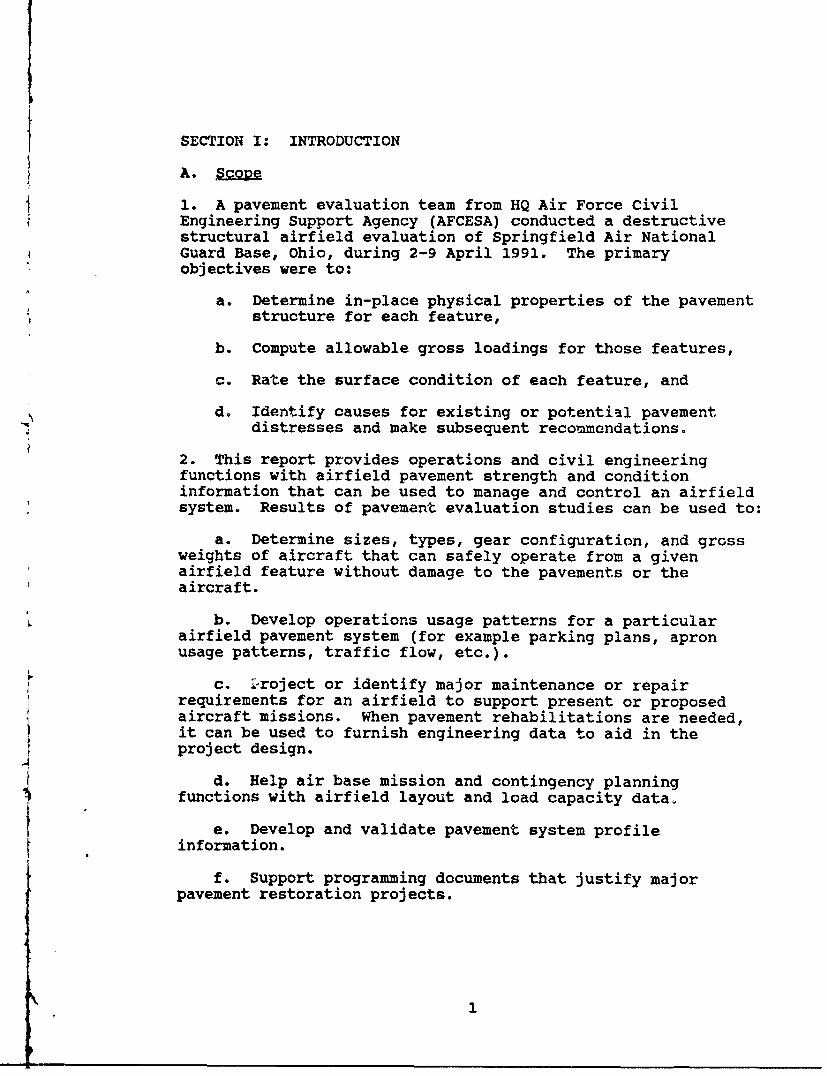
1. A pavement evaluation team from HQ Air Force CivilEngineering Support Agency (AFCESA) conducted a destructivestructural airfield evaluation of Springfield Air NationalGuard Base, Ohio, during 2-9 April 1991. The primaryobjectives were to:
a. Determine in-place physical properties of the pavementstructure for each feature,
b. Compute allowable gross loadings for those features,
c. Rate the surface condition of each feature, and
d. Identify causes for existing or potential pavementdistresses and make subsequent recommendations.
2. This report provides operations and civil engineeringfunctions with airfield pavement strength and conditioninformation that can be used to manage and control an airfieldsystem. Results of pavement evaluation studies can be used to:
a. Determine sizes, types, gear configuration, and grossweights of aircraft that can safely operate from a givenairfield feature without damage to the pavements or theaircraft.
b. Develop operations usage patterns for a particularairfield pavement system (for example parking plans, apronusage patterns, traffic flow, etc.).
c. roject or identify major maintenance or repairrequirements for an airfield to support present or proposedaircraft missions. When pavement rehabilitations are needed,it can be used to furnish engineering data to aid in theproject design.
d. Help air base mission and contingency planningfunctions with airfield layout and load capacity data.
e. Develop and validate pavement system profileinformation.
f. Support programming documents that justify majorpavement restoration projects.
1
3. Many detailed appendices are used for ease of reporting thevast amount of information gathered. A description of eachappendix is provided below.
Appendix Description
A Airfield Feature Layout Plan: Graphicallydepicts the different pavement featuresand designations of the airfield.
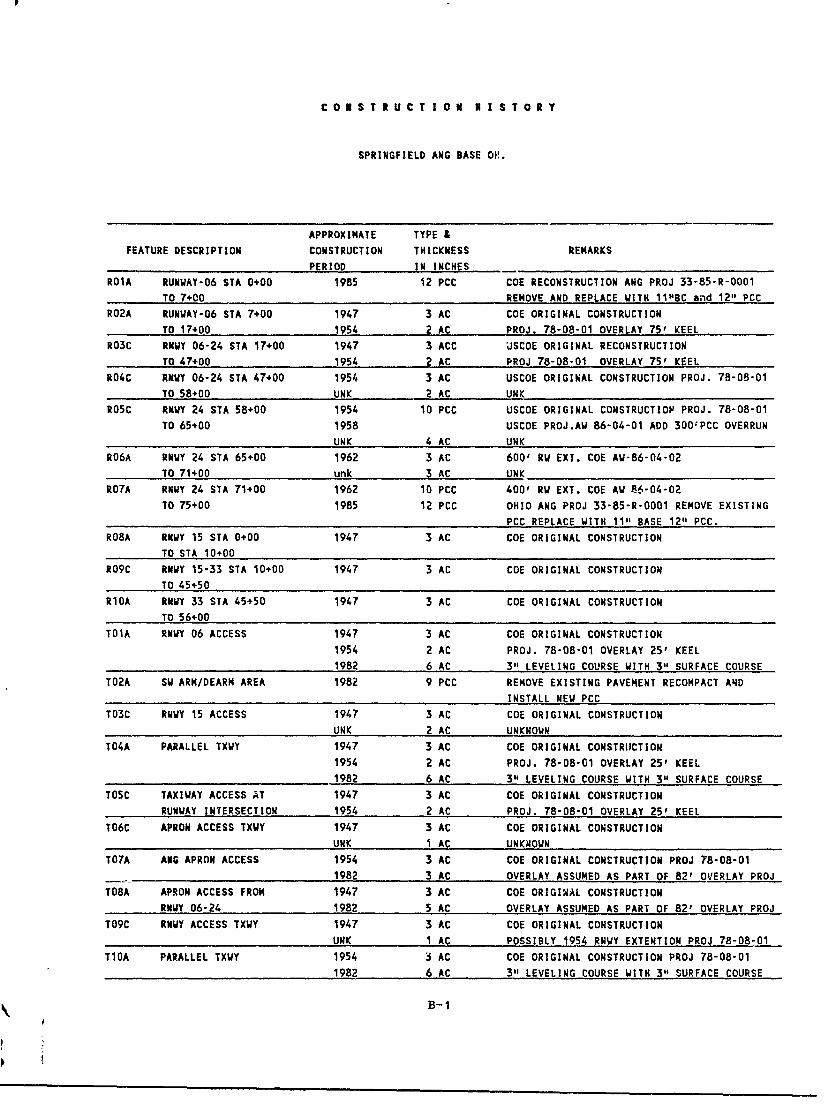
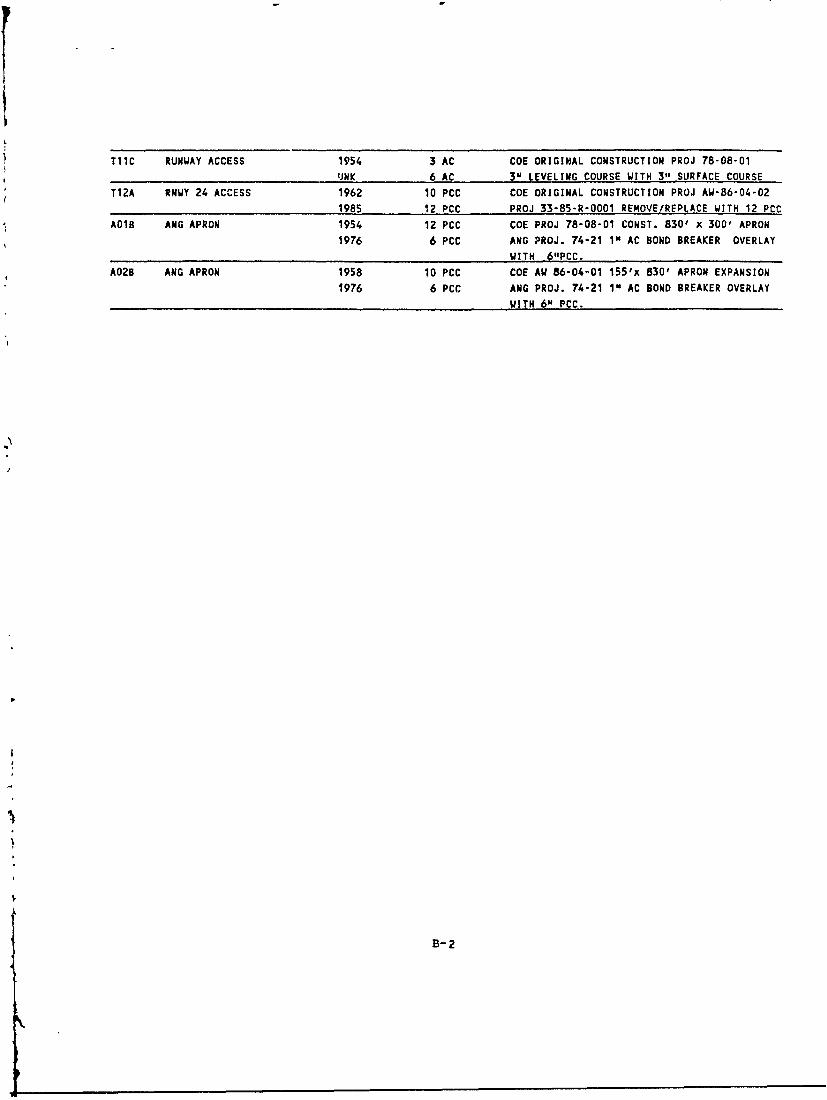
B Construction History: Contains an updatedconstruction history for the evaluatedfeatures.
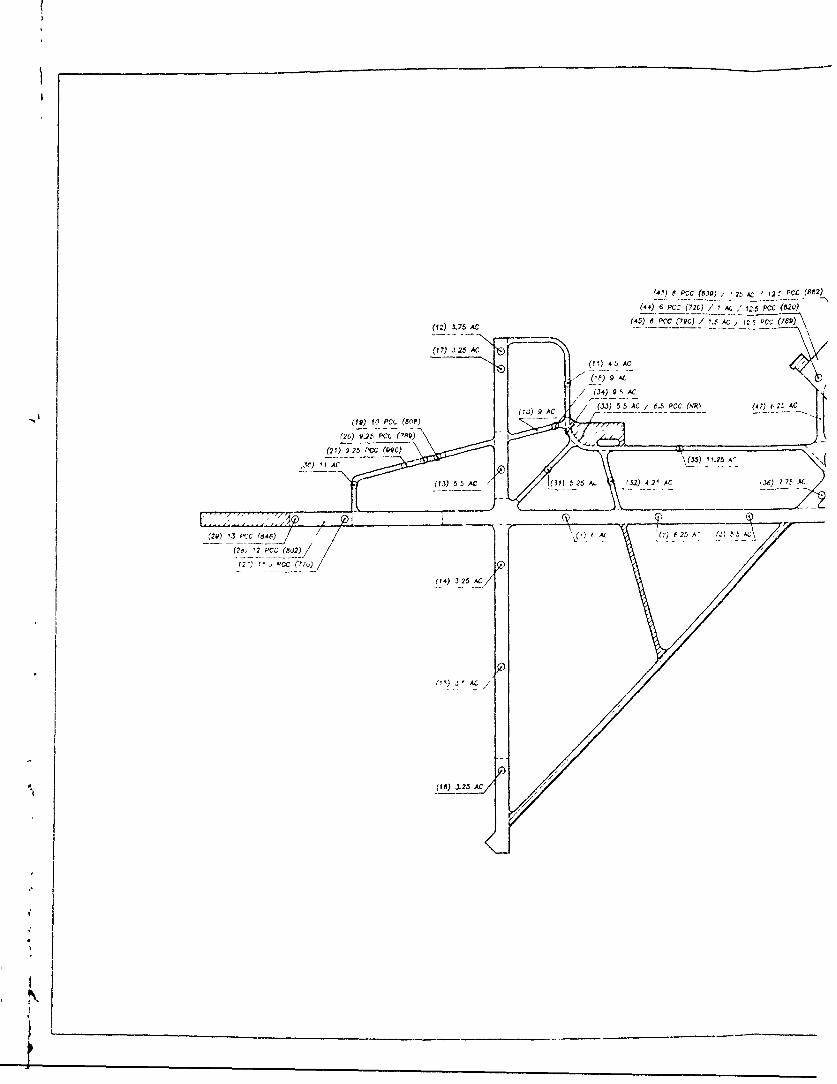
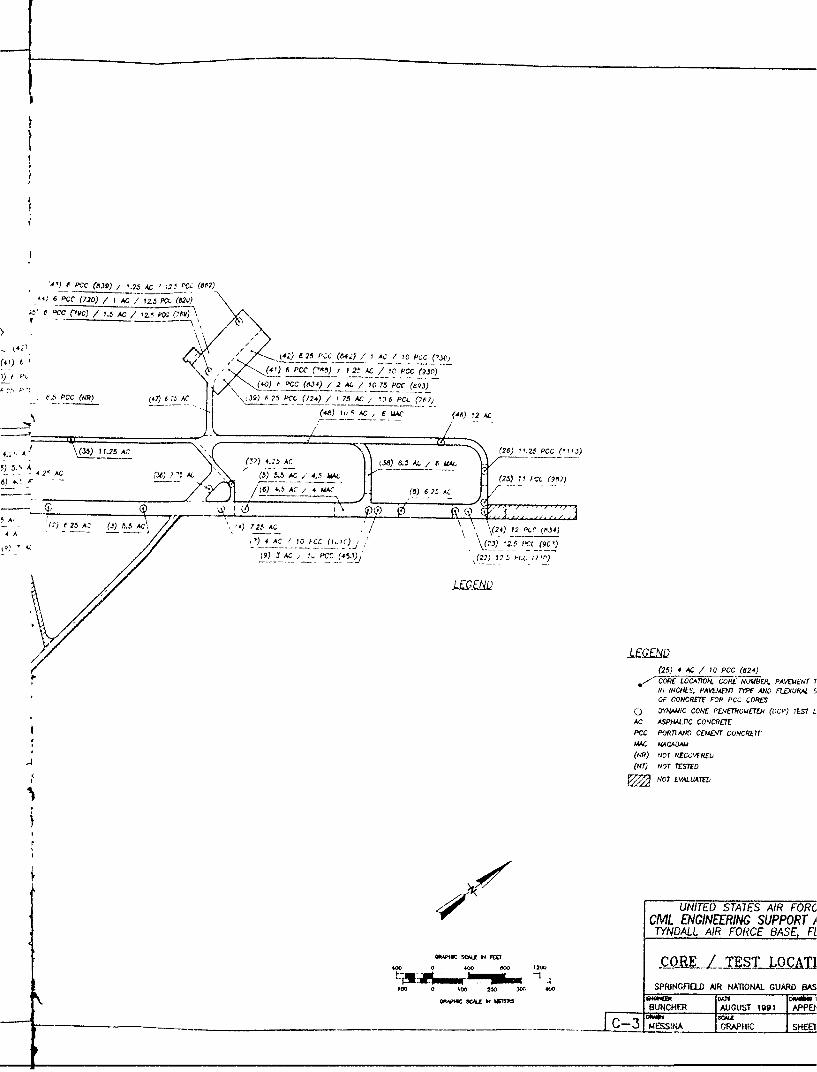
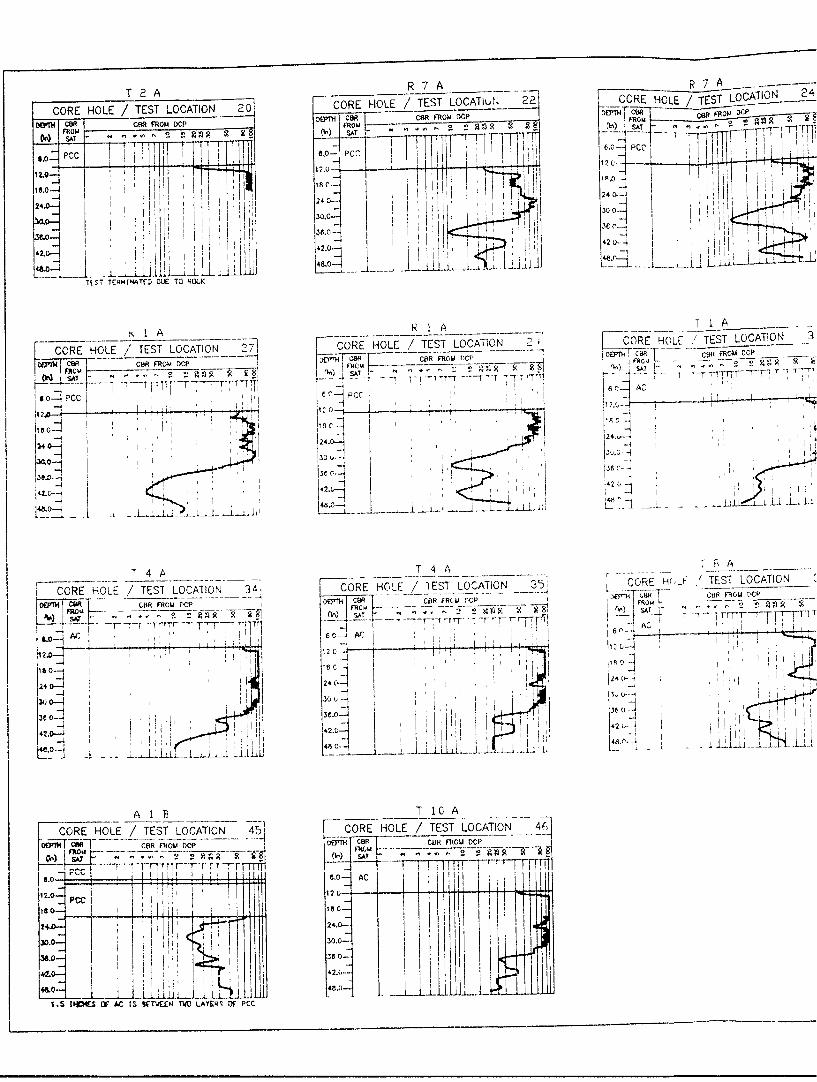
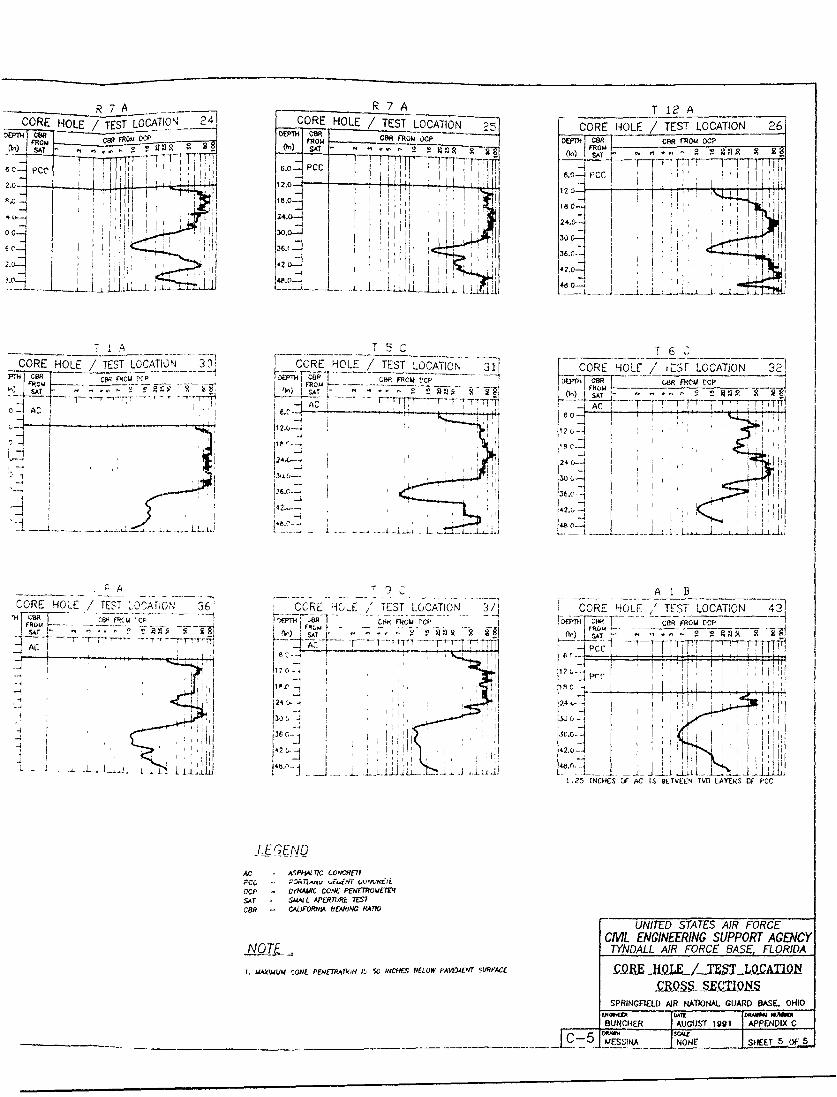
C Field Test/Core Locations and Results:Shows test pit locations and crosssections. Core locations, thicknesses andportland cement concrete (PCC) flexuralstrengths are documented on the coreplan. Also includes dynamic conepenetrometer (DCP) test results.
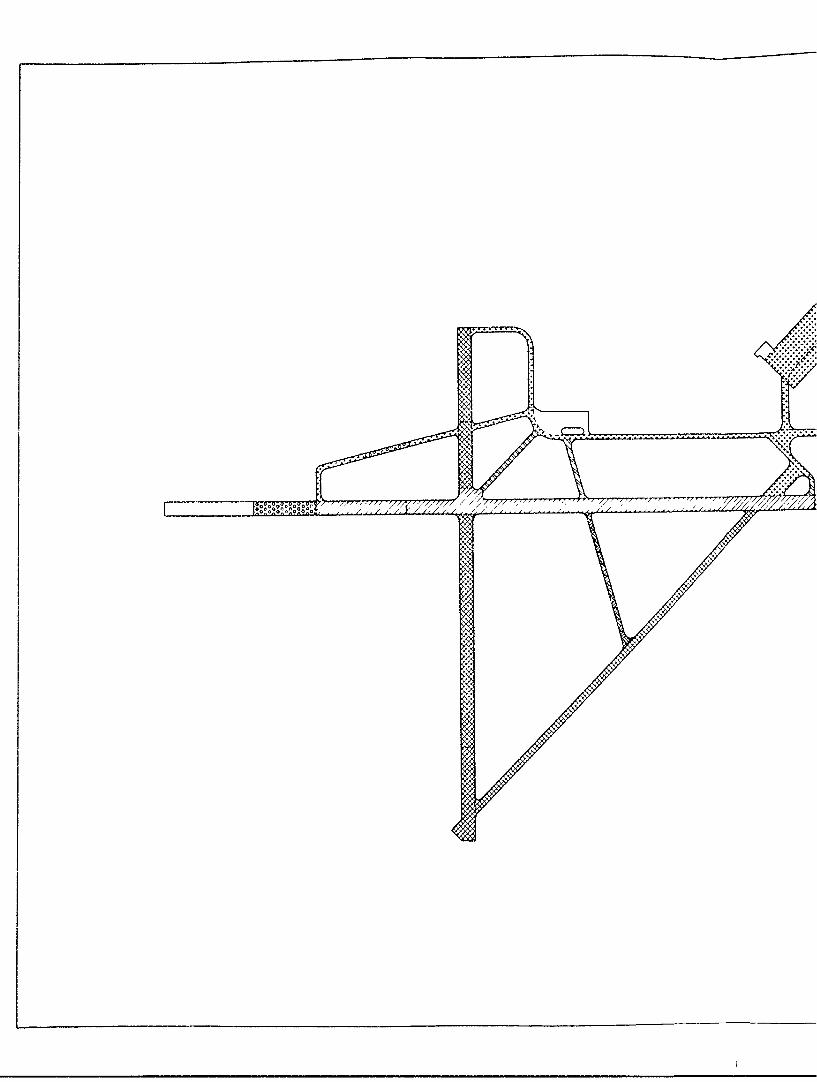
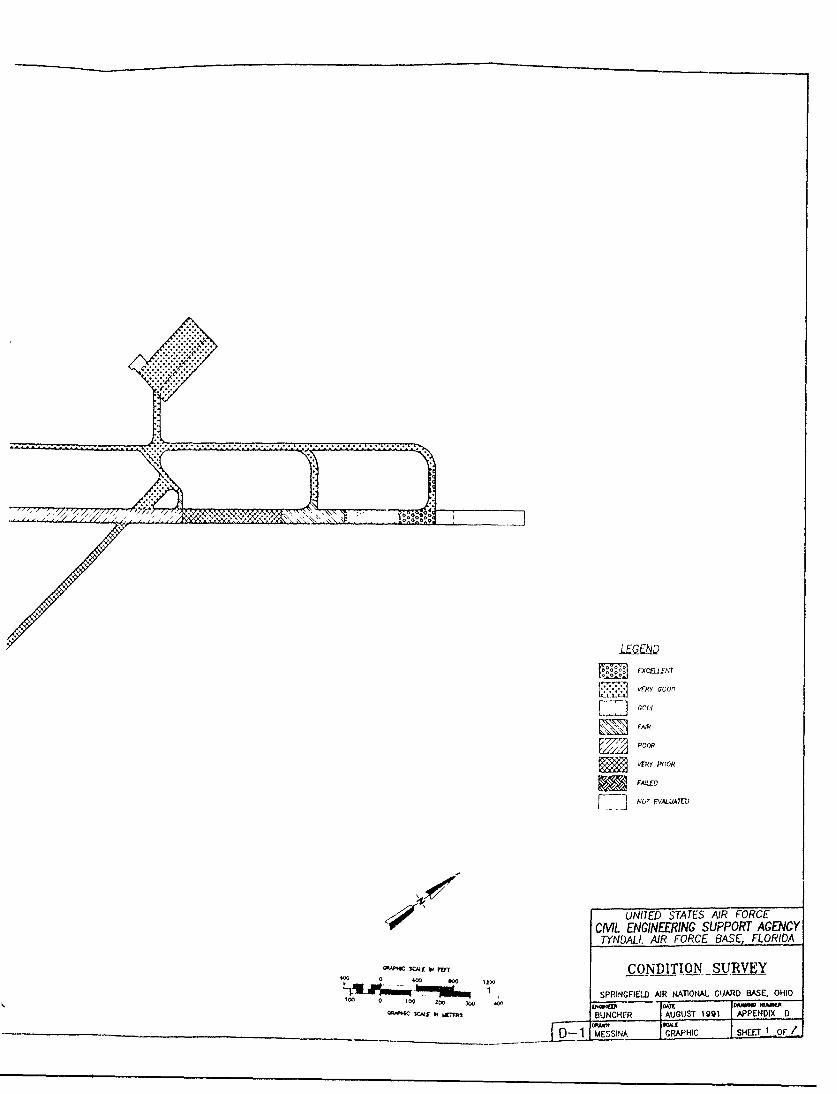
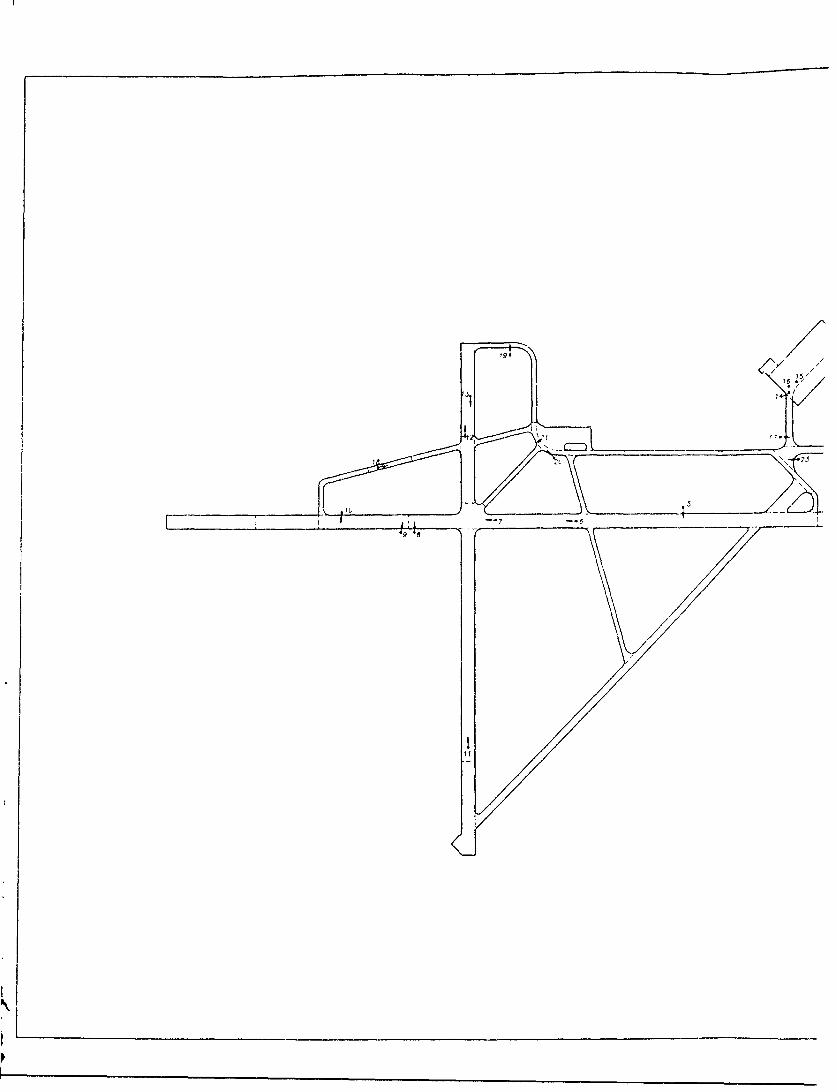
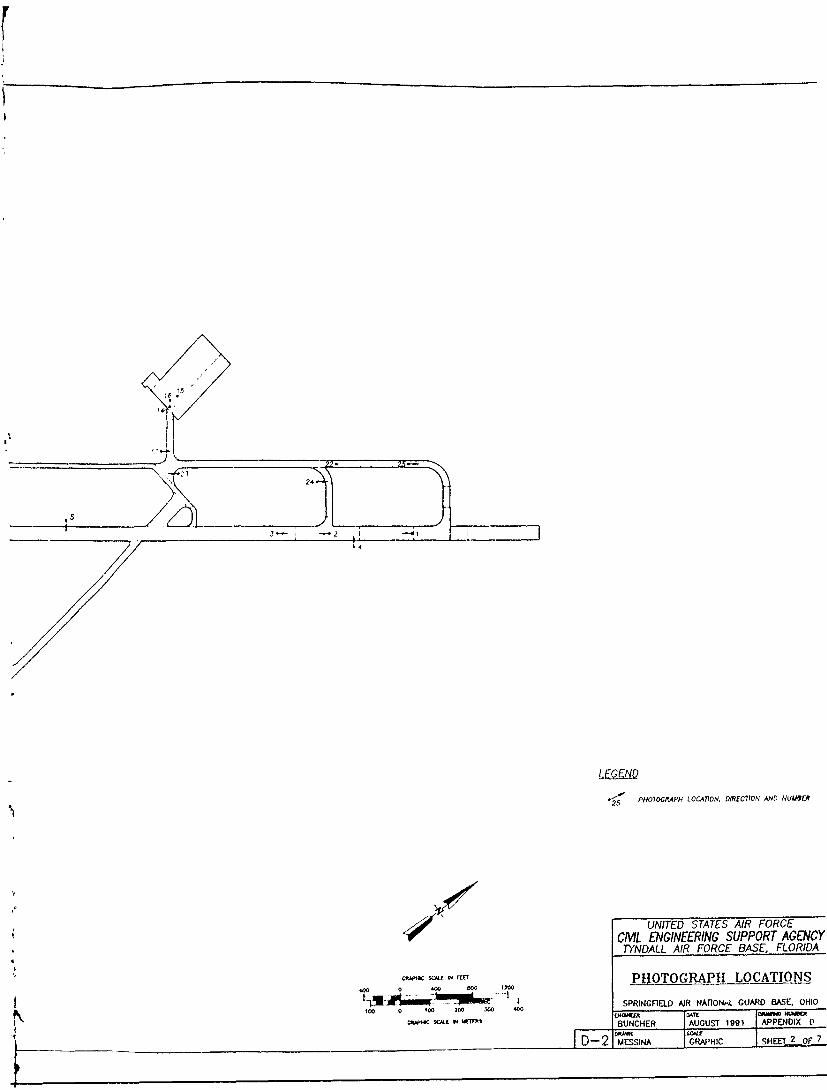
D Condition Survey and Photo Plan: Ratesthe surface condition of the airfieldfeatures. These ratings are a qualitativeassessment based upon visualobservations. The scale is the same asused in AFR 93-5. Photos and locations ofsignificant pavement distresses are shown.
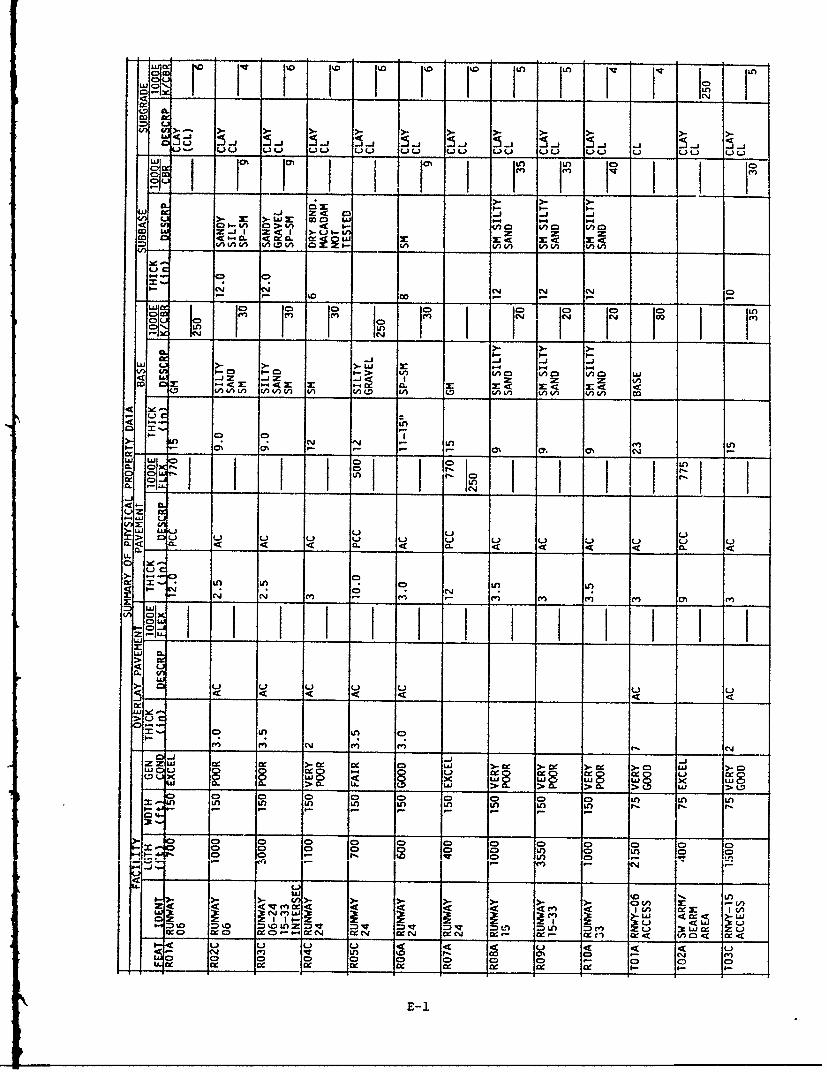
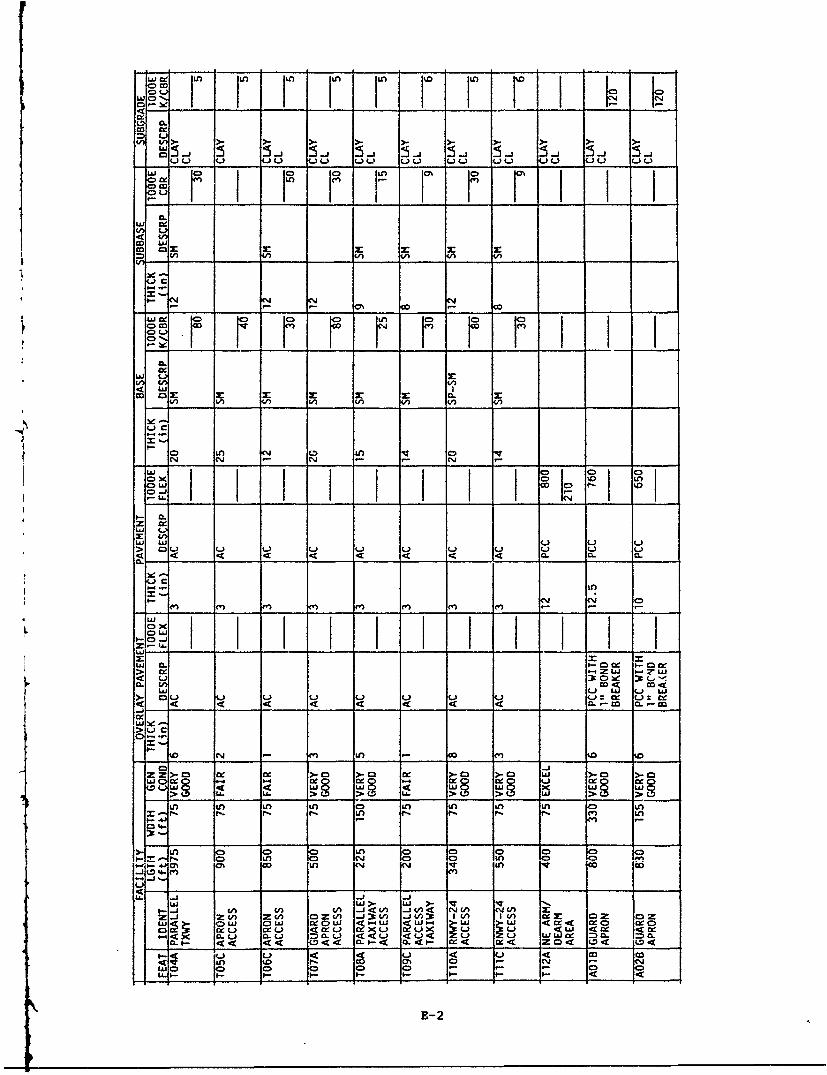
E Sumnary of Physical Property Data:Physical properties of each pavementfeature evaluated are tabulated in thisappendix. Included are featuredimensions, material types, thicknesses oflayers, and engineering properties.
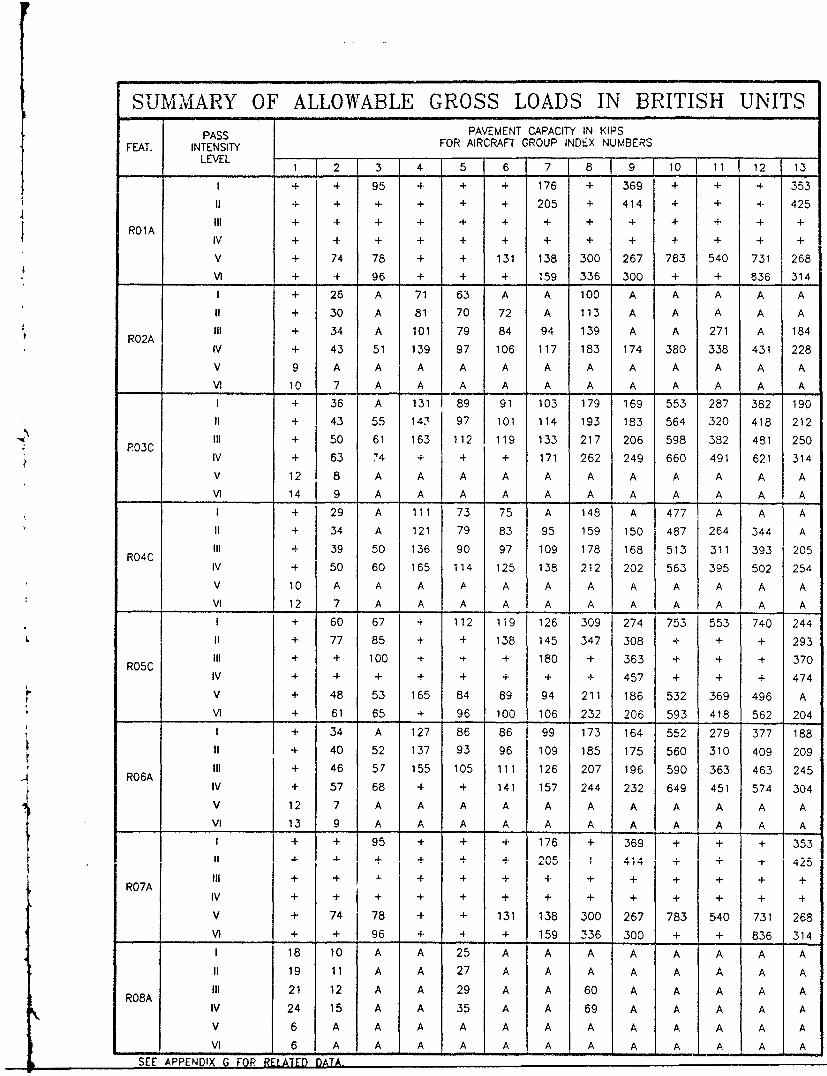
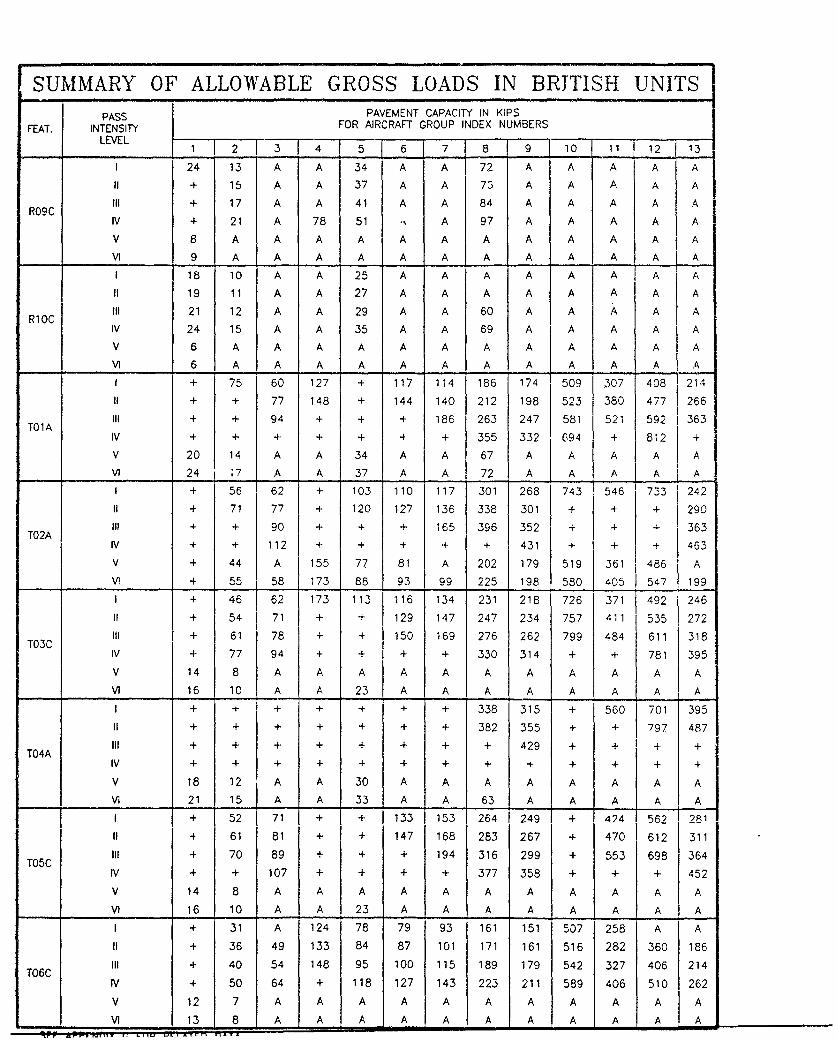
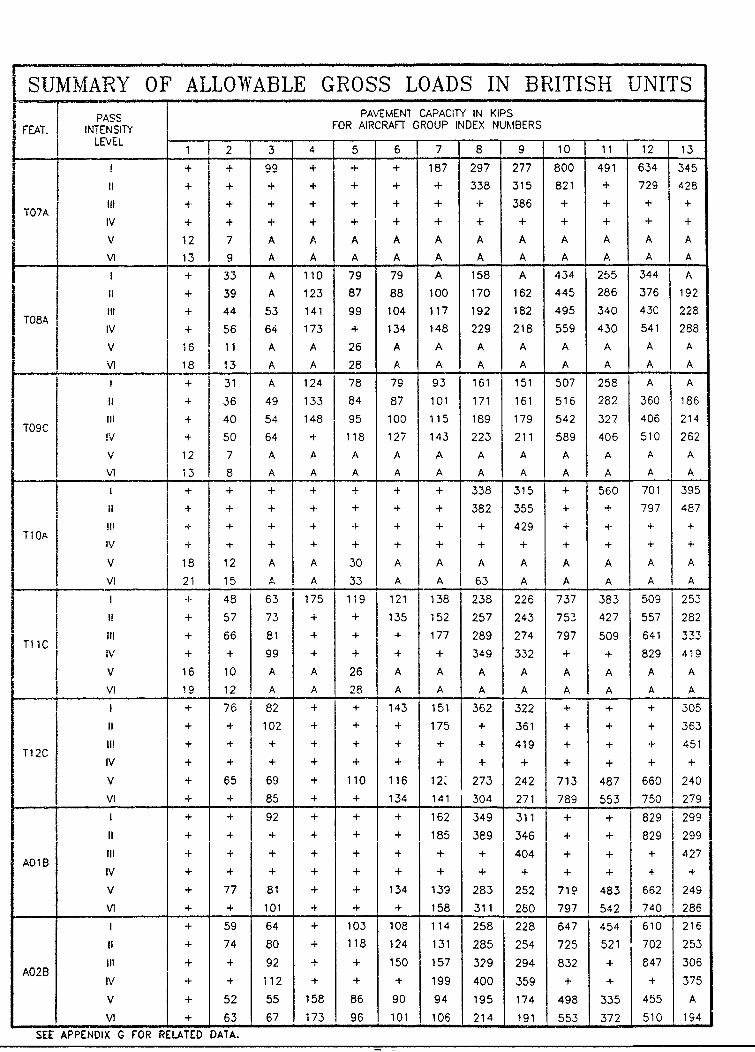
F Allowable Gross Loads (AGLs) and PavementClassification Numbers (PCNs): A listingof the allowable magnitude of loads atfour pass intensity levels for eachaircraft group is shown. PCNs, astandardized method of reporting pavementstrength, are also included.
G Related Information: Included in this areclimatic data, Aircraft Groun Indices,Gross Weight Limits for Aircraft Groups,and Pass Intensity Levels.
B. Pavements Evaluated:
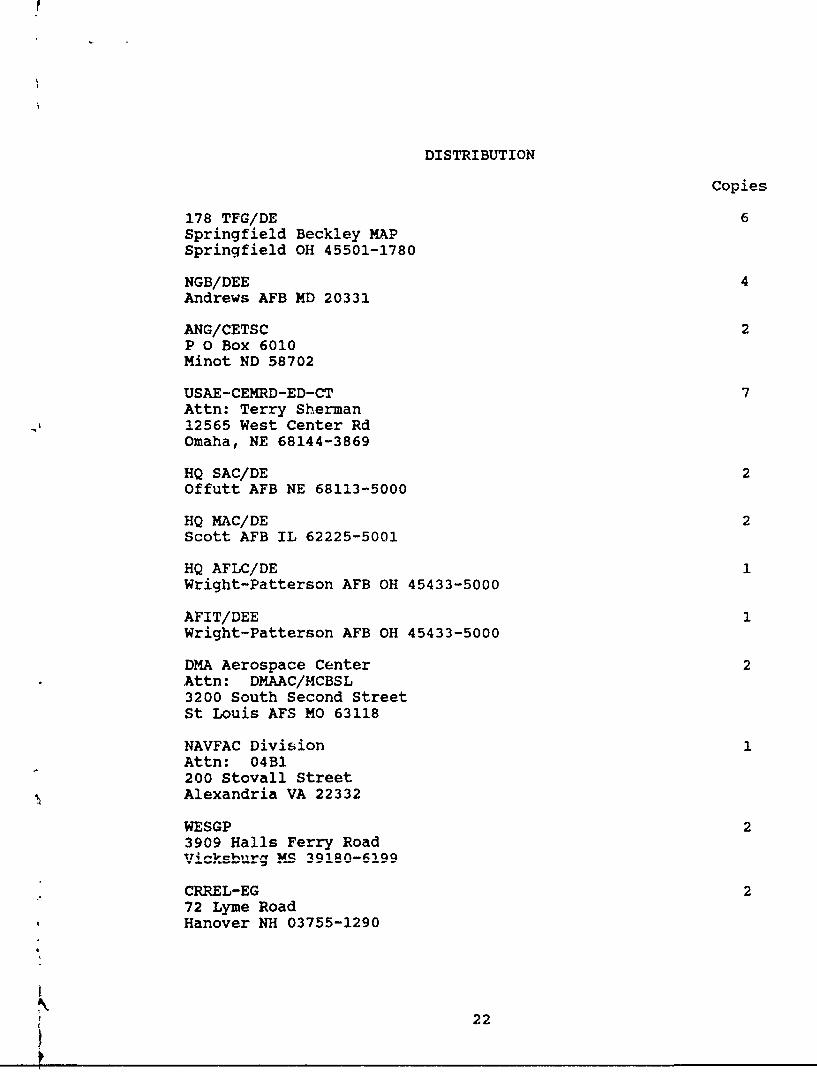
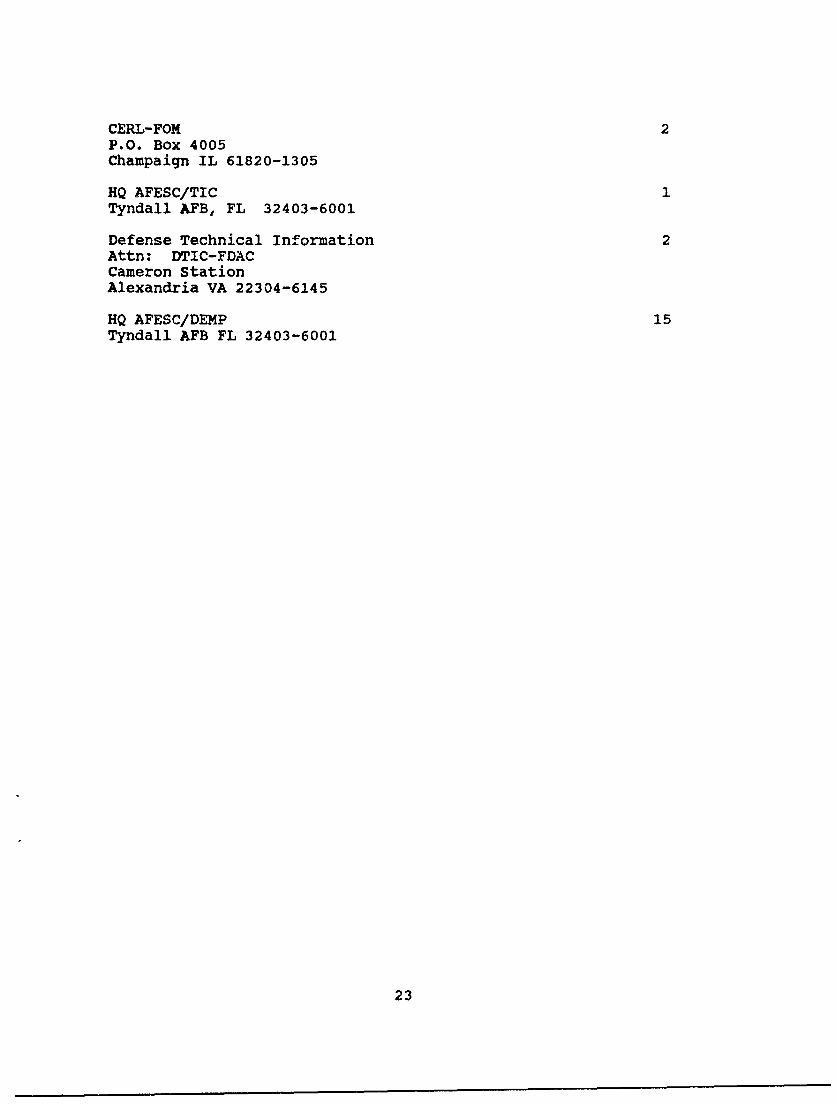
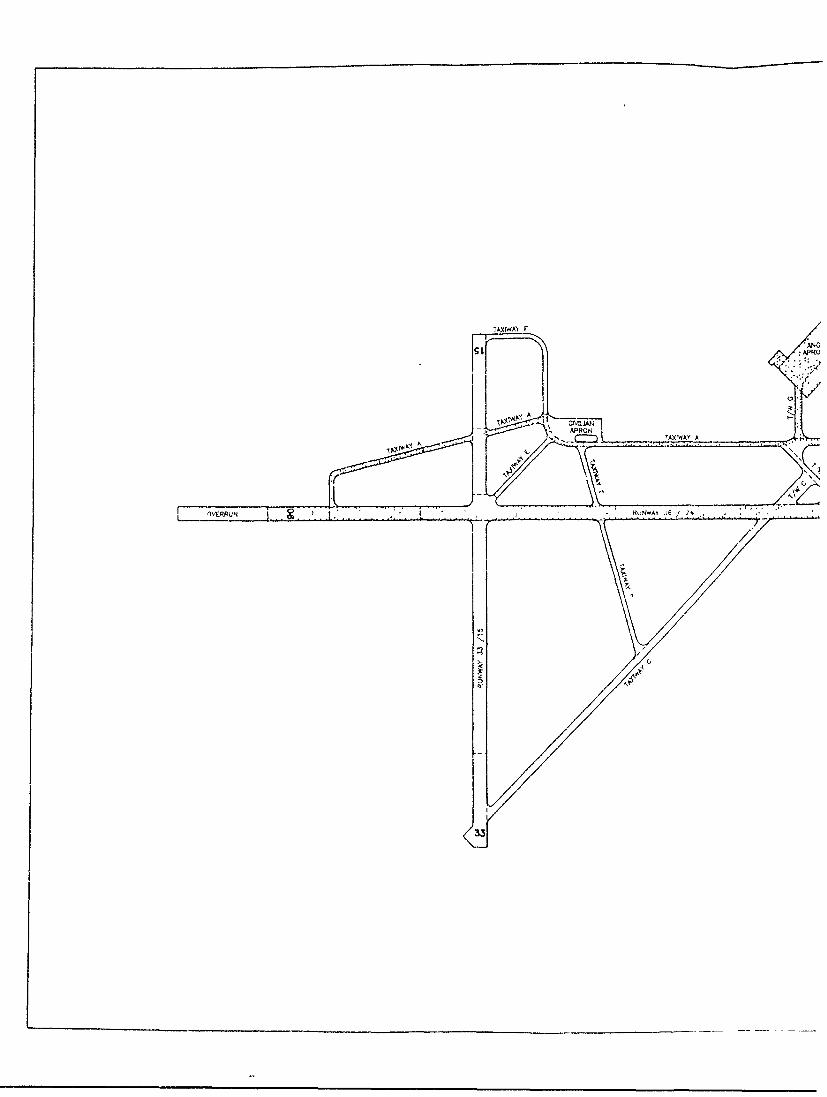
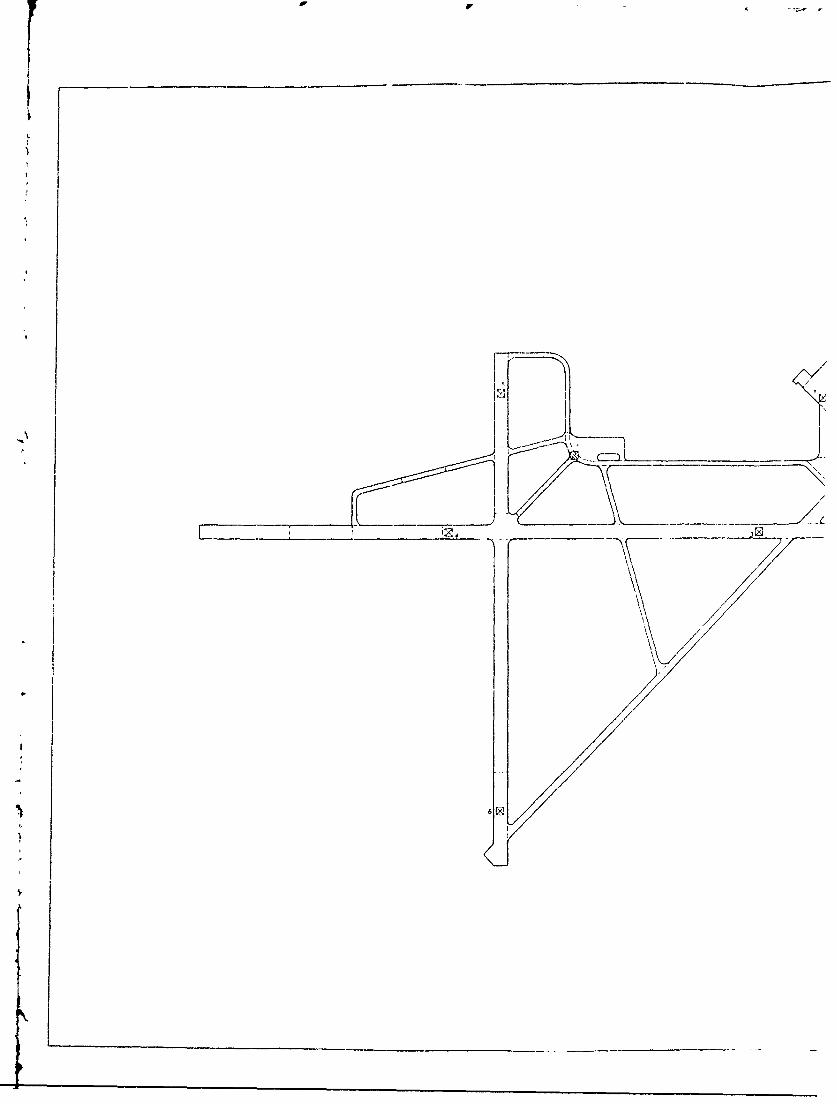
The entire active a! field at Springfield ANGB was evaluatedexcept for the civilian apron and a few abandoned taxiways.Page A-i in Appendix A shows the areas which were evaluated aswell as those that were not.
3
SECTION II: BACKGROUND DATA
A. General Description of Airfield:
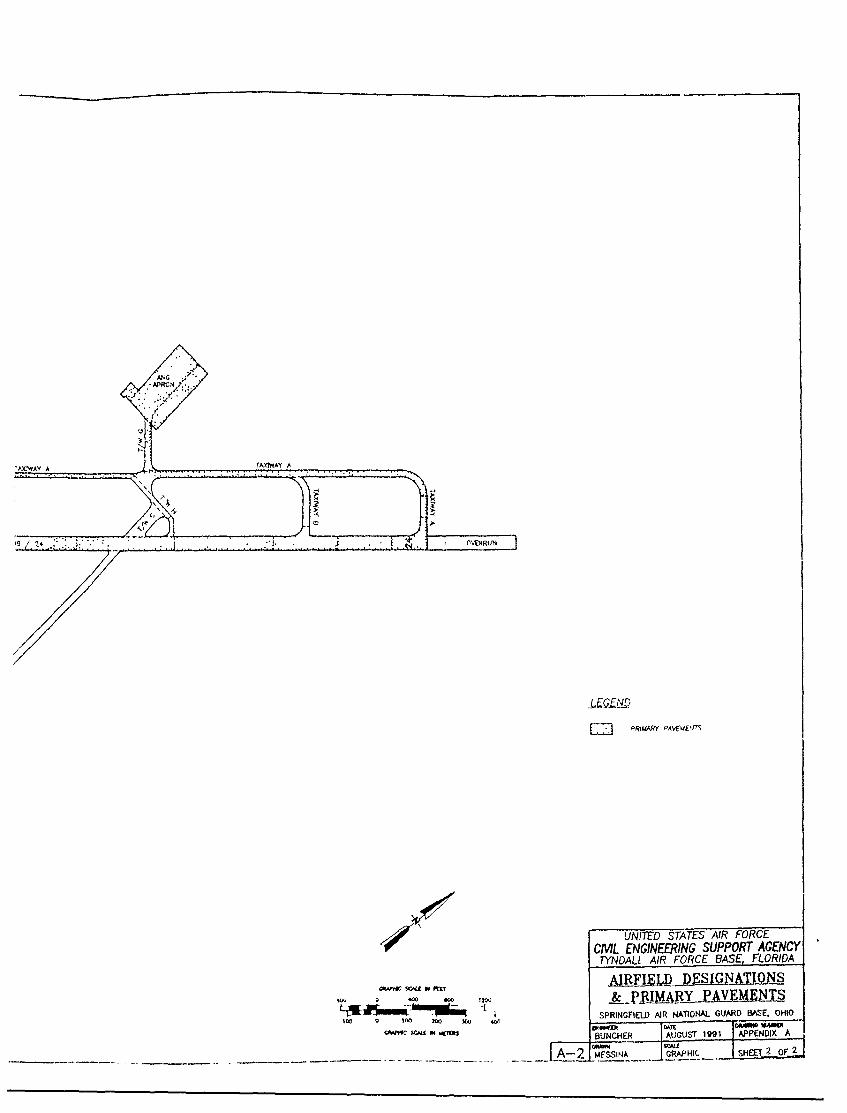
1. The airfield layout and feature designations are presentedin Appendix A, page A-i. The type of pavement, asphalticconcrete (AC) or portland cement concrete (PCC), and itsthickness are also listed here. Runway, taxiway, and aprondesignations are shown on page A-2.
2. Springfield-Beckley Municipal Airport has two runways, asmall civilian parking apron, the larger Ohio ANG parking apronand connecting taxiways. Runway 06-24, the primary runwaywhich the 178 TFG's A-7 aircraft use, is 9000-feet by150-feet. Secondary Runway 15-33 is 5500-feet by 150-feet.There are two arm/dearm areas on Taxiway A. Both parkingaprons are located northwest of Runway 06-24. All taxiways are50-feet wide except for the portions of Taxiways A and B whichare northeast of the ANG Apron and are 75-feet wide. Allpavement is flexible except for the ANG Apron, both ends ofRunway 06-24, both arm/dearm pads, and a 700-foot AC over PCCfeature on Runway 06-24. The civilian apron is also AC overPCCo
B. Aircraft Traffic:
Primary aircraft using the airfield are the A-7s and lightprivate civilian aircraft. The 178 TFG will convert from A-7sto F-16s by 1993. There is currently no commercial flights,but there is occasional private jets and 727 air-log service.Along with the A-7s, the ANG apron is used 5 to 10 times peryear for transient military aircraft such as the C-130, KC-135,and C-141. A C-5 transport was brought in a few years ago andparked on the secondary runway because the ANG Apron did nothdve enough wing-span clearance. The frequency of these largeaircraft varies greatly depending on exercises, etc.
C. Construction History:
The original airfield was built in 1946. The primary runwayhas been lengthened twice. It was last overlayed in 1967 andthe PCC ends were completed in 1980. The arm/dearm pads werebuilt in 1982 and the Parallel Taxiway was last overlayed in1982. Appendix B presents a complete construction history
.. 3 1- - at - -&.. -J - A. ' -'I ...a-
4
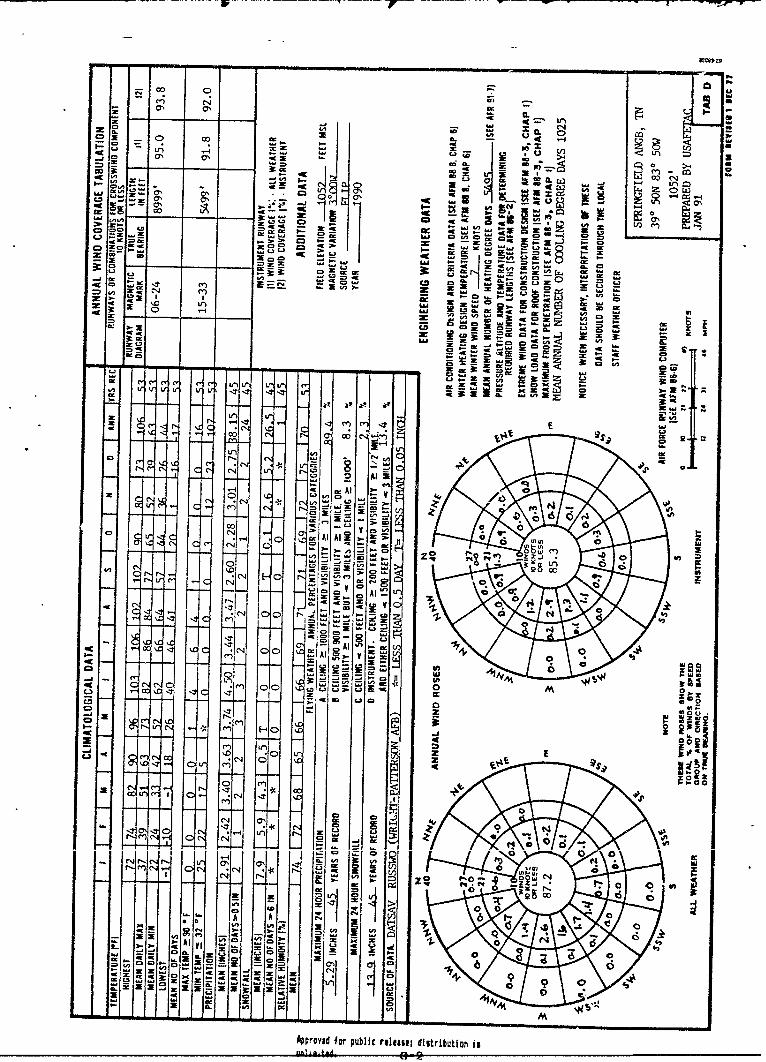
D. Climatic Data:
A summary of climatic data is presented in Appendix G. Anarrative and climatological chart are provided. Thisevaluation was performed in the spring with mild temperaturesand normal precipitation. The Design Freezing Index (based onthe coldest year in 10) at Springfield is 600 which equates toa frost penetration depth of approximately 40 inches, using anaverage PCC pavement thickness of 12 inches. The Air FreezingIndex (based on an average year) is 100 which equates to afrost penetration of about 19 inches from the surface.
E. Drjinge:
There were no significant drainage problems apparent afterseveral light rainfalls during the evaluation period.
5
SECTION III: T2ST PROCEDURES
A. Field Testina
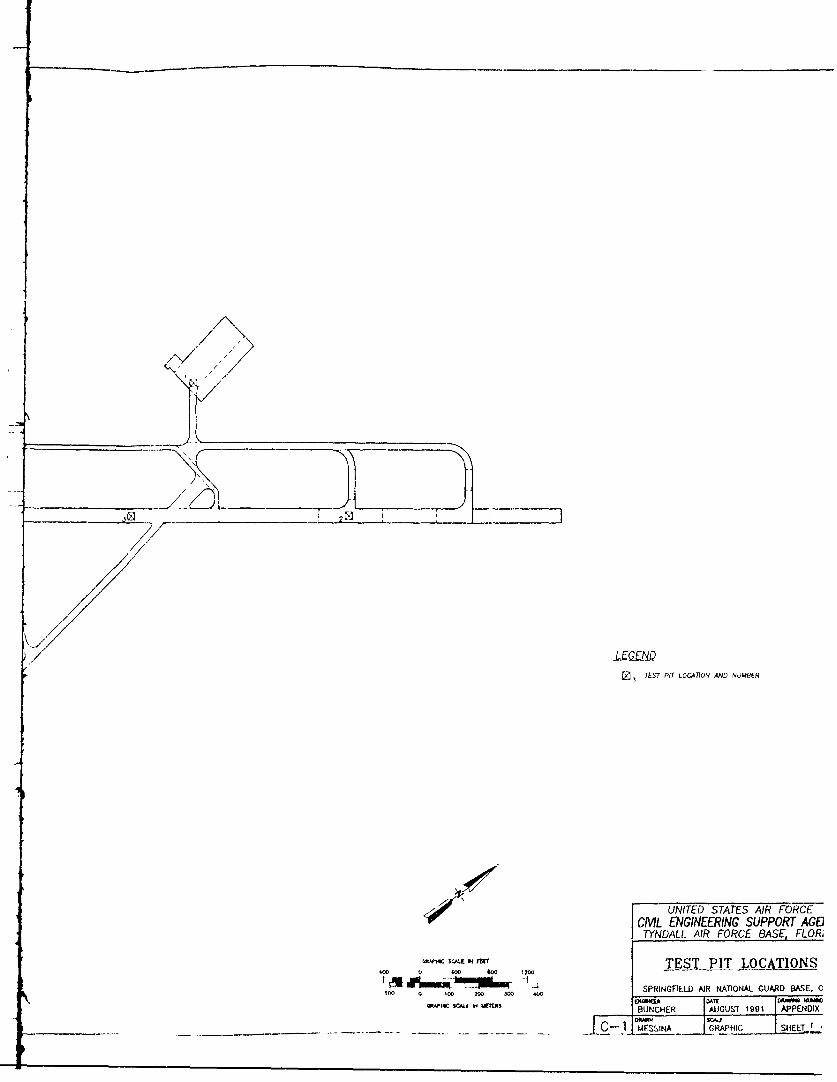
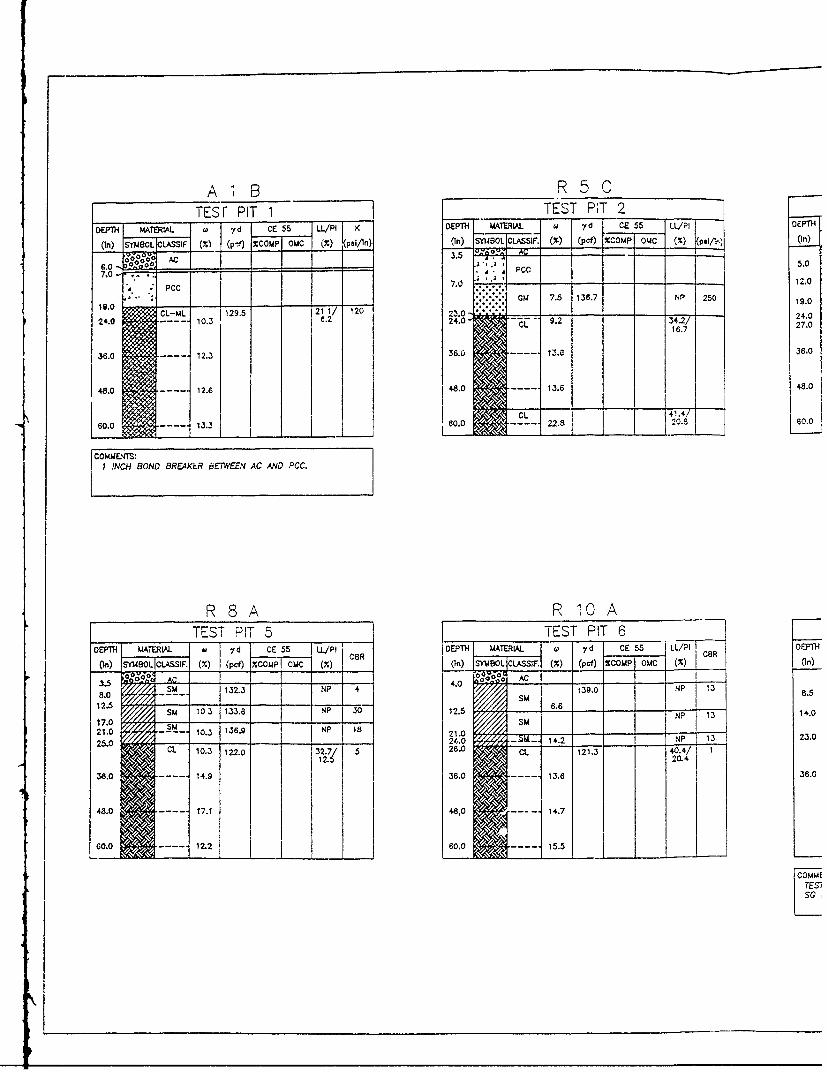
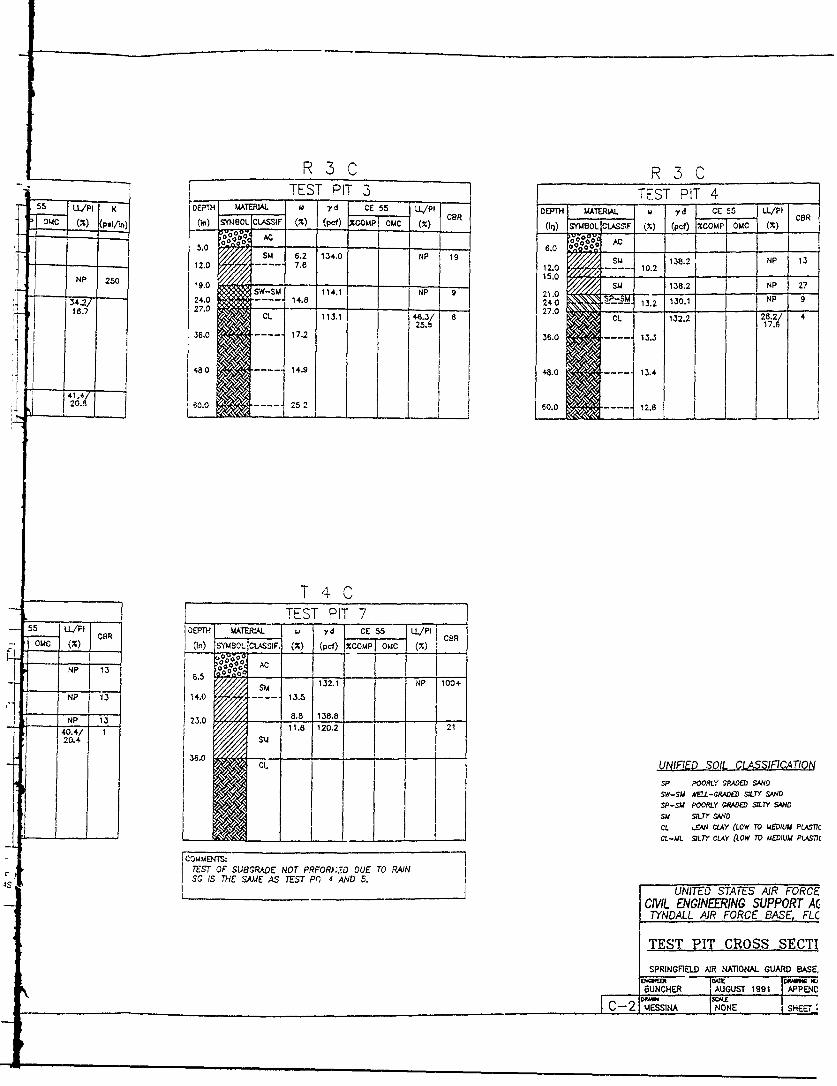
1. The evaluation team performed in situ plate bearing testsand California Bearing Ratio (CBR) tests in seven test pitslocated on various features throughout the airfield. In situmoisture contents and soil densities were also measured, andsoil samples taken for further lab testing. The seven testpits locations are shown in Appendix C-1. Appendix C-2 showseach test pic cro&s section. On the cross sections are soillayer classifications and thicknesses, moisture contents atvarious depths, dry densities for each layer, liquid limits andplasticity indexes for the subgrades, CBR values for each layerin the flexible pits (3 thru 7) and a modulus of subgradereaction or K-value for the rigid pits (I and 2).
2. Field testing included extraction of 48 pavement cores.Core locations are from features throughout the airfield andare shown in Appendix C-3. The cores were sent to Tyndall AFBfor analysis and testing.
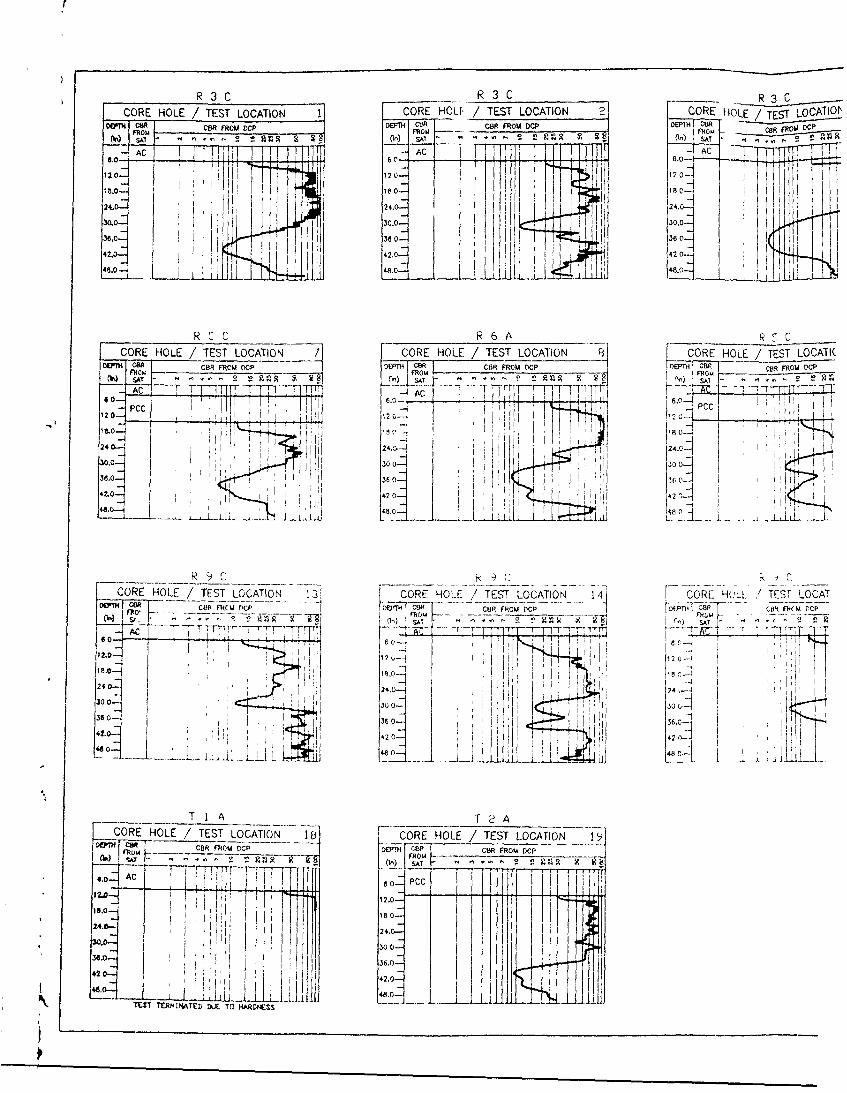
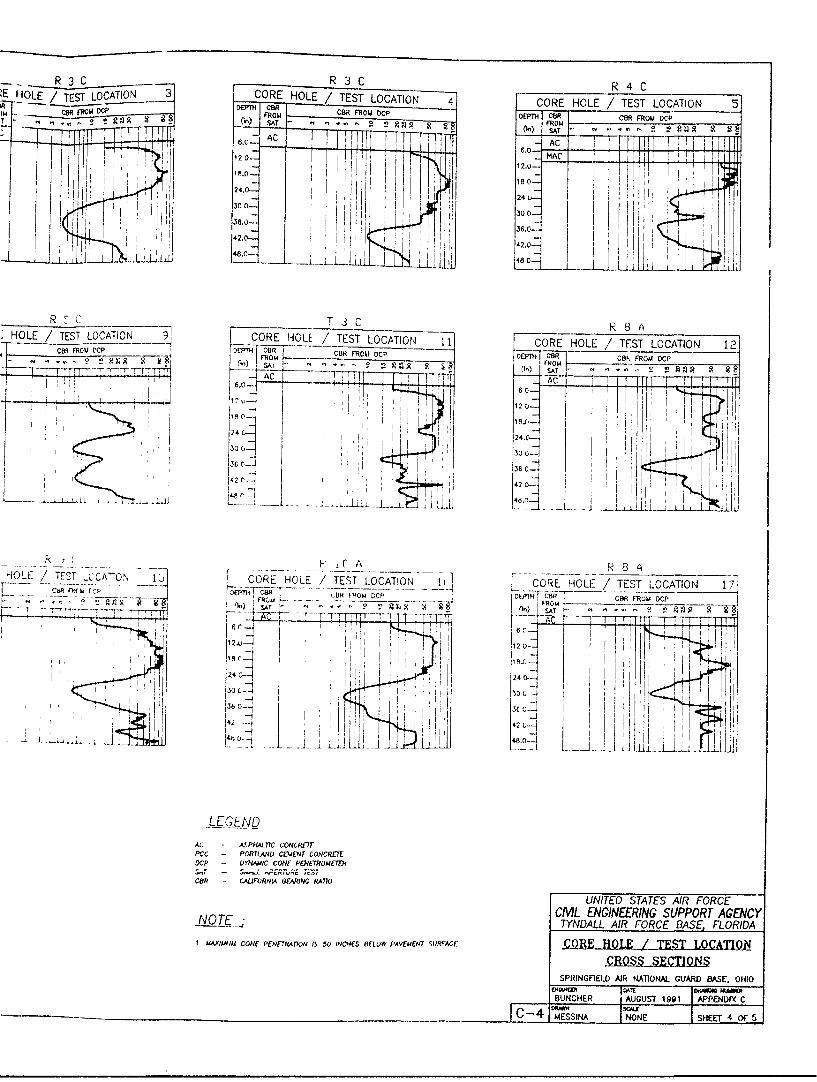
3. Dynamic cone penetrometer (DCP) tests were conducted atmost core locations to measure the penetration resistance ofsubsurface soils, which indicates soil strength variations withdepth. These resistance values measured through a depth offour feet are then correlated to CBR values. The DCP locationsare shown in Appendix C-3.The results are shown in Appendix C-4 and C-5.
B. Laboratory TestiDg
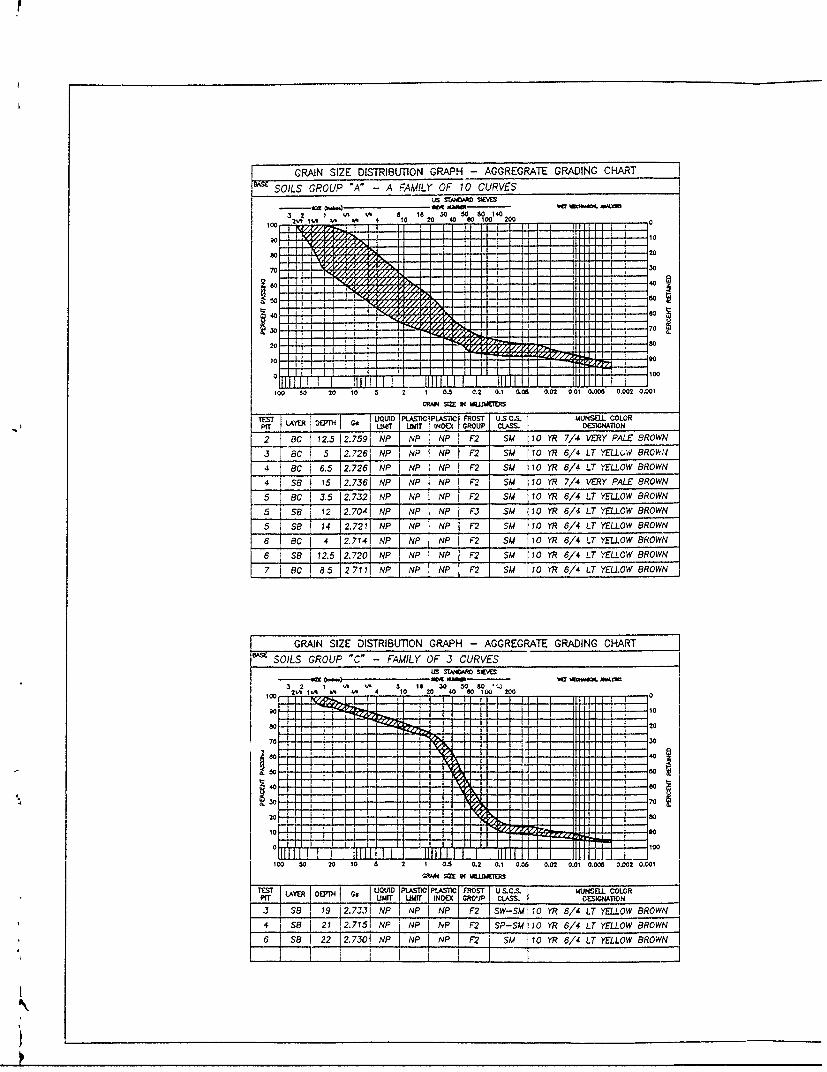
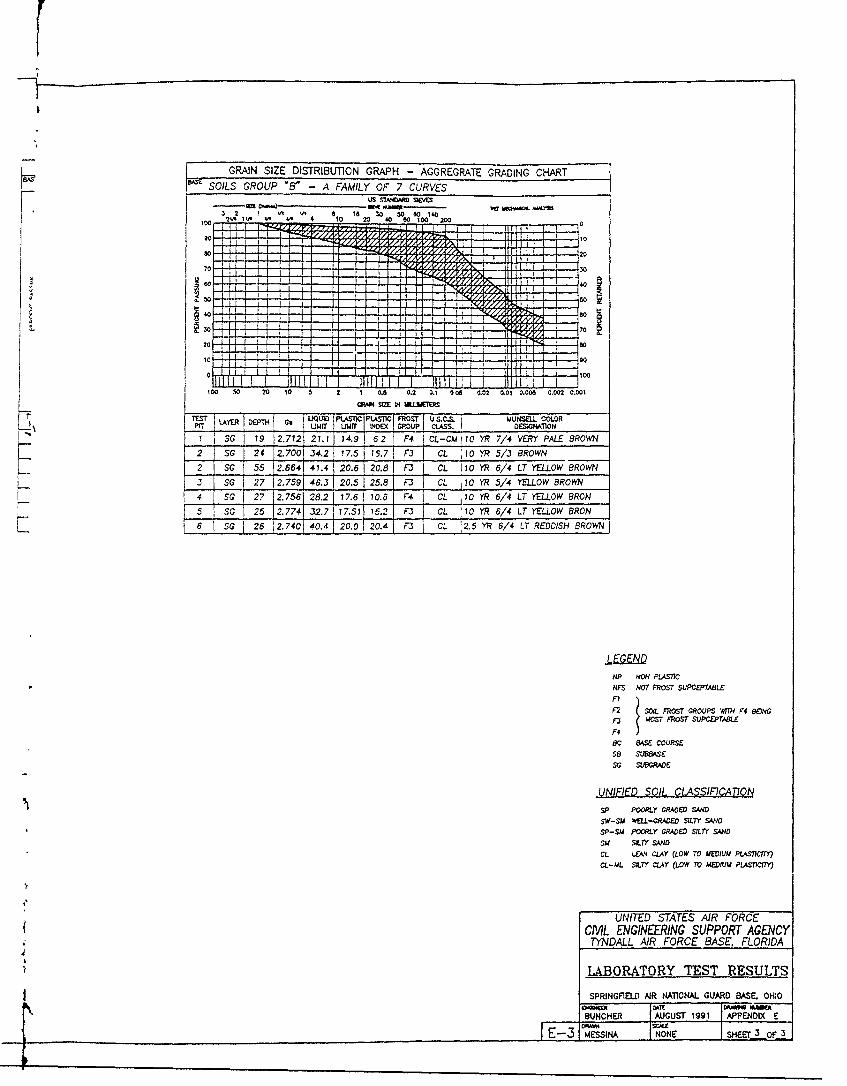
1. Soils were classified in the laboratory in accordance withASTM's "Standard Test Methods," using the Unified SoilClassification System (USSCS). Three grain size distributioncurves are shown in Appendix E-3 for each type of soil obtainedin the test pits. Samples were taken for each soil layerencountered and grouped in one of the three grain sizedistribution charts. Listed below the three soil groupdistribution charts are the specific gravity, liquid limit,plastic limit, plasticity index, frost group and classificationfor each layer found in the test pits.
2. PCC cores were tested for strength by tensile splitting inaccordance with ASTM's "Standard Test Methods". The six-inchcore tensile splitting strengths were then converted toflexural strengths using an empirical relationship (Reference3). Flexural strengths are reported on the "Core LocationPlan" (Appendix C) and in Appendix E.
4
6N
SECTION IV: METHODOLOGY Of ANALYSIS
A: Physical Property Data
The parameters used for this evaluation in computing AGLs aresummarized in the Summary of Physical Property Data Table,Appendix E-1 and E-2. The values presented in this table wereselected as the most representative for each feature. All thetest pit, coring and DCP results were analyzed along with theconstruction history to first determine the breakout offeatures and then to assign representative thickness andstrength values.
B: Determination of Allowable Gross Loads (AGLs)
The AGLs were compiled by computer program based on proceduresin AFM 88-24 and listed in Appendix F. AGLs were reduced 25%for those features whose condition rating was POOR or worse.The "Related Data" sheet in Appendix G aids in reading the AGLchart in Appendix F. Listed are the different Pass IntensityLevels, Aircraft Group Indicies and Gross Weight Limits foreach aircraft group. An example of how this data can be usedto determine the AGL for any pass level is shown below. Insimilar fashion, the life of a pavement feature, or number ofpasses to failure, can be determined for a given aircraftweight.
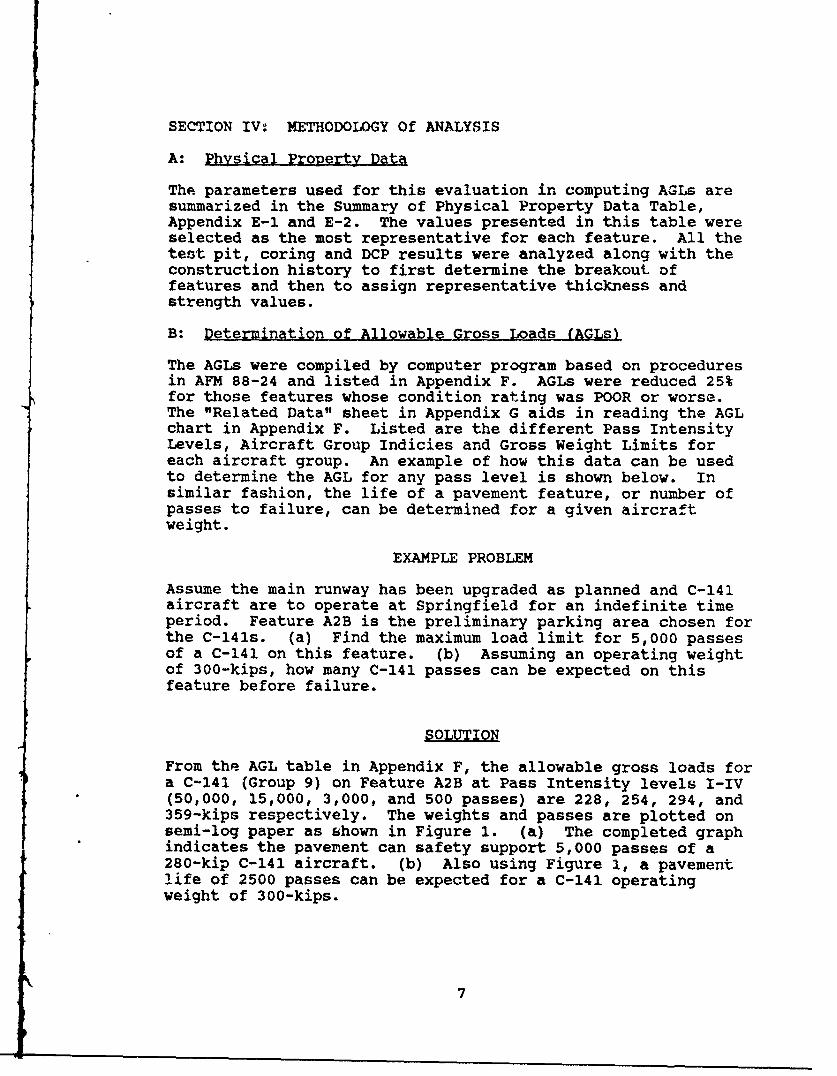
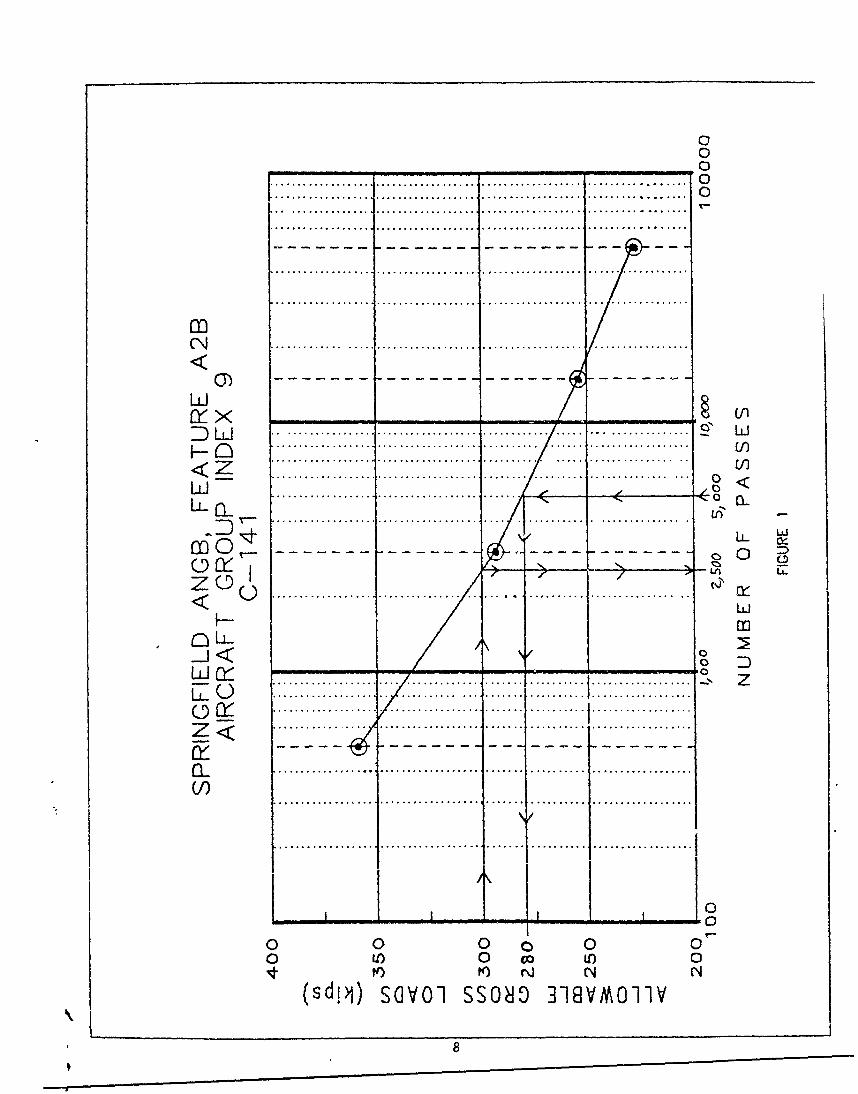
EXAMPLE PROBLEM
Assume the main runway has been upgraded as planned and C-141aircraft are to operate at Springfield for an indefinite timeperiod. Feature A2B is the preliminary parking area chosen forthe C-141s. (a) Find the maximum load limit for 5,000 passesof a C-141 on this feature. (b) Assuming an operating weightof 300-kips, how many C-141 passes can be expected on thisfeature before failure.
SOLUTION
From the AGL table in Appendix F, the allowable gross loads fora C-141 (Group 9) on Feature A2B at Pass Intensity levels I-IV(50,000, 15,000, 3,000, and 500 passes) are 228, 254, 294, and359-kips respectively. The weights and passes are plotted onsemi-log paper as shown in Figure 1. (a) The completed graphindicates the pavement can safety support 5,000 passes of a280-kip C-141 aircraft. (b) Also using Figure 1, a pavementlife of 2500 passes can be expected for a C-141 operatingweight of 300-kips.
7
0000
... . ........ ... ............... . ...... .. ..... ..... .. ......... o ., ...., : : .. ... ...... .... .... ..... ... ... .
.. ...... .. .. ........................... I . ........ ° ° .... .° ./ .... .......
. . . . . . . . . ...... ... .. . . . . . ..I.. . .. .. . . .. ... ,
D ~ ~a l ............. ....................... , ............ ..... ... .. ....... -
0)- C -- - - - - - - - - - - - - -LLN_
Z- ( _ ................ ................. ../ ' .... .'.... ...... I ... I............ .. V"
W n7 ..... ............ ', .". . ... . ............ ... ............. §
0 . z)
.° . . . . . . o. . -. . o.. . . . . . .. . . -. . . . . . . . . . . . . .-.. . . . . . . . . . . . . . . . . . . . . . . .<
< . ....................................... ... .. . ........
(I)I
! ,I ,.... .....
O 0 0 o - - - -
'4- K) K) N IN CN(sd!>l) s(VO'I sso Io 318VMO11V
8
C. Pavement Classification Number
The International Civil Aviation Organization (ICAO) hasdeveloped and adopted a standardized method of reportingpavement strength. This procedure is known as the AircraftClassification Number/Pavement Classification Number (ACN/PCN)method (Reference 4). The ACN is a number that expresses theeffect an aircraft will have on a pavement. ACN values arepublished in References 4 and 5. The PCN is a number thatexpresses the capability of a pavement to support aircraft.Appendix F provides PCN values for each pavement feature. Thereported PCN values are based on the AGL for Group 9 at PassIntensity Level I (50,000 passes). Just as for AGLs, the PCNsmust be based on a particular aircraft group and pass intensitylevel. The PCN will vary slightly depending on which aircraftgroup it is based upon; however, the PCNs listed should besufficient as a guide. Fifty-thousand (50,000) passes werechosen as a standard life of a pavement. Appendix F alsoincludes a brief explanation of the PCN nomenclature.
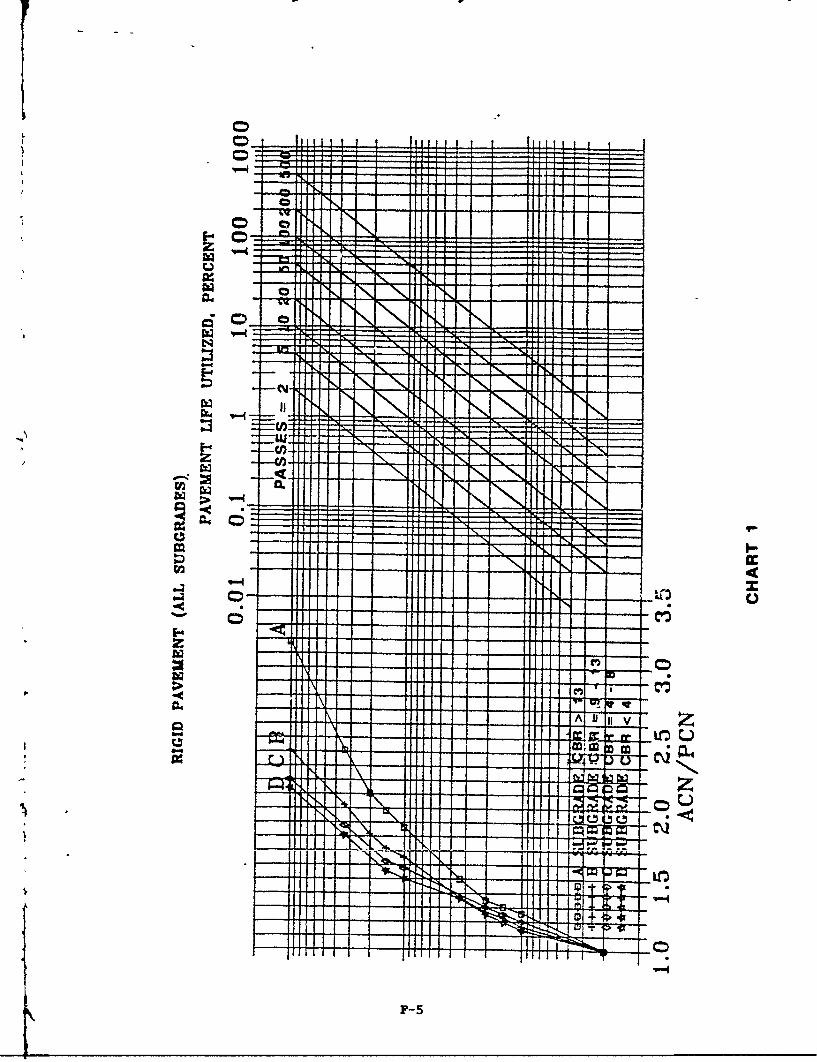
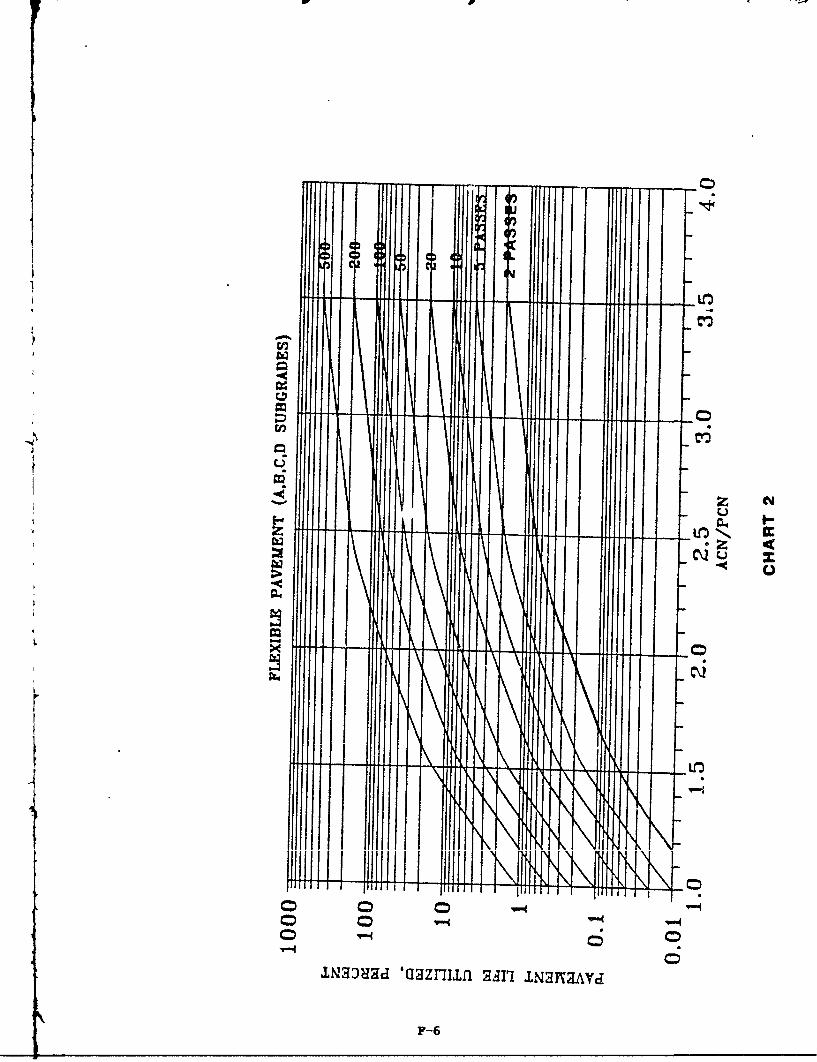
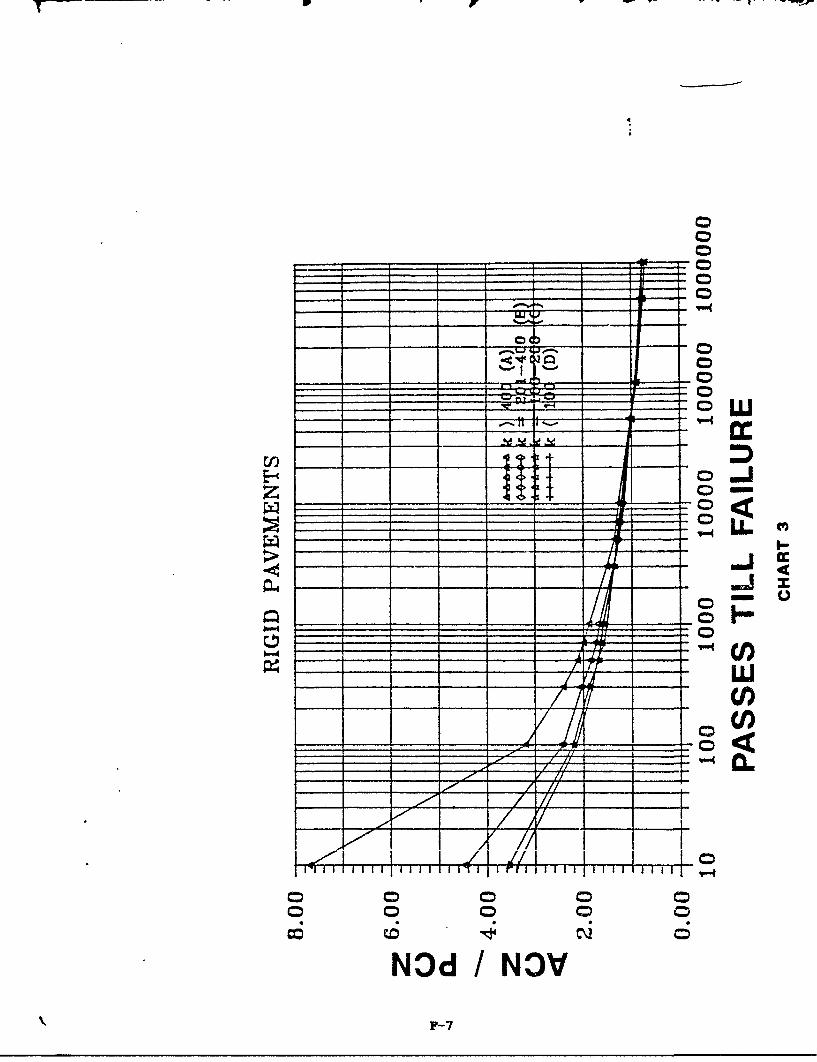
Theoretically, a pavement will support unlimited operations ofan aircraft (beyond the standard pavement life) if the PCN isequal to or greater than the ACN. There may be situations whenoperators have to overload a pavement, i.e., the ACN is greaterthan the PCN. Pavements can usually support some overload,however, pavement life is reduced. Appendix F contains fourcharts that will assist the airfield manager or pavementsengineer in determining how much pavement life will be reducedby overloading the pavement. An example of how these chartsare used is shown below.
EXAMPLE PROBLE
Assume Runway 06/24 has not been upgraded since this evaluationwas performed. A 135-kip C-130 must make 10 passes across theweakest feature of Runway 06/24 for an excerise. How muchpavement life is utilized on this weakest feature?
SOLUTION
From Appendix F, Feature R2A has a PCN of 7, which is thelowest PCN value for the Runway 06/24. The full PCN code alsoindicates Feature R2A is a flexible pavement over a lowstrength subgrade. The ACN of a 135-kip C-130 on a flexiblepavement of low subgrade strength is 24. Therefore, theACN/PCN ratio is 3.5. Using Chart #2 in Appendix F, 10 percentof the pavement life is utilized for 10 passes of an ACN/PCNratio of 3.5 on a flexible navement of low subgrade strength.
9
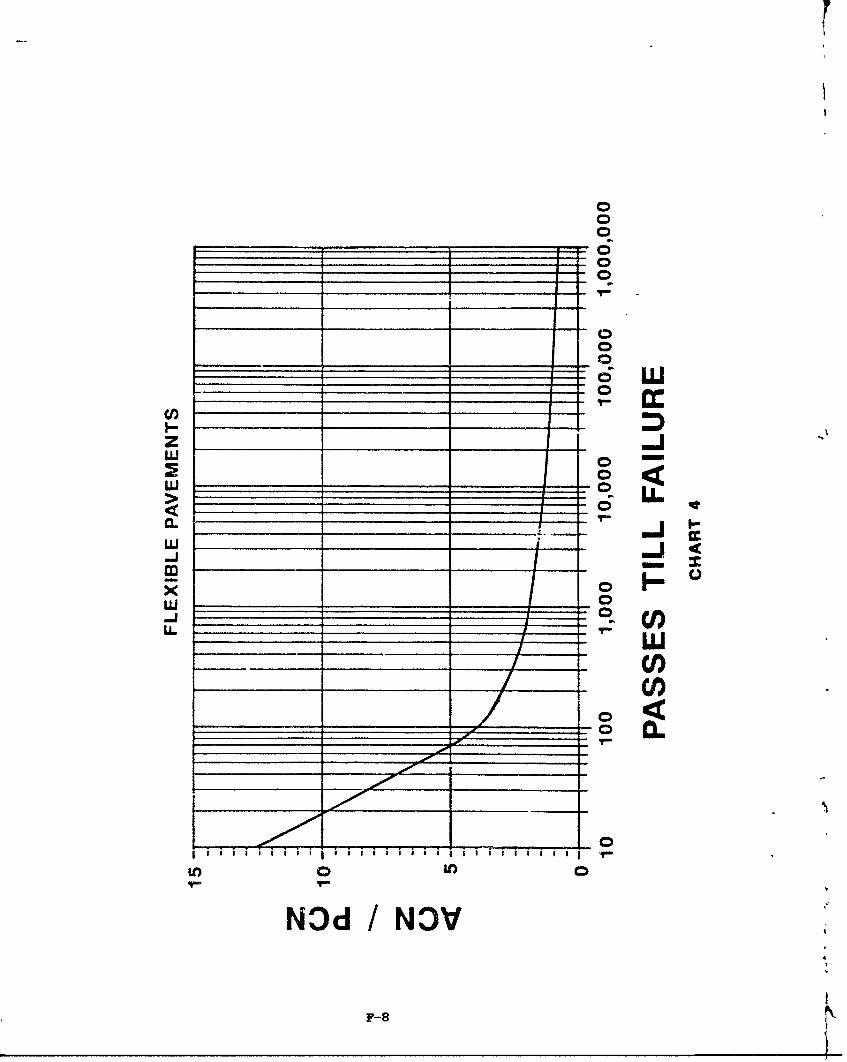
Chart #1 is the same format as Chart #2, but for rigidpavements. Charts #3 and #4 are also for overloading, but in adifferent format. For an ACN/PCN ratio of 3.5 on a flexiblepavement of low subgrade strength, 100 passes can be madebefore the pavement fails, per Chart #4.
10
SECTION V: PAVEMENT ASSESSMENT
A. Overall Visual Assessment
A visual survey was conducted on all the airfield pavements torate the surface condition for each feature. Appendix D-l,Condition Survey, shows the condition rating for each featureon an airfield map. Appendix E also lists these ratings intabular form. These observations are not a detailed pavementcondition index (PCI) as outlined in AFR 93-5 (Reference 6),however, the rating scale is the same. The ratings are basedon random counts of major distresses combined with engineeringjudgment, with AFR 93-5 used as a guide. The visual surveycould be called a "cursory PCI." Pavement condition ratingsrange from EXCELLENT (like new) to FAILED (unsafe for aircraftoperations). They are a qualitative assessment of the pavementsurface and should not be confused with the structural capacityof a pavement. For example, a pavement surface may rateEXCELLENT but have underlying pavement or soil conditions thatcould result in pavement failure under the applied load of agiven aircraft. On the other hand, a pavement may bestructurally sound but the surface condition may be hazardousfor aircraft traffic (i.e. FOD). Identifying the type andseverity of distresses can help provide an understanding of theravement's response to current loads and for projecting itsability to handle future loads. Pavement conditions atSpringfield ANGB range from VERY 'OOR to EXCELLENT. Photoswere taken and are shown in Appendix D. They are referencedbelow.
1. Runway 06-24
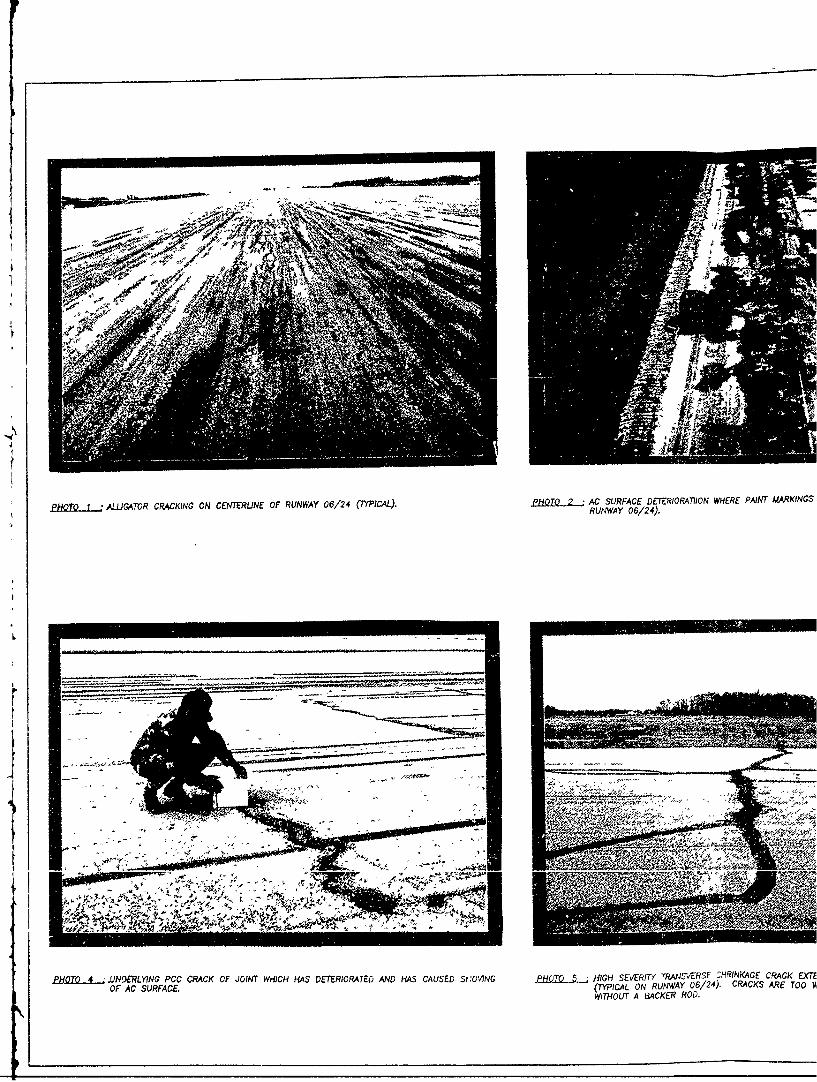
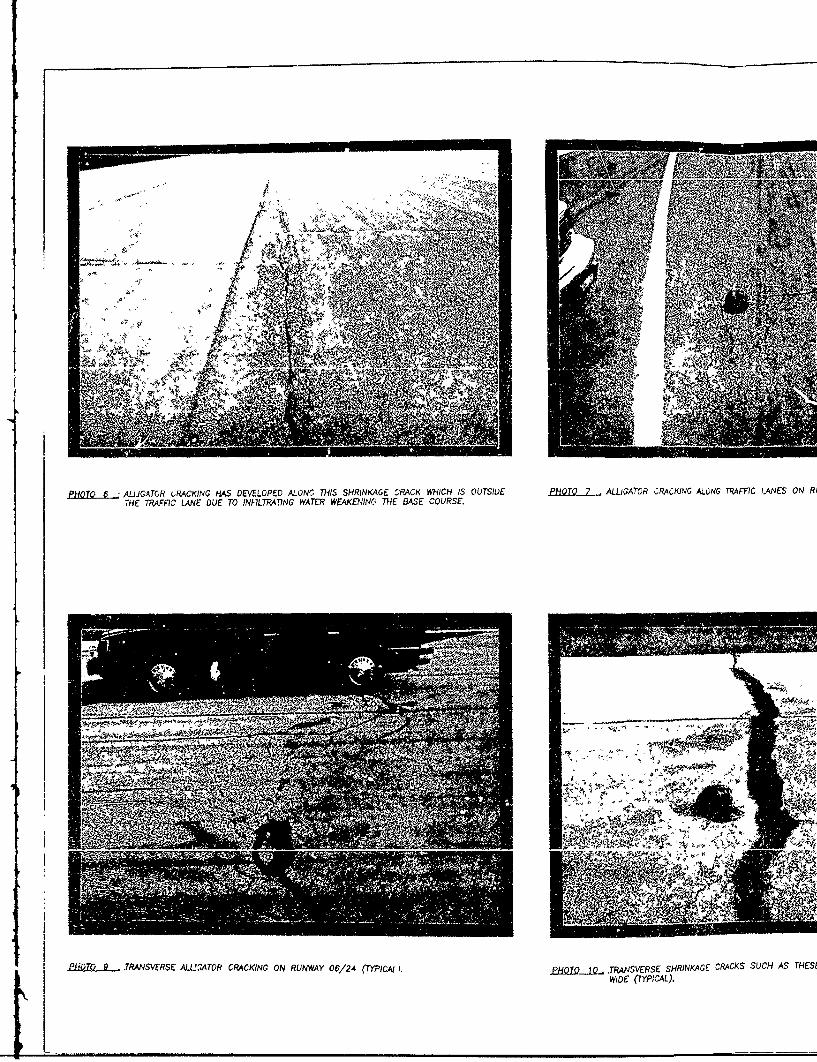
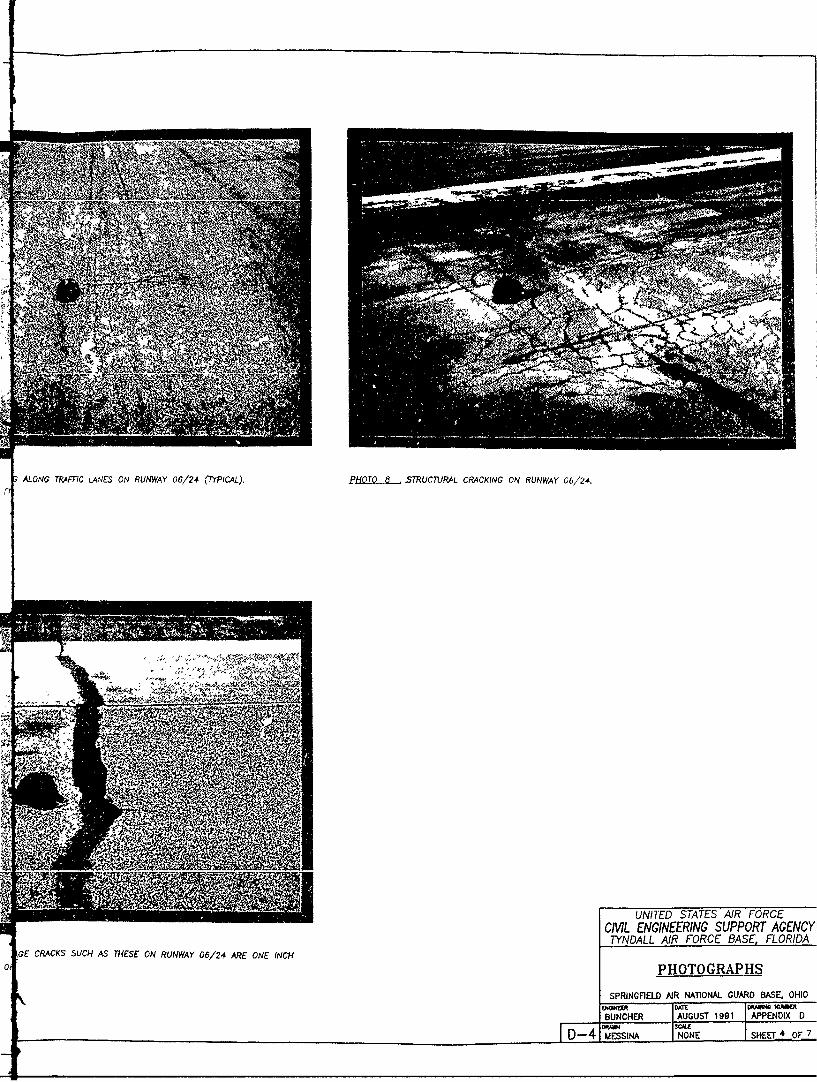
Both PCC ends (Features RIA and R7A) were constructed in 1980and are still in EXCELLENT condition. The neoprene compressionseals are working well. The remainder of the AC runwayfeatures rate VERY POOR TO GOOD. These are planned forreconstruction later this year. Photos 1 through 10 show themajor distresses of Runway 06-24. The two primary distressesare alligator cracking primarily in the traffic lanes, andevenly spaced transverse shrinkage cracking across the entirewidth.
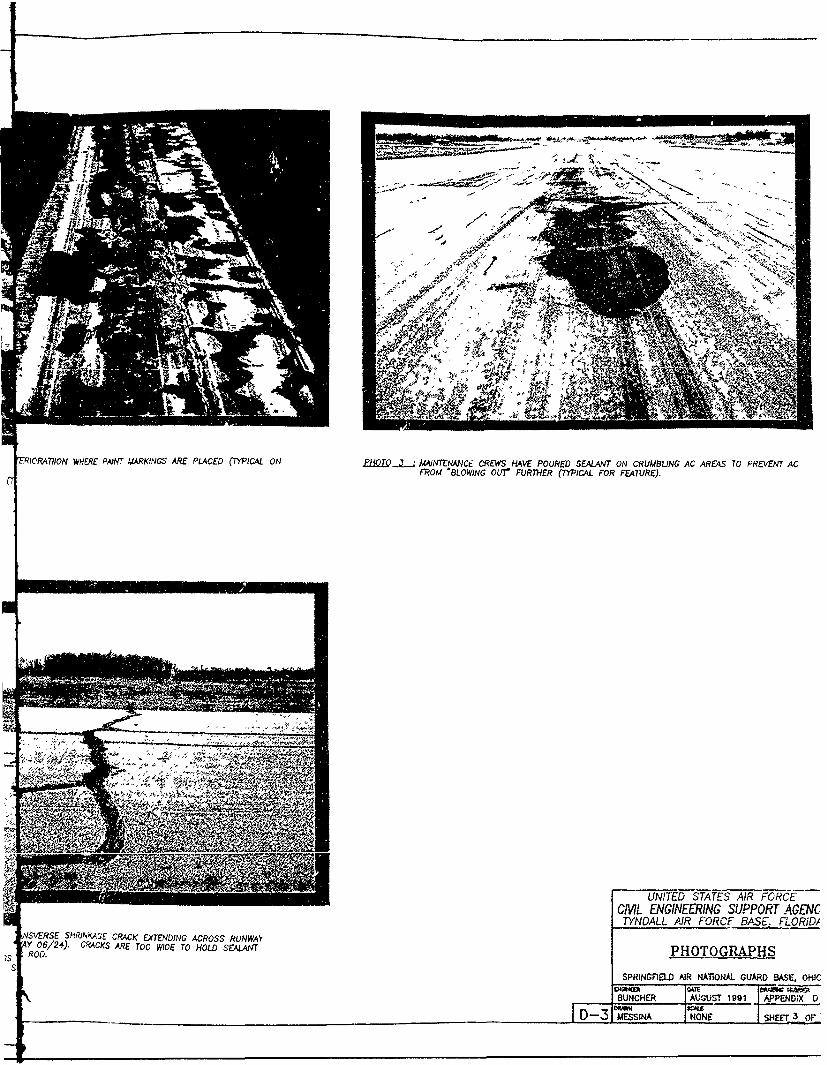
The longitudinal alligator cracking pattern that is presentalong most of the centerline is shown in photos 1 and 7.Maintenance crews have poured sealant in some of thesecrumbling AC areas to prevent the AC from "blowing out" any
11
further (photo 3). Alligator cracking has also developed alongtransverse shrinkage cracks such as shown in photos 8 and 9,where infiltrating water has weakened the base material. Photo6 shows a longitudinal crack that has developed the samealligator crack pattern from a weakened base. The transverseshrinkage cracks are as wide as one-inch. Photos 5 and 10 showthese wide cracks. Another less significant distress is thesurface deterioration where paint markings have been placed(photo 2). The difference in thermal expansion of the paintand the AC causes tension stress at the interface, and thus thedeterioration.
Feature R5C has PCC directly below the AC, and the joints arebeginning to reflect. This feature rates FAIR. There are somesignificant cases of shoving where a severe transverse crack inthe PCC is breaking up and shoving the AC, causing a raised lipat the surface (photo 4). Feature R4C is the worst portion ofthe runway and rates VERY POOR in condition. The distresses(alligator and shrinkage cracking) are the same as withinFeatures R2A and R3C, just more severe. Features R2A and R3Crate POOR. The intersection of both runways is in slightlyworse condition, possibly due to aircraft turning here.
2. Runway 15/33
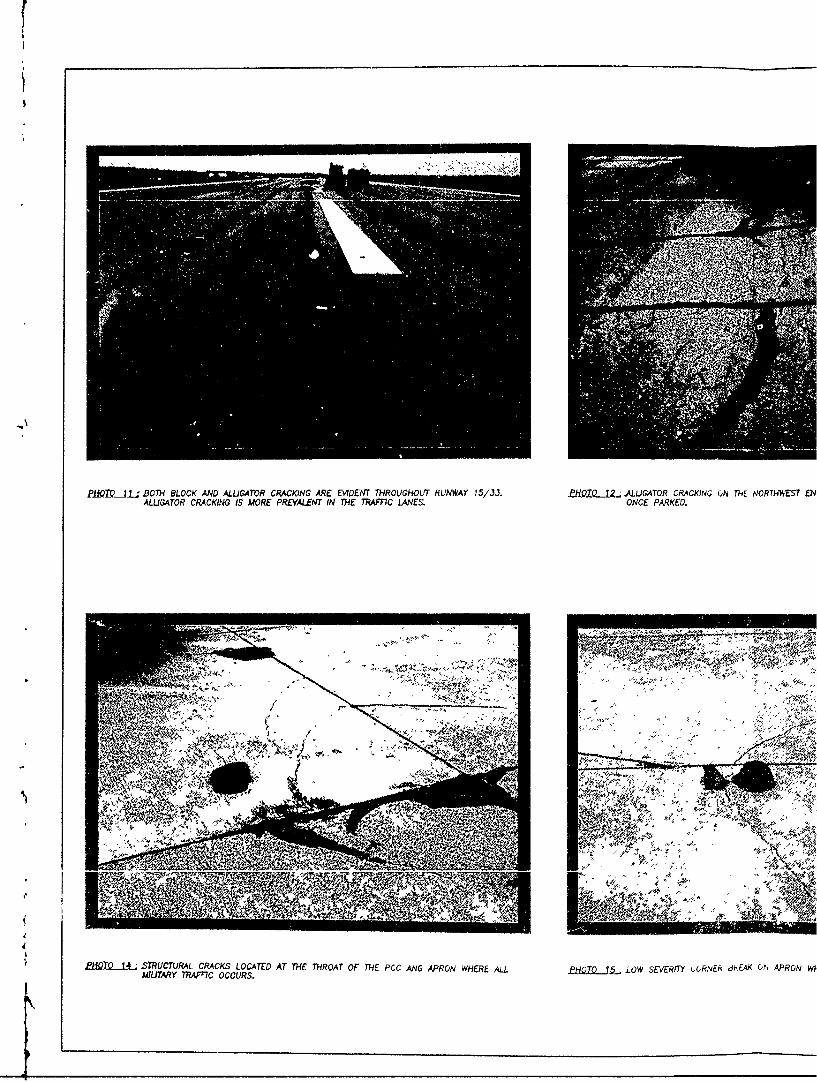
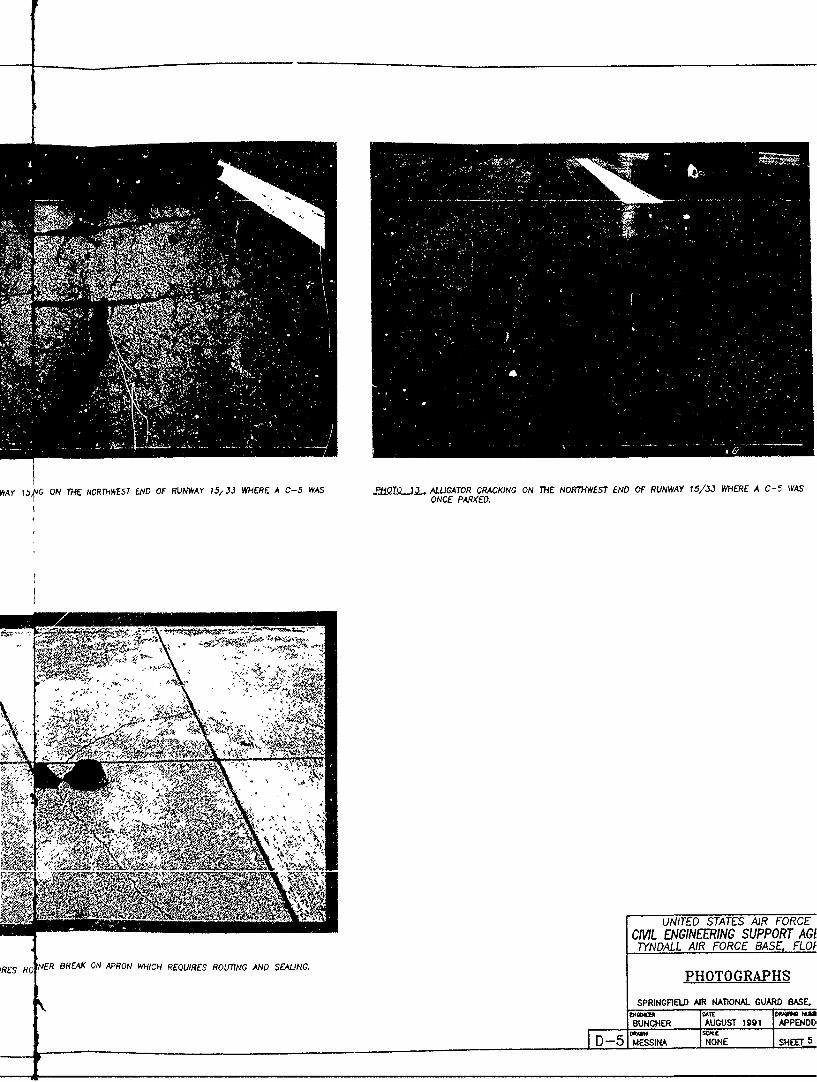
All of Runway 15/33 rates VERY POOR with both block cracking(caused from the AC aging) and alligator cracking presentthroughout the length of the runway. The AC has oxidized andbecome very brittle with age. While the block cracking isconsistent throughout the entire width, the alligator cracking,caused from fatique, is apparent only in the traffic lanes.This combination of block and alligator cracking is shown inphotos 11, 12, and 13. Photos 12 and 13 were taken in the areawhere a C-5 was parked several years ago and caused severedepressions as it pulled away loaded. These depressions havesince rebounded and were hardly apparent, except for thehigher severity alligator or fatique cracking present in thearea. The surface condition and field tests indicate thisrunway is all the same construction.
3. ANG Apron
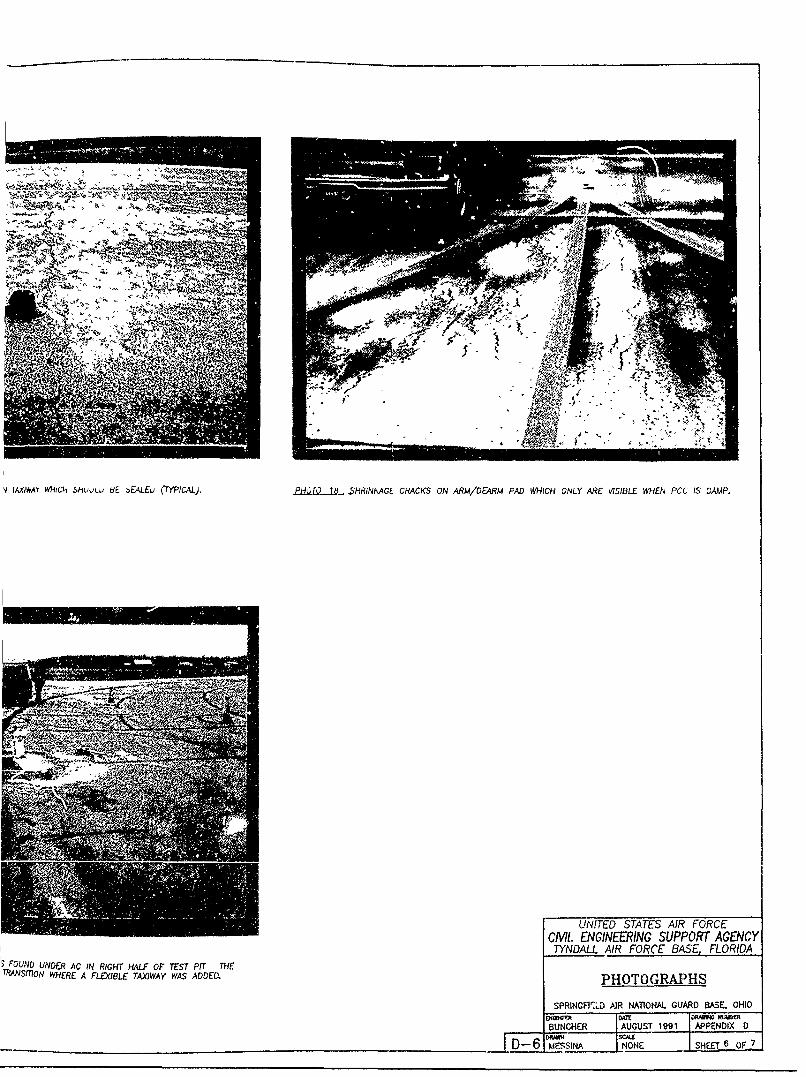
The ANG Apron consists of similar Features AIB and A2B, whichis a 150-foot wide extension of AIB. Both rate VERY GOOD andare six-inch PCC overlays unbonded (one-inch of AC) to theoriginal 12-inch (AIB) or 10-inch (A2B) PCC. Photo 16 showstest pit #I and the six-inch and 12-4th PCC layers.Structural distresses such as corner breaks and transversecracks are most common at the throat, where all traffic mustpass (photos 14 and 15). These low severity cracks should berouted and sealed soon before spalling occurs. Some transversecracks are propagating to adjacent slabs.
12
4. Taxiways
Taxiway G leading into the ANG Apron rates VERY GOOD with lowseverity transverse shrinkage cracks (photo 17) and very thinpaving lane cracks. The transverse cracks are greater than1/4-inch wide and thus should be routed and sealed. The pavinglane cracks are less than a 1/4-inch wide. However, sealingthem now will greatly slow down their deterioration and waterinfiltrating into the base.
The PCC arm/dearm pads rate EXCELLENT with only low severityjoint seal damage and hairline surface cracking. The sealantis pulling away from the PCC and is missing in areas on thenorth pad. The hairline cracks are only visible when thepavement is wet (photo 1S) and were probably caused from thePCC curing too fast.
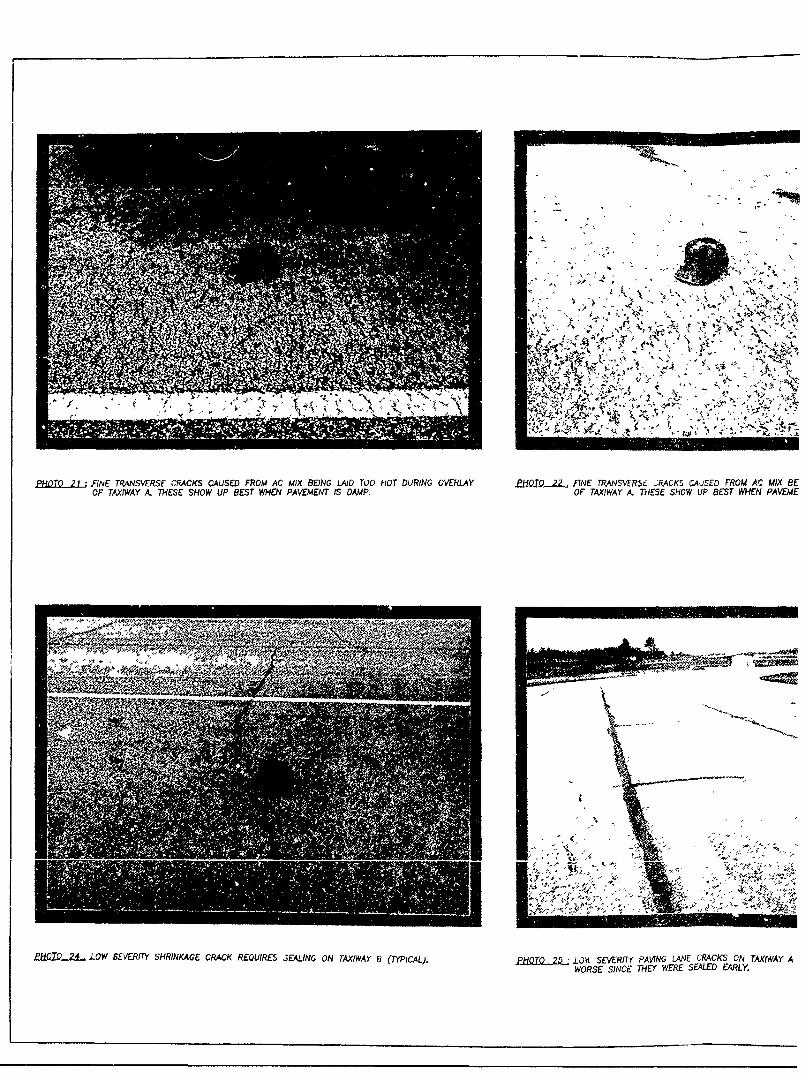
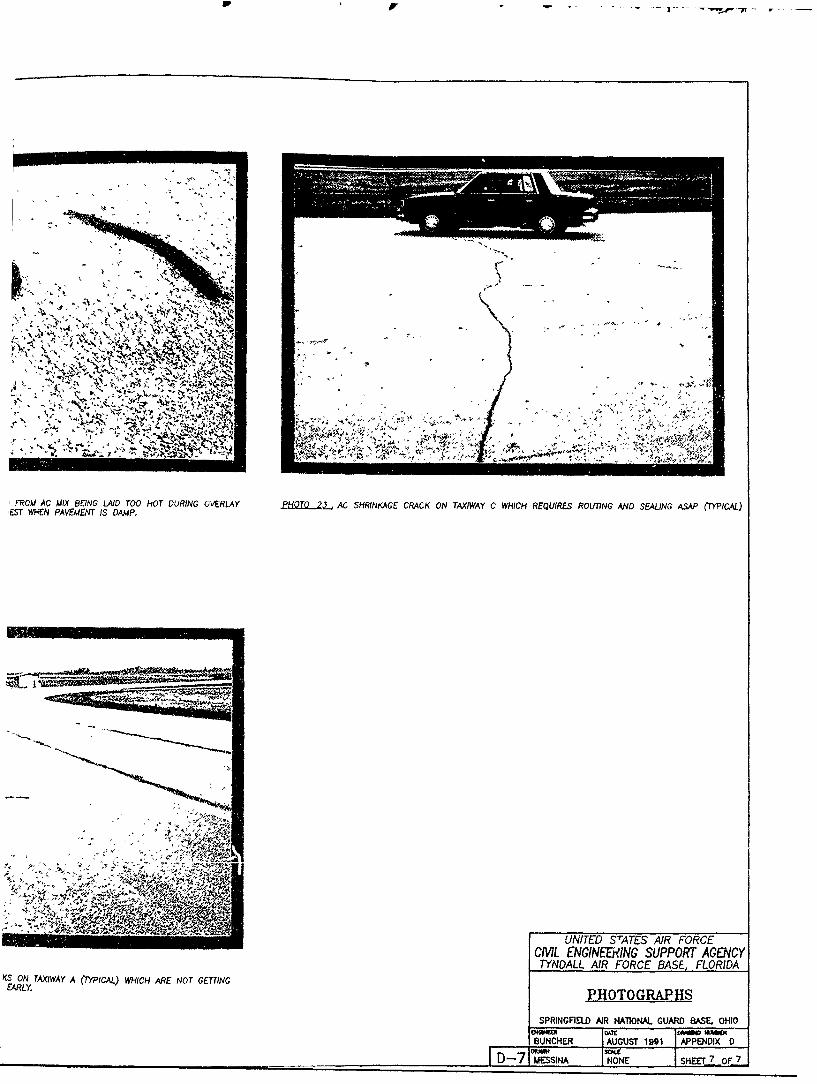
TaxiwayL, A, B, C, and F rate VERY GOOD and are most often usedby the ANG. The oather taxways are rarely used. Taxiway A hashad its low severity paving lane cracks sealed which willgreatly deter them from getting worse (photo 25). Very finetransverse cracks which are only apparent when the AC is dampare shown in two areas in photos 21 and 22. These were causedfrom either laying the AC down too hot and causing it to stickto the screed or rolling the AC when it was too hot. Rollingthe AC does not completely take these cracks out. Taxiways Bhas low severity paving lane cracks and transverse shrinkagecracks which should be routed and sealed soon (photo 24).Taxiway C has only low severity transverse shrinkage cracks(photo 23) that should be repaired quickly. Taxiway F has onlymedium severity transverse cracks regularly spaced every50-feet which are up to 1/2-inch wide (photo 19). They must berouted and sealed soon. Test Pit #7 was located in Taxiway Aadjacent to the Civilian Apron. PCC was found directly underthe AC in half the pit. The pit was excavated right at thetransition where the old PCC apron met the flexible taxiway.Taxiway A had been widened to include a portion of this AC overPCC feature. Photo 20 shows the test pit and transitionjoint. Taxiways D, E, and H rate FAIR, suffer from heavy blockcracking and are rarely used. They have transverse shrinkagecracks which are depressed from base failure or washout. Someutility cuts are also low.
13
B. EiedTestM
1. Both runways had very weak bases. Test pits #5 and 46 onRunway 15/33 had CBR values of 4 and 13 respectively. Testpits #3 and 14 on Runway 06/24 had CBR values of 19 and 13respectively. With only 3.5 to 6 inches of AC on theseflexible runway features, this weak base layer controlsstructurally and is the cause for the low AGLs and PCNs. Thefinal representative CBR values selected for the bases were 30for Runway 06/24 and 20 for Runway 15/33. They were increaseddue to the DCP tests which show the CBR values to only be verylow for the top few inches of base, and then they steadilyincrease. The CBR tests performed in the test pits were alldone at the top of the base layer where it is weakest. The DCPCBR values only match the actual CBR tests at the first fewinches of base. All four test pits were locateu where thepavement was badly cracked and water undoubtedly hasinfiltrated and weakened the top of the base.
2. A macadam base was found in both core holes in FeatureR4C. It was six inches thick. This feature rated VERY POORand had more alligator cracking than the rest of the runway.It is possible the macadem is less stable than the other baseand is the reason for the worse condition. Removing themacadam should be considered during the runway rehab project,since the plan calls for the base to be recompacted. It isalso possible to blend the pulverized AC into the existingmacadam and make it more stable.
C. Laboratory Tests
1. Lab testing revealed all base course material was frostsusceptible and grouped as F2. The six Frost Groupings are Sl,S2, Fl, F2, F3, and F4 with F4 being the worse. Whenevaluating for freeze-thaw conditions, a CBR value of 6.5 isgiven to F2 soil. This obviously makes all flexible featuresvery weak during the freeze-thaw cycle and is explained more inSection V.4. The base material was actually a high F2, meaningit is closer to a F-3 than a F-1. All subgrade samples weregrouped as a F-3 or F-4. Appendix E-3 shows each sample'sfrost grouping.
2. The subgrade samples shown as Soils Group "B" on AppendixE-3 classify as a lean clay. The base courses shown as SoilsGroups "A" and "C" predominately classify as a silty sand.
D. Summary of Allowable Gross Loads
1. The AGLs are listed in Appendix F Eor each feature. The
14
Related Data Table in Appendix G is needed to read andunderstand the AGL table. It describes the different AircraftGroup Indices and Pass Intensity Levels. An "A" on the AGLtable indicates the AGL is below the lowest possible grossweight of any aircrafh in that group. The "+" on the AGL tableindicates the AGL is higher than the maximum weight of anyaircraft in that group.
2. Pass Intensity Levels 5 and 6 on the AGL chart are used toshow the reduced AGLs during the freeze-thaw period. Thenumber of passes are the same as Pass Intensity Levels 1 and 2,but during the freeze-thaw period. As the AGL chart indicatesfor Pass Intensity Levels V and VI, most of the flexiblefeatures are structurally inadequate for even the lightestaircraft during the freeze-thaw period. This is due to thebase being assigned a CBR value of 6.5 because it was groupedas a F2.
15
SECTION VI: CONCLUSIONS/RECOMMENDATIONS
A. General Comments
i. A major project is planned for the AC portion of Runway06/24 which includes milling all the AC, recompacting the base,using the milled AC as a new base and overlaying with 4-inchesof new AC. This design should work well except that it doesnot resolve the problem of a frost susceptible base. Thecurrent design will increase the strength during thefreeze-thaw period, but not to the degree needed. Calculationswere performed to see how many F-16 passes could be obtainedwith the current design of 4 inches of AC over 5 inches ofpulverized AC over a frost susceptible base. Four cases aresummarized below:
Load Base Frost Base Allowable(Kips) _Groping CBR Passes35 F2 6.5 54030 F2 6.5 98035 F1 9.0 450030 Fl 9.0 2140
In all cases, the weak 9-inch thick base controlled over theweaker subgrade, which had a CBR of 3.5 assigned since it isgrouped as a F3 or F4. Because the base is a high F2, the lasttwo cases should not be considered.
2.. The design for the planned runway project assumes asubgrade CBR of 6, which is the value we obtained thru fieldtests. The design, using FAA guidelines, called for 25 inchesof cover over the subgrade. This was checked using Air Forcedesign guides and matched.
3. The same design does not mention the macadam base materialin feature R4C. Replacing this material or blending in thepulverized AC should be considered to increase its stability.At the very least, the contractor should be made aware of itspresence.
4. The top few inches of base on both runways is very weak, asreflected by the CBR tests performed at the top of the base andthe DCP tests conducted thru the base. The strength increasesseveral inches into the base. Infiltrating water through thecracked pavement has surely weakened the base. Section V.Bdiscusses the results further. PeCo .pa- -iN he ; %planned with the upcominq project is definitely needed, butdoes not address the freeze-thaw probitm.
16
Sgecific Conclusions/Recommendations
1. The cracks in the ANG Apron should be routed and sealed.The PCC will slall if left unattended.
2. The transverse shrinkage cracks in Taxiways A, B, C, G, andF should be routed and sealed ASAP. Backer rod will berequired if the crack is wider than 3/4-inch. The AFCESAAsphalt Crack Repair Field Manual will be sent to the 178TFG/DE and should be helpful.
3. Paving lane cracks In Taxiway B and Taxiway G are less thanan 1/8-inch wide. Sealing them now, just as Taxiway A wasdone, will greatly deter the cracks from getting worse.
4. Seal the few joints in the north Arm/Dearm Pad that have nosealant. This feature (TI2A) will require joint resealing in afew years.
17
GLOSSARY
Allowable Gross Load (AGL - The maximum aircraft load that canbe supported by a pavement feature for a particular number ofpasses.
Base or Subbase Courses - Natural or processed materials placedon the subgrade beneath the pavement.
Compacted SubQrade - The upper part of the subgrade, which iscompacted to a density greater than the portion of the subgradebelow.
Feature - A unique portion of the airfield pavementdistinguished by traffic area, pavement type, pavement surfacethickness and strength, soil layer thicknesses and strengths,construction period, and surface condition.
Frost Evaluation - Pavement evaluation during the frost-meltingperiod, when the pavement load-carrying capacity will be reducedunless protection has been provided against detrimental frostaction in underlying soils. Pass Intensity Levels V and VI areused with reduced subgrade strengths to determine the maximumallowable loads during the frost-melt period.
Pass - On a runway, the movement of an aircraft over animaqinary line 500 feet down from the approach end. On ataxiway, the movement of an aircraft over an imaginary lineconnecting an apron with the runway. AFR 93-5, Chapter 2.
Pass Intensity Levels (PIL) - Specific repetitions of aircraftover a pavement feature, regardless of time, that are dependenton aircraft design category. AFR 93-5, Chapter 2.
Pavement Condition Index (PCI) - A numerical indicator between0 and 100 that reflects the surface operational condition ofthe pavement. AFR 93-5, Chapter 3.
Primary Pavements - Those features that are absolutely necessaryfor mission aircraft operations. AFR 93-5, Chapter 4.
Fubarade - The natural soil in-place, or fill material, uponwhich a pavement, base, or subbase course is constructed.
_Me A TrafficAe - Type A Traffic Areas are those pavementfacilities that receive the channelized traffic and full designweight of the aircraft. AFM 88-6, Chapter 1.
Mve B Traffic Areas - Type B Traffic Areas are considered tobe those areas where traffic is more nearly uniform over thefull width of the pavement facility, but which receive the fulldesign weight of the aircraft. AFM 88-6, Chapter 1.
18
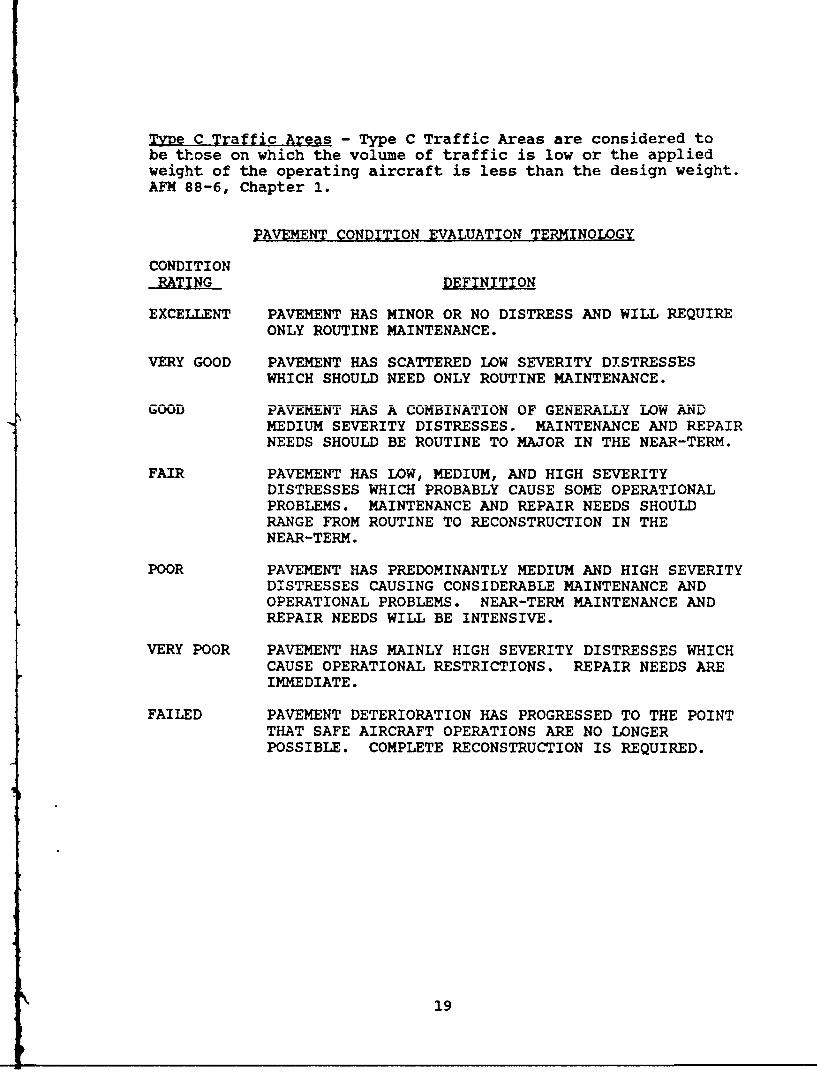
Type C Traffic Areas - Type C Traffic Areas are considered tobe those on which the volume of traffic is low or the appliedweight of the operating aircraft is less than the design weight.AFM 88-6, Chapter 1.
PAVEMENT CONDITION EVALUATION TERMINOLOGY
CONDITION_RAIN DEFINITION
EXCELLENT PAVEMENT HAS MINOR OR NO DISTRESS AND WILL REQUIREONLY ROUTINE MAINTENANCE.
VERY GOOD PAVEMENT HAS SCATTERED LOW SEVERITY DISTRESSESWHICH SHOULD NEED ONLY ROUTINE MAINTENANCE.
GOOD PAVEnMENT1 HAS A COMBINATION OF GENERALLY LOW ANDMEDIUM SEVERITY DISTRESSES. MAINTENANCE AND REPAIRNEEDS SHOULD BE ROUTINE TO MAJOR IN THE NEAR-TERM.
FAIR PAVEMENT HAS LOW, MEDIUM, AND HIGH SEVERITYDISTRESSES WHICH PROBABLY CAUSE SOME OPERATIONALPROBLEMS. MAINTENANCE AND REPAIR NEEDS SHOULDRANGE FROM ROUTINE TO RECONSTRUCTION IN THENEAR-TERM.
POOR PAVEMENT HAS PREDOMINANTLY MEDIUM AND HIGH SEVERITYDISTRESSES CAUSING CONSIDERABLE MAINTENANCE ANDOPERATIONAL PROBLEMS. NEAR-TERM MAINTENANCE ANDREPAIR NEEDS WILL BE INTENSIVE.
VERY POOR PAVEMENT HAS MAINLY HIGH SEVERITY DISTRESSES WHICHCAUSE OPERATIONAL RESTRICTIONS. REPAIR NEEDS AREIMMEDIATE.
FAILED PAVEMENT DETERIORATION HAS PROGRESSED TO THE POINTTHAT SAFE AIRCRAFT OPERATIONS ARE NO LONGERPOSSIBLE. COMPLETE RECONSTRUCTION IS REQUIRED.
19
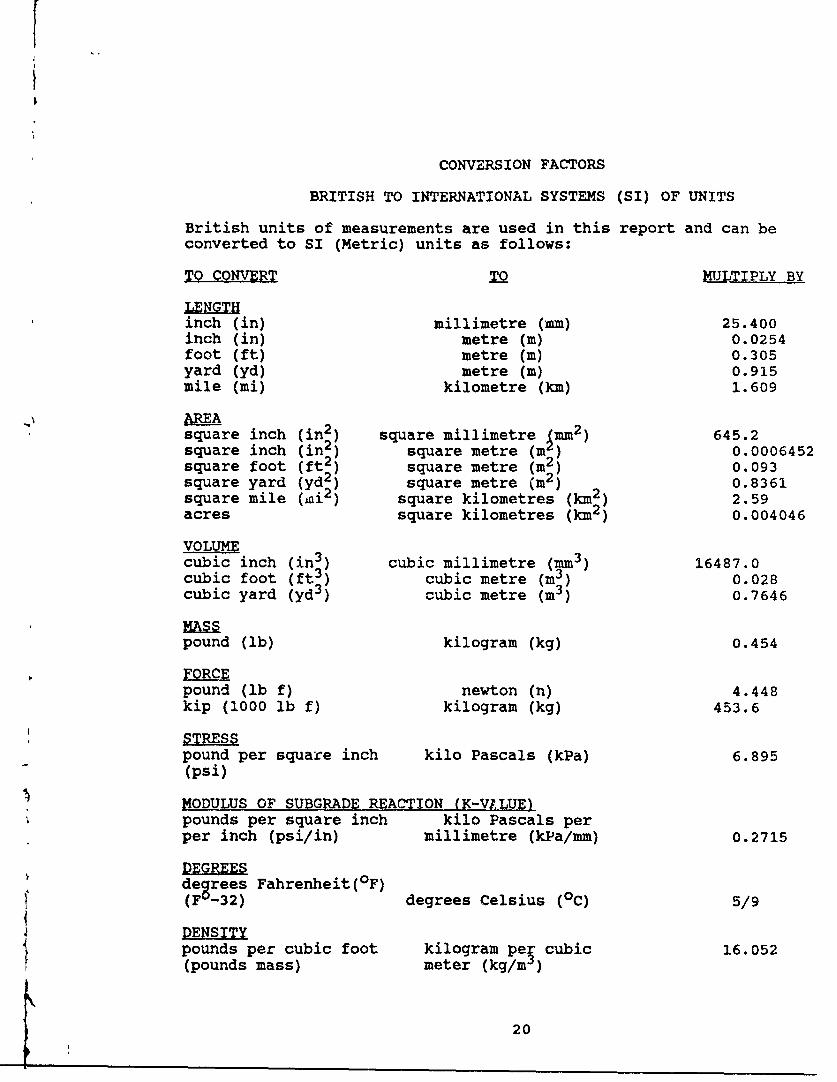
CONVERSION FACTORS
BRITISH TO INTERNATIONAL SYSTEMS (SI) OF UNITS
British units of measurements are used in this report and can beconverted to SI (Metric) units as follows:
TOTOON-VE I I!IjTIPLY BY
inch (in) millimetre (mm) 25.400inch (in) metre (m) 0.0254foot (ft) metre (m) 0.305yard (yd) metre (m) 0.915mile (mi) kilometre (km) 1.609
AREAsquare inch (in ) square millimetre Imm 645.2square inch (in2 ) square metre (m) 0.0006452square foot (ft2 ) square metre (m2 ) 0.093square yard (yd2 ) square metre (m2 ) 0.8361square mile (xi2 ) square kilometres (km2 ) 2.59acres square kilometres (km2 ) 0.004046
VOLUMEcubic inch (in3) cubic millimetre (mm3) 16487.0cubic foot (ft3 ) cubic metre (m3 ) 0.028cubic yard (yd3 ) cubic metre (m3 ) 0.7646
MASSpound (lb) kilogram (kg) 0.454
1EOQRpound (lb f) newton (n) 4.448kip (1000 lb f) kilogram (kg) 453.6
ISTRESS
pound per square inch kilo Pascals (kPa) 6.895(psi)
MODULUS OF SUBGRADE REACTION (K-VILUE)pounds per square inch kilo Pascals perper inch (psi/in) millimetre (kPa/mm) 0.2715
degrees Fahrenheit(°F)(F -32) degrees Celsius (°C) 5/9
DENSITYpounds per cubic foot kilogram per cubic 16.052(pounds mass) meter (kg/m3)
20
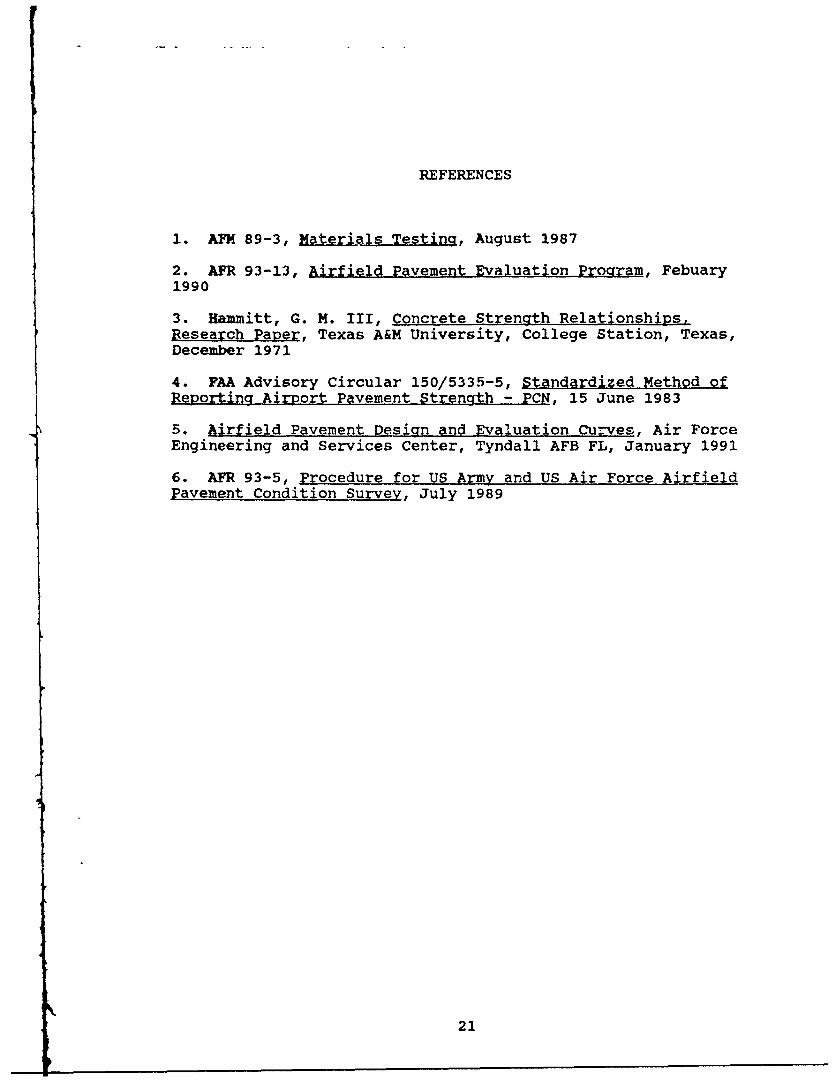
REFERENCES
1. AFM 89-3, Materials Testing, August 1987
2. AFR 93-13, Airfield Pavement Evaluation Program, Febuary1990
3. Hammitt, G. M. III, Concrete Strength Relationships,Research Paper, Texas A&M University, College Station, Texas,December 1971
4. FAA Advisory Circular 150/5335-5, Standardized Method ofReporting Airport Pavement Strength - PCN, 15 June 1983
5. Airfield Pavement Design and Evaluation Curves, Air ForceEngineering and Services Center, Tyndall AFB FL, January 1991
6. AFR 93-5, Procedure for US Army and US Air Force AirfieldPavement Condition Survey, July 1989
21
DISTRIBUTION
Copies
178 TFG/DE 6Springfield Beckley MAPSpringfield OH 45501-1780
NGB/DEE 4Andrews AFB MD 20331
ANG/CETSC 2P 0 Box 6010Minot ND 58702
USAE-CEMRD-ED-CT 7Attn: Terry Sherman12565 West Center RdOmaha, NE 68144-3869
HQ SAC/DE 2Offutt AFB NE 68113-5000
HQ MAC/DE 2Scott AFB IL 62225-5001
HQ AFLC/DE 1Wright-Patterson AFB OH 45433-5000
AFIT/DEE 1Wright-Patterson AFB OH 45433-5000
DMA Aerospace Center 2Attn: DMAAC/MCBSL3200 South Second StreetSt Louis AFS MO 63118
NAVFAC Division 1Attn: 04B1200 Stovall StreetAlexandria VA 22332
WESGP 23909 Halls Ferry Road
CRREL-EG 272 Lyme RoadHanover NH 03755-1290
2' 22
CERL-FOM 2P.O. Box 4005Champaign IL 61820-1305
HQ AFESC/TIC 1Tyndall AFB, FL 32403-6001
Defense Technical Inf~ormation 2Attn: DTIC-FDACCameron stationAlexandria VA 22304-6145
HQ AFESC/DEMP 15Tyndall AFB FL 32403-6001
23
A 1C8
NI ACR3 82 A CC V
35 AC
9 AC 6 AC
SC
6AC i3.A '5 5,
R 5 A
I ' t
7 L 612-----4
8AC A /
I \ /' ./77cc
P2A FFA7URE DiWCIC4flN ('SEE N~OTE 1)
13PC PAVF)/ENT ThICKP4S ~jt jNCH~s & TypE
Rl - RUHpSAyT - rAX(WAYA _ APRON
DiPI m 2ICA8EL(SEE NOTE 2)
A -A rfPE RAniC-. 6 TYPE TRAFIC
C - TYP'E TRAFT1C
~G C~ E iN FEAMlJI CO,HCA1ON
AC ASPHALIC C(JNCRlTEPCC PORWhAND CE7MENT GCWCRL T
'V NOT FJVALUATEV
IfAIJRE DCSIGMNAON DN) iE T17' OF FEATURE. IJLUER orMTURE rOR GM"N !TA1r~fL TYPE AND TYP'E 17CAnC AREA.
2. TIWIC AREA DES;GNATIONS ARE 9ASEO ON AMI 88-6, CHAPJ. ~FTWE EIGNA77ONS DO NTCORRESPOND WI THOSE
UNITED SrATES AIR FORCECML ENGINEERING SUPPORT AGENY
TYNDALL AIR FORCE BASE FLORIDA
*4 FUTAIRFIELD TA&YO UT-PLA4N
__ __ SPRINGREl) AIR NAIONA& GUARD BASE. OHIO
~#I~SC~tM BNCHE AIJUS1 199 APENDIX A
IA GRPC SET1Of,2
TAXrWN I'
ARO
KRON
~VRRN ~RUNWAY A 2
7A/
AMNG
'A~AY ATAXIWAY A
LL1 PRi MARY PAVEMUIrS
UNITED TA TES -AIR FORCE
CM). ENGINEERING SUPPORT AGENCYTYN DALL AIR FORCE BASE, FLORIDA
AJRFFLp 1SN ATIONS
Ammsw -1 SM Z1 W SPRINGFIELD AJR NATIONAL GUARD BSE. OHIO
~' BUNCI-IER AUGUST 1991 ARENDIX A
MESIA 1 -
SHEET _2OF 2j
CONSTRUCT ION N I STORY
SPRINGFIELD ANG BASE O!.
APPROXIMATE TYPE &
FEATURE DESCRIPTION CONSTRUCTION THICKNESS REMARKS
PERIOD IN INCHES
R01A RUNWAY-06 STA 0+00 1985 12 PCC COE RECONSTRUCTION ANG PROJ 33-85-R-0001
TO 7+00 REMOVE AND REPLACE WITH 11"BC and 12" PCC
R02A RUNWAY-06 STA 7+00 1947 3 AC COE ORIGINAL CONSTRUCTION
TO 17+00 1954 2 AC PROJ. 78-08-01 OVERLAY 75, KEEL
R03C RNWY 06-24 STA 17+00 1947 3 ACC USCOE ORIGINAL RECONSTRUCTION
TO 47+00 1954 2 AC PROJ 78-08-01 OVERLAY 75' KEEL
R04C RNWY 06-24 STA 47+00 1954 3 AC USCOE ORIGINAL CONSTRUCTION PROJ. 78-08-01
TO 58+00 UNK 2 AC UNK
R05C RNWY 24 STA 58+00 1954 10 PCC USCOE ORIGINAL CONSTRUCTIOP PROJ. 78-08-01
TO 65+00 1958 USCOE PROJ.AW 86-04-01 ADD 300CPCC OVERRUN
UNK 4 AC UNK
R06A RNUY 24 STA 65+00 1962 3 AC 600' RW EXT. COE AU-86-04-02
TO 71+00 unk 3 AC UNK
R07A RNWY 24 STA 71+00 1962 10 PCC 400' RU EXT. COE AW 86-04-02
TO 75+00 1985 12 PCC OHIO ANG PROJ 33-85-R-0001 REMOVE EXISTING
PCC REPLACE WITH 11" BASE 12" PCC.
RO8A RNWY 15 STA 0+00 1947 3 AC COE ORIGINAL CONSTRUCTION
TO STA 10+00
R09C RNWY 15-33 STA 10+00 1947 3 AC COE ORIGINAL CONSTRUCTION
TO 45+50
R10A RNWY 33 STA 45+50 1947 3 AC COE ORIGINAL CONSTRUCTION
TO 56+00
TOA RNWY 06 ACCESS 1947 3 AC COE ORIGINAL CONSTRUCTION
1954 2 AC PROJ. 78-08-01 OVERLAY 25' KEEL1982 6 AC 3" LEVELING COURSE WITH 3" SURFACE COURSE
TO2A SW ARM/DEARM AREA 1982 9 PCC REMOVE EXISTING PAVEMENT RECOMPACT AND
INSTALL NEW PCC
T03C RNWY 15 ACCESS 1947 3 AC COE ORIGINAL CONSTRUCTION
UNK 2 AC UNKNOWN
T04A PARALLEL TXWY 1947 3 AC COE ORIGINAL CONSTRUCTION
1954 2 AC PROJ. 78-08-01 OVERLAY 25' KEEL
1982 6 AC 3" LEVELING COURSE WITH 3" SURFACE COURSE
TO5C TAXIWAY ACCESS AT 1947 3 AC COE ORIGINAL CONSTRUCTION
RUNWAY INTERSECTION 1954 2 AC PROJ. 78-08-01 OVERLAY 25' KEEL
T06C APRON ACCESS TXWY 1947 3 AC COE ORIGINAL CONSTRUCTION
UNK 1 AC UNKNOWN
T07A ANG APRON ACCESS 1954 3 AC COE ORIGINAL CONSTRUCTION PROJ 78-08-011982 3 AC OVERLAY ASSUMED AS PART OF 82' OVERLAY PROJ
TO8A APRON ACCESS FROM 1947 3 AC COE ORIGINAL CONSTRUCTIONRNWY 06-24 1982 5 AC OVERLAY ASSUMED AS PART OF 82' OVERLAY PROJ
T09C RNUWY ACCESS TXWY 1947 3 AC COE ORIGINAL CONSTRUCTION
UNK 1 AC POSSIBLY 1954 RNWY EXTENTION PROJ 78-08-01
T1OA PARALLEL TXUY 1954 3 AC COE ORIGINAL CONSTRUCTION PROJ 78-08-011982 6 AC 3" LEVELING COURSE WITH 3" SURFACE COURSE
B-1
T11C RUNWAY ACCESS 1954 3 AC COE ORIGINAL CONSTRUCTION PROJ 78-08-01
YNK 6 AC 3' LEVELING COURSE WITH 3" SURFACE COURSE
T12A RNWY 24 ACCESS 1962 10 PCC COE ORIGINAL CONSTRUCTION PROJ AW-86-04-021985 12 PCC PROJ 33-85-R-0001 REMOVE/REPLACE WITH 12 PCC
A016 ANG APRON 1954 12 PCC COE PROJ 78-08-01 CONST. 830' x 300' APRON
1976 6 PCC ANG PROJ. 74-21 1u AC BOND BREAKER OVERLAY
WITH 6"PCC.
A02B ANG APRON 1958 10 PCC COE AW 86-04-01 155'x 830' APRON EXPANSION
1976 6 PCC ANG PROJ. 74-21 I" AC BOND BREAKER OVERLAYWITH 6" PCC.
B-2
F p. F, -~
II-
/
N -
F-/
_________________ *1 ________ .- ___
/
1
//
- ----------------
TEST PfT LOCATION AND NUMBER
CMLUNITED STATES AIR FORCE
ML ENGINEERING SUPPORT AGOTYNDALL AIR FORCE BASE, FLOi
4v'w $CAL IN FMT EST PIT OCTIONStoo 0 l "w 300 t4SPRINGFILLD AJR NATIONAL GUARD BASE, 130 0 100) 200 300 4.oo _________________________
SBUNCHSR ANusT 1 APPENDIX
_ _ _ I scI
TEs r PIT 1 I ___TESTRPT 2DEPTHI MATERLA I co CE 55 U./PI K DEPTH MATERLAL w -/d -CE 55 LL/PI 0 E TH
(In S)WL ASIF(~ (~I 1 coupl ouc N~ p/n)l (in) SYMSOL CLASS1F (X) (pcf) %COMPI 0MC MX (psi/in') (
ooo% ACA6.0 ::p 5.0
7.0. *. - - . 12.0
A90.. GM 7.5 136.7 NP 250 19.0
CLML 129.5 231/01024..2601. .2 24.0 9.2 34.- 24.0
Cl.0 12.3, 27Cl1.6.0
C'-
9216.7
48.012.648.013.648.0
60.0 13360.0_ I2. I 4 20Y L 0COMMENT:
I INCH BOND BREAKER 56TWELN AC AND PCC.
R 8A Ri10 ATEST PIT 5 TEST PIT 6
DEPTH FTRAL r7 d CE 55 LLP ~~ICSR DEPTH MATERLAL y~ d CE 55 CLp 8RDET
(in) SlOLCLASSIF. (5 pcfI) COUAP O (Y) (in) SYMBOL CLASSIF. (M (pcf) SCOMP OMO (m (On)
315 ~4.0 A
8.0 132.3NP 490NP 18.
12.5 NP 4SM 6. 13085
SM 103 133.8- NP~.. I 20 12.5 SM 616 14.0
36.
48.0 - - 17.31 369N s2 02.
60.02. 20.-i1.2L -6.01.
COMME
L!S
R30R 3 CTEST PIT 3 TEST PIT 4
55 LI./PIl K DEPTH MATERIAL w /d CE 55 u.LL/PI CRDEPTH MATERIAL -f d ICE 5 _____CB
- C 5 LLP CBR
OkC (0% ) (in) SYMBo0 CLASSI( (pd) SCOMP NC (q) VCRBOL C.ASSIF () (po) rC-MP OMC ()
5.0 o6.0
SM 6.2 134.0 NP 19 SM 1382 NP 13- -. 7.8 12.0 10.2 .2
NP 250 15.0NP 20 SM 136.2 NP 27
27.0 124.0 -NP 93Z7.2 -27.0 1. 3-18.7 113.1 25.0 C 132.2 28.2
36.0 17.2 i,36.0 13.3
4,1 -O 14.9 4.8.0 13.4
60,00.-- 252 60.0 - 12.6
4 C
TEST PIT 755 C8 MATERIAL y 7 d CE 1 CBR
04.1 (X)i) CLASSIF.(5(pcf)%CM NM (5)
NP 13 8.5 o::oo AC ,
Sm 132.1 NP 100+
NP 131. 1.
NP 138.8 138.8NP.4 132. 11.8 120.120.4
Im40.4/ 136.0
2 UNIFIED SOIL QLASSIFICATION
SI' POORILY R0E SAA9SW-SJM #ELL-ROWED SILTY SANDSP-SM POORLY GRADED LTY SANDSm SILTY SAND
cL LEANA CLAY (LOW TO UEDIUM PLSTC
CL-ML SILTY CLAY (LOW TO MEDIUU PLAT(
TEST OF SUBGRADE NOT PRFORP:,TD DUE TO RAINSG IS ThE SAME AS TEST pr, 4 AND 5._______________UNITED STATES AIR FORCE
CML ENGINEERING SUPPORT AC7YNDALL AIR FORCE BASE, FLC
TEST PIT CROSS SECTI
SPRINGFIELD AIR NATIONAL GUARD BASE,
BUNCHER AUGUST 1991 M
I C-21 MESSiNA NONE SHEET
( 41) e pcc ( i ) / 2 : AC ' 2 25 PC C (9 )
9 A
(4.) 6 F'cc (720) / I AC I ZS Pcc (20)
(12) ~~34 9J AC ACc:_
(M)) 52- ACC PC(R (7 5(10)) AC
(20 ,26 (
('A) . . .
17.25 A
/a9) 73 PIC f~9 At (7) e25 A (J) S5AC\ I
( 2 v , 2 P C C ( 8 02 ) /(2' -C (c 77L,)
,14) 325 A
()3' AC
1 -j-
e7)) 2 PC 03/) / 7.26 AC 2 2 CI /()14) 6 fEC (7-) / AC / M12/ PQ (820)
z e. c C (C) / y7.5 AC 7 5C C (( )/ (
(4Z)(4, 8 25 PCC (64) / AC /0 5cc (-T
(4 ) - -4 __ __ " (A / 2 AC/0 POO (93p)
(4,0) PCC (&4)5 10 75 PCC (P93)- 5 PCC (Nil 7) sztA k)2) F2 Oc (724) / 75 AC /701; PCC (7,11)
4) ,%0 CA 6 U4C (4P) Y2 A,
4.,C. Am~ 015) 17.25o EF. ACCP (26 .2 1113
AC AC MON5RETE
4A. *( 5AC 7) AC A '4 ) 5 AC 4.5)f MAC(34
4 ((2) 17 REVC (c )
,( 5) 445 AC 4 U dC (24)A
2f UN2E5 A-TE AIR 5.FOR1)723A 24 2f 84
INVI N NE A)EI m ND SPPORT.TY CNCALL AR FC ORE SEF
AC AAHL CNRT
4 ~ ~ ~ ~ ~ ~ ~ A ACM0AOAOAU)2:) Z Pc(q
9" V '__ _co-_ ____s __ o - _ _ T-- - _
1
(25 4x Ao 10 POO (82
IUNCHED STPE AIR FAR
OFc- NDAL I FORC EC( ASE.R
III 0 ~~05 205AC SPtING7L CONRETE ONLGAR A
~~W14" OCAI h Ia117
(MT)NOT ESr AGS 99 PNOTP EVALUATE
R3 C R 3C R 3 CCORE HOLE/ TEST LOCATION 1 CORE HCL / TEST LOCATION 2 CORE HOLE T ST LOCATIODPH BRCOR FROM VCP DEPTH C3A CBR ROM DCP 0DTH CB
ODOLE) SAT (W SAT SAT
AC 77 T11-AC T JAC-0.0- -, 60- - - 6.0--
24.0.- 24.01 40
:.. 0.0 30.
300 3606 3 0,
24 .] - 420- 1420-.
R C R 6 A RCCORE HOLE / TEST LOCATION 7 CORE HOLE / TEST LOCATION CORE HOLE / TEST LOCATIC
ovP 088 Cb fRI. ()NCPTH CmPc ~DI( SAT C. C C. C n R M-- SAT
AC -,I' AC' ~ V T4-4-4.'' 6.6 Pcc ,6,.0 ' ~ , - 1 i 1 44, 1; Pcc T! ;
_ Ii I .| '24-, ,
30300 CI ' 3,0
8.0- L;L' 48.0 [ I L
4480 -4 2' -4
RC kC__CORE HOLE/ TEST LOCATION CORE HOLE / TEST LOCATION 1C 4-COR[ -,LL / TET LOC
omcR 8 MtP OS cog FROM F o~tcI'0P1IO C6'R Nl(U IDCI"--.-' -- - fRm - -- - Ln M -
I .- !- l SAT I i SAT ' . "
1-- . , p - ! nli 'l
12. 12024 A
30010030
" I"8-i i I 3 -0 .. .t , i.t-
42 0.- 420
-40 t 48 ' t
T IA T 2A
0" , -c 0 , aR Rom rI E tlit C1! FROM DC
.0 AC :_'l.._.._ __80 PCC
'o A2 D - J j 7 1 12.01
10.0 10
24
424.0
0 {l'~300.3 .0 -I 36.0I 2.
R 3C R- 3 C 4!E HLE /TEST LOCATION ___ CORE HOLE / TEST LOCATION 4COEHL/TSTOAIN 5
FRO ODoi CBCBRDI COR FROM DCP~0- ~£ ~SAT .'. r FROM0606 R~lDIv--i. 1 1m AAC 771
II 2. ~iiI 6.0 ACI
2. __ [1li____ TJCHOLE/ TET COE HOE /TESTLOCAION 00
420-
4 ] <8 0-
R ~C T 3HOLE TEST LOCATION CORE HOLE /TEST LOCATION 1OEHL ETLCTO 2
FRO D CO CBR FRO C' ) ~~OM DC'
s*i FR[OM
IISO
* r IK ~10-i42 4- 12-I W__7IL j _ _ L_ L !,
CIA NCI' *-p DEPPIA, l C AR -F70 E P14 F OT
COBONI orom,'
DC71
NTE STATESl AIR FORC
-4 ESNA NN HE 4O'
T 2A R___ R7 A R7 A
CORE HOLE / TEST LOCAIN 2 CORE HOLE /TEST LOCATK'N 22 F 5CORE HOLE /TEST LOC~OLkTTION 20 T CORMDSY" COR Ca FR~OM DCP FO
CO1T" O CM FROM Ce ROM In SA
nig ~ ~ 2 2 2 29 (10) SAT 'TST
6.0-
T 11 1 12 .0 -
77- ijII 4 24~~. Oii
s ]I 4 -b
48.20 I 42-I1I-
WIST TERMNATED DLE TO ROU
N 1A T_ I 1
CORE HOLE / ETLCTO TEST LOCATION ES OAIN LCORIE HOL[ TEST LOCATON-
:)04 C4 CR4 FROM6 rCI_____Rem_
I RCCM
!12.01,-
24.- 124..-
124.
T4 T 4 A- 0
CORE HOLE /TEST LOCATION 341 CORE HOLE /IEST LOCATION 35 CO0RE H(J '_ TEST -LOCATION
-- ~- -_ -2'h CM Af~ CRM~i- U FO P
FROM FRC -- P IRM
I __41I~rTj T--T 7T I 7 -- T-TT T T~T AC 1v p 7.o 6 O_ ACI ---- 7
ALB T1 10u
CORE HOE/TS OAIN 4-OR OE/TS OAIN 4No T CMFOMOR0-h-- R RC
I60 F!2-
42]2 L_0.-
42.0-4 2.0--480 14..i _____ r i... 11
A I- B__ T I0
CO.E NOLE TA sIIESNT- LATION- 451CR OE TETLCTO-4
R 7A R R7A T 12 -A ____
CORE HOLE / TEST LOCATION 24] CORE HOLE /TEST LOCATION ~CR OE/TS OAIN 2------ DEM MR4 CD R FROM DCP~-
""T ()) sxtFROM
__~-1 '-1 7 7 TT 0"')-~~. 2 n SAT__26.0 T
2.0.- 1
18,0-b
IIL80 fii-
2.0.- 642~ S- at7~ TTT ~ ' TT ~ T
42142.0
CORE HHLTETTSL LOTATIOCORE1CHOLEHOLETESTLOCATION 73-S~rI -- I 8R FROM MPR
- RC 070CMFOSA (iSATr IlAC - 7 -- 7-T -7- F-7- -- -7 7yT
-- 4(
KIS - 36 (1I---. ~ ~ ~ ~ ~ ~ ~ 4 - - wLiI IA.u
--- -L L LCNA -7-1 TNWL
CORE HOLE TET L) 1 361 1 CG- P.T HGo E TESTT ni L OCTO'CR OE TS OAIN 3
FROM c- 'RollNL CORIN FRA1 V
TUIE ST9T4 AIR FORCE-gCML _T ENIERN SPOT;AG4C
AOC TYIAL I OCEBS, LRD
S!II~iL AIR AA A GUR0AS. O I
LUCER AGST19 APPNI1.5_NCESC__AI BTENTNE LAYERS 53 Of
- 7-,-'r.7'~,'7 / / ,/j*
~... .... . . .. . . . . . .. . . . . . . . .
Fe/M
__ ~or
wpy GOCOp
FAILED
UNIIED STTES AIR FORCECWIL ENGINEERING SUPPORT AGENCY
TYNDALL AIR FORCE BASE, FL ORIDA
ioo 0 ~ SPRINGFIELD AR NAMiONAL GUARD BASE, OHIO
W-l1 LCF BUNCHER AUGUST 19011 APEN'IX )
___________________________________________________MESSINA SHET11O,
19
1 ~;~23
ifs
r2
55
'42
24
21 PHTOGAPH LO(.AY7ON. DIRECTION AND NUMER
UNITED STATES AIR FORCECML ENGINEERING SUPPORT AGENCY
TYNDALL AIR FORCE BASE, FLORIDA
_ PHOTOGRAPH -LOATIONS400 0 400 000 IM0
t-M ISPRINGFIELD AJR NATION,h. GUARD WAE. OHIO
l oo 0 BO 0.00 400 ~0 BUNC f=t ~BUNCHER AUGUST 1991 APENDIX V_
ID-21 MESSINA 0RPI _HET2 p7
-, 10
PHOTO ~ ~ ~ "$ I ALIAO-RCIGO ETRIEO UWY014(YIA).PQ02A UFC EEIRTNWEEPITMRIG
RU WA 06 2)
~~J** ALIGATO CRCRAC ON CENORIN OFICUNHA 06/24IORATEDcAL). HAS.2 AASE SURFACE DEE RAIO WEEPAN AR
Eb~OI.A. .NOERL1NG CC CRCK OF~IOIN WHIH HASDETERORATE ANDHAS CUSEDEIVE0tNDy JIIGHSEVERTY rPPJ INRSE H N CRACCRAC E~i
OF AC SURFACE. (TYPICAL ON RUNWAY 06/24)- CRACKS ARE TOOIWITHOUT A RACKER ROD.
$44
ERIC'RATIION WHERE PAINT 1,ARKNCS ARE PLACED (TYPICAL ON PRO~L 3 )NTtNAMCE CREWS HAVE' POURED SEALANT ON CRUM4BLJING AC AREAS TO PREVENT AC
(T FROM4 'SLOWING OUT" FURTHER (TYPICAL FOR FEATIURE).
7<., $
UNITED STATES AIR FORCECML ENGINEERING SUPPORT AGENC
)4SERS SR~t.GE CRACK EXTENDING ACROSS RUN WAYV7NQL I OC AE LR~0 0624) C.CKS ARE TOO WIDE TO HOLD SEALANT
3sROD. PHOTOGRAHSSPRINGFIELD AIR NATION&l GUARD BASE, OHIC
BUNCHER AUG.UST 191 g PNDX
_____________________________________________D-3_______________ NONE SHEET 3 OE.
2~44 47~~ ~>,* 4N
4444,73
PBL ALIGATOR (,RACKING hAS DEVELOPED ALONC~ THIS SHRINKAGE C RACK WHICH IS OUTSIDE PHOTOL7 ALLIGATOR RACKJNG A..0NG TRAFFIC LANES ON RHE TRAFFIC LANIE DUE TO INFILTRA77NG WATER WEAKENIN(- THE aASE COURSE.
- 4 114 =12424ffi ml
7"T
BLOM It--TRASVESE AL'5TORCRACINGON RNWA 0624 (YPIA1 1 PHTQ 0 . RANVERS SHINKGE ,ACK SUC AST4E
WID (tYPICAL
AOGTAFC LANES ON RUNWAY 06/24 qTYPICAL). BM - .STRUCTURAL CRACKING ON RUNWAY 06/24.
UNTE TAE ARrOC
CM ENIERN UPOTAEC
TYDL AI$OC AE LRDE RAKS5UH STHSEONRUWA 614 REON IC
0 PHTORAHSPIGI9)ARNTONLGADSSOI
EN;WM DAEDAW u
UNTED ASTTES1 AIRNFORCECMLW ENIEEIGSUPR AEC
MSSRINA~EL AIRNONAI UR SE- OHIO
TA
AfA
PH 4 OTO : BOCK M)ALKSLOGATR CACKN AHE EVIDENAT FTHROC OUT ARN WER ALL33 jEdQI:njj LGOW CEVRCI (ON fiEA NO RONES wALLIGATR RACKING OCUSMR RVLN NTETAF AE.OC AKD
WAY 7.,PG ON THE NORTHW"EST END OF RUNWAY 151,33 WHERE A C-5 WAS PHOTOIJ1 ALLUGATOR CRACKING ON THE NORTHWEST END OF RUNWAY 75/3J WHERE A C-5 WASONCE PARKED.
-'M NZ
4. .
UNITED STATES AIR FORCEMOMMO!CIWL ENGINEERING SUPPORT AG,
TYNDALL AIR FORCE BASE, FLOi
fRES RO :NER BREAK ON APRON WHICH REQUIRES ROUTINtG AID SEALING.PH T G A S
SPRINGFIELD AIR NATIONAL GUARD BASE.
BUNCHER 1AUGUST 1991 1APPENDI:
D-5 Isi iSLM5
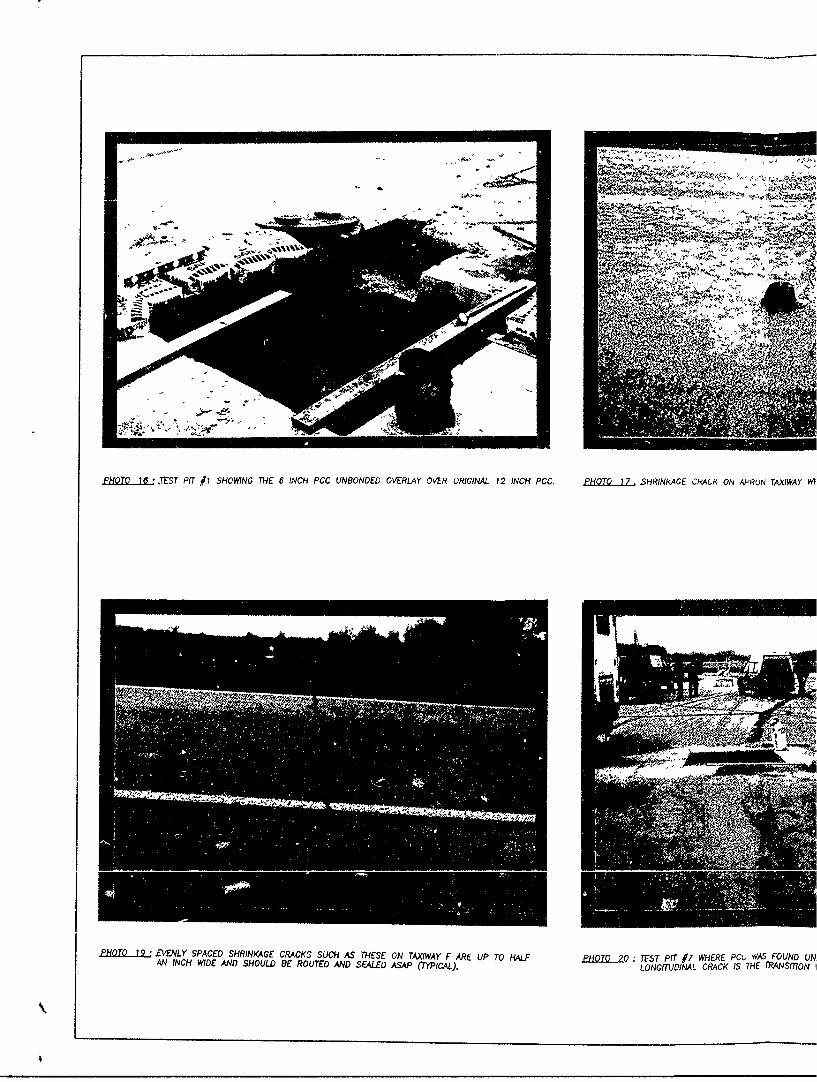
PROMQJ 16TEST PIT #1 SHOW7NG THE 6 INCH PCC LINBONOED OV~ERLAY OVER ORIGINAL 12 INCH PCC. ThIQJLZ $HRINMAGE CRACk ON AJPRUN TAX~IWAY W
MMiQI2LL EVENLY SPACED SHRINK(AGE CRACKS SUCH AS THESE ON TAXWAY F ARE UP To HALF PHOTO 2Q0 TEST PIT #7 WHIERE PCf, WAS FOUND UAAN INCH WIDE AND SHOULD BE ROUTED AND SEALED ASAP (TypICAL). LONGITUDOINAL CRACK IS THE TRANSITON
V..4; V >
Yd iAKIWAY IW11Ch~ .$HOJLL BE. SEALEU (7iYPICAL). ?&Q JJL, .SHRINKAGE CRACKS ON ARA4/DEARM PAD WHICH ONLY ARE VISIBLE WHIEN PCC IS DAMP.
UNI'ITED STATES AIR FORCECIVI. ENGINEERING SUPPORT AGENCY
TYNDALL AIR FORCE BASE, FLORIDA5 FOUND UNDER AC IN RIGHT HALF OF TEST PIT THETRAJJmO WHERE A FLEXIBLE TAXI WAY WAS ADDED.PH TG A S
SPRiNFD AIR NATION&l GUARD BASE. OHIO
BUNCHR AGS 1991 APjPENDIX D__________________________________________________ DMESSIN NOF SHj 6~
I .
, P,7 1w
T
PHOTO 21_ .FINE TRANSVERSE CRACKS CAUSED FROM AC MIX BEING LAiD TOO HOCT DURING OVERLAY PHjQ22L. FINE TRANSVERSE k;RACKS CAoJSED FROM AC MIX BEOF TAXIWAY A THESE SNOW UP BEST WHEN PAVEMENT IS DAMP. OF TAXI WAYV A. THESE SHOW UP BEST WHEN PAVEME
EffQO. .1.0W SEVERITY SHRINKAGE CRACK REQUIRES ;IEAJJNG ON TAXIWAY B (TYPICAL), p.QfTo 2 LOvt SEVERITy PAVING LANE CRACKS ON TAXI WAY AWORSE SINCE THEY WERE SEALED EARLY.
- - - .
'NoKh
FROM AC MIX BEING LAID TOO HOT DURING OVERLAY PHOTO 23~ AG SHRINKAGE CRACK ON TAXIWAY C WHICH REQUIRES ROUTING AND SEALING ASAP CTYPICAL)EST WHEN PAVEMENT IS DAMP.
~0~.wUNIEOSrTESAI FRC
C0 EGNEMN UPOR GECTYDL AIR' FOC BASEFLRID
KS~ ~ ~ ~ ~~~- ON AXWA A(TPIAL WHCHAR NT ETIN
BICWJL ENGNEAUiG SUPPOR APENCY
D- UNHE AUUS 1901 APPNDI 70F
LUO~d I r I Iv 1 I lnCAUX ,.
LL) 5. . Cl5J ~ 5~ J 5~
8-1 51 -1w & FS -
Z...o I4 I- I I-2
Z< -t -1 -1 -
0 LV 0 t I.- V) 0 LnM Vcc .- Z .Z I 2 I 2. innzco<.-.L <.~ CL .y a. x. <c X4 <Vini)V$in CDni V) 0 n~ in ini i'n tn i
C,- In
cn- 0 I-- . )V )0 9 L<a -i in inz- z z z
4.-
.- t-
oLI.
U
<- 0 <
-M = n Lfl* in
uJ
> a
____ NC-
o 0 0 0 i n-c - - - m - - -
oA 0 C 0u
20 0 0; 0 C , 0 on in 0 0I- 0n -n In tO Cn L n in Cr -- r
W o C, Dm ,Cno In 0 iZ4~~~% o In44 4 4 e I E I
in 4n "I
en cO w ~ 0 -
O CO c 0 W CD CS 04 CiCV c l C CC 0l (n < Cx__ V m__ IV_ ____ ____ r- C, I
E- 1
w ce ~ ~ ~ n tn ID t~ '<D w I I ~iW 0u r iu r r i
IA WwU
018
w~ 101 tln 10 u1 0 uO u
0.
u) c
W
0 Lfl Q In0N - mN
0 I1
9- 0.2 C4w )
U) ) L) .u (j> 0 L) C.) C. C.) L) LL) u. u. U. C) L..)
49 .0- CIn 0
u- 0
rn I nI I m
02 w
h.U
>C. uC ) U )u
z2>. CD rx cc >- C 0- c M 0 U) >0 >- 0___ ____ ___ Li. ___ ____
> § U. > > LA )
In) In L n C) In In in In IZ n
P- In In 0 e0 m 0 0
CD CD ~ 4 ') ID
-i U) U)n. en-
LaJ4>- On OW V)W 4% 9-L)4W-i >W > ) n 09-- j(A z n -j V)4U IJ, NCA NI c 2: z 0z
CXL) 0 C. 4 IC. wC. cc 08 4jLJ W0-9 44 CL u 4 0.9- W9 u4 <4 204 m 0.
u.. 4t u 4In . D Cl 0 -D - N
0R 0. 0. 0 <
E-2
CRAIN SIZE DISTRI8U11ION GRAPH - AGGREGRATE GRADING CHART
SOILS GROUP 'A' - A FAMILY OF 10 CURVES
N- 2 10~
so 0 2 0 0 2 1 05 02 . .0 00 0 .0 00 2 0
-'7 UOI 7S1CP02C RS .
2 BC 72. 2.79 NP NP N P20
50 BC 5 .2 P PN 2 M7606/ TYLL' RW
40B~65276N PjN 2 S 0Y / TYLO RW
75 2736 P N NP 2 S 170YR /4 VRY ALE ROW
TEST LAM JF r. [27110 PLASMIN P2ASM FROST 6/4LTYSELLOWROW
GRAN IZ NITIONO RAPH CLGGEATE GRADINCAT
3 SOIL GRU Z72 NP FAPL OF F2 CUVS4 1 R64LYE'BOW
22 SB 15 2.3 NP NP N0 50 I ' 10Y 74 EY.AE)RW
25 201 .0 P NP N J Sd 1 R61 7YLO RW
S0 14 271N11 R01 TYLO RW
6 B 12.731 NP NP! NP F72 SY10YR 614 LT YELLOW BROWN2 1 2 715 NP NP P P2 7m10 YR 64L7 YELLOW BROWN_
S 1B 225 12730 NP NP MA 170 YR 6/4 L7 YELLOW BROWN
GRI IEDSRBTO RPH-AGERT RDN HR
GRAIN SIZE DISTRIBUTION GRAPH - AGGREGRATE GRADING CHART__SOILS GROUP '13- A FAMILY OF 7 CURVES
10
70300
10 0 0 10 5 2 .5 02 . 05 0.2 0.1 0.0 002 .0
GR0# -0 w4UMtR
20 [itI ItO 1RUP CLS.80G4fO
T~z LYMDOTH0.LIUI PAS PASICFROST U S.CS MUW3ELL COLOR
11SG 19 12.7122.7 962 F4 CL-CM I10 YR 7/4 VERY PALE BROWNL2 SG 2t 12.700 34.2 ? . 57 F.3 CL ;0 YR 5/3 BROWN
.. 2 .SG 55 12.664 41.412.12. CL 110 YR 6/4 LT YEJJOW BROWN3 SG 27 12.759 '46. T 20.51 25.8 F3 CL 10o YR 5/4 YELLOW BROWN
14 SG 27 2.5128.2 117.6 110.6 F4 C 0i YR 6/4 LT YELCW BRON
5 S 25 12.7741 5.22CL 1-17.6/41L',5.LLO BRON
L6 L L SGL 262.74 01 40.4 1 20.0 20.4 F3 CL 2.5 YR 6/4 UTr REDDISH BROWN
NP NON PLASTICNnS NOT FROST SUPCEPABLE
F2~ SOB. FROST GROUPS WIT F4 BEINGF3MOST FROST SIJPCEJ'TA&LE
aC Skm COURSE
so SUBBASESG SLAOWE
UNIFIED SOIL CLASSIFICATION
SP POORLY GRAOW GRADSw-sLu WE.L-CADEr SILY SANDSp-Sm POORLY GRAED S0IY SANDSMI SILTY SAND
CL LEAY 0.4? (LOW TO MEDIUM ftkS7IC1T0
CL-AL SITY MLAY (LOW TO MtUDIM PLASTICITh2
UNITED STATES AIR FORCECIV7L ENGINERING SUPPORT AGENCY
TYNDALL AIR FORCE BASE, FLORIDA
LABORATORY-TEST RESULTS
SPRINGFIELD AIR NAIONAL GUARD BASE. OHIOEA*40 P-
-BUNCHER AUGUST 1991 APPENDX
E-3 lw" NA NONE ):E~34ES H~ ~
SUMMARY OF ALLOWABLE GROSS LOADS IN BRITISH UNITSPASS PAVEMENT CAPACITY IN KIPS
FEAT. INTENSITY FOR AIRCRAFT GROUP INDEX NUMBERS
LEVEL 1 2 3 4 5 6 7 8 9 10 11 12 13
I + + 95 + + + 176 + 369 + + + 353
II + + + + + + 205 + 414 + + + 425
R~ _ _ a ~LIII + -+ + + 4 + + + + + + + +31R01A
9
IV + + + + + + + + + + + + +
V + 74 78 + + 131 138 300 267 783 540 731 268VI+ + 6 + + + 59 336 300 + + 6 31
I + 26 A 71 63 A A 100 A A A A A
VI 1 30 A 81 70 72 A 113 A A A A A
2I + 34 A 101 79 84 94 139 A A 271 A 184
IV + 43 51 139 97 106 117 193 174 380 328 431 228
V 9 A A A A A A A A A A A A
VI 10 7 A A A A A A A A A A AII + 36 A 131 79 91 103 179 150 47 264 344 A
II + 43 55 14 97 101 114 193 183 564 320 418 212
IV + 50 61 163 112 119 133 217 206 598 352 481 250P03 IV + t 63 74 + + + 171 262 249 660 491 621 314
V 12 8 A A A A A A A A A A A
VI 14 9 A A A A A A A A A A A
I 29 A l11 73 75 A 148 A 477 A A A
II + 34 A 121 79 83 95 159 150 487 264 344 A
R0V + 39 50 136 90 97 109 178 168 513 311 393 205
IV + 50 60 165 114 125 138 212 202 563 395 502 254V 10 A A A A A A A A A A A A
I 12 7 A A A A A A A A A A A
I + 60 67 + 112 119 126 309 274 753 553 740 244II + 77 85 + + 138 145 347 308 + + + 293
R0CIII + + 100 + + 180 + 363 + + + 370
IV + + + + + + + + 457 + + + 474
V + 48 53 165 84 89 94 211 186 532 369 496 A
,VI + 61 65 + 96 100 106 232 206 593 418 562 204
iI + 34 A 127 86 86 99 173 164 552 279 377 188i I+ 40 52 137 93 96 109 15 75 60 310 40 29
, III + 46 57 155 105 111 126 207 196 590 363 463 245A RO6A
IV + 57 68 + + 141 157 244 232 649 451 574 304
V 12 7 A A A A A A A A A A AVI 13 9 A A A A A A A A A A A
+ + 95 + + + 176 + 369 + + + 353
205 , 414 + + 425
R07A + + + + + + +
IV + + + + + + + + + + + + +
V + 74 78 + + 131 138 300 267 783 540 731 268
VI + + 96 + 4 + 159 336 300 + + 836 314
I 18 10 A A 25 A A A A A A A A
II 19 11 A A 27 A A A A A A A A
III 21 12 A A 29 A A 60 A A A A ARO8A
IV 24 15 A A 35 A A 69 A A A A A
V 6 A A A A A A A A A A A A
V1 6 A A A A A A A A A A A A
SEE APPENDIX G FORREATED DATA.
SUMMARY OF ALLOWABLE GROSS LOADS IN BRJTISH UNITSPASS PAVEMENT CAPACITY IN KIPS
FEAT. INTENSITY FOR AIRCRAFT GROUP INDEX NUMBERS
LEVEL 112 3 1 4 5 6 7 8 9 10 11 12 13
1 24 13 A A 34 A A 72 A A A A A
11 + 15 A A 37 A A 73 A A A A AlIII + 17 A A 41 A A 84 A A A A A
IV9 + 21 A 78 51 *~ A 97 A A A A A'
V 8 A A A A A A A A A A A A
i9 A A A A A A I A A f A A A A
18 10 A A 25 A A A A A A A A
11 19 11 A A 27 A A A A A A A A
III 21 12 A A 29 A A 60 A A A A A
IV 24 15 A A 35 A A 69 A A A A A
V 6 A A A A A A A A A A A A
VI 6 A A A A A A A A A A A A
+ 75 60 127 + 117 114 186 174 509 307 408 r 214II + + 77 148 + 144 140 212 198 523 380 477 266
III + + 94 + + + 186 263 247 581 521 592 363T01AIV + + + + + 4 + 355 332 694 + 812 +
V 20 14 A A 34 A A 67 A A A A A
VI 24 ;7 A A 37 A A 72 A A A A A
+ 56 62 + 103 110 117 301 268 743 546 7.33 242
II + 71 77 + 120 127 136 338 301 + + + 290
III + + 90 + + + 165 396 352 + 4- 4 3631TO2A 3IV + + 112 + + + + 431 + + + 463
V + 44 A 155 77 81 A 202 179 519 ,361 486 A
VI + 55 58 173 88 93 99 225 198 550 405 ,547 199
+ 46 62 173 113 116 134 231 218 726 371 492 246
II + 54 71 + + 129 147 247 234 757 411 535 272
III + 61 78 + + 150 169 276 262 799 484 611 318T03CIV + 77 94 + + + + 330 314 4+ + 781 395
V 14 8 A A A A A A A A A A A
VI 16 10 A A 23 A A A A A A A A
I + + + + + + + 338 315 + 560 701 395
II + + + + + + + 382 355 + + 797 487
III + + + + + + + + 429 + + + +T04A
IV + + + + + + + + + + + + +
V 18 12 A A 30 A A A A A A A A
VI 21 15 A A 33 A A 63 A A A A A
+ 52 71 + + 133 153 264 249 + 424 ,562 I 2 51
i+ + 61 81 + + 147 168 283 267 + 470 612 311
III + 70 89 + + + 194 316 299 + 553 698 364T05CIV + + 107 + + + + 377 358 + + + 452
V 14 8 A A A A A A A A A A A
VI 16 10 A A 23 A A A A A A A A
I + 31 A 124 78 79 93 161 151 507 258 A A
II + 36 49 133 84 87 101 171 161 516 282 360 186
T06CIII + 40 54 148 95 100 115 189 179 542 327 406 214
IV + 50 64 + 118 127 143 223 211 589 406 510 262
V 12 7 A A A A A A A A A A A
SVI 13 8 A A A A A A A A A A A-. l o-., l- n
SUMMARY OF ALLOWABLE GROSS LOADS IN BRITISH UNITSPASS PAVEMENT CAPACITY IN KIPS
FEAT. INTENSITY FOR AIRCRAFT GROUP INDEX NUMBERS
LEL1 2 3 4 5 6 7 8 9 10 11 12 13I 99 + + + 187 297 277 800 491 634 345
If + + + + + + + 338 315 821 + 729 428
T7 III + + + + + + + 386 + + + +
IV + + + + + + + + + + + + +
V 12 7 A A A A A A A A A A A
VI 13 9 A A A A A A A A A A A
I + 33 A 110 79 79 A 158 A 434 255 344 A
II + 39 A 123 87 88 100 170 162 445 286 376 192
III + 44 53 141 99 104 117 192 182 495 340 43C 228
IV + 56 64 173 + 134 148 229 218 559 430 541 288
V 16 11 A A 26 A A A A A A A A
V! 18 13 A A 28 A A A A A A A A
+ 31 A 124 78 79 93 161 151 507 258 A A
Il + 36 49 133 84 87 101 171 161 516 282 360 186
III + 40 54 148 95 100 115 189 179 542 327 406 214
T9CIV + 50 64 + 118 127 143 223 211 589 406 510 262
V 12 7 A A A A A A A A A A A13 8 A A A A A A A A A A A
i I+ + + + + + + 338 315 + 560 701 395
II+ + + + + + + 382 355 + + 797 487
TiI + + + + + + + + 429 + + + +T1I0A VJI
IV + + + + + + + + + + + +
V 18 12 A A 30 A A A A A A A AVI 21 15 A A 33 A A 63 A A A A A
I + 48 63 175 119 121 138 238 226 737 383 509 253
-+ 57 73 + + 135 152 257 243 753 427 557 282
Tl+ 66 81 + + + 177 289 274 797 509 641 333T11C
IV + + 99 + + + + 349 332 + + 829 419
V 16 10 A A 26 A A A A A A A A
VI 19 12 A A 28 A A A A A A A A
I + 76 82 + + 143 151 362 322 + + + 305
II + + 102 + + + 175 + 361 + + + 363
I12 + + + + + + + + 419 + + + 451T!2CIV + + + + + + + + + + + + +
V + 65 69 + 110 116 12, 273 242 713 487 660 240
VI + + 85 + + 134 141 304 271 789 553 750 279
I + + 92 + + + 162 349 311 + + 829 299
II + - + + + + 185 389 346 + + 829 299II+ + + + + + + + 404 + + + 427
IV + + + - + + + + + + + + +
V + 77 81 + + 134 139 283 252 719 483 662 249
+ + 101 + + + 158 311 280 797 542 740 286
I + 59 64 + 103 108 114 258 228 647 454 610 216
II + 74 80 + 118 124 131 285 254 725 521 702 253
III + + 92 + + 150 157 329 294 832 + 847 306A02B IV + + 112 + + + 199 400 359 + + + 375
V + 52 55 158 86 90 94 195 174 498 335 455 A
Vi + 63 67 173 96 101 106 214 191 553 372 510 194
SEE APPENDIX G FOR RELATED DATA.
NOTESIN REFERENCE TO THE ALLOWABLE GROSS LOAD (AGL) TABLE:
A Denotes lowest possible empty gross weight of any aircraftwithin the group exceeds the AGL of the pavement. Pavementcannot support aircraft for respective pass intensity level.
+ Denotes no weight restrictions. AGL of the pavement exceedsthe greatest possible gross weight of any aircraft In the group.
The load carrying capacities of the pavements reported herein arebased on material Properties representative of the in-placeconditions at the time this field investigation was conducted.
Pass Intensity Levels V and VI are used for the reducedpavement strengths during the freeze-thaw period.
PAVEMENT CLASSIFICATION NUMBKRS BASED ON GFOJP 9 AIRCR.FT
:FEAT : PCN FEAT PCN 'FEAT P0 PFATa -- a a-II -- a-...- I.- I
:ROIA 66/R/B/X/T ,RO2A 7/F/C/X/T :R03C 26/F/C/X/T :R04C : 18/F/C/X/Tt - a a -- a I I-.-|--. I
,R05C 45/R/B/X/T :RO6A 25/F/C/X/T ,RO7A 66/R/B/X/T :ROBA : O/FIC/X/Ta a-- a a-.....I-- I I -- I~. I
:R09C O/F/C/X/T :R1OA O/F/C/X/T :TOIA 27/F/C/X/T :TO2A : 44/R/B/X/Ta I I I
T03C 38/F/C/X/T IT04A I3/F/C/X/T aTO5C 46/F/C/X/T :TO : 21/F/C/X/T
a a-a a-- .. . . a-.......- ... a:T07A 53/FIC/X/T :TOaA 20/F/C/X/T :TO9C 21/F/C/X/T '--'6/FC//
:T1IC 40/F/C/X/T !T12A 56/R/B/XAT :AOIB 61/R/C/X/T -AO2B : 41/R/C/X/T- a a -- a - a a I -- .--,F - a
F-
I I I I I,
0Q
NI
-4A0~
fz, r
P-5
S CM
944
C?0
1N~J1~dG2ZrL~ AYILN21NZAYc
F-6
C 0
F-7-
ui 0
0J
0<
I.;n
w~~ ___ E.L
F-8
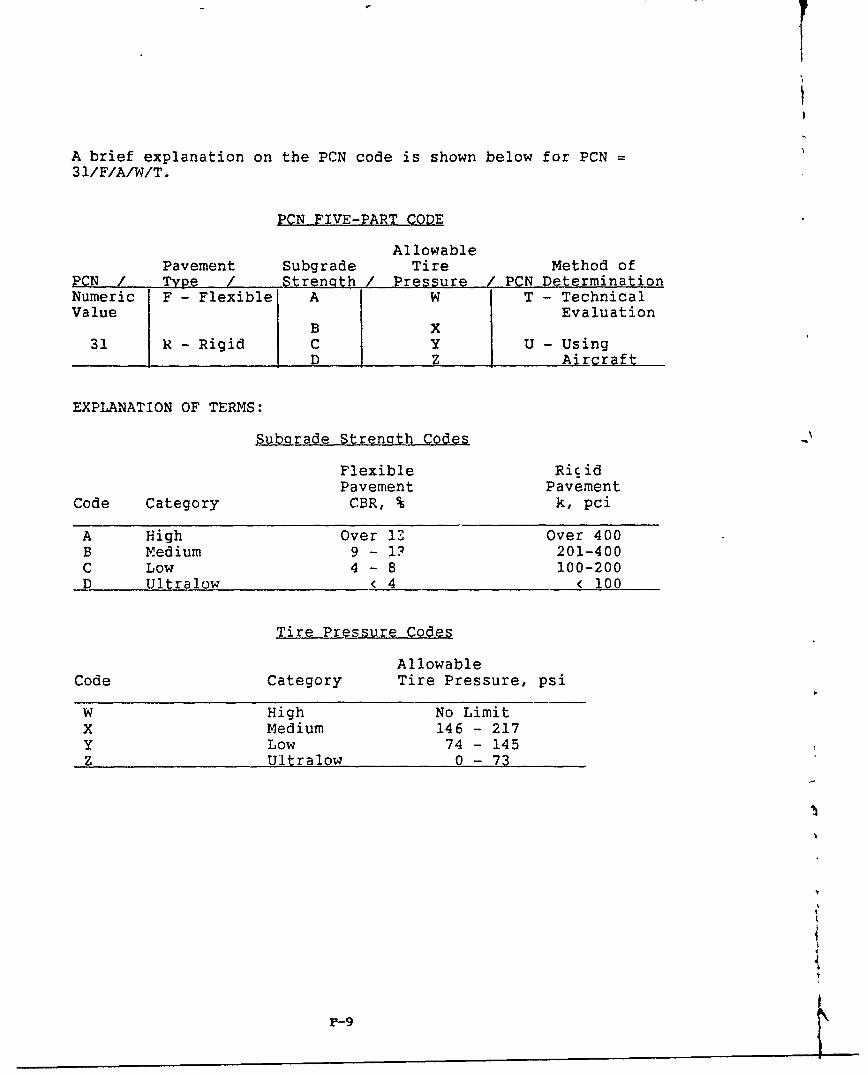
A brief explanation on the PCN code is shown below for PCN =31/F/A/W/T.
PCN FIVE-PART CODE
AllowablePavement Subgrade Tire Method of
PCN / Type / Strength/ Pressure / PCN DeterminationNumeric F - Flexible A W T - TechnicalValue Evaluation
B X31 R - Rigid C Y U - Using
D Z Aircraft
EXPLANATION OF TERMS:
Suibigrade Strenoth Codes
Flexible RicidPavement Pavement
Code Category CBR, % k, pci
A High Over 1. Over 400B Medium 9 - 1? 201-400C Low 4 - 8 100-200D Ultralow < 4 < 100
Tire-Pressure Codes
AllowableCode Category Tire Pressure, psi
W High No LimitX Medium 146 - 217Y Low 74 - 145Z Ultralow 0 - 73
9
r-9
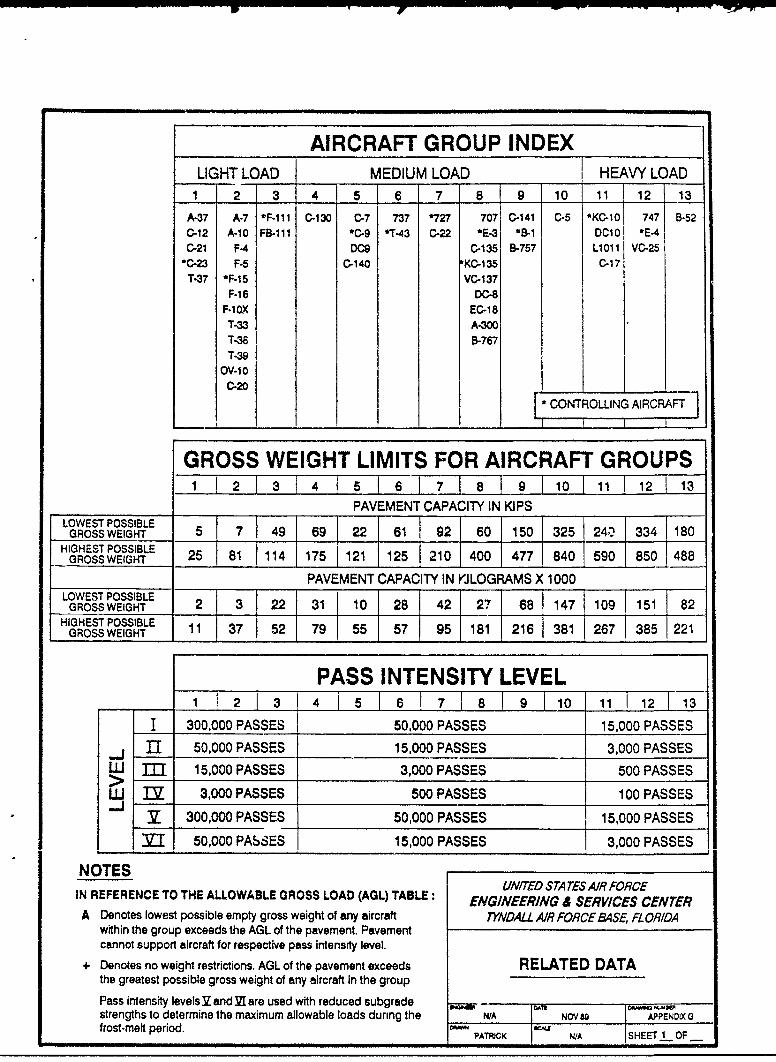
AIRCRAFT GROUP INDEXLIGHT LOAD MEDIUM LOAD HEAVY LOAD
1 2 3 4 5 6 7 8 9 10 11 12 13
A-37 A-7 *F-111 C-130 C-7 737 '727 707 C-141 0-5 *KC-10 747 B-52
C-12 A-10 FB-111 *C-9 *T-43 C-22 *E-3 *B-1 DC10 *E-4C-21 F-4 DCO C-135 B-757 L1011 VC-25*C-23 F-5 C-140 KC-135 C-17T-37 *F-15 VC-137
F-16 DC-8F-10X EC-18T-33 A-300T-38 B-7677-39
OV-10C-20
*CONTROLLING AIRCRAFT
GROSS WEIGHT LIMITS FOR AIRCRAFT GROUPS13 4 115 06 1 7 1 8o 11 12 13
PAVEMENT CAPACITY IN KIPSLOWEST POSSIBLE
GROSS WEIGHT 5 7 49 69 22 61 92 60 150 325 24C 334 180HIGHEST POSSIBLE P
GROSSWEIGHT 25 81 114 175 121 125 210 400 477 840 590 850 488
PAVEMENT CAPACITY IN JLOGRAMS X 1000LOWEST POSSIBLE
GROSS WEIGHT 2 3 22 31 10 28HIGHEST POSSIBLE 1 37 5 4 2 6 1 10 1 82
GROSS WEIGHT 11 37 52 79 55 57 95 181 216 381 267 385 221
PASS INTENSITY LEVEL1 2 3 4 15 6 7 18 19 11 11 12T13
I 300,000 PASSES 50,000 PASSES 15,000 PASSES. I 50,000 PASSES 15,000 PASSES 3,000 PASSESL J"[ 15,000 PASSES 3,000 PASSES 500 PASSES
W 3,000PASSES 500 PASSES 100 PASSESL 300,000 PASSES 50,000 PASSES 15000 PASSES
50,000 PASSES 15,000 PASSES 35,000 PASSES
NOTESUNITED STA TES AIR FORCE
IN REFERENCE TO THE ALLOWABLE GROSS LOAD (AGL) TABLE: ENGINEERING & SERVICES CENTER
A Denotes lowest possible empty gross weight of any aircraft TYNDALL AIR FORCE BASE, FLORIDAwithin the group exceeds the AGL of the pavement. Pavementcannot support aircraft for respective pass intensity level.
+ Denotes no weight restrictions. AGL of the pavement exceeds RELATED DATAthe greatest possible gross weight of any aircraft In the groupPass intensity levels V and Z1 are used with reduced subgrade - UAWstrengths to determine the maximum allowable loads during the N/A NOV 88 APPENDIXOfrost-meit period. D PATRJCK NA SHEET 1 OF
p * p. CL
-4 - -
CL 0,
ND 00 I
a. cc - . LL4oo
4a4 0 Q
-4 a'I- -Y
>- C3
z xEC
C11 ~j 4 CDc e U-0
1: = Q-C
r- . . x
v- -
C= v en C00 C ., 06 a
6,0
1E V
'00 *
*N 0
N -C
C C, c . m
a 00 048 jcc
C4 4a 5~ r
N, Al
- N I fn - - M:CC %rto ;: or puli re'm e 0itibto 0
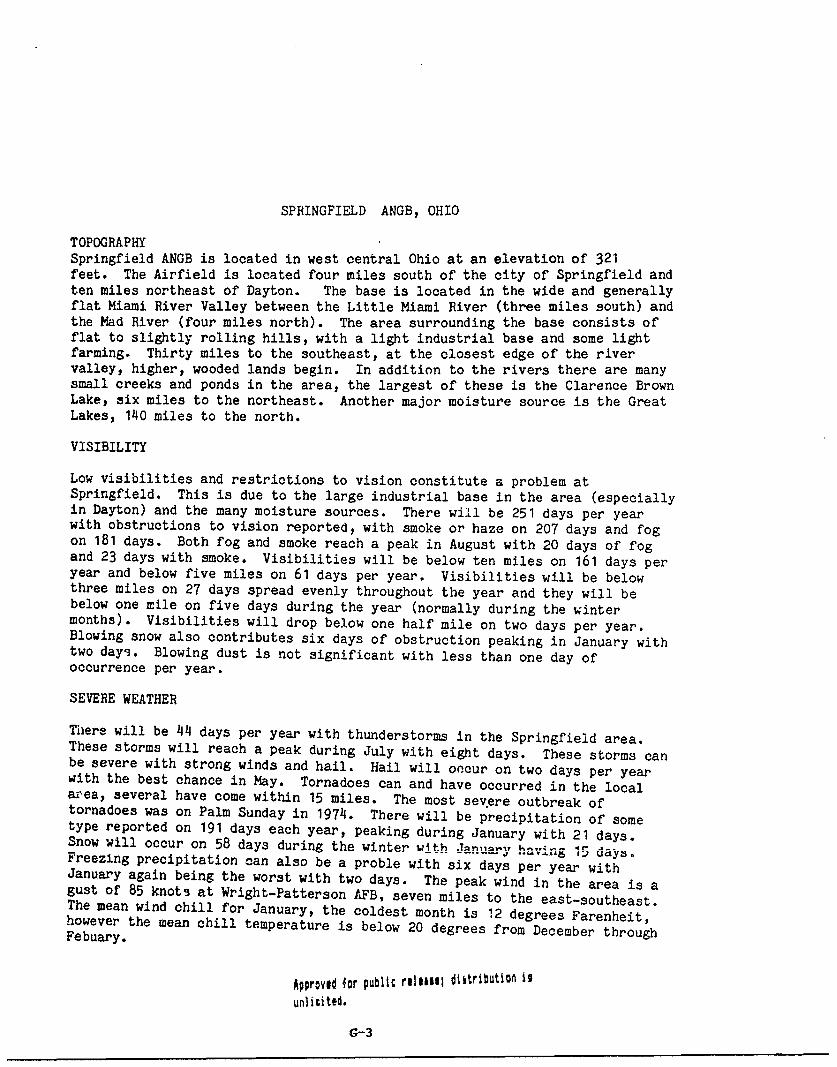
SPRINGFIELD ANGB, OHIO
TOPOGRAPHYSpringfield ANGB is located in west central Ohio at an elevation of 321feet. The Airfield is located four miles south of the city of Springfield andten miles northeast of Dayton. The base is located in the wide and generallyflat Miami River Valley between the Little Miami River (three miles south) andthe Mad River (four miles north). The area surrounding the base consists offlat to slightly rolling hills, with a light industrial base and some lightfarming. Thirty miles to the southeast, at the closest edge of the rivervalley, higher, wooded lands begin. In addition to the rivers there are manysmall creeks and ponds in the area, the largest of these is the Clarence BrownLake, six miles to the northeast. Another major moisture source is the GreatLakes, 140 miles to the north.
VISIBILITY
Low visibilities and restrictions to vision constitute a problem atSpringfield. This is due to the large industrial base in the area (especiallyin Dayton) and the many moisture sources. There will be 251 days per yearwith obstructions to vision reported, with smoke or haze on 207 days and fogon 181 days. Both fog and smoke reach a peak in August with 20 days of fogand 23 days with smoke. Visibilities will be below ten miles on 161 days peryear and below five miles on 61 days per year. Visibilities will be belowthree miles on 27 days spread evenly throughout the year and they will bebelow one mile on five days during the year (normally during the wintermonths). Visibilities will drop below one half mile on two days per year.Blowing snow also contributes six days of obstruction peaking in January withtwo days. Blowing dust is not significant with less than one day ofoccurrence per year.
SEVERE WEATHER
There will be 44 days per year with thunderstorms in the Springfield area.These storms will reach a peak during July with eight days. These storms canbe severe with strong winds and hail. Hail will ocur on two days per yearwith the best chance in May. Tornadoes can and have occurred in the localarea, several have come within 15 miles. The most severe outbreak oftornadoes was on Palm Sunday in 1974. There will be precipitation of sometype reported on 191 days each year, peaking during January with 21 days.Snow will occur on 58 days during the winter with Januar,y v-- .. ..Freezing precipitation can also be a proble with six days per year withJanuary again being the worst with two days. The peak wind in the area is agust of 85 knots at Wright-Patterson AFB, seven miles to the east-southeast.The mean wind chill for January, the coldest month is 12 degrees Farenheit,however the mean chill temperature is below 20 degrees from December throughFebuary.
Approvid for public rililill diitribution it
unlitited.
G-3