Embed Size (px)
Citation preview

AD-A273 486
CONTINUOUS-COOLING-TRANSFORMATION BEHAVIOR,
MICROSTRUCTURE, AND PROPERTIES OF
0.02C-3.5Ni-3.6Mo HIGH-STRENGTH STEELS
~'ETESOV 3 01993
A by:
Masoud Molaei
Master of Science Thesis
This docume•n hs be-mn appiovedfor public r•el1-5e a•-d --ae; itsdistribution -.s
August, 1992
9\ I Il II AI ~l11

T-4223
Continuous-Cooling-Transformation Behavior, Microstructure,
and Properties of 0.02C-3.5Ni-3.6Mo High-Strength Steels
Accesion For• NTIS' C'RA&
DTIC QUALITY INSPECTED N CRA&1
-c, u:tif c te,. d
[.By ......... ..............DýAt ib. !ticn
DiSt S3 cial
by
Masoud Molaei

T-4223
A thesis submitted to the Faculty and the Board of
Trustees of the Colorado School of Mines in partial
fulfillment of the requirements for the degree of Master of
Science (Metallurgical and Materials Engineering).
Golden, ColpradoDate • Signed:
-Masoud Molaei
Approved: 1.;itven W. ThompsonThesis Advisor
Golden, Colorad Pj5bDate- /
/ Dr. John J. MooreDepartment HeadDepartment of Metallurgicaland Materials Engineering
9lii

T-4223
• ABSTRACT
The continuous-cooling-transformation (CCT) behavior,
* microstructures, and properties of 0.02% C, 3.6% Mo, and
3.5% Ni steels with manganese contents ranging from 1 to
1.76% were investigated. The effects of cooling rate and
* prior austenite grain size were examined as part of the CCT
work for the steel with 1.5% Mn. The CCT diagram for this
steel is "flat-topped," with almost no variation in the
* transformation start and finish temperatures as a function
of cooling rate.
A fully martensitic microstructure forms in response to
cooling rates faster than about 37 0C/s for a prior austenite
grain size of about 7 ym. At cooling rates faster than
25°C/s, martensite forms for the 1.5% Mn steel with a prior
austenite grain size of about 34 pm. At cooling rates
slower than 25 0 C/s and 70C/s for the prior austenite grain
sizes of about I pm and 35pm, respectively, the
microstructure consists of acicular ferrite with micron-
sized islands of martensite and austenite. At intermediate
cooling rates, a mixture forms, made up of large packets of
martensite and large packets of acicular ferrite. In this
intermediate range of cooling rates, the volume fraction of
martensite increases as the cooling rate increases.
9 iii

T-4223
The martensitic microstructures are characterized by a
high dislocation density, some coarse twins, no detectable
retained austenite, comparatively high hardness, a poor
response to metallographic etching, and a good response to
electrochemical thinning. Features of acicular ferrite are
an equally high dislocation density, no twins, a significant
volume fraction of retained austenite, comparatively low
hardness, a good response to metallographic etching, and a
poor response to electrochemical thinning. In addition,
some small islands of austenite, between laths of acicular
ferrite, transform to islands of high-carbon martensite,
which frequently contain fine twins. Unlike previous
investigations of low-carbon steels, granular ferrite was
not observed, even at cooling rates as slow as 0.050C/s.
For a cooling rate of about 10C/s, yield strengths
above 700 MPa (100 ksi) were obtained in the non-tempered
condition. As manganese content increased, strength
increased. Tempering resulted in lower strength and
improved toughness. A single reaustenitizing treatment
resulted in higher strength, although poorer toughness, than
a double reaustenitizing treatment.
iv
T-4223
TABLE OF CONTENTS
PAGE
ABSTRACT ................... ... ....................... iii
TABLE OF CONTENTS .............. .................... v
LIST OF FIGURES .............. .................... viii
LIST OF TABLES ............... ..................... xvi
ACKNOWLEDGEMENTS ............... ................... xvii
1.0 INTRODUCTION . . . ............. . . . . . . 1
1.1 HSLA STEELS, A BRIEF SUMMARY ....... ......... 1
1.2 PURPOSE OF THE PROJECT .............. 8
1.3 ROLE OF ALLOYING ELEMENTS IN HSLA STEEL . . . . 14
1.3.1 INTRODUCTION ........ .............. 14
1.3.2 CARBON ................. . . . 16
1.3.3 CHROMIUM .......... ................ 17
1.3.4 COPPER .................... 17
1.3.5 MANGANESE ......... ............... . 19
1.3.6 MOLYBDENUM ... . . . . . . ... . 19
1.3.7 NICKEL . ................. 23
1.3.8 NIOBIUM . . . . . . . . . . . . . . . 23
1.3.9 NITROGEN ................. 24
1.3.10 SILICON .......... ................ 25
1.4 STRENGTHENING MECHANISMS IN HSLA STEELS . ... 25
1.4.1 GRAIN REFINEMENT .. . . . . . . . . 25
1.4.2 SOLID-SOLUTION STRENGTHENING . . ... 33
v

T-4223
1.4.3 PRECIPITATION HARDENING ............. 37
1.4.4 TRANSFORMATION STRENGTHENING ........ .. 40
1.5 MICROSTRUCTURE OF LOW-CARBON STEELS ........ .. 44
2.0 EXPERIMENTAL PROCEDURES. . . . ............ 54
2.1 AS-RECEIVED PLATES ......... .............. 54
2.1.1 GEOMETRY AND CHEMISTRY ... ........ 54
2.1.2 GENERAL STRUCTURE ...... ............ 55
2.1.3 INCLUSIONS ......... .............. 57
2.1.4 HARDNESS TESTING . . . . . . . . . .. 57
2.2 Aci AND Ac 3 DETERMINATION ....... ........... 59
2.3 PRIOR AUSTENITE GRAIN SIZE ........... 61
2.3.1 INTRODUCTION ....... ............. 61
2.3.2 HEAT TREATMENT AND METALLOGRAPHY . . . 61
2.4 TRANSFORMATION KINETICS . . . ........... 66
2.4.1 GLEEBLE 1500 ....... ............. 66
2.4.2 SAMPLE GEOMETRY ...... ............ 71
2.4.3 DILATOMETRY AS A FUNCTION OF HEATING AND
COOLING RATE . . . . . . . . . . . . . . 73
2.4.4 DILATOMETRY . . . ............ 74
2.4.5 TESTING PROCEDURE .............. . . . 75
2.5 MICROHARDNESS MEASUREMENTS ..... .......... 78
2.6 MICROSTRUCTURAL CHARACTERIZATION USING SEM AND
TEM . . . . . . .* ,. . . . . . . . . . . . .. . 79
2.7 TENSILE TESTING . .......... . . . . . . . 80
vi

T-4223
2.8 CHARPY IMPACT TESTING ........ ............. 83
2.9 FRACTOGRAPHY ............. ................. 84
3.0 RESULTS AND DISCUSSION .......... ............... 85
3.1 AS-RECEIVED PLATES ......... .............. 85
3.2 Ac 1 AND AC 3 DETERMINATIONS ...... .......... 92
3.3 PRIOR AUSTENITE GRAIN SIZE ..... .......... 95
3.4 TRANSFORMATION KINETICS ...... ............ 96
3.4.1 DILATATION CURVES ....... ........... 99
3.4.2 CONTINUOUS-COOLING-TRANSFORMATION
DIAGRAMS ........ ............... 101
3.5 MICROSTRUCTURAL CHARACTERIZATION .. ...... 106
3.6 MECHANICAL PROPERTIES ...... ............ 153
3.6.1 TENSILE PROPERTIES .... .......... 153
3.6.2 CHARPY IMPACT PROPERTIES ......... .. 156
3.6.3 FRACTOGRAPHY ...... ............. 162
4.0 SUMMARY AND CONCLUSIONS ....... ............. 168
REFERENCES ................. ...................... 171
APPENDIX: TABULATED DATA FOR TENSILE AND CHARPY IMPACT
PROPERTIES ............ ................. 184
vii
T-4223
LIST OF FIGURES
FIGURE DESCRIPTION PAGE
1.1 Effect of 50% transformation temperature ontensile strength of bainitic steels (2) . . .. 5
1.2 Effect of carbon level and carbon equivalent(CE) on the susceptibility to heat-affected-zone (HAZ) cracking (22) .. .. .. .. .. .8
1.3 a. Schematic isothermal diagram indicatingdiffusion-dominated and shear-dominatedaustenitic transformation ranges.b. Isothermal transformation diagram for high-nickel, high-molybdenum alloy where f T refersto the fraction transformed at the indicatedtime (12) . . . . . . . . . . . . . . . . . . . i0
1.4 Continuous-cooling-transformation diagramfor a low-carbon, copper-containing HSLAsteel (37) . . . . . . . . . . . . . . . . . . 13
1.5 Solid solution hardening effects of thavarious elements as dissolved in pure iron(41) . . . . . . . . . . . . . . . . . . . . . 15
1.6 The effect of carbon content and hencethe pearlite content on impact-transitiontemperature curves of ferrite-pearlitesteels (2) . . . . . . . . . . . . . . . . . 17
1.7 Effect of chromium content on the single-phaseaustenite region for Fe-Cr-C alloys (41) . . . 18
1.8 Upper portions of CCT diagrams for steelsalloyed with Mo. Nominal phase compositionis 0.05 pct. C, 0.9 pct. Mn, 1.2 pct.S1 and 0.5 pct. Cr (all wt. pct.). PF ispolygonal ferrite and P is pearlite (52) . . . 20
1.9 Retardation of softening and secondaryhardening during tempering of steels

T-4223
LIST OF FIGURES(CONTINUED)
FIGURE DESCRIPTION PAGE
1.10 Effect of alloying elements on theretardation of softening during temperingat 540 0C (1000 0 F) relative to Fe-C alloys(44) ............... ..................... 22
1.11 Effect of grain size of ferrite on yieldstress and impact transition temperatureof a steel containing 0.1%C, 0.5%Mn,0.2%Si and 0.006%N (3) ............. 26
1.12 a) Schematic representation of experimentalthermal cycles in comparison withconventional heat treating cycles, referredto part of the Fe/C equilibrium phasediagram. b) Schematic representation ofconventional and experimental rapid heattreating cycles (66) ......... ............. 31
1.13 Correlation between microalloy content andincrease in yield strength. Increase instrength is due to grain refinement (a )and precipitation strengthening (aP,) (ý7) 34
1.14 Effect of V, Nb, and Ti on CCT curves of asteel containing 2.5% Mn (62) . . . . . . . . . 35
1.15 Yield strength versus atomic percent forvarious alloying elements (78) ... ........ .. 38
2.1 Blanks cut to examine the variation in
the microstructure and grain size ... ....... .. 56
2.2 Sample used for inclusion analysis .. ...... .. 58
2.3 Samples used for Aci and Ac3 determinations.Note that the center-line segregation wasavoided ............ . . .......... 60
2.4 Wafers used for grain size studies . . . . . . 64
ix
T-4223
LIST OF FIGURES(CONTINUED)
FIGURE DESCRIPTION PAGE
2.5 Different heat treatment schedules for
grain size study ........... ............... .. 65
2.5 (continued) ............ .................. .. 66
2.6 Schematic diagrams showing the uniformityof temperature zone in: induction heated/conduction cooled (top), and electricresistance heated/conduction cooled(bottom) specimens (104) ....... ........... .. 67
2.7 Radial temperature gradient for anaustenitic st;-inless steel subjected toelectric resistance heating and axialconduction cooling. Heating rate: 4000OC/s,cooling rate: 100 C/s (104) .... ......... ... 69
2.8 Schematic diagram showing the electricresistance heating of a sample used inthe Gleeble. Uniform heating is producedacross the work zone length and diameter(104) ................ ..................... .. 70
2.9 Geometry of Gleeble samples.a) Cooling rates • 10 0 C/s.b) (10 mm) 10°C/s S C.R. S 25°C/s,(12 mm) 25°C/s S C.R. s 75°C/s.c) C.R. a 75 0 C/s ......... ............... .. 72
2.10 Graphical measurements of the 25, 50 and75 percent transformation temperatures . . . 77
2.11 Positions of the wafers cut for TEMstudies relative to the position of thethermocouple (L: left, M: middle, R: right) . . 79
2.12 OrientatioiA of tensile bars and Charpybars relative to the rolling direction . . . . 81
x

T-4223
LIST OF FIGURES(CONTINUET)
FIGURE DESCRIPTION PAGE
3.1 (a) Light micrograph showing MnS inclusions.(b) and (c) SEM micrographs showing Ti- andMn-rich inclusion clusters ..... .......... .. 88
3.2 Representative of EDS spectra forinclusions in steels A, B and C .... ........ .. 90
3.3 The as-received microstructures of(a) steel A, (b) steel B and (c) steel C.Light micrographs .......... ............... .. 91
3.4 Dilatation curve for steel B. The specimenwas heated up to 12000 C at a rate of 30C/s . . 94
3.5 (a) Prior austenite grain size (about30 Mm) after one reaustenitizing treatmentfollowed by quenching. (b) Prior austenitegrain size (about 7 pm) after tworeaustenitizing treatments followed byquenching .............. ................... .. 98
3.6 Plot of C-Strain versus temperature fora sample reaustenitized twice followed bycooling at 500C/s after the secondaustenitizing treatment .... ........... .. 100
3.7 CCT diagram for steel B .... ........... ... 102
3.8 25, 50 and 75 percent transformationlines for (a) IX and (b) 2X conditions . . . 103
3.9 Microhardness versus cooling time b-tween800 0C and 5000C . ........ ............... .. 105
3.10 Martensitic microstructure of steel Bafter austenitization at 1200*C followedby quenching ........... ................ 107
3.11 Acicular ferrite with islands of retainedaustenite. (a) BF and (b) CDF images ofthe as-received steel B .... ........... .. 109
xi

T-4223
* LIST OF FIGURES(CONTINUED)
FIGURE DESCRIPTION PAGE
* 3.12 SADP corresponding to the region shown inFigure 3.11 .......... ................. 111
3.13 The as-received steel B showing acicularferrite structure and the jagged edges ofa lath. (a) BF and (b) CDF images . . . . . 112
3.14 Microstructure of the as-received steel B.Notice the black M-A islands ... ........ 115
3.15 Austenite centered-dark-field Image ofthe same region shown in Figure 3.14 . . . . 116
3.16 Martensitic microstructures in specimenscooled at 150 0C/s. (a) 1X condition and(b) 2X condition. Light micrographs . . . . 117
3.77 Fine martensitic lath structure produced* after cooling at 150 0C/s for the IX
condition ..................... 119
3.18 Fine martensitic lath structure producedafter cooling at 1500C/s for the 1Xcondition ............ .................. .. 120
3.19 Twinned martensite in the sample cooledat 150°C/s, for the lX condition ...... .122
3.20 EDS analysis of the dark particles foundon all of the TEM foils, except for the
• as-received condition ...... ........... . . 124
3.21 Light micrographs of the specimens cooledat 250C/s. (a) IX condition and(b) 2X condition ................. 125
3.22 Microstructure of specimen cooled at25 0C/s for the 1X condition . . . . . . . . . 127
0 xii

T-4223
LIST OF FIGURES* (CONTINUED)
FIGURE DESCRIPTION PAGE
3.23a Acicular ferrite microstructure in specimen* cooled at 25 0C/s for the 2X condition, BF
image . . ....................... 128
3.23b Austenite centered-dark-field image of thesame region shown in Figure 3.23a ........ .. 129
* 3.24a Martensitic microstructure in specimencooled at 25 0C/s for the 1X condition,BF image ............. .................. 130
3.24b Martensite centered-dark-field image ofthe same region shown in Figure 3.24a . . . . 131
3.25 SADP from the region shown in figure 3.24."M" and "m" are from two different martensitepackets. "T" is the transmitted beam . . . . 133
3.26 DF image showing precipitates observedwithin a TEM foil. Cooled at 25 0C/s,2X condition ........... ............. .. 134
3.27 Acicular ferrite and retained austenitein specimen cooled at 25 0C/s - 2X condition.(a) BF and (b) austenite CDF images . . . .. 135
3.28 A pool of twinned martensite betweenlaths of acicular ferrite in specimencooled at 25 0C/s, 2X condition .. ....... .. 136
3.29 Acicular microstructure in a specimencooled at 70C/s, lX condition. SEMmicrograph ........... ................. 138
3.30 Light micrographs of the specimens cooledat 3.3 0C/s. (a) 1X condition and (b) 2Xcondition ........... . . . . . . . . 139
3.31 The edges of "bainitic" ferrite subunits.Specimen cooled at 3.3 0C/s, lX condition . . 141
xiii

T-4223
* LIST OF FIGURES(CONTINUED)
FIGURE DESCRIPTION PAGE
3.32 Acicular ferrite and M-A islands in specimencooled at 3.3*C/s, 1X condition ......... .. 142
3.33 Acicular ferrite in specimen cooled at3.30C/s, 2X condition ...... ............. 144
3.34 Acicular ferrite in specimen cooled at3.3*C/s, 2X condition ...................... 145
3.35 Light micrographs of the specimens cooledat 0.l 0C/s. (a) IX condition and (b) 2X
* condition .................................. 146
3.36 Acicular ferrite in specimen cooled at0 1C/s, 2X condition ............. 148
3.37 Acicular ferrite in specimen cooled at0. .lC/s, 2X condition. BF image .. ...... 149
3.38 CDF image of the same region shown inFigure 3.37 . . . . ................. 150
3.39 Angular martensite island in specimencooled at 0.1 0 C/s, 2X condition . . . . . . . 152
3.40 (a) Tensile data for steels A, B and C(lX and 2X conditions). (b) Tensileproperties of steel A before and aftertempering . . . . . . . . . . . . . . . . . . 154
3.41 (a) Energy Absorbed versus temperaturefor steels A, B and C, 1X condition.(b) Energy Absorbed versus temperaturefor steels A, B and C, 2X condition . . . . . 158
3.41 (c) Energy Absorbed versus temperaturefor steel A in the as-cooled and 6200 C-tempered treatments. Includes data forthe 1X and 2X conditions . . . . . . . . . . 160
xiv

T-4223
LIST OF FIGURES(CONTINUED)
FIGURE DESCRIPTION PAGE
3.42 SEM micrographs of the fracture surfacesafter testing at (a) -195 0 C, (b) 23 0 C and(c) 100 0C. Steel B, 1X condition ........ .. 163
3.43 Fracture surfaces for steel B testedat -195 0 C. (a) 1X and (b) 2X conditions . . 164
3.44 Fracture surfaces for steel B testedat 23 0C. (a) 1X and (b) 2X conditions . . . 165
3.45 Fracture surfaces for steel B testedat 100 0C. (a) iX and (b) 2X conditions . . . 167
xv

T-4223
LIST OF TABLES
TABLE DESCRIPTION PAGE
* 2.1 The specific designations and the dimensionsof the as-received plates ...... ........... .. 54
3.1 Chemical Compositions of Steels .... ........ .. 86
3.2 Hardness of the as-received steels . . . . . . 89
3.3 Calculated and measured austenite formationtemperatures for steels A, B and C . . . . . 93
3.4 Austenite grain sizes for variousaustenitizing times ........ .............. .. 97
3.5 Calculated and measured B and Mtemperatures for steels A, B and C ..... .. 104
xvi

T-4223
ACKNOWLEDGEMENTS
I would like to thank the Office of Naval Research
(ONR) for funding this project, and for having the foresight
to explore this new class of steels. I also thank the U.S.
Steel Technical Center, who provided the necessary materials
for my work, in addition to conducting chemical analysis on
these steels.
Special thanks goes to my advisor, Dr. Steven Thompson,
for sharing his knowledge and insights with me, and for his
helpful discussions and support. His help in the TEM
laboratory was invaluable.
I am grateful to my wife, Lesli, for her editing
assistance, as well as her support, encouragement and
patience.
I would also like to thank Dr. George Krauss and Dr.
Chester Van Tyne for what I have learned from them at
Colorado School of Mines, and for their well-considered
contributions to this work.
Bob McGrew and Butch Brewer should also be credited for
their suggestions and skilled help in the laboratory.
xvii

T-4223
1.0 INTRODUCTION
1.1 High-Strength, Low-Alloy Steels: A Brief Summary
Low-carbon or mild steels have traditionally been used
in the construction industry. For many years, ASTM A7 (now
ASTM A283, Grade D) was the specification for the most
commonly used structural steel for both bridges and
buildings. Minimum yield strength for this steel is 230 MPa
(33 ksi). Although it has the lowest unit price of any
structural steel, it also has one of the highest price-to-
yield-strength ratios (1).
In the early 1900's, the design of high-strength, hot-
rolled steels was based on tensile strength, and there was
little attention given to weldability, formability and
resistance to brittle fracture (2). Riveting was the most
common form of joining structural components, and the high
tensile strength required for constructional purposes was
achieved through employment of carbon (up to 0.3%) as an
alloying element. Mangenese was another major alloying
element used to achieve higher strength.
During World War II, welding (rather than riveting) was
introduced as a method of joining, and major structural
failures in the steels then available required an

T-4223 2
improvement in weldability and fracture resistance through
reduction of carbon content (1,3). At the same time, the
importance of both fracture toughness and low impact
transition temperature were recognized. Similarly, the
advantages of high manganese-to-carbon ratios for impact
toughness were appreciated, and the significance of grain
size was also established (2).
By the early 1950's, refinement of grain size by grain-
refining additions, and the beneficial effects of ferrite-
grain refinement on both yield stress and the ductile-to-
brittle transition temperature had been demonstrated (2,3).
During this period, the first steps toward achieving higher
strength through grain refinement were taken by the
introduction of aluminum to steels, which then combined with
the nitrogen already present. Further increases in yield
stress were then obtained by p,-ecipitation hardening.
Vanadium, niobium and titanium were used, although the
impact toughness was still not good, because the as-rolled
grain size was coarse. Controlled rolling was then
developed to improve the poor impact-transition properties
of niobium steels, and this method turned out to be very
successful. The result was that higher yield strengths of
450-525 MPa (65 to 75 ksi) along with low impact-transition
temperatures, as low as -80*C, were obtained (1-3).
T-4223 3
The development of high-strength, low-alloy (HSLA)
steels was encouraged by the increasing demand for strong,
tough, weldable steels for natural gas transmission lines,
ships and off-shore drilling platforms (4). More recently,
these steels have been used to increase the miles-per-gallon
(MPG) efficiency of automobiles (5), to reduce the
cost/weight ratio, to meet the notch-toughness requirements
in constructional applications such as bridges, buildings
and transmission towers (6-8) and for several other
applications. The American Iron and Steel Institute (9)
states that high-strength, low-alloy steels are "generally
produced with emphasis on mechanical properties requirements
rather than to chemical composition limits".
Beginning in about 1950, low-carbon bainitic steels
were developed on a commercial scale simultaneously with
ferrite-pearlite HSLA steels. Carbon contents in these
steels ranged from 0.1 to 0.15%, and many combinations of
alloying elements were used to produce bainitic structures
during air cooling in a wide range of section sizes. Yield
strengths in the range of 450-900 MPa (65 to 130 ksi) were
achieved, depending on the carbon content and austenite
transformation temperature (2). Bainite form at
temperatures intermediate to those at which polygonal
ferrite and martensite form. It has been shown (2) that
T-4223 4
bainitic structures can be produced with a wide range of
strengths (Figure 1.1).
Pickering (2,10,11) has summarized the aims of the
development of low-carbon bainitic steels:
One goal is to produce a bainitic structure by air
cooling, therefore minimizing the economic disadvantage of
quenching and tempering. Through air cooling, yield
strengths of 450-900 MPa (65-130 ksi) and tensile strengths
of 600-1200 MPa (85-175 ksi), which are higher than those
typically obtained for ferritic-pearlitic steels are also
achievable. In addition, it was discovered that using a low
carbon content and carbon equivalent would increase
weldability and formability.
The next goals that arose were to provide a minimum
variation of properties over a wide range of section sizes
and to obtain good toughness with high strength levels. In
low-carbon steels, the impact resistance of upper bainite is
inferior to that of lower bainite, so most of the
developments have been based either on lower bainite or low-
carbon acicular ferrite. The formation of these acicular
transformation products is beneficial in obtaining high
strength levels.
Those who worked with low-carbon steels also recognized
that a lower carbon content resulted in improved toughness

T-4223 5
1200 . •
S0.0
W *
4.7 IIreJ *W i •••
tens50i1e streng bainitc
450 strengths of moethant 700 ()a0ni
(1,2), compared with higher-carbon steels. An extreme
example of a very low-carbon steel was the development of
the 0.02% carbon, 3% nickel, 3% molybdenum, niobium-
containing, aluminum-treated steels (12,13). These steels
possessed a "bainite-like" microstructure with yield
strengths of more than 700 MPa (100 ksi) and transition
temperatures below -750C. However, these steels are
uneconomical for general structural engineering (2). During
this time, other alloying combinations (Mn-Mo-Nb, Ni-Cr, Mo-
B and Ni-Cu-B) were also investigated, but they showed lower
strength levels (14-16).
As mentioned above, structural steels required for

T-4223 6
critical applications such as shipbuilding, arctic pipeline,
off-shore oil drilling platform and construction equipment
require not only good weldability, but also high strength
and notch-toughness in addition to a low impact transition
temperature. High-strength steels were developed with these
applications (primarily Navy shipbuilding) in mind. Such
steels have yield strengths of 550 to 700 MPa (80 to 100
ksi), and are known as HY-80 and HY-100. These steels were
quenched and tempered to provide good, low-temperature
toughness with minimum strength levels of 80 ksi and 100
ksi, respectively (17).
To some extent, these alloys have been replaced by more
economical (18,19) precipitation-hardened HSLA-80 and HSLA-
100 steels that have been studied thoroughly by several
investigators (17,19,20,21). The transformation behavior
and mechanical properties of these HSLA steels will be
compared with those of this study.
In recent years, somewhat similar alloys to those of
McEvily et al. (12,13) have been studied by DeArdo and his
co-workers (22), who refer to them as "ultra-low carbon
bainitic" (ULCB) steels. They have investigated the
posiible candidacy of the ULCB steels to replace the
traditionally heat-treated HTS and HY steels. The HTS
steels are C-Mn steels which, like the HY steels, rely on

T-4223 7
carbon for strength, except that the latter also contain
alloying elements required for adequate hardenability. Both
the HTS and HY steels exhibit base-plate properties which
are adequate for their intended purposes. However, the HY
steels suffer from poor weldability (i.e., susceptibility to
heat-affected-zone cracking under all conditions) which is
caused by both high carbon content and high carbon-
equivalent values (22). Figure 1.2 shows the critical
importance of low carbon contents in improving the
weldability and weldment toughness in steels.
DeArdo et al. showed that ULCB steels are very
attractive for heavy-section applications and do not need to
be heat treated to obtain good mechanical properties. The
ULCB steels obtain their high strength and high resistance
to both ductile and brittle fracture through the application
of specially designed alloys and advanced thermomechanical
processing. DeArdo's group also suggested that these steels
show a very good combination of strength and toughness in
the as-hot-rolled condition, e.g., a 745 MPa (121 ksi) yield
strength with a ductile-brittle transition temperature below
-700C.
Although there has been some research done to explore
the isothermal transformation behavior of this unique class
of ferrous alloy (12,13), the continuous cooling

T-4223 8
0.40 GRAVLLEI918
II
IC 0.30 ZONE II
A OEPENOS ON I
R CflIiTMOS ZONE III0 NIGH UNOER ALL
8 0.20 CC%4OTIONS0
N HY-8o
%0.10 ZONE I
SAFE UNOER ALLCONODTIONS A-ULa HSLA- 100
0 .00 1 I . -- -- ..t. --.30 .40 .50 .60 .70 1.0
CE=C+ + +C +Cr +Mo + V6 15 s
Figure 1.2 Effect of carbon level and carbon equivalent(CE) on the susceptibility to heat-affected-zone(HAZ) cracking (22).
transformation kinetics and the microstructural
characterization of these steels are yet to be understood.
Also uncertain is how the transformation behavior of these
steels compares with low-carbon, copper-bearing alloys.
The aim of this project is to address these needs, and the
results of this study will be compared with the HSLA copper-
bearing class of steels.
1.2 Purpose of The Project
Great demand for high-strength, tough steels with good
weldability encourages metallurgists to develop new alloys.

T-4223 9
* The common ground for many of the newest HSLA steels is low
carbon content. This is because carbon and/or carbides in
high-temperature transformation structures, such as
* pearlite, are detrimental to weldabi]ity, formability,
impact toughness and ductility (10). The formation of
carbides can be avoided by reducing the carbon content of
* the steel.
As mentioned in the previous section, there is a wide
range of compositions to consider for the new steels, with a
* wide range of mechanical properties. Although a great deal
of attention has been paid to the intermediate
transformation products (bainite) (10-16,23-34), more work
needs to be done to obtain a better understanding of the
transformation behavior of these products. In particular,
the effect of chemical composition and cooling rate on
austenite decomposition needs to be addressed.
The aim of this project is to explore the continuous-
cooling-transformation behavior and microstructure of a
unique class of ultra-low-carbon bainitic steels.
McEvily and his co-workers (12,13) studied the isothermal
transformation and hardenability of similar steels.
Their isothermal transformation studies (Figure 1.3) showed
that a high-temperature transformation product would form
above a deep bay in the transformation diagram. Below the

T-4223 10
a.
*a W
Shea Domn~ated
ruM
b. 170.05 fT 0.5 -09 1250b. • Ni2.8% ,09!6W0 Mo2.8%
Mo2.% -1200CbO.05%
a CO.04% -1150aE EE00 0-
3550- • - - 105E'• ~fy "0.50 43%; Ni - 2.8% Mo - O)
C l
500 1 1 1 1 9500.1 1 10 100 1000
rTo hour
Figure 1.3 a. Schematic isothermal diagram indicatingdiffusion-dominated and shear-dominatedaustenitic transformation ranges.b. Isothermal transformation diagram for high-nickel, high-molybdenum alloy where fT refers tothe fraction transformed at the indicated time(12).

T-4223 11
bay, a shear-dominated transformation product would form.
Based on their isothermal studies, they concluded that high
strength (more than 700 MPa) and good toughness (about 240 J
at room temperature) could readily be obtained upon air
cooling. They suggested that these excellent properties are
due to the strength of austenite and the shear
transformation products.
Because of the high cost of alloying (2), no attention
was paid to these steels until a few years ago, when DeArdo
et al. (22) studied the structure and properties of similar
steels. They placed the emphasis of their research on
austenite conditioning as a way to improve the mechanical
properties of these steels. Their results showed that the
as-hot-rolled combination of strength and toughness was
quite good, that is, a 745 MPa yield strength with a
ductile-brittle transition temperature below -70*C. They
also suggested that tempering will improve toughness but
does not affect the strength of these steels.
Although there has been some work done to explore the
transformation behavior of this unique class of steels,
there is very little information available about their
microstructural characterization. Even more noticeable is
the absence of information about the continuous-cooling
transformation of these steels.

0
T-4223 12
* It is very important to consider the fact that the
paths followed by the austenite in the metastable field
(austenite+ferrite) are largely different in the case of
isothermal transformation from that of continuous-cooling
transformation. Although the fundamental mechanisms of
transformation are not dissimilar, the produced
microstructures may be very different (35).
Recent and ongoing work at the Colorado School of Mines
(20,36-38) has revealed interesting austenite phase-
transformation behavior in low-carbon (0.04-0.06%) copper-
containing steels. These steels contain approximately 1.5%
Mn, 0.7% Cr, 0.4% Mo, and 1 to 3.5% Ni (20,37,38). Figure
1.4 shows a typical continuous cooling transformation
diagram for these steels generated by Colvin (36). As shown
in the diagram, acicular ferrite and granular ferrite form
over a wide range of intermediate cooling rates, while
polygonal ferrite and Widmanst~tten ferrite form during slow
cooling, and martensite forms as a result of fast cooling
rates.
As mentioned before, it is desirable to achieve similar
properties upon cooling over the widest possible range of
rates for the production of heavy section sizes (39). In
order to obtain this goal, polygonal ferrite transformation
ought to be delayed, and the bainite shelf on a CCT diagram

T-4 223 13
$.40
0~
0A
.0
0
(44
cp-I
f $4
* 0
* (4
0) V
-414
0
* 00a
03
0-4
00
-40%(a.) f1V~d~1 4 Jq
00

T-4223 14
* should be as horizontal (flat topped) as possible (36,39).
The steels under investigation are assumed to be capable of
these requirements (12,13,22).
1.3 Effect of Alloying Elements in HSLA Steels
1.3.1 Introduction
Plain-carbon steels are satisfactory in applications
requiring moderate strength and toughness, and where mild
environments are encountered. The relatively low
hardenability of these steels limits the strength which can
be obtained, except in fairly thin sections. However, most
of the limitations of plain-carbon steels may be overcome by
the use of alloying elements (40). This is true in the case
of HSLA steels as well. Figure 1.5 shows the hardening
effect of various alloying elements present in solid
solution within iron (41). Some of the most important
purposes of adding alloying elements to HSLA steels are (2):
- To increase hardenability;
- To improve strength at ordinary temperatures;
- To improve mechanical properties at either high or low
temperatures;
- To improve toughness;

T-4223 15
Ip /SiMn220
200
CIS.160 _"0
I00
80
0 2 4 6 8 10 12 14 16 18 20 22Alloying element, %
Figure 1.5 Solid solution hardening effects of the variouselements as dissolved in pure iron (41).
- To improve wear resistance, and;
- To improve corrosion resistance.
Alloying elements in general act to depress the
austenite-to-bainite transformation temperature, primarily
through their effects on the diffusion of carbon which is
necessarily associated with high-temperature transformations
(e.g., pearlite) (14). The effect of some of the most
popular alloying elements used in HSLA steels will be
discussed briefly in this section.
T-4223 16
1.3.2 Carbon
Carbon is the least expensive alloying element. It is
present in iron as an interstitial solute atom. Carbon has
a maximum solubility of 4.3% in austenite at 11480 C; by
contrast, its solubility in ferrite at room temperature is
essentially zero. Therefore, quenching a solid solution of
carbon in face-centered-cubic (fcc) iron to a temperature
below the eutectoid temperature results in the formation of
body-centered-cubic (bcc) iron and the precipitation of
carbon in the form of iron-carbide particles, or the
formation of the non-equilibrium martensite phase which is
supersaturated with carbon (11,41). Independent of
microstructure type, increasing carbon content in steel
produces a higher strength product.
Although increasing the carbon content of steel has
positive effects on strength and hardness, a high carbon
level has detrimental effects on impact strength and
transition temperature. These negative effects explain the
industry-wide tendency to reduce the carbon content and the
carbon equivalent of HSLA steels to the lowest levels
possible (2,12,39). Figure 1.6 shows the effect of carbon
content on impact-transition temperature curves of ferrite-
pearlite steels.

T-4223 17
200 0.11%Cao
150
'UZus 100.I-0.31% Carbn S/ / / 0.41%/ C.abon
50 0.49% Carol 0.60% Carbon0.69% Carbon
150 -100 -50 0 50 100 150 200TEST TEMPERATURE. °C.
Figure 1.6 The effect of carbon content and hence thepearlite content on impact-transitiontemperature curves of ferrite-pearlitesteels (2).
1.3.3 Chromium
Chromium, a bcc metal, has at most 20% solubility in
austenite with 0.5% carbon and unlimited solubility in
ferrite (41). Chromium shrinks the austenite phase field in
accord with its role as a ferrite stabilizer (Figure 1.7).
In addition to being a moderate carbide former, chromium
strengthens the ferrite matrix and controls grain size (19).
It also increases resistance to corrosion (41).
1.3.4 Copper
Copper was originally added to steels to provide
resistance to atmospheric corrosion (42). Later it was

T-4223 18
2800
2600 --
1500
-2400
I 1800 Cr- - - 0
• i/s*Carbon steel, O%Cr 8001400 "100-
700
120%020
1.0 .2 1.4 1.6 1
Carbon, %
Figure 1. 7 Effect of chromium content on the single-phaseaustenite region for Fe-Cr-C alloys (41).
found that this element could be used as a moderate solid-
solution strengthener and also as a precipitation
strengthener. It has f cc an structure and is an austenite
stabilizer. Since its solubility in ferrite is much less
than in austenite, precipitation may occur during the
austenite to ferrite transformation, or in the ferrite after
it forms (43).
T-4223 19
1.3.5 Manganese
Manganese has unlimited solubility in austenite, while
its solubility in ferrite reduces to 3% at room temperature
(40). Manganese is a very common alloying element in steel
because it is inexpensive, and because it improves the
hardenability of steel by inhibiting the transformation of
austenite to polygonal ferrite (12-16). Manganese also
improves the strength of steel by its solid-solution
strengthening effect.
1.3.6 Molybdenum
This bcc metal is a ferrite stabilizer and a strong
carbide former. Its maximum solubility in ferrite is 37.5%,
which lowers with decreasing temperatures (40,41).
Molybdenum strongly increases hardenability of steel by
delaying austenite decomposition at high temperatures (650
to 5000C), Figure 1.8. In addition, it provides significant
solid-solution strengthening (12-15,45). It reduces the
susceptibility of steel to temper embrittlement and
increases secondary hardening, while retarding softening
during tempering of steel (44,46). These effects are shown
in Figures 1.9 and 1.10. Molybdenum decreases the activity

T-4223 20
MOLYBDENUM SERIES
TA - WS C WSf)
(a) Steel 5 a _02 No "C"
Prma w%7a
ou
(b) Steel 6 af ,0. 1511 No~I
31WS 1•C USUIF F PMum"i \ % ..
79-3- lin C (laFf(C) Steel 7 "
0.30O Mo 30% No . 3,'
10Mu
(d) Steel 4 -. 11 *A -F
0. 382- o Pr,, -X--MEr IMF
AM
rI3M m 1 ,0 em-7
(e) Steel F C M 'F
Figu:,-e 1.8 Upper portions of CCT diagrams for steelsalloyed with Mo. Nominal phase composition is0.05 pct. C, 0.9 pct. Mn, 1.2 pct. Si and 0.5pct. Cr (all wt. pct.).
PF is polygonal ferrite and P is pearlite (52).

T-4223 21
"440
14
ohi
0
cncma,ii
ow
P.-4
E -4
0F.
O1
,,44
00
~0>
0 41
41W
$4 -4
0 41
$4-
:3
".4Nd A SOUPDW

T-4223 22
-4
C:
*4
- -4J L)U
P-i 0
*41
410
4J 4J
0 Ci
-4)0Fo 90,
N r-4
-40
o 00 o L4
0 c
00"41
)04
0'
r-I

T-4223 23
* coefficient of carbon in austenite (47) and in ferrite (48),
therefore retarding the formation and growth of ferrite
(49,50).
1.3.7 Nickel
* Nickel is an austenite stabilizer with unlimited
solubility in austenite and 10% solubility in ferrite at
room temperature, irrespective of carbon content (40). It
has an fcc structure and, like manganese, depresses
austenbite transformation temperatures upon cooling. It
also increases the hardenabilivy of steel primarily by
delaying the proeutectoid ferrite transformation (13,44).
Nickel improves the impact properties of steel by its
presence in solid solution in ferrite (12,35,41). It also
increases steel strength by grain refinement in addition to
solid- solution hardening (51).
1.3.8 Niobium
Three important roles of Nb(C,N) precipitation in HSLA
steels containing Mn, Mo and Nb are: inhibiting austenite
recrystallization during rolling, precipitation
strengthening and contributing to improved hardenability

S
T-4223 24
* (15).
Niobium is mainly used for grain refinement purposes and
also precipitation strengthening (42). Precipitation of
* Nb(C,N) can retard or inhibit recrystallization and
subsequent grain growth of austenite, which in turn will
lead to grain refinement of ferrite.
* Like copper, the solubility of niobium in ferrite is
much less than in austenite. Therefore, particles may
precipitate during transformation of austenite to ferrite or
within the ferrite after it forms (42). If used in
combination with manganese, niobium's solubility in
austenite will increase, which in turn further lowers
austenite transformation temperature and also limits the
premature precipitation of niobium in austenite. The
presence of nickel in conjunction with manganese may also
tend to limit the premature precipitation of niobium (53).
1.3.9 Nitrogen
Nitrogen is an interstitial alloying element, and like
carbon, this element is an austenite stabilizer and improves
both the yield and tensile strength of steel. At the same
time, nitrogen promotes brittle fracture and increases the
impact transition temperature. Because of the high

T-4223 25
electronegativity of nitrogen, nitrides usually form before
carbides and are very stable.
* 1.3.10 Silicon
Even though silicon is a ferrite stabilizer element, it
* also stabilizes retained austenite by retardation of
cementite formation 123-26,40,41). Silicon contributes to
solid-solution hardening and increases both yield and
tensile strength. It also improves the resistance of steel
to oxidation.
1.4 Strengthening Mechanisms in HSLA Steels
1.4.1 Grain Refinement
For a given composition of steel, it has been shown
that the most important factor controlling strength and
associated ductility is grain size (54,55). Pickering (3)
calls this "the unique feature of grain-size strengthening"
which is "the only strengthening mechanism that also
increases the toughness." According to the Hall-Petch
equation (56,57), the yield strength of a ferritic steel
increases with decreasing grain size (58):
T-4223 26
ao, = o1 +kd- (1.1)
where 0Y = yield stress
a, = stress needed to move dislocations in the
* grains (friction stress), an experimental
constant
ky = an experimental constant
* d = grain diameter
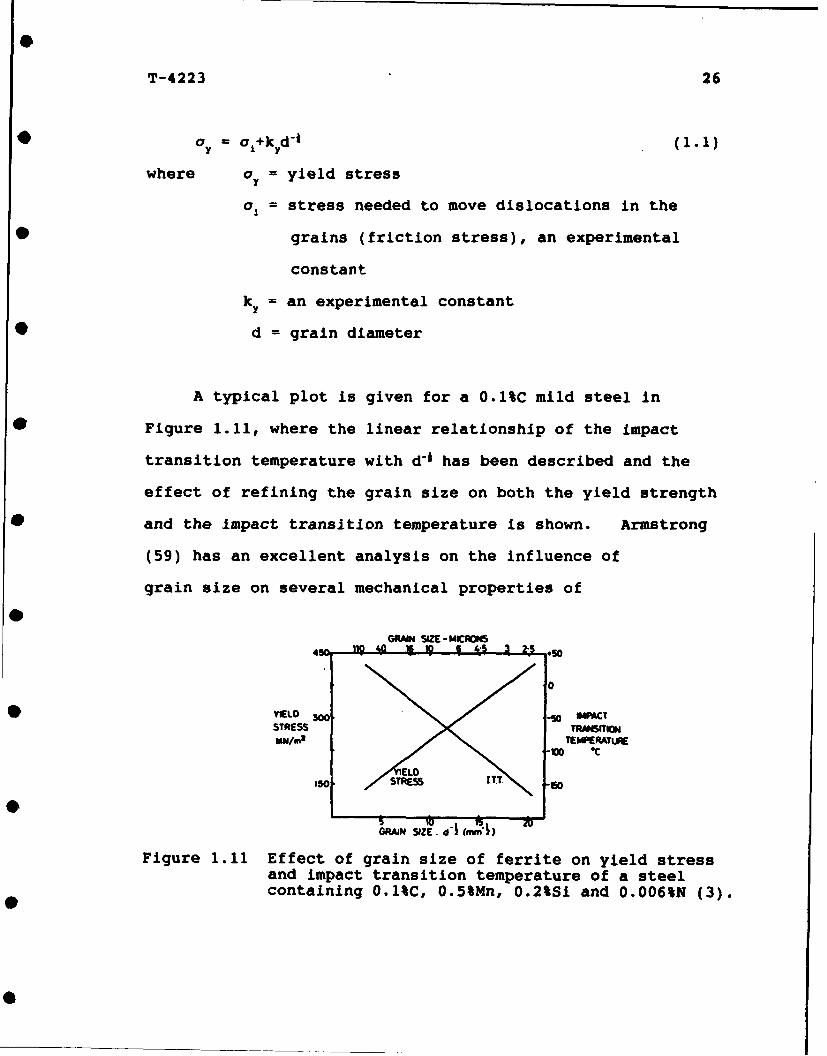
A typical plot is given for a 0.1%C mild steel in
* Figure 1.11, where the linear relationship of the impact
transition temperature with d-i has been described and the
effect of refining the grain size on both the yield strength
and the Impact transition temperature is shown. Armstrong
(59) has an excellent analysis on the influence of
grain size on several mechanical properties of
GRAIN SIZE - MICTAM45 110 40 rj 19S 3 2-9 *SO
.0
VtELO 300 IMPACTSTRESS TRANSITION
ImM •TEMPERATURE
1010 13 2
GAIN SIZE.d1bii)
Figure 1.11 Effect of grain size of ferrite on yield stressand impact transition temperature of a steelcontaining 0.1%C, 0.5%Mn, 0.2%Si and 0.006%N (3).

T-4223 27
polycrystalline materials, based on the Hall-Petch
relations. He concludes that hardness, fatigue strength and
yield strength, as well as ductile-brittle transition
* temperature, usually increase by decreasing the grain size.
The effect of grain size on creep properties of materials
are dependent on the temperature and the applied stress.
* A simple explanation of how grain size can affect
mechanical properties of materials is that grain boundaries
act as barriers to dislocation motion. However, Irvine
(60), in reference to upper and lower bainite, states that:
"In the bainitic structure, the yield strength is related to
the bainitic ferrite grain size, whereas the impact strength
is more dependent on the prior austenite grain size."
Irvine goes on to explain that the low-angle boundaries of
the bainitic ferrite plates are not as effective barriers to
propagation of cracks as the high angle boundaries and the
carbide aggregates. In lower bainite, the situation is
different, because of the presence of carbide within the
ferrite grains, which impedes fracture. Here, the prior
austenite grain size becomes less important and the
microstructural features of fine ferritic grain size plus
the carbides precipitated within the ferrite control the
fracture characteristics (60). Different methods of grain
refining have been used, such as controlled rolling, thermal

T-4223 28
cycling and microalloying with aluminum, niobium, titanium,
vanadium, etc.
By the late 1960s and early 1970s, it was widely
recognized that attractive combinations of yield strength
and toughness could be developed at modest cost using
properly processed steels with unique compositions (61-63).
Such methods as controlled rolling at a low finish-rolling
temperature were found to produce a fine austenite grain
size, and consequently a fine ferrite grain size, while
retaining some potential for precipitation strengthening
(2).
Tanaka et al. (64) defined controlled rolling in three
stages. Their definition is based on the fact that there
should be a definite difference in the physical properties
of steel between deformation in the austenite region and
that in the austenite-ferrite region.
Stage one includes simultaneous deformation and
recrystallization. This stage takes place at high
temperatures, above 10000 C, where dynamic recrystallization
occurs concurrent with deformation. During this stage,
there is a critical amount of deformation below which
recrystallization will not be completed. A deformation
level below 8% causes partial recrystallization as well as
strain-induced grain boundary migration, which will result

T-4223 29
in the formation of a mixed austenite grain structure.
Completing this stage with a total reduction of about 60%
gives a final grain size not smaller than 20pm.
The second stage consists of low-temperature (950 0 C to
Ar 3 ) deformation of austenite, during which austenite grains
become progressively more flattened with increasing amounts
of deformation, resulting in an increasing surface-to-volume
(Sv) ratio for the austenite grain structure. Increasing Sv
results in increased ferrite nucleation rates, giving rise
to a finer ferrite grain size in air-cooled specimens. An
increase in the amount of deformation will increase the
number of deformation bands, hence finer and more uniform
ferrite grains will form. At this stage, variations in
deformation temperature and the amount of deformation have a
minor effect on yield stress and almost no effect on tensile
strength.
Deformation in the austenite-ferrite region, the third
stage, takes place at temperatures below Ar 3 . Deformation
at this stage has a much larger influence on the mechanical
properties than the deformation present in the second stage.
IN addition with an increase in the amount of deformation,
both yield and tensile strengths increase noticeably and
impact transition temperature decreases rapidly. These
considerable improvements in the mechanical properties after

T-4223 30
deformation in stage three are mostly attributed to
substructural strengthening in the ferrite.
The other method of grain refinement uses thermal
cycling between room temperature and some temperature above
the Acl. This technique has been widely used to refine the
grain size of steel, therefore improving its mechanical
properties. Conventionally, this method involves multiple
austenitization steps above the Ac followed by quenching or
air cooling (65), whereas a non-conventional technique
involves partial reaustenitization between Aci and Ac3 (66).
In addition, rapid heat treatment has also been suggested by
some investigators (66,67). Figure 1.12 shows a schematic
representation of these thermal cycles.
On the average, each ferrite grain transforms to an
austenite grain upon complete austenitization, and upon
cooling each austenite grain will transform into about three
polygonal ferrite grains (68). However, Karlsson (65) has
reported a reduction of six times in ferrite grain size
after one-step austenitizing. He suggests that this
reduction is almost independent of carbon content, being
only slightly smaller in low-carbon material. His data also
indicate that the refinement diminishes on further cycling.
Similar results will be reported later in this thesis.
The effects of microalloying with aluminum, niobium,

T-422 3 31
41'w 0
10,44) .4'
w- r41i-4
IN $4 ud
-41 00'
Z. J0 -0 $
~~J4 I d4U
I 4)4 4)
021 I I 4)~r.I I 20 fa
f-a 0
U 00'.0
r- r. 0
4) 4)0 J4
4)4J9i$4
al! 4.9 ~
00g
20 0 jw
(1. 0 4) 04) 4)0
14 >
'40 044

T-4223 32
vanadium and titanium have been studied by many
investigators (15,16,42,51-53,69-74). Aluminum was the
first element to be used in combination with nitrogen as a
grain refiner (2), with the effect that fine aluminum
nitride particles control austenite grain growth (44).
But niobium is the alloying element which has attracted
the most attention (2), and is considered to have the most
beneficial effect on the strength-toughness combination of
steels (63). In addition to grain refinement, niobium
carbonitride particles also inhibit austenite
recrystallization during rolling. Niobium in solution
enhances hardenability, and it can promote precipitation
strengthening (73). However, a substantial amount of
niobium must remain in the austenite solid solution after
hot rolling in order to maintain its effectiveness in the
areas of hardenability and precipitation strengthening (60).
As precipitation of Nb(C,N) in the austenite removes niobium
from the solution, there will be effectively less niobium in
solution to further precipitate in ferrite. In particular,
Coldren et al. (15) observed a loss in acicular ferrite
hardenability when the amount of niobium dissolved in
austenite decreased below ~O.03%.
Furthermore, the effect of precipitates on austenite
recrystallization and grain growth of austenite or ferrite

T-4223 33
is strongly particle size-dependent. Small precipitates
(5 200pm) are most effective in preventing recrystallization
(61).
Vanadium is another strong carbide former that is used
primarily as a microalloying element for precipitation
hardening. Vanadium carbide has one of the highest
solubility levels among other carbides and nitrides in steel
(75) and tends to form interphase precipitates of vanadium
carbonitride partcles in polygonal ferrite (76).
Titanium reacts with interstitial atoms to form a
variety of compounds. Some of these precipitates are
desirable and some have detrimental effects on the
mechanical properties of steel. Reasons for using titanium
as a microalloying element include grain refinement and
precipitation strengthening (74).
Figures 1.13 and 1.14 show the effects of niobium,
vanadium and titanium on grain refinement and precipitation
hardening as well as on continuous cooling transformations,
respectively (62,77).
1.4.2 Solid-Solution Strengthening
Strengthening of pure iron by the introduction of
alloying elements is well known (41,78). The effect of

T- 4223 34
~A*41 W
0~t 41Q
0 41
41
w-4
0~
co0
0-
0- 41-
0>-44
$40
0~ $4)
6> '-4
0 w~
0 CA
"41
"41400
(A

T-4223 35
E-0
0
E4.
0440
'4 In~4 C
4p W
S.0
* / / 64.

T-4223 36
alloying elements on the mechanical properties of iron is
the consequence of the influence exerted by the sclution of
those elements in the iron lattice. The result is a solid
solution, which occurs in two types: substitutional and
interstitial. In the case of a substitutional solid
solution, the solute atoms take positions that are normally
occupied by solvent atoms. By contrast, interstitial solid
solution happens when solute atoms do not displace solvent
atoms but enter the holes, or interstices, between the
solvent atoms (79).
Generally, substitutional atoms cause symmetrical
distortion of the solvent lattice, therefore the
strengthening effect is relatively noderate. Asymmetrical
distortion caused by interstitial solutes has a more
pronounced effect on solid-solution hardening (3). However,
there are a number of factors that contribute to solid-
solution strengthening. According to Dieter (80), the most
important ones are relative size factor, relative modulus
factor, electrical interaction, chemical interaction (Suzuki
interaction) and configurational interaction (Fisher
effect). Relative size factor or the size misfit between
solute and matrix atoms gives an approximate idea of the
amount of strengthening that can be obtained, although some
elements such as nickel and manganese provide more

T-4223 37
* strengthening than would be expected by their misfit (4).
Detailed explanation of each of these factors is outside the
scope of this brief review.
* Although the overall effect of substitutional solid-
solution hardening is considered to be small (81), Speich
and Swann (82) showed that the solid-solution hardening
* effect of nickel (at 20%Ni) is responsible for 75% of the
overall strength of a martensitic alloy with 0.0034 wt% of
carbon. Figure 1.15 shows the effect of various
substitutional solute atoms on the yield strength of high-
purity polycrystalline ferrite at room temperature (78).
Further discussion of solute atoms was presented in previous
sections.
1.4.3 Precipitation Hardening
Precipitation hardening is defined (44) as
"hardening zaused by the precipitation of a constituent from
a supersaturated solid solution." This strengthening
phenomenon occurs when a solid solution at elevated
temperature is cooled to a lower temperature, and
precipitates form because of the decrease in solubility
(80). More conventionally, a solid solution is quenched to
"freeze in" the solute atoms, and a subsequent aging or

T-4223 38
32 TINI
26I/
24 -
20
000
,:16 21Af
00
OS I IS 2 2-s
Atomic per dent Alloy Litlment
1<
Figure 1.15 Yield st~rength versus atomic percent forvarious alloying elements (78).
00
S- S -
Atmcprcfl lo lmn
Fiue11Sil tegh essaoi ecn o
T-4223 39
* tempering treatment results in precipitation. Any particles
that form at high temperatures in austenite do not cause
strengthening because they are typically too coarse and
* widely spaced (4). Additionally, these particles lose
coherency with the matrix when the austenite-ferrite
transformation interface sweeps through the structure (15).
* However, these precipitates are effective in controlling
grain growth. The particles that form at low temperatures
in austenite, during transformation at the austenite-ferrite
* interface, or in ferrite during cooling are effective
strengtheners (4).
The ratio of carbide-forming element to carbon is also
important for precipitation hardening. Elements such as
vanadium, niobium, titanium, molybdenum, tungsten and
chromium are used to strengthen HSLA steels. A
number of investigators have studied the effect of these
alloying elements on mechanical properties of HSLA steels
(15,19,39,42,53,69). Some of these effects have already
been discussed.
Copper has been used in HSLA steels to take advantage
of its precipitation in absence of carbon (19,37,42,53,83).
Copper taken into solid solution in the austenite can be
precipitated as fine c-copper particles in ferrite. To
increase the degree of supersaturation of copper and to

T-4223 40
* avoid its premature precipitation in austenite, faster
cooling rates (84) and lower transformation temperatures
(53) have been recommended.
1.4.4 Transformation Strengthening
* Substantial substructural strengthening produced by
transformation is largely due to the temperature at which
the transformation occurs (3,12). In general, lower
transformation temperatures, result in a greater
strengthening effect. Most strengthening mechanisms can be
intensified by lower transformation temperatures (3). In
particular, it is possible to produce finer grain sizes in
the transformation product, increase the dislocation density
and the precipitate density, and make the precipitate size
finer if transformation temperature is lowered.
Because of a substantial decrease in the diffusion rate
of alloying elements at lower transformation temperatures,
there is a tendency to retain solute in solution, and
subsequently solid solution strengthening will increase.
Complex results (3) arise with the interaction of all of
these effects. Although all of the aforementioned factors
contribute to strength, each has its own unique impact on
toughness and ductility (3).

T-4223 41
* An attractive combination of strength and impact
properties can be obtained in low-carbon steels with
acicular-ferrite structures (15,16,85). Acicular ferrite is
* defined by Smith et al. (16) as:
"a highly substructured, non-equiaxed ferrite that forms oncontinuous cooling by a mixed diffusion and shear mode oftransformation that begins at a temperature slightly higherthan the upper bainite temperature transformation range. It
* is distinguished from bainite for two reasons: (1) thelimited amount of carbon available results in there beingonly a small amount of carbide present, and (2) the termbainite has been applied to such a wide variety ofstructures that it is somewhat indefinite."
One advantage of the acicular ferrite transformation is its
function as a catalyst for aiding both the grain refinement
and the precipitation hardening components of the
strengthening mechanism, relative to those components
obtainable from ferrite-pearlite steels. Because of its
relatively low transformation temperature, acicular ferrite
is characteristically fine-grained and contains a
substructure with a high dislocation density (12,16). The
low transformation teoierature also leads to a slower rate
of precipitation, which is easier to control. This
controlled precipitation will result in more homogeneous
properties throughout the plate thickness (16).
High yield strengths, in addition to excellent fracture
toughness and weldability, are obtainable at unusually low
carbon levels. This is due to the great potential of the
T-4223 42
acicular ferrite matrix to extract large strengthening
components from giain refinement, generating a highly
dislocated substructure and aiding precipitation
strengthening (15,16).
Proper alloying additions facilitate the formation of
bainitic structures upon continuous cooling by suppressing
the polygonal ferrite transformation. Alloying increases
strength by lowering the transformation temperature, which
in turn refines the bainitic structure and increases the
dislocation density (39) and the solid solution hardening
effect. In particular, the elements molybdenum, manganese
(16) and niobium (53) help generate the acicular ferrite
structure.
According to Morcinek et al. (85), an analysis of the
strengthening mechanisms operating in low-alloy steels
suggests that the two mechanisms which contribute the most
are dislocation and precipitation strengthening. Although
they suggest that the strengthening component related to
grain refinement can be included with the dislocation
contribution, others (2,86) believe that grain boundaries
are the most effective barriers in resisting fracture. In
the case of martensitic structures, internal twins also play
an important role in strengthening (81). Bainitic lath size
and dissolved carbon (which probably strengthens by

T-4223 43
interacting with the dislocations) are other features which,
in addition to the previously stated mechanisms, control the
strength of bainitic steel (2,72). For example, Gemmill
(87) states that hardening may occur by an interaction
between solid-solution elements and dislocations, and he
refers specifically to the influence of both manganese and
nitrogen on the high-temperature properties of carbon-
manganese steels.
Discussing transformation strengthening in steels
without considering the martensitic transformation is
incomplete. The diffusionless shear-type transformation of
austenite to martensite is one of the most common
strengthening mechanisms used in steels (80). The high
strength and often brittle nature (88) of martensite in
steels is an indication of strong barriers to dislocation
motion in this structure (80). Although substructural
strengthening in martensitic transformation is responsible
for a great degree of the strength of martensite, this high
strength can not solely be attributed to the fine structure
of this austenite transformation product (88).
Hardness of martensite is very sensitive to the carbon
content of steel for the values below 0.2%, and increases
with an increase in carbon content (80). In the absence of
carbon (0.0034%), Speich and Swann (82) showed that three

T-4223 44
I quarters of the strength of martesite in an Fe-Ni alloy with
20%NI is due to the solid-solution strengthening effect of
nickel.
1.5 Microstructure of Low-Carbon Steels
Decomposition of austenite at subcritical temperatures
(11) produces a variety of microstructures that are somewhat
well known to ferrous metallurgy students. As a result of
this decomposition, pearlite, polygonal ferrite and
Widmanst~tten ferrite form at higher temperatures, while
upper bainite, granular bainite (also called granular
structure), granular ferrite, lower bainite and acicular
ferrite form at intermediate temperatures or cooling rates.
By decreasing the temperature even more or by increasing the
rate of cooling, martensite forms.
There has been tremendous debate since the discovery of
the intermediate structure over the mechanism of its
formation and consequently the terminology, and there is no
sign of compromise (27) between the three major theories
developed by different groups of investigators. These three
theories are summarized by Ironstone as follows:
1. The generalized microstructural definition considers
bainite to be the product of a non-lamellar (as opposed to

T-4223 45
pearlite), and more generally, a non-cooperative mode of
transformation. It is believed that the two product phases
form by diffusional nucleation and growth and differ
continuously in composition from the matrix and each other.
2. The overall reaction kinetics definition views the
bainite reaction as having its own C-curve on a TTT-
diagram. No bainite can form above the highest temperature
of this curve, which may be termed the kinetic-Ba
temperature. At isothermal reaction temperatures near the
kinetic-B., transformation of austenite to bainite is
increasingly incomplete.
3. The surface relief definition usually considers bainite
to be precipitate plates formed by shear at rates paced in
some manner by diffus'>n. In some versions of this
definition, however, the diffusion process may occur either
before or after formation of a single product phase.
Upper bainite nucleates mainly at the austenite grain
boundaries (11). The ferrite crystals are lath or plate-
like in shape and second-phase carbide particles form
between ferrite laths (28-30). According to the diffusion-
controlled growth models, while ferrite laths grow, carbon
is rejected into the austenite and makes the austenite rich
in carbon. This enriched austenite usually transforms to
carbide, although sometimes it remains between the adjacent

T-4223 46
ferrite laths as pools of retained austenite or it
transforms to high-carbon martensite (11). Bainite without
carbide has been referred to as granular bainite (35).
In opposition to this model, Oblak and Hehemann (31)
proposed that formation of both upper and lower bainite
occurs by repeated nucleation of substructural units and
rapid growth to a limited size. These subunits are thought
to form by a cooperative transfer of lattice atoms, although
not necessarily at the rate characteristic of martensitic
reaction. The rate of formation is controlled by this
multiple nucleation process. This suggestion has been
supported by Bhadesia and Waugh (32).
Purdy and Hillert (33) suggested that subunits of
bainite have similar orientations, whereas new units of
plate martensite have new orientations, an indication that
does not relate to the autocatalysis (martensitic) growth
of bainite. On the other hand, they admitted that the
elastic strains are important in both formation and growth
of ferritic subunits.
Aaronson and Kinsman showed that the lengthening
mechanism of proeutectoid ferrite and upper bainitic
crystals is controlled by the formation and lateral movement
of ledges. They also concluded that the subunits in the
bainite sheaves lengthen by the formation and the diffusion-

T-4223 47
controlled lateral movement of ledges. Both the "cessation
of the thickening of sheaves" and the "rapid increase in the
rate of sympathetic nucleation at lower temperatures" have
been explained in terms of the "solute drag effect" (89).
The special effect of alloying elements upon growth kinetics
has been interpreted (90,91) in terms of a "drag effect"
produced by the segregation of certain alloying elements to
austenite-ferrite boundaries. Alloying elements that reduce
the activity of carbon in austenite are particularly
involved in such segregation. The tendency for segregation
increases as the temperature decreases, especially because
of the high concentration of carbon in the austenite at
austenite-ferrite boundaries. When the drag effect is
larger than the driving force for growth, an upper nose will
develop in the TTT diagram (see Figure 1.3). On the other
hand, as the drag effect approaches saturation and the
driving force begins to overcome this effect, a bay will
begin to develop in the TTT diagram. In this regard, the
role of molybdenum in the formation of bay is very
interesting. Based on thermodynamic arguments, it is
expected that molybdenum displace the TTT diagram to shorter
times compare with an iron-carbon alloy of the same carbon
content, thereby decreasing rather than markedly increasing
the hardenability of steel. It is the kinetic solute-drag

T-4223 48
effect which provides the marked increase of hardenability
in molybdenum-containing steels (90).
Regarding different forms of bainite, as the
transformation temperature is lowered, bainite laths tend to
become finer (10,11), but the carbide's orientation
relationship with the ferrite does not change (30). The
orientation relationship observed for the ferrite and
cementite in upper bainite shows that they both are related
through the parent austenite (30). As is true of upper
bainite, prior austenite grain boundaries are the first
sites for the nucleation of lower bainite, although
nucleation tends to happen within the grains as well (11).
The ferrite is acicular and the carbide particles form
within ferrite laths at an angle of about 55-650 to the long
direction of the ferrite lath (30). The reason for the
formation of carbide within the ferrite plates is that lower
bainite is significantly supersaturated with carbon,
therefore the formation of such a ferrite occurs in
association with the precipitation of carbide particles
(11). The orientation relationship between ferrite and
carbide in lower bainite reinforces the opinion that carbide
precipitates from ferrite (30). Therefore, even if the
morphology of upper and lower bainite appears to be similar,
these orientation relationships are very effective evidence

T-4223 49
to distinguish between the two different microstructures
(30).
Up-quenching experiments (34) have shown that there are
major internal structural differences between upper and
lower bainite, and that these differences appear as a result
of alteration in the kinetics of formation and growth of
these products. Even though there are some similarities
between the bainitic (especially lower baiaite) and
martensitic structures, such as similar orientation
relationships and surface relief effect, a true martensitic
structure is diffusionless (92).
There is considerable confusion regarding the
terminology for the microstructures formed at intermediate
temperatures upon cooling (35,37), or by interrupted
transformation of austenite to bainite and ferrite (93) in
low-carbon alloyed steels. The equiaxed morphology of
granular ferrite is similar to that of polygonal ferrite,
however it is distinguished from polygonal ferrite by higher
dislocation density content and finer structure (37).
Granular ferrite formation is a diffusion-controlled
transformation, and there has been evidence indicating that
no shear is involved in the formation of this microstructure
(37). Consequently, it should be differentiated from
granular bainite or granular structure, since these
structures are considered to be formed by a shear-type

T-4223 50
transformation. Hehemann (89) believes that impingement is
the reason for nonacicular nature of granular bainite.
According to Bhadeshia and Christian (94), acicular ferrite
is essentially identical to balnite, and the reason that its
detailed morphology differs from conventional bainite is
that the former nucleates intragranularly at inclusions
within large austenite grains, while the latter nucleates
initially at austenite grain boundaries (11,94).
However, other investigators (95) believe that acicular
ferrite is not identical to bainite. Although nucleation of
acicular ferrite involves diffusion of carbon (and other
interstitial atoms), there is no reconstructive diffusion
during growth (96).
The observation of "steps" or "carbon-enrichec' residual
austenite" can not be taken to imply that acicular ferrite
is indeed Widmanst&tten ferrite (as it is sometimes
considered to be), because the mechanism for interface
motion (step mechanism) does not relate to the mechanism of
transformation. The enrichment of austenite, on the other
hand, can happen during or after the transformation (94).
In an attempt to unify the definitions of the
microstructures produced upon continuous cooling in very
low-carbon steels, the bainite committee of the Iron and
Steel Institute of Japan (ISIJ) has conducted some

T-4223 51
* investigations. The results appear in "Atlas for Bainitic
Microstructures, Vol. 1", which lists some microstructures
and the corresponding definitions (97).
* Martensite in steels is formed by a diffusionless
transformation of austenite (44) in an athermal or near-
athermal fashion (33). This transformation involves a
* complete military (displacive) motion of atoms where (in
principle) none of the atoms changes place with its
neighbors (88). The martensitic transformation occurs by a
shear mechanism, which is more likely to happen at lower
temperatures. Surface tilting is an important feature of
this transformation, which implies that there has been
cooperative transfer of atoms across the advancing interface
(44,98).
By lowering the transformation temperature or
increasing the carbon content (or in general increasing the
strength of austenite by alloying addition), the morphology
of martensite changes from lath to plate morphology (44).
The Inhomogeneous shear in plate martensite is compensated
by internal twinning, and therefore the dislocation density
in plate martensite is not very high (44,81). In lath
martensite, however, less internal twinning is observed and
this is an implication of the compensation of the
inhomogeneous shear by slip, which is in agreement with high

T-4223 52
dislocation density of lath martensite (44,81).
Very low-carbon steels exhibit massive transformations
at both high and low transformation temperatures. While the
high-temperature product has been identified as massive
ferrite, martensitic transformation is the product of lower
transformation temperatures (99-106). Goodenow and Hehemann
(107) reported similar observations of martensitic reactions
in very low-carbon steels containing 9% Ni. They proposed
"low-carbon martensite" as an alternative name for "massive
martensite". Massive martensite refers to the blocks (108)
of martensitic regions which consists of fine laths of
martensite. Because of the similar shear directions (100)
and low-angle boundaries of martensitic laths, only packet
boundaries respond to etching. For this reason, the
microstructure appears to consist of blocks of non-etched
regions. Similar observations are presented in Chapter 3.
Although it was once customary to use surface rumpling as an
indication of martensitic reaction, Gordon Parr (101)
suggested that this criterion was not a fair indication of
the transformation mechanism.
To reduce the confusion about terminology, Krauss and
Marder (109) proposed the term "lath martensite" for the
martensitic structure produced in low carbon steels. This
structure had been referred to as massive or low-carbon
0;
0I

T-4223 53
* martensite, or as high-temperature martensite. Acicular or
low-temperature martensite was proposed to be called "plate
martensite". Plate martensite forms at lower temperatures
* than lath martensite, and that is because of a high carbon
content or other alloying elemeats in the steel. These two
terms - lath martensite and plate martensite - have been
* accepted by many investigators.
0
0
0

T-4223 54
* 2.0 EXPERIMENTAL PROCEDURES
2.1 As-Received Plates
2.1.1 Geometry and Chemistry
* David Taylor Research Center (DTRC) supplied five
plates with three different chemistries for this project.
Plates were melted as experimental heats at the USS
Technical Center, hot-rolled and air cooled. The general
designation for these plates is 8902-8025. The specific
designation for each chemistry and the dimensions of each
plate are shown in Table 2.1:
Table 2.1 The specific designations and the dimensions ofthe as-received plates.
Designation Dimensions (mm) Dimensions (in)
A3 254x165x19 l0x6ix*
A4 267x203x19 10x8xx
B3 267x197x19 1OWx71x4
B4 260x197x19 10*x7fxi
C4 254x197x19 10x7Tx I
Ladle and product chemistries were provided by the USS
Technical Center. Additional chemical analyses of the steel

T-4223 55
* products were performed at the Colorado School of Mines
(CSM) and at the USS Technical Center, using emission
spectroscopy and Leco interstitial analyses. The emission
* spectroscopy and interstitial analyses were conducted at
various points on each plate, ranging from the edge to the
center of the plate. The resulting compositions are
• reported in the Chapter Three. Because the compositions of
the plates A3 and A4 and those of the plates B3 and B4 are
identical, they were recorded by using the names A for A3
and A4, B for B3 and B4, and C for C4. It should be
mentioned that plate C in the as-received condition was bent
and contained a number of cracks.
2.1.2 General Structure
A long sample (half the width of each plate) was
examined to reveal the possibility of any variation in
general microstructure and grain size as a function of
position (Figure 2.1). Standard metallographic techniques
were employed in preparing the specimens. After cutting and
grinding the samples to a 600 grit finish, they were
polished with 6 ym diamond paste. After the remainder of
the diamond paste was cleaned from the surface of the
specimens, they were polished on microcloth with 1 pm and
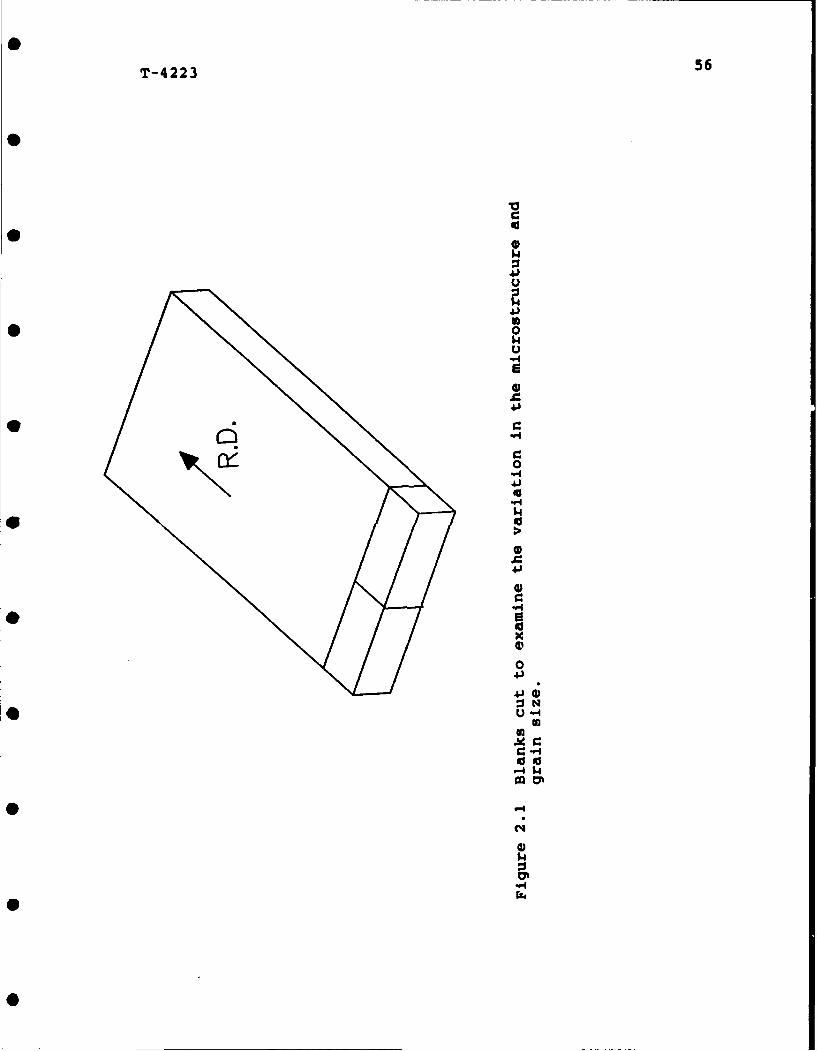
T-4223 56
WI*0
-.4
0
'41
C4
V* 0
o
".4
0"4•4J
SUd
*0

T-4223 57
* 0.05 pm alumina powder. A solution of 2% nital was used to
etch the above samples.
*2.1.3 Inclusions
To determine the morphology, comparative number
* density, distribution and chemical composition of inclusions
in the as-received plates, samples from all three
steels were cut as shown in Figure 2.2. The above samples
were then mounted in bakelite, polished using standard
procedures, and examined with a Neophot 21 metallograph. In
addition, energy dispersive spectroscopy (EDS) in the
scanning electron microscope (SEM) was used to determine the
chemistry of the inclusions observed in these steels.
2.1.4 Hardness Testing
Hardness testing was conducted on specimens from the
as-received steels. One piece, the same as that shown in
Figure 2.2, was cut from each plate and surface ground to a
600 grit finish. A Leco Hardness Tester (model R-600) was
used to obtain the hardness measurements (110). The average
of measurements on eight areas of each sample were taken,
and reported as the Rockwell C Hardness Number (HRC).

T-4223 58
S0
0%4
rsiv
U.
L-Cn
ca7@)d~

T-4223 59
2.2 Ac. and Ac3 Determination
In an attempt to study microstructural evolution in
these steels, pieces from the as-received plates (as
documented in the previous section) were used as the basis
for further study. The temperatures at which austenite
starts to form and finishes forming during heating, Ac, and
Ac 3 , respectively, were determined. A thermomechanical test
system, Gleeble 1500, was used for this study. This system
will be described in detail in section 2.4.1.
As shown in Figure 2.3, cylindrical samples were
machined from each steel to a size of 105 mm (4 inches) in
length and 6 mm (0.25 inch) in diameter. These samples were
then heated up to 12000C at the rate of 30C per second (111)
and cooled to room temperature at a rate of 500C/s. The
dilatometric data and the corresponding critical
temperatures for all the three steels, as well as the
calculated data, are given in the Chapter 3.
Microstructures, prior austenite grain sizes and hardness
values of specimens cooled at various rates were examined in
detail.

T-4223 60
41
0
W4
41
HI U0
c 0
0
U.))
4)
l~t U
IIIL

T-4223 61
2.3 Prior Austenite Grain Size
2.3.1 Introduction
Grain size is one of the most important factors in
determining the strength and toughness of steel products.
One of the goals of this research program is to compare as
closely as possible the transformation behavior of a low-
carbon modified A710 steel (20) with the present alloys.
Colvin (20) used 9050 C as the austenitizing temperature for
his study, and determined that an austenite grain size of
about 10 to 15 pm was generated after 5 minutes holding at
this temperature. He also found that longer holding times
do not have a noticeable effect on the grain size.
2.3.2 Heat treatment
Small coupons (19xl9x3 mm) were cut from each steel
using a band saw (Figure 2.4). Various heat treatments were
conducted in salt baths or muffle furnaces, and because the
results of the muffle furnace method were reproducible, this
method was chosen for the rest of study.
At the first stage of these heat treatments, six
samples from each steel were used. Samples were soaked in

T-4223 62
Transverse Plane Longitudenal Plane
Figure 2.4 Wafers used for grain size studies.
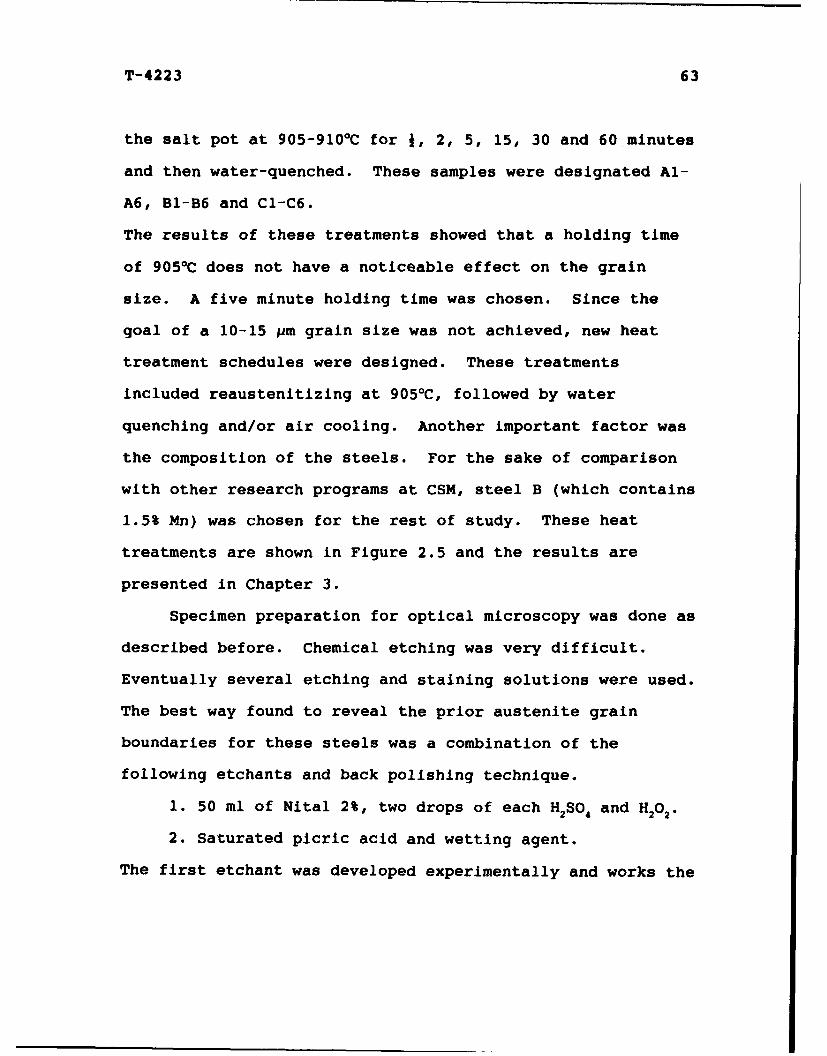
T-4223 63
the salt pot at 905-9100 C for J, 2, 5, 15, 30 and 60 minutes
and then water-quenched. These samples were designated Al-
A6, B1-B6 and C1-C6.
The results of these treatments showed that a holding time
of 9050 C does not have a noticeable effect on the grain
size. A five minute holding time was chosen. Since the
goal of a 10-15 pm grain size was not achieved, new heat
treatment schedules were designed. These treatments
included reaustenitizing at 9050C, followed by water
quenching and/or air cooling. Another important factor was
the composition of the steels. For the sake of comparison
with other research programs at CSM, steel B (which contains
1.5% Mn) was chosen for the rest of study. These heat
treatments are shown in Figure 2.5 and the results are
presented in Chapter 3.
Specimen preparation for optical microscopy was done as
described before. Chemical etching was very difficult.
Eventually several etching and staining solutions were used.
The best way found to reveal the prior austenite grain
boundaries for these steels was a combination of the
following etchants and back polishing technique.
1. 50 ml of Nital 2%, two drops of each H2So 4 and H2O2.
2. Saturated picric acid and wetting agent.
The first etchant was developed experimentally and works the
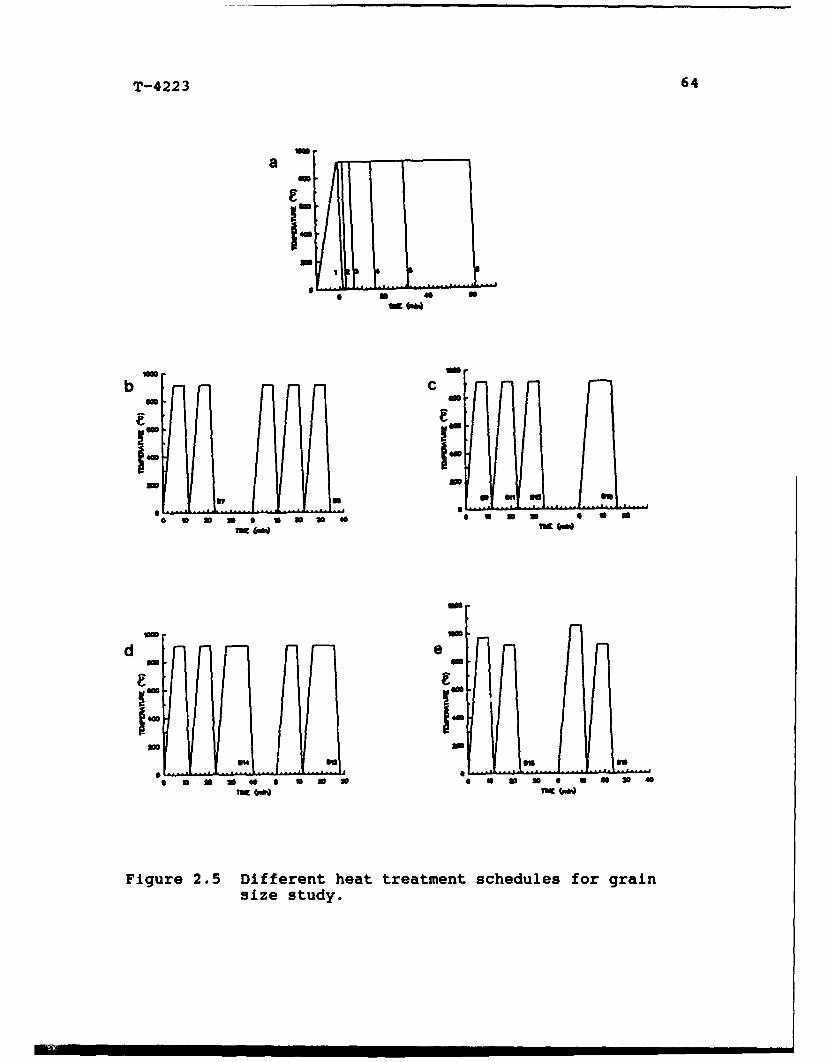
T-4223 64
a
urne
b C
-A-
40 so Ii 50.MW S
teso
* fa a is . * a - U a ns a a I@
a n - IMLr. .r .. . .. .. . .
g. anC
.ne• 000 vu l
Figure 2.5 Different heat treatment schedules for grainsize study.
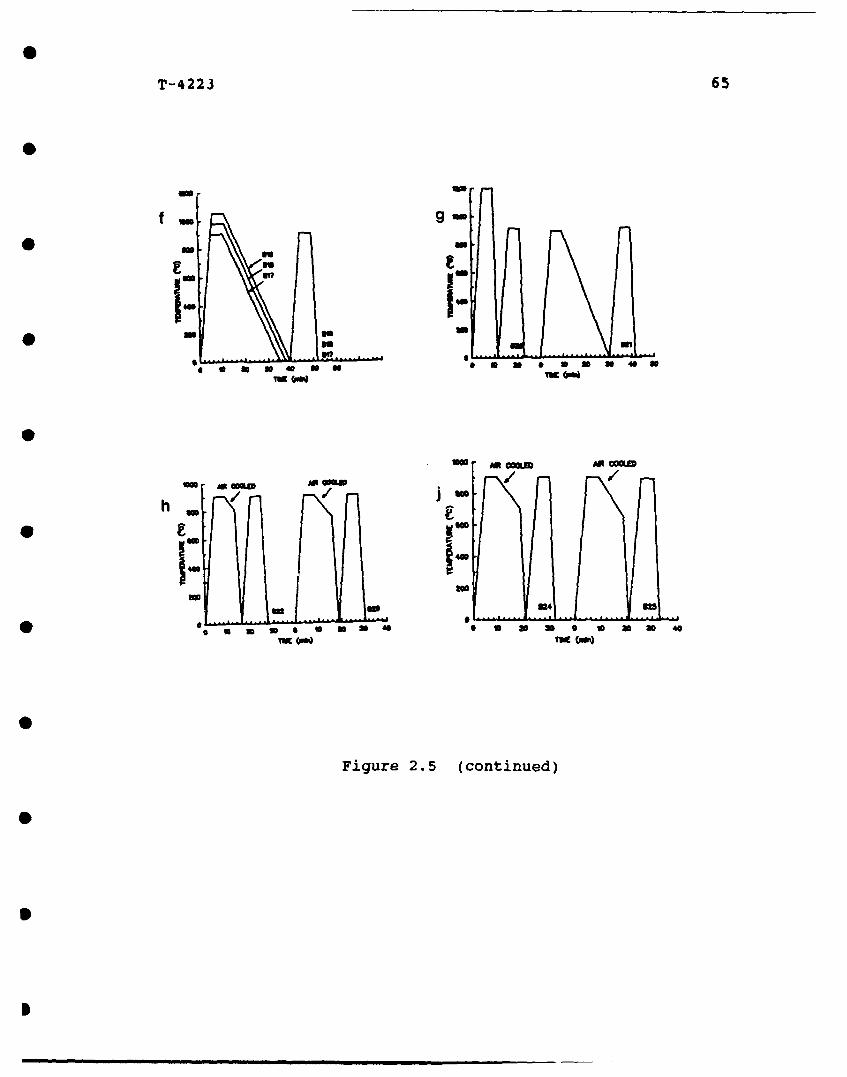
0
T-4223 65
0
mf g
0~s 0 am a 40 a a S U0
m PR COM
No Am own a wan mmR
04
61s o - so
f M 3 40•aus as
Figure 2.5 (continued)
e
S
Ii

T-4223 66
* best in conjunction with back polishing. Tempering at 4500C
for 24 hours is sometimes helpful to reveal the prior
austenite grain size. The second etchant has the best
0 effect on small-grain-size samples. The average grain size
was determined by standard linear intercept method
techniques (112-115).
2.4 Transformation Kinetics
2.4.1 Gleeble 1500
The Gleeble 1500 is a computer controlled
thermomechanical test system which has been designed for
both thermal and mechanical testing simultaneously (116).
The thermal capability of the Gleeble 1500 was used
exclusively for the current study.
Since electric resistance heating produces a more
uniform temperature zone than induction heating (Figure
2.6), the Gleeble 1500 has been designed to take advantage
of electric resistance heating, although it is possible to
use induction heating as well. In the case of induction
heating, the magnetic field generated by a high frequency
current passing through a coil produces heat inside the
material at the core of the coil. By contrast, electric
resistance heating consists of passing an electric current
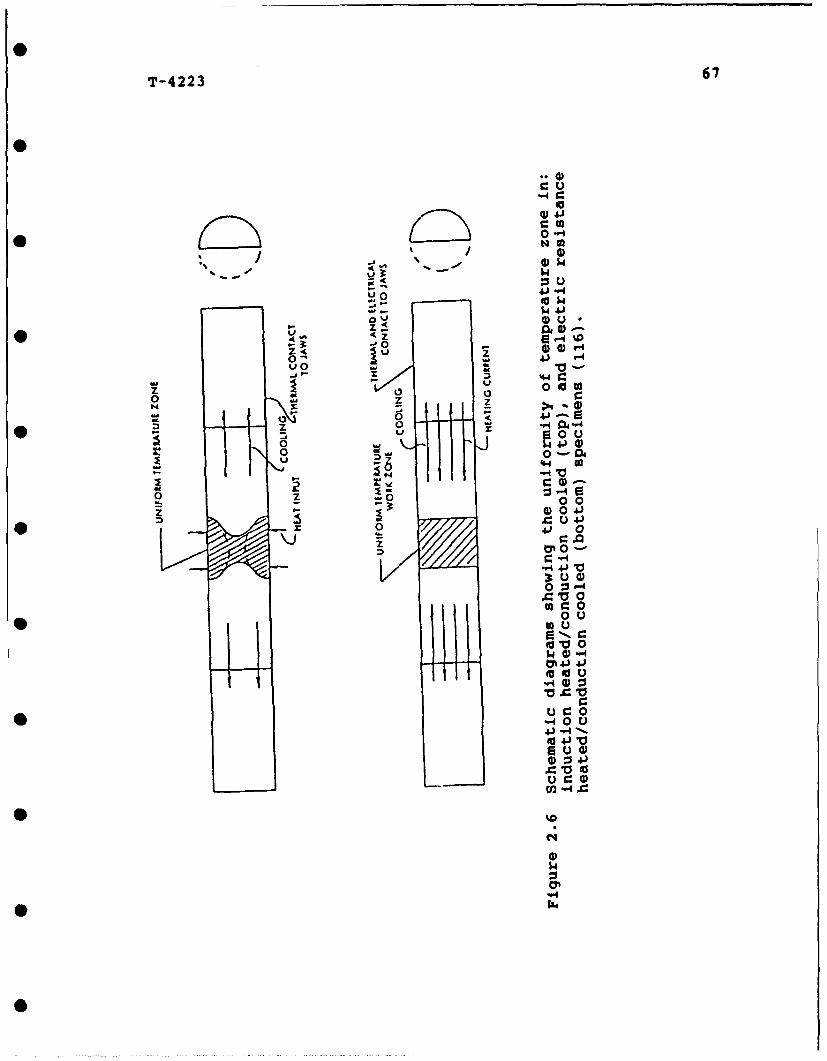
T-4223 67
00
00
0-' 41 -
uO 0
0 0
C 0o -
z~: -4 9d~
0 0 04) 0-
x0 4*J 0
0 :3-.973 0
r- 00 U
muv' 0
I4 4)-4
u r. 0
"q u0
U)-40
$4~
00
-.40

T-4223 68
* through a metallic specimen, where the resistance of the
material to the flow of current generates heat.
Distribution of this current in the test sample is
* controlled by the cross section of the specimen and the
water-cooled copper jaws which are used to mount the
specimen. Although water-cooled jaws cause the heat to flow
* through the length of the specimen, Figure 2.7 (116) shows
that radial conduction cooling is practically zero and
causes no temperature gradient through the cross section of
the sample. This means a uniform temperature along the
cross section of the work zone, which is illustrated in
Figure 2.8, (116). Considering electric resistance heating
and conduction cooling, the flat thermal profile can be
maintained even if the heating rate exceeds 20,000OC/sec
(116).
Because the measurements of temperature and dilation
are taken across an isothermal plane, alumel and chromel
wires must be welded to the center of the specimen's midspan
very carefully. When electric current flows through these
thermocouple wires, the instant temperature of the midspan
will be transferred to the computer. For working
temperatures up to 12000 C, alumel and chromel make an ideal
thermocouple for most of materials.
A C-strain (circumferential strain) fixture
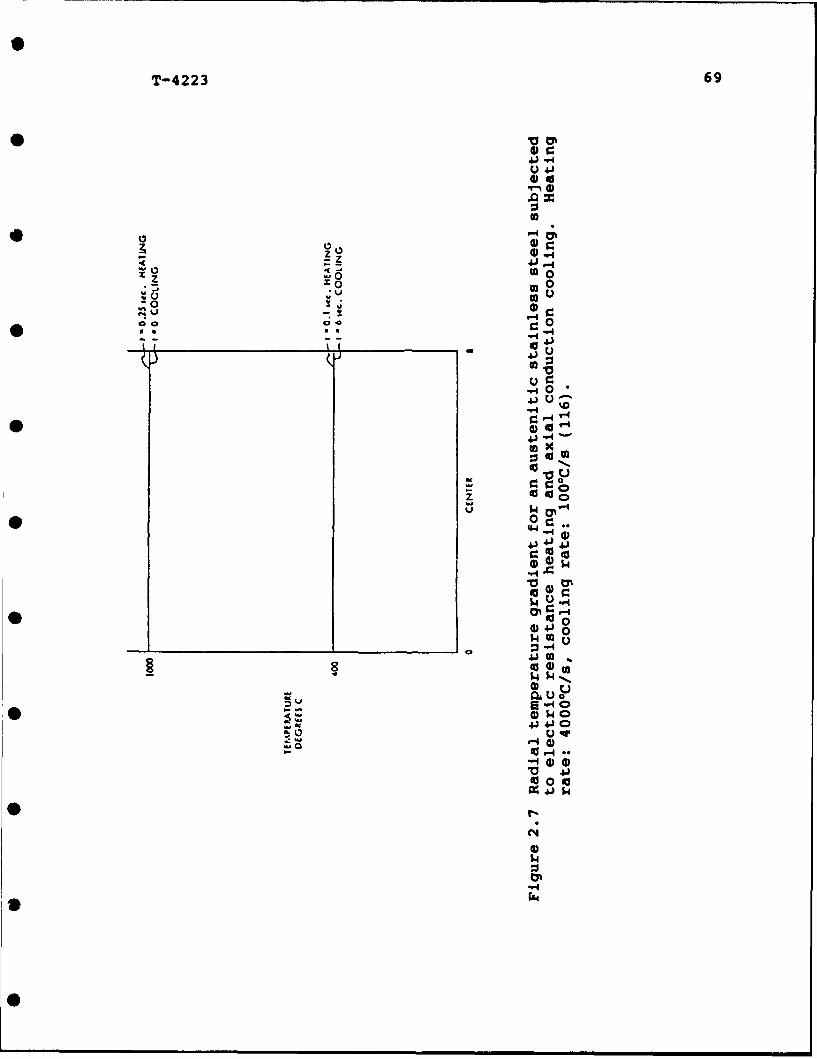
T-4223 69
41 W4lu.41we
.0 m 0
.0
UU•0 , 4
00 to
01 U"4 Ju40
Se
4J .14
~0@
z ~ 0o
004J,
dOl0g 0.0
3 r-441 w
V 4) r
"4 0
04

T-4223 70
OJA • wCONTACT AE
THRE.ADIED ENOS 0 C WORK ZONE
,00-C - 1_0J_- ,ooC• I " --- AT 1O'C-T--
TE=MPERATURE TEMIPFRAT'UAE
R.T. R.T.
DIAMETER ZONE LENGTHCROSSWISE THERMAL PROFILE LENGTHWISE THERMAL PROFILE
SPECIMENFOR
DYNAMIC THERMAL/MECHANICAL SIMULATION
Figure 2.8 Schematic diagram showing the electricresistance heating of a sample used in theGleeble. Uniform heating is produced across thework zone length and diameter (116).
0I

T-4223 71
* (dilatometer) measures the strain in the isothermal plane.
The resolt:tion of the transducer used for these measurements
is essentially infinite (116). The method of mounting of
S the C-strain fixture is very important. To get the best
results, the dilatometer should be mounted as tightly as
possible, to guarantee measurement of very small
* displacements.
The atmosphere of the test can be changed, depending on
the desire of the researcher. Argon and helium gas are the
* most common types of atmosphere used for CCT tests.
A data acquisition system and ASYST data manipulation
software have been installed to the system available at the
Colorado School of Mines.
2.4.2 Sample Geometry
The geometries of the samples used in this study were
determined based on previous and current work done at the
Colorado School of Mines (20,38). The most important
factors to consider when choosing a certain geometry are
axial cooling capacity of the sample',, without using any
further aid such as gas cooling and so on, as well as
maintaining an isothermal plane during heating and cooling.
Figure 2.9 shows the four different geometries that

T-4223 72
SdUU
VI.© VI
in
C M
.4
0,-
U
*0
I .d
-I1
o
I . tm
iUE E o
°-E Eo to (n %
ovi
*wu
"-4 000"y4 U
a..
to EE- E 0 E -E DU0
SQ0
C66
C14
"$4

T-4223 73
were used in this study. Type A was used for slow cooling
rates (below 100C/sec), while type B (10 mm) was observed to
be more suitable for intermediate cooling rates between
100C/sec to 25 0C/sec. For cooling rates between 25*C/sec up
to 75 0C/sec type B (12 mm) was used, and type C was used for
fast cooling rates above 75 0C/sec. In this way, good
agreement between the actual temperature and the program
temperature was obtained (38).
To avoid the center-line segregation bands, machining
of the above samples was designed to be off-centered.
Figure 2.9 shows more details about the dimensions and
design of these specimens.
2.4.3 Dilatometry as a Function of Heating and Cooling
Rate
It is well known that the transformation temperature in
both heating and cooling is affected by the rate of input or
output of heat (40,116,117). It has been suggested (117)
that heating rates of 2 to 30C/sec do not change the
transformation temperatures. Considering the above facts,
30C/sec was chosen as the heating rate throughout the
experiments. Since the exponential cooling is more close to
reality than linear cooling, an exponential cooling program
T-4223 74
(20), similar to those calculated with the Newtonian formula
(118), was used for this research. The program considers
the austenitizing temperature, upper and lower boundary
temperatures and time between these temperatures to simulate
the desired exponential cooling rates. Because most of the
austenite transformations in hypoeutectoid steels occur
between 800 0C and 500*C (111,118), the time interval between
these temperatures (At,_,) is a base for calculation of the
cooling rate. These temperatures were chosen as upper and
lower boundaries for cooling programs.
2.4.4 Dilatometry
Determining transformation temperature has
traditionally been done through measurements of the magnetic
properties of a material, or by measuring volume change
taking place during the transformation (111). The latter
method is preferred by many investigators (111), and was
used in the present work.
In the process, radial contraction of the midspan for
each specimen as a function of the actual temperature was
measured. Dilatometric measurements were conducted using a
dilatometer that has been designed by Duffers Inc. for the
Gleeble 1500. It is also important to note that proper
T-,223 75
insulation or water cooling should be used to protect the
transducer at working temperatures higher than 9000 C.
2.4.5 Testing Procedure
Thermocouple wires and a C-strain fixture are the two
most important accessories in these tests. To guarantee
proper attachment of the above accessories, all the test
specimens were polished with a 600 grit silicon carbide
paper and then cleaned with ethanol. To maintain good
electric contact, copper grips were checked and cleaned.
After putting a ceramic insulator on thermocouple wires
prior to each test, they were attached to the proper switch.
The dilatometer then was placed on the center of the midspan
opposite the thermocouple. The test chamber was evacuated
after a chamber cover was put in place. This process was
continued by purging argon gas into the chamber. After
filling the chamber with the argon gas and maintaining a
positive pressure, evacuation took place one more time,
followed by a second argon gas purging. When the chamber
pressure reached a level slightly above the atmosphere
pressure, a safety valve was opened to maintain constant
pressure inside the chamber. The above procedures prevent
samples from being oxidized or decarburized.

T-4223 76
Samples were heated at a rate of 3°C/sec to an
austenitizing temperature of 9050 C for steels B and C, and
920'C for steel A. Each sample was held at the proper
temperature for 5 minutes prior to cooling. Basically, two
CCT diagrams were generated for steel B based on prior
austenite grain size.
A single cycle (iX) of austenitizing corresponded with
a prior austenite grain size of about 30 pm; 2X meant a
double-cycle austenitizing treatment and corresponded with
about a 7 pm prior austenite grain size. Cooling rates
varied between 150 0C/sec and 0.05°C/sec.
The dilatometric data for each test of steel B were
plotted versus actual cooling temperature. Therefore, for
each cooling rate, there are at least two sets of data based
on two starting grain sizes. Five cooling rates were chosen
to examine the relative position of CCT diagrams for steels
A and C with respect to steel B.
Transformation start and finish temperatures were
determined by drawing tangents to C-strain versus
temperature curves. An excellent guide to this practice is
given by Eldis (111). The times and temperatures which
correspond to 25%, 50% and 75% transformation of austenite
were also measured graphically using the dilatometric graphs
(Figure 2.10).

T-4223 77
0.15
2X-50C/s
0.12
z 0.09R
I-
(0.06. ~~~finish •,
0.03
start0 2•. . . . I
0 200 400 600 800 1000
TEMPERATURE (°C)
Figure 2.10 Graphical measurements of the 25, 50 and 75percent transformation temperatures.

T-4223 78
According to Eldis's studies (111), the uncertainties
in the transformation start and finish temperatures recorded
for any cooling curve are as much as + 50C and ± 35 0C,
respectively. The high uncertainty number for the finish
temperature has been observed when there is a marked
curvature in the C-strain versus temperature data.
Following each test, a diamond saw was used to cut each
sample from the middle of the dilatometry sample (as close
to the isothermal plane as possible.) After mounting and
polishing, the small samples were examined
microstructurally, and microhardness was determined.
2.5 Microhardness Measurements
Diamond pyramid hardness (DPH) measurements were
conducted according to ASTM specification E92-82 (119) on a
Leco microhardness tester (model M-400A). A 500-gram load
was used throughout the tests. The average of at least ten
measurements is given as the overall hardness of each
specimen. These values (Vickers hardness numbers (VHN))
were plotted versus log (At8-5) to produce a hardness
profile.

T-4223 79
0 2.6 Microstructural Characterization using SEM and TEM
In addition to optical microscopy, scanning electron
microscopy (SEM) was performed with a JEOL JXA 840 electron
probe micro-analyzer. Samples were coated with gold to 300
pm thickness to reduce the charging effect.
0 Transmission electron microscopy (TEM) was performed
using a PHILIPS EM400. Three specimens for examination by
TEM were sliced from the middle of each Gleeble sample to a
thickness of 0.20 to 0.40 mm using a Buehler Isomet saw, as
shown in Figure 2.11.
Thmocouple Rane
* L M RFigure 2.11 Positions of the wafers cut for TEM studies
relative to the position of the thermocouple(L: left, M: middle, R: right).
Some wafers from the as-received steel B were also cut
to be examined by TEM. The above specimens were then
mechanically thinned on 600 grit silicon carbide paper to
about 0.2 mm. Three-mm discs were punched except for the
samples with 3-mm reduced section. These discs were thinned
0• mm

T-4223 80
* mechanically by the same technique as before to
approximately 0.06 mm. Care was taken during the mechanical
cutting and thinning processes in order not to induce heat
* or deformation into the specimens.
A Fischione twin-jet electropolisher was used for
further thinning of the foils. Two different solutions were
* used in order to get the best results. The first solution
consisted of 95 volume percent acetic acid and 5 volume
percent perchloric acid. The discs were thinned to
* perforation at room temperature with 80 volts and 80
milliamperes. Microscopy was performed at an accelerating
voltage of 120 kV. Bright field (BF) and centered dark-
field (CDF) imaging techniques were empltqed in addition to
the generation and analysis of selected-area diffraction
patterns (SADPs). The quality of foils was fair.
A second solution was used which consisted of 70 volume
percent ethanol, 25 volume percent glycerol and 5 volume
percent perchloric acid. This solution improved the quality
of the foils slightly.
2.7 Tensile Testing
Six blanks from each steel were cut with a band saw and
heat treated prior to machining (Figure 2.12). Heat
"0.* mm m
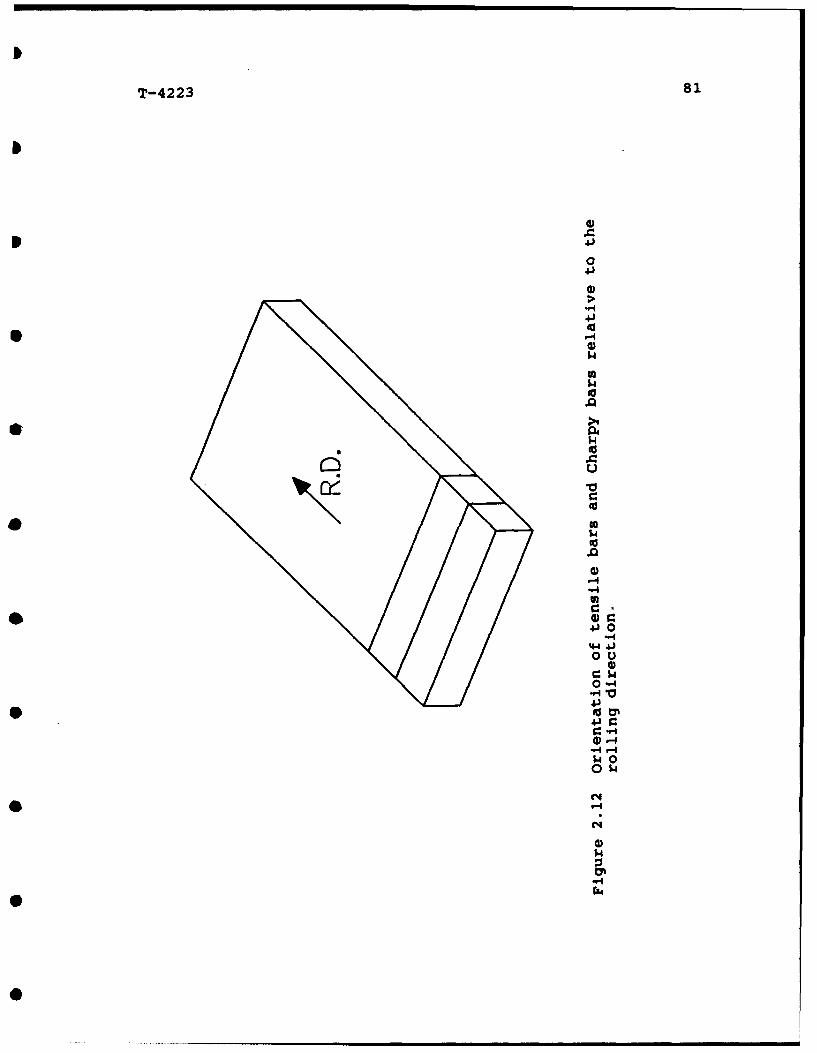
I
T-4223 81
Io
41
0
to
-4
W
$)
4)
4)0.,-
.r4
•o
0 -
41
.4
C-H
w0*~ 02
'.4
4)'-4

I I I
T-4223 82
* treating was conducted in a muffle furnace at 905*C for
steels B and C, and at 9200C for steel A. The austenitizing
time was five minutes for each sample. Three samples from
P each steel were air cooled after five minutes of heat
treating, and they are designated as 1X. The remaining
three samples from each steel underwent two rounds of
- austenitizing, of which the first round was followed by
water quenching and the second round by air cooling. These
samples were designated as 2X. To maintain a 10C/sec
cooling rate, each sample was placed between two plates to
simulate a total thickness of one inch.
In addition to the above samples, six extra blanks from
steel A were cut and underwent the same heat treatments as
well as 35 minutes tempering at 620 0C for each sample.
These samples were designated AT-iX and AT-2X. Off-centered
machining was conducted on all of the specimens to avoid the
segregation line. Standard, round-bar tensile specimens
were machined to ASTM specification E8-82 (120).
Tests were performed on an Instron screw machine located at
the Colorado School of Mines. Cross-head
velocity was set at 0.02 mm/sec (0.05 in/mmn). A 25.4 -m (1
inch) extensometer was used to measure displacement. Load-
displacement data were plotted directly on a strip-chart
recorder. This chart was used to determine the 0.2% offset
P. . m | |

T-4223 83
* yield point and ultimate tensile strength (120,121). In
addition to the strip chart recorder, load-displacement-time
data were collected on a Compaq 386-SX PC which is equipped
* with a Labtech Notebook software.
2.8 Charpy Impact Testing
S
Charpy V-notch specimens were machined according to
ASTM specification E23-82 (122) after being heat treated.
Blanks were cut from each steel as shown in Figure 2.12.
These samples were then heat treated as explained for
tensile specimens and were designated IX and 2X, depending
on the number of reaustenitizing treatments. Extra
specimens from steel A were tempered for 35 minutes at 6200C
after the aforementioned heat treatings and designated as
AT-IX and AT-2X.
The heat-treated specimens were then machined in
transverse orientation, with the notch perpendicular to the
rolling plane (the T-L orientation). In this way, the crack
will propagate in the rolling direction during testing.
For Charpy V-notch testing, temperatures higher than
room temperature were achieved in a hot oil bath, while
temperatures below 00C were obtained with a mixture of
ethanol and liquid nitrogen. Ice water was used for tests
S l
T-4223 84
at 00 C. Specimens were held at the test temperatures for a
minimum of seven minutes and were broken within three
seconds after being taken from the bath. The absorbed
P energy on impact was directly read from the Charpy impact
machine dial. Samples were then preserved for further study
by spraying lubricant on the broken surfaces.
* To determine the ductile-to-brittle transition, CVN energy
data were plotted versus test temperatures.
* 2.9 Fractography
Fractography was performed on six samples from steel B.
Three samples from 1X condition and three samples from 2X
condition were each chosen from the upper shelf (100 0 C test
temperature), transition region (room temperature) and lower
shelf (liquid nitrogen temperature). A JEOL JXA-840 scanning
electron microscope (SEM) was used. Pictures were taken at
three different magnifications of 500X, 1000X and 2000X from
each sample.
-- aI mma

T-4223 85
3.0 RESULTS AND DISCUSSION
3.1 As-Received Plates
The chemical compositions, general microstructures,
inclusion contents and hardness values of all the as-
received steels are presented in this section. Chemistries
of the three as-received steels are reported in Taole 3.1.
For each steel, no variation in chemical compositions was
observed (considering the size of the probe) through the
width of the plate.
All of the three steels exhibited very large,
unrecrystallized prior austenite grains at the plate edges.
These grains were limited to regions of about two
centimeters from the edges, and these regions were avoided
in further studies. Segregation in the form of wide, white
(difficult-to-etch regions) bands was present, to some
extent, at the centerline of all steels. The effect was
most pronounced in steel C, which has the highest manganese
content. This phenomenon was probably due to manganese
and/or molybdenum and nickel segregation. Off-centered
cuttings were designed, when it was necessary, to avoid the
segregation bands.
Light microscopy and SEM were used to determine the
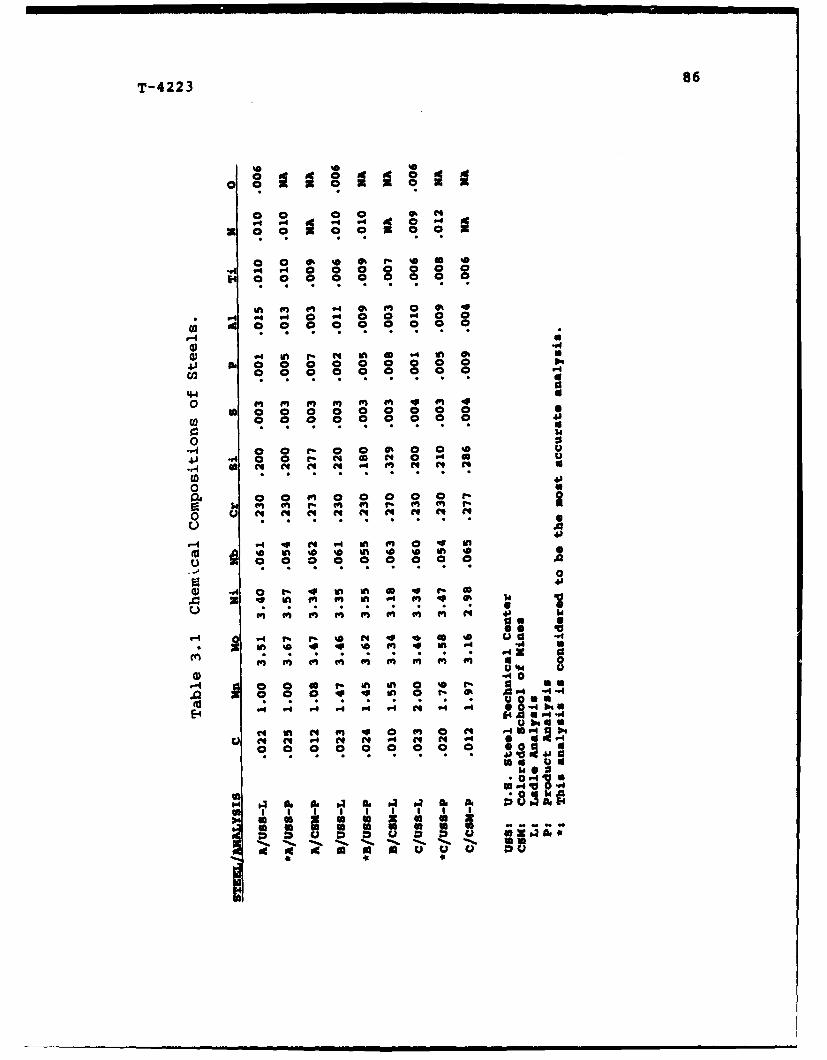
T-4223 86
0 0 0 0 0 N
0 0 a ?- '0 0"0. 0 0000oo00o
In 0 0 a4 0 0 0 0
V2 00 00 00a0 00
0 .0 04 In ?- N 0 '4 an 0
01 000 0 0 0 10-A* 0 4 c * 0 .
EO. . . . . .
0
4 *.4 0 p 0 4 %-I N n in a 0 inSN n N % in %a % N n N %No
C..)
-A m N 4 in a 0 r. aXA V in t" m0 in '0 '0 I '
00 0 0 000 cc. A
g 4
00. 0 f% 4 In I 0 o 1. 0
0. 6
At X 4 ow

T-4223 87
morphology, distribution, relative number density and
chemistry of numerous inclusions in all three steels.
In general, all three steels contained three types of
inclusions: rectangular or square inclusions (which will be
referred to as type I), round or oval inclusions (type II)
and irregularly shaped, angular inclusions (type III).
All three steels exhibited large numbers of types I and II
inclusions. The relative numbers of type III inclusions
increased dramatically in going from steel A to steel B to
steel C.
Energy-dispersive-spectroscopy (EDS) analysis in the
SEM showed that the type I inclusions contained high
titanium levels. These could be titanium nitrides formed
during solidification. Type II inclusions showed high
manganese and sulfur levels, with some aluminum or silicon.
These inclusions are manganese sulfides, with the aluminum
probably present in the form of a small region of Al 20 3, and
silicon as SiO2. As shown in Figure 2.2, these observations
were made from transverse sections, and that explains why
these inclusions are not described as stringers (the
elongation of MnS is obscured in this section). The type
III inclusions were apparently clusters of type I and type
II inclusions. Figure 3.1 shows a light micrograph and two
SEM micrographs, which are representative of the observed
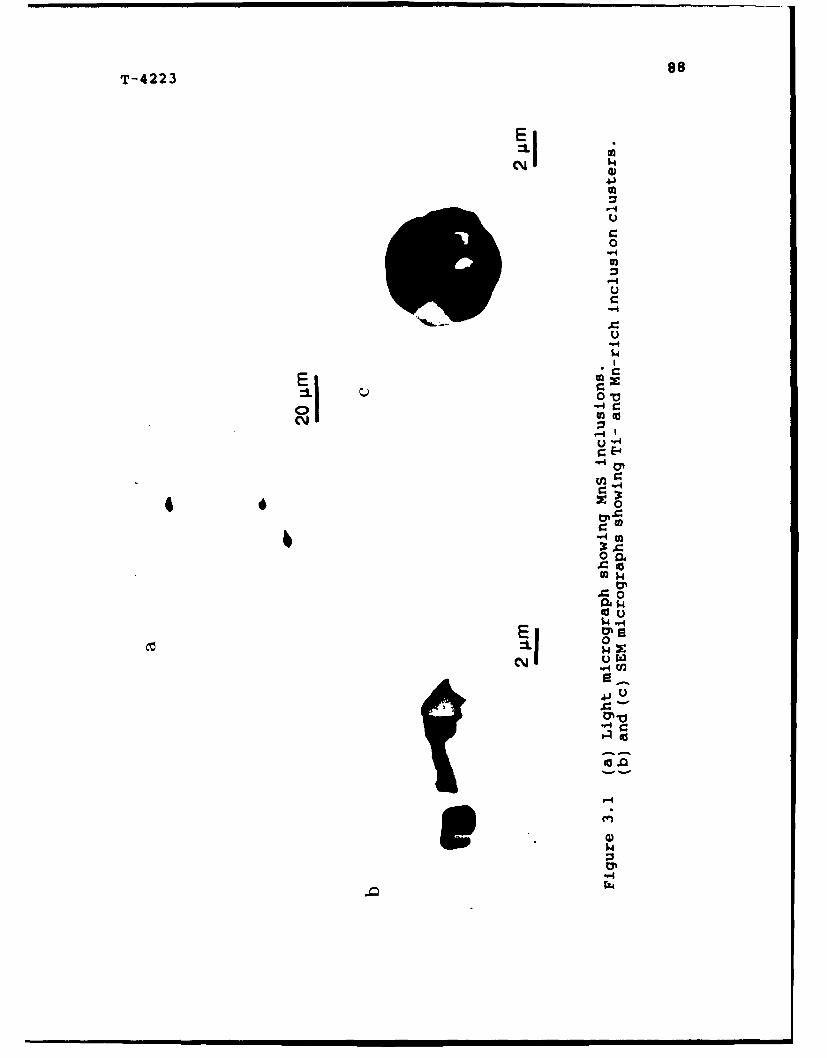
T-4223 Be
El04
-4U
o
-,4
0
ON0
C
4 -4U
-4
-w•
0'3u!1 °°4• o.
ci•
.,-4
9.. 0'.
• i n HiIN I l IN I i I II I I4

T-4223 89
inclusions. The EDS analysis of manganese- and titanium-
rich inclusions -re shown in Figure 3.2.
Table 3.2 shows the as-received hardness values of the three
steels. The hardness increases by two HRC for each 0.5 wt.
p,,t. increase in manganese content. This trend could be
Table 3.2 Hardness of the as-received steels.
STEEL HRC
A 30
B 32
C 34
explained by the role of mangenese as an austenite
stabilizer. By increasing the amount of mangenese in steel,
the austenite to ferrite transformation temperature as well
as the M. temperature will decrease, which, in turn,
promotes smaller ferrite crystals, finer packet sizes, more
martensite and higher dislocation density. One or more of
these features are responsible for increasing strength and
hardness.
Figure 3.3 shows the microstructures of the as-received
steels A, B and C. At this magnification, the bainite-like

T-4223 90
... ..... ......
m F
- -AT 1 -*~~. .. .. . ....F . .... .
.. ... .... .... ...
I-T.
---------
Figure 3.2 Representative of EDS spectra for inclusions insteels A, B and C.

T-4223 91
'o"
"6 A
C iki'* ~le
S..;10-
i Xx 1x~ ItA
b ~ __ r5j
,,~ ~ %
~ to
~ ~'~"M
Figure 3.3 The as-received microstructures of (a) steel A,
(b) steel B and (c) steel C. Light micrographs.
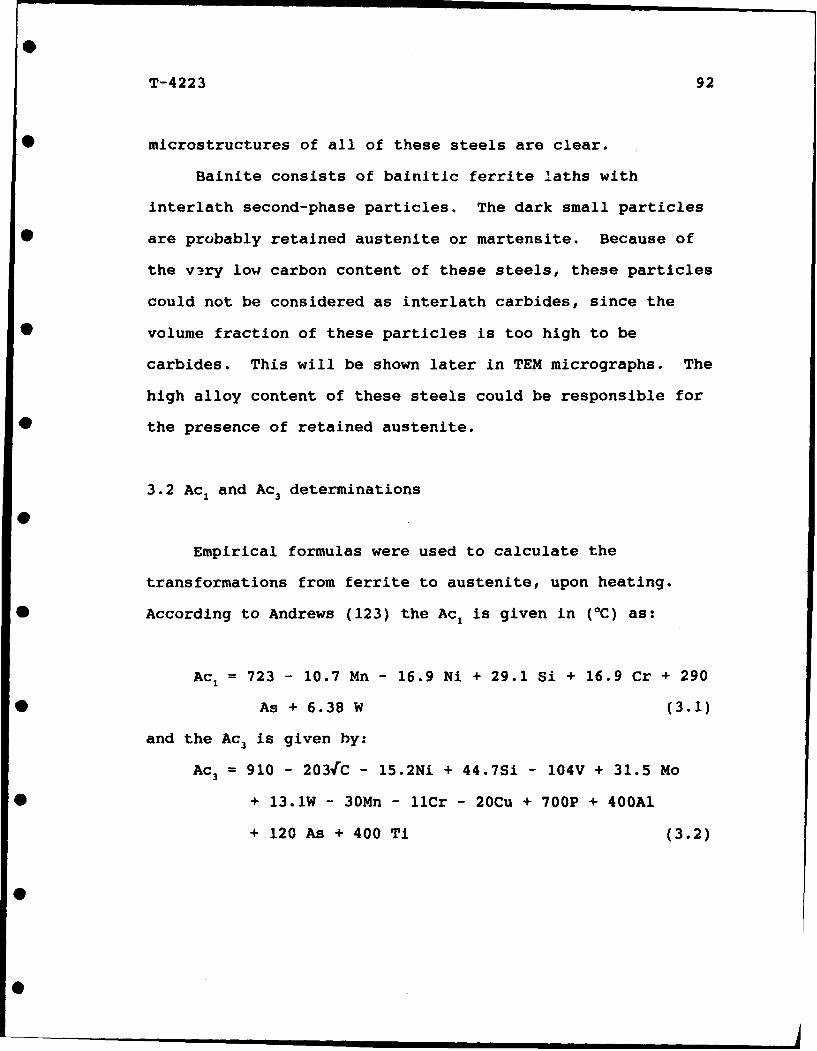
T-4223 92
* microstructures of all of these steels are clear.
Bainite consists of bainitic ferrite laths with
interlath second-phase particles. The dark small particles
* are probably retained austenite or martensite. Because of
the very low carbon content of these steels, these particles
could not be considered as interlath carbides, since the
* volume fraction of these particles is too high to be
carbides. This will be shown later in TEM micrographs. The
high alloy content of these steels could be responsible for
* the presence of retained austenite.
3.2 Aci and Ac 3 determinations
Empirical formulas were used to calculate the
transformations from ferrite to austenite, upon heating.
* According to Andrews (123) the Ac1 is given in (0C) as:
Ac1 = 723 - 10.7 Mn - 16.9 Ni + 29.1 Si + 16.9 Cr + 290
* As + 6.38 W (3.1)
and the Ac3 is given by:
Ac 3 = 910 - 2031C - 15.2Ni + 44.7Si - 104V + 31.5 Mo
* + 13.1W - 30Mn - 1lCr - 20Cu + 700P + 400Al
+ 120 As + 400 Ti (3.2)
0 I III•
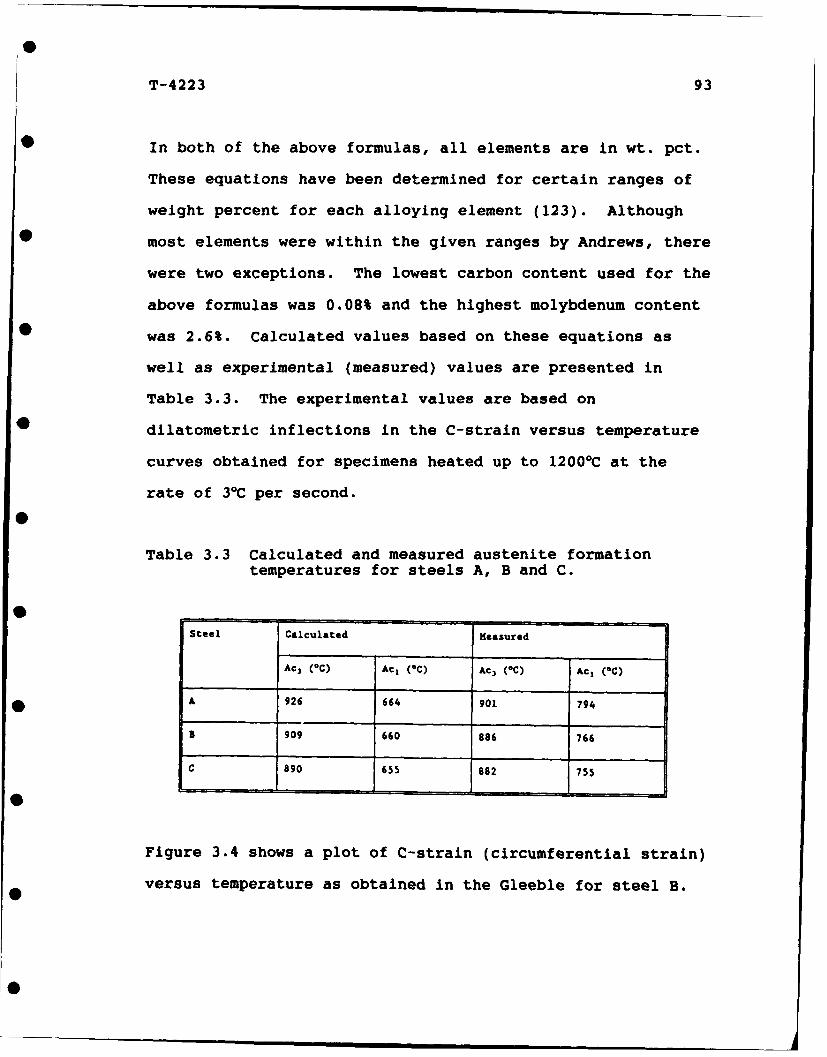
T-4223 93
* In both of the above formulas, all elements are in wt. pct.
These equations have been determined for certain ranges of
weight percent for each alloying element (123). Although
0 most elements were within the given ranges by Andrews, there
were two exceptions. The lowest carbon content used for the
above formulas was 0.08% and the highest molybdenum content
was 2.6%. Calculated values based on these equations as
well as experimental (measured) values are presented in
Table 3.3. The experimental values are based on
0 dilatometric inflections in the C-strain versus temperature
curves obtained for specimens heated up to 12000 C at the
rate of 30C per second.
Table 3.3 Calculated and measured austenite formationtemperatures for steels A, B and C.
Steel Ca1culated Measured
Ac3 ( 0C) Ac, (OC) Ac3 (C) Act (OC)
A 926 664 901 794
5 909 660 886 766
C 890 655 882 755
Figure 3.4 shows a plot of C-strain (circumferential strain)
versus temperature as obtained in the Gleeble for steel B.
0. I I |

0 T-4223 94
41
0
0 41
o ,4J
00
NO
E-4
00 0
** u , jL uI, l . *j I SI ,l*S ,|j . I.i , * .l 1,* O4..O
00
14
o* o0 •
v
00-l0
d 4o
NIVNIIS-0 ..4
t •to
CD
oww
4
S| | ii | •m •ml •• Uim i

T-4223 95
The arrowed inflection points clearly define the start of
austenite formation at low temperatures and the completion
of austenite formation at high temperatures.
A comparison between calculated and measured critical
transformation temperatures for all of the three steels
shows inconsistency, especially for the lower critical
temperatures. These are due to the lack of molybdenum term
in the formula used to calculate the Aci temperature, and
the slight difference in the range of compositions for
carbon and molybdenum. For comparison, Colvin (20) reported
Aci and Ac 3 temperatures of 6900C and 8600C, respectively,
for a modified A710 steel with 1.45% manganese.
3.3 Prior Austenite Grain Size
A grain size study was initiated to determine what
range of austenite grain sizes could be developed in the
present set of alloys. The aim was to produce about 10 to
15 pm grain size, similar to Colvin's work. An
austenitizing temperature of 9050C was chosen (except for
steel A which was 9200C). The first component of the grain
size study showed that grain size did not change much with
time, up to a one-hour austenitizing time. Hence five
minutes holding time was chosen for the rest of study. The
T-4223 96
* results of these studies are presented in Table 3.4. The
first stage of the study showed that grain sizes are mostly
about 30 pm, except for steel A after a 60 minutes holding
* period. This specimen was accompanied by an abnormal grain
coarsening phenomenon. This stage also showed that these
grain sizes are about two to three times larger than
* desired.
A great number of heat treatments were examined in an
attempt to create a 10 to 15 pm grain size. Despite many
• processing variations, two extremes were typically observed.
Specimens which were reaustenitized once and quenched,
usually had a grain size close to about 30 pm. Specimens
* which were reaustenitized twice and quenched after each
treatment had grain sizes of about 7 pm and less. Figure
3.5 demonstrates some representative micrographs of these
• studies. Because of the above results, it was decided to
examine both fine-grained and coarse-grained material
throughout the rest of study.
3.4 Transformation Ninetics
• Although most of this study was based on steel B with
1.5% manganese, it was decided later to choose four cooling
rates to examine the relative positions of the CCT diagrams
0 m m | s m

0
T-4223 97
Table 3.4 Austenite grain sizes for various austenitizingtimes.
Steel Heat Treating Tine (miin) Grain Diameter (is)
A 0.5 27.3
• A 2 29.7
A 5 29.2
A 15 33.7
A 30 37.8
A 60 67.5
B 0.5 33.7
2 33.7
5 34.8
3 15 33.7
3 30 33.7
3 60 38.2
c 0.5 30.3
C 2 31.4
c 5 33.7
c 15 34.8
C 30 33.7
C 60 38.2

T-4223 98
9.A
',. / *~* Ad
20 gm-
Figure'*1 3. (a ro useiegai ie(bot3/m
aftr nereusentiinqtraten fllwe b
quenhing (b Prior autniegri sz(aou 7pm ate to eastniizn
tramet folwdb qecig

O
T-4223 99
* for steels A and C. This section presents the results of
these studies.
* 3.4.1 Dilatation Curves
A typical dilatation curve for steel B is shown in
* Figure 3.6. C-strain is plotted versus temperature for
cooling of typical samples. For the 2X condition, these
data are for cooling after the second austenizing treatment.
* Austenite transformation start and finish temperatures were
determined by inflections in the C-strain versus temperature
curve. The well-defined austenite transformation start and
* finish temperatures observed for all of the dilatation
curves is an indication of significant transformation of the
parent austenite phase. The change in C-strain at the start
point is abrupt, but slows down by decreasing the
temperature. This indicates that most of the transformation
occurs closer to the start points (also see the CCT
diagrams).
There is no significant difference between the
dilatation curves for the specimens examined at slow and
fast cooling rates. In addition, the dilatation curves for
all of the three steels are similar.
S. ..Sm m | |

I
T-4223 100
I
0.15 .... .. * . .If ..... .. .rI u..., , ..
2X-50OC/s
0.12
S
z 0.09
I-U,
-- •" 0.06
f inish
0.03
Sstart0 I l I If i n e II ' 1 ,1- 1 11. 1 fi 1 jIi!t l 11 1 !I 1| a .. II
0 200 400 600 800 1000TEMPERATURE (0 C)
Figure 3.6 Plot of C-Strain versus temperature for a samplereaustenitized twice followed by cooling at 50°C/safter the second austenitizing treatment.
Smmm••i

T-4223 101
3.4.2 Continuous Cooling Transformation Diagrams
The results of 15 tests for each condition (IX and 2X)
are plotted versus log time in order to outline the general
form of the CCT diagrams. Figure 3.7 shows the CCT diagram
for steel B. As was expected, the 2X condition (finer grain
size) exhibits higher transformation start and finish
temperatures. The CCT curves are consistent with several
other studies (20,35,36,62) in that there is a broad, flat-
topped transformation region typical of bainitic steels.
In contrast to some of the aforementioned studies (20),
there is no indication of high-temperature transformation
products (polygonal ferrite). This could be due to the high
molybdenum content of the present steels. The presence of
molybdenum and other strong carbide formers lead to a solute
drag like effect (SDLE) (90-91) which has been discussed
before. All the transformation start temperatures are about
the same for all cooling rates, with slight variations which
could be attributed to experimental errors.
The 25, 50 and 75 percent transformation temperatures
for the 1X and 2X conditions are shown in Figure 3.8a and
3.8b, respectively.
As these figures show, the lines representing the 25%, 50%
and 75% transformation are much closer to the transformation
Im | l|

T-4223 102
0., 0
C-4
C14
gvn -
$4
C44
0%
E-.4Cu
IWI
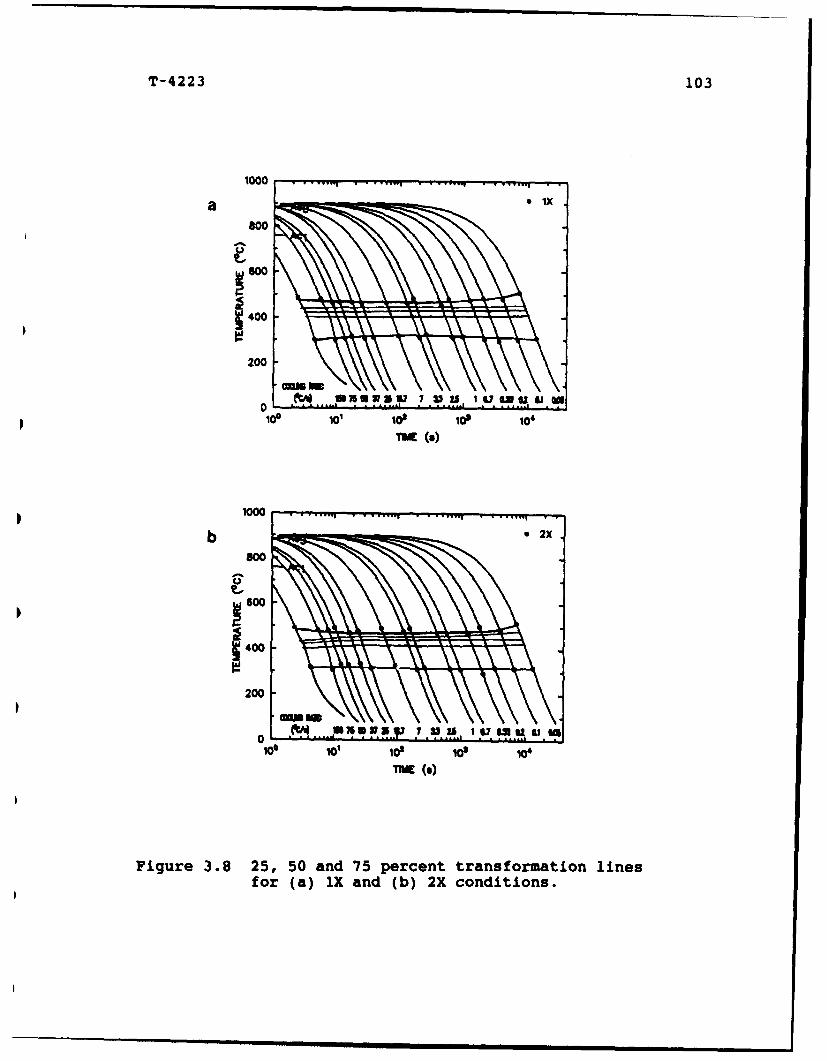
T-4223 103
1000 . . ........ ........
a•IX800
I:0200
106 101 10i 10, 10'
i (3)
1000
~600
~400
200
104 101 102 10 10'
Figure 3.8 25, 50 and 75 percent transformation linesfor (a) iX and (b) 2X conditions.
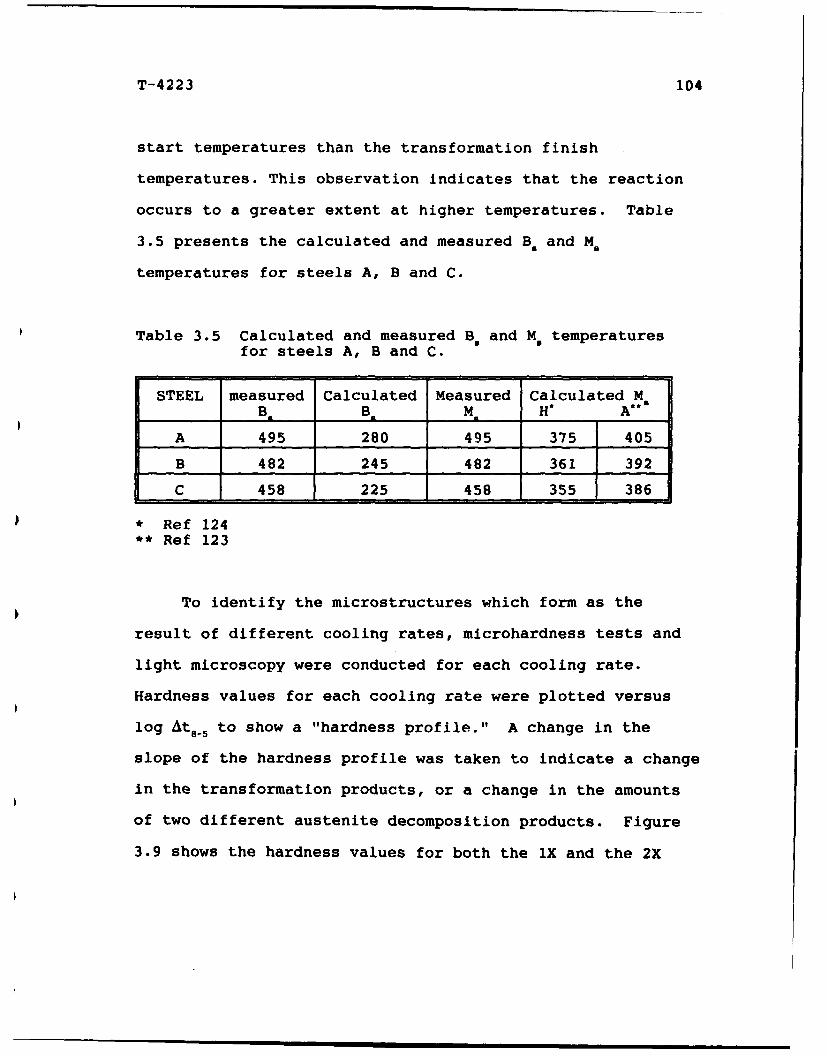
T-4223 104
start temperatures than the transformation finish
temperatures. This observation indicates that the reaction
occurs to a greater extent at higher temperatures. Table
3.5 presents the calculated and measured B. and M,
temperatures for steels A, B and C.
Table 3.5 Calculated and measured B. and M. temperaturesfor steels A, B and C.
STEEL measured Calculated Measured Calculated MB B M H* A"*
A 495 280 495 375 405
B 482 245 482 361 392
C 458 225 458 355 386
* Ref 124** Ref 123
To identify the microstructures which form as the
result of different cooling rates, microhardness tests and
light microscopy were conducted for each cooling rate.
Hardness values for each cooling rate were plotted versus
log At 8- to show a "hardness profile." A change in the
slope of the hardness profile was taken to indicate a change
in the transformation products, or a change in the amounts
of two different austenite decomposition products. Figure
3.9 shows the hardness values for both the 1X and the 2X

00T-4223 10
00
0X 0
00
0.0*0c 0
o 0
* 0 U 0
Oo U~C
to00
ow
0~ r--4 Lcr)~~~ 0oc) NNHo (4

T-4223 106
* conditions for steel B. Although at slower cooling rates
the hardness values of both the lX and 2X conditions seem to
be similar, with increasing cooling rates these values are
* consistently higher for the 1X conditions than those of the
2Xs. The lower hardness of the 2X condition in the
martensite region may be related to percipitate formation
• and coarsening.
Four cooling rates out of each condition were chosen
for more detailed studies. These cooling rates are 0.1,
* 3.3, 25 and 150 0C/s. What follows is a discussion of the
microstructures produced as a result of these cooling rates,
accompanied by the as-received microstructures of the steels
* under investigation.
3.5 Microstructural Characterization
Figure 3.10 shows a light micrograph of the structure
generated as part of the Ac1-Ac3 study, where the specimen
• was heated up to 1200 0C and then cooled to room
temperature. The measured cooling rate was 50OC/s. This
microstructure strongly resembles the martensitic
• microstructures observed by other investigators
(98,106,107,109) in low-carbon steels. The coarse prior
austenite grain size (about 50-100 pm), which corresponds to

T-4223 107
h*
.1
%V r, l-~ ~'~' ~4'\ oX
02 pm
Figure 3.10 Martensitic microstructure of steel B afteraustenitization at 12000C followed by
* quenching.

T-4223 108
*O the high austenitizing temperature, provides excellent
martensite hardenability compared with the finer grain sizes
examined in the rest of study. Therefore this
*microstructure provides an excellent basis for comparison.
It was mentioned before that of etching these steels is
very difficult. The similar orientation of martensitic
i* laths within a prior austenite grain may be responsible for
this difficulty. It should be mentioned here that prior
austenite grain size, as well as cooling rate, had a
* noticeable effect on the etching behavior of these steels.
In contrast to the microstructure shown in Figure 3.10,
recall the as-received microstructure (Figure 3.3). These
* microstructures seem to be very different from the
martensitic structure in Figure 3.10. Etching of these as-
received steels was relatively easy. In Figure 3.3, the
* thick, dark linear features are prior austenite grain
boundaries and packet boundaries, while the small dark
regions (arrowed) are islands of austenite and/or
* martensite. The size of these small islands ranges from
about 1 to 2 pm, for larger blocky islands, to about 0.2-0.4
pm, for small islands. The bright areas are crystals and/or
* packets of acicular ferrite. These features are consistent
with those observed in thin foils. Figure 3.11 shows a
representative feature of the as-received microstructure in
0
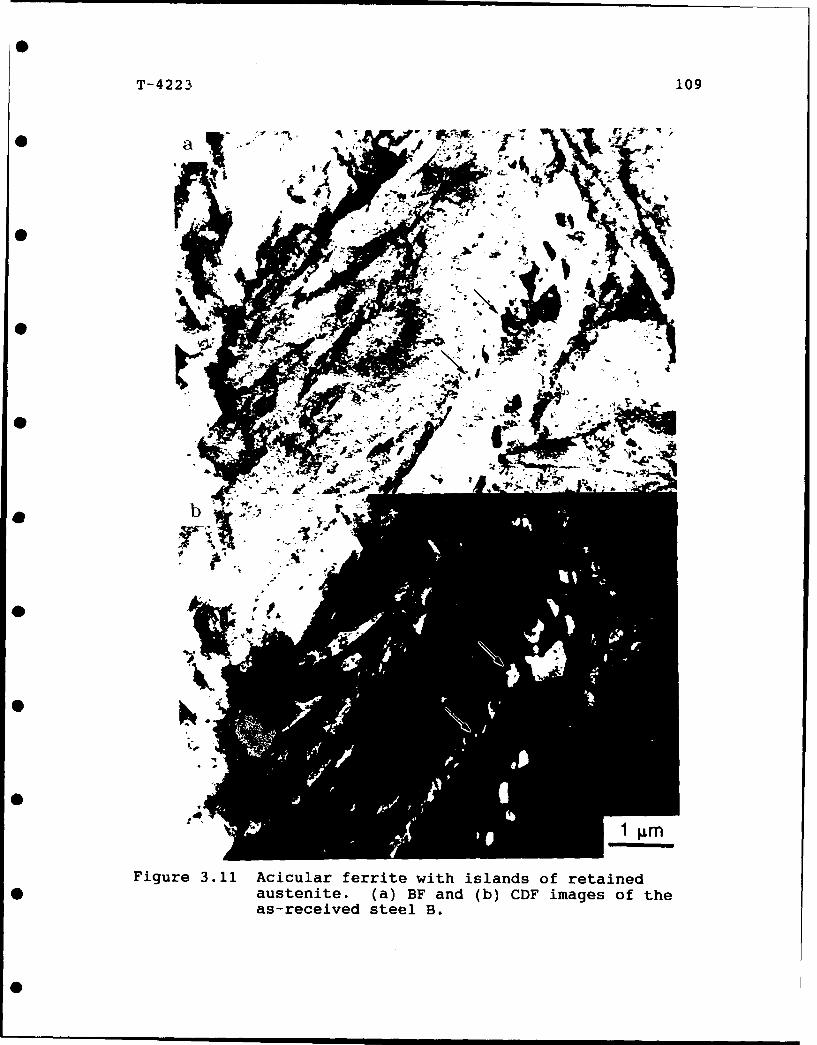
T- 4223 109
0~~' a1 16 ? Lt Fq~
q AmFigure ~ ~ ~ ~ ~~A 3.1 Aiu ert ithilnsofrtie
Sutnie (a Fad()S mgso hasreeie stee B.

T-4223 110
* steel B. The small dark regions in the bright-field image
(BF) are martensite-austenite islands (M-A constituent).
These islands of retained austenite/martensite are aligned
* at both prior austenite grain boundaries and at interlath
boundaries. The direction and alignment of these
constituents indicates the acicular nature of this
* structure. Acicularity is more evident in the centered-
dark-field (CDF) image of the same area in Figure 3.11. The
diffraction pattern (DP) corresponding with this pair is
* shown in Figure 3.12, and the CDF image was produced with an
austenite reflection. Notice the size of these islands,
which are the same as those shown in light micrographs.
* The acicular nature of the as-received steel B is more
evident in Figure 3.13. The average lath width measured is
about 0.8 pm. An interesting features in these images is
* the jagged edges (arrowed) of a lath in this structure.
There are two possible explanations for this feature.
The first explanation that comes to the mind is that these
* jagged edges could be "bainitic" subunits. The repeated
nucleation and growth model proposed by Oblak and Hehemann
(31) suggests that the formation of bainite involves
repeated nucleation of substructural units. A schematic
presentation of this mechanism is shown in Figure 3.13c.
The dark regions between light areas appear to be regions of
I0 .

T-4223 111
Figure 3.12 SADP corresponding to the region shown inFigure 3.11.

T-4223 112
lt. (a BFan ()CD iags
S
SI
1 pm
Figure 3.13 The as-received steel B showing acicular* ferrite structure and the jagged edges of a
lath. (a) BF and (b) CDF images.
"Sa II II I

T-4223 113
a..
Figure 3.13c Schematic illustration of structures producedby repeated nucleation of subunits, whichrapidly attain a limiting size (31).
high-carbon martensite and/or austenite entrapped between
* these subunits. The reason for retention of some
untransformed austenite adjacent to ferrite laths is the
enrichment of these regions with carbon as a consequence of
transformation. Therefore, the formation of ferrite becomes
progressively more difficult. It has been shown that the
existence of M-A constituents depends on the cooling rate
and the composition of steel (125). Coldren et al.
suggested that rapid cooling tends to prevent the formation
of M-A islands. At slower cooling rates, there is more time
for diffusion of carbon and consequently more M-A islands
are present (126).
A second possibility for the unusual image of Figure

T-4223 114
* 3.13 is related to sectioning effects. These jagged edges
could be the intersections of different laths. It is very
likely that a combination of the two explanations is
* responsible for this phenomenon.
More evidence of retained austenite regions in the as-
received steel is shown in Figures 3.14 and 3.15. These
• observations strongly dispute the conclusion made by DeArdo
and co-workers (125) that these very low carbon steels lack
the M-A constituent. DeArdo et al. showed no direct
* evidence to prove this conclusion. In fact, the presence of
retained austenite at room temperature, considering the high
transformation temperature of these steels (about 500 0C),
* could be because the high strength of austenite does not
allow the shear transformation to martensite to happen.
Figure 3.3 and Figures 3.10 through 3.15 show that
* distinct microstructural types are produced in steel B.
These figures provide a basis for comparison for the
remainder of the Gleeble work. Figure 3.16 shows
* representative light micrographs of steel B in the 1X and 2X
conditions followed by cooling at 150 0C/s. There are almost
no similarities between these microstructures and what was
* shown in Figure 3.3 for the as-received steels. Unlike the
as-received samples, these microstructures were very
resistant to etching. Although the prior austenite grain
0

T-4223 115
••7
Figure 3.14 M~icrostructure of: the as-rece~ived steel B3.Not'ice the b'lack M-A is'lands.
T
1 4

T-4223 116
0!
Figure 3.15 Austenite centered-dark-field Image of the sameregion shown in Figure 3.14.
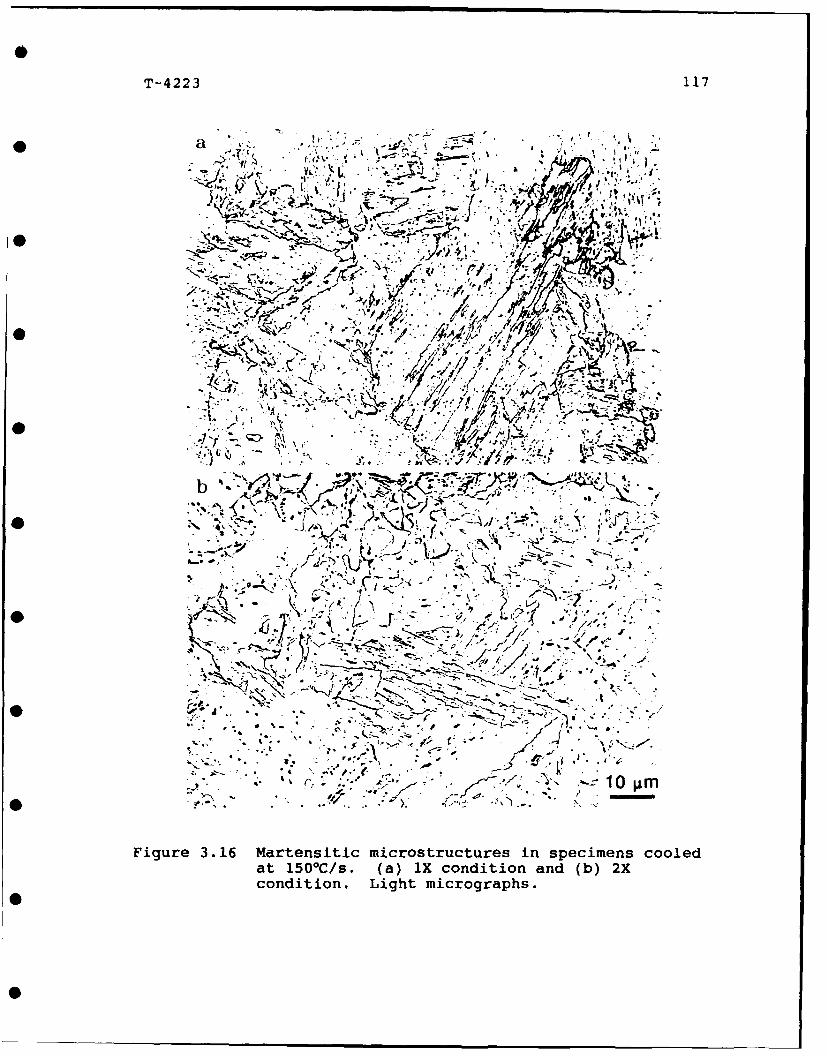
T-4223 117
It,
Z?.4
-z ef~.J ri r
~,jr 0
Fiue31 Ma nitic mirosrcue in spcien coleat -150 s (afXiodiin'nv()2
condtion Ligt mirogrphs

T-4223 118
* boundaries are not evident, the martensitic structure in
Figure 3.16 is similar to what is shown in Figure 3.10.
There is no strong evidence of retained austenite,
* especially in the 1X condition (Figure 3.16a). In other
words, small, dark islands are mostly absent. The elongated
ferrite packets resemble the blocky martensitic nature of
* the micrograph shown in Figure 3.10.
Figures 3.17 and 3.18 represent different regions of
the thin foils examined for this cooling rate. These
* structures exhibit the fine lath structure typical of low-
carbon martensite. The lath structure of martensite is much
more evident in these micrographs. It is noteworthy that
* there was no evidence of retained austenite regiona, as in
the as-received structure, despite an extensive search.
While this result is consistent with the light micrographs
* in Figure 3.16, other researchers (127) have reported thin
films, and not equiaxed islands, in martensite. Still, no
thin films of retained austenite were observed either. The
* average lath width for this cooling rate is about 0.2 pm for
the IX and the 2X conditions. A comparison between the lath
width of the as-received steels and the specimens cooled at
* 1500C/s shows at least four times bigger lath size for the
as-received condition. This is consistent with the previous
observations indicating that the lath size decreases with an
0
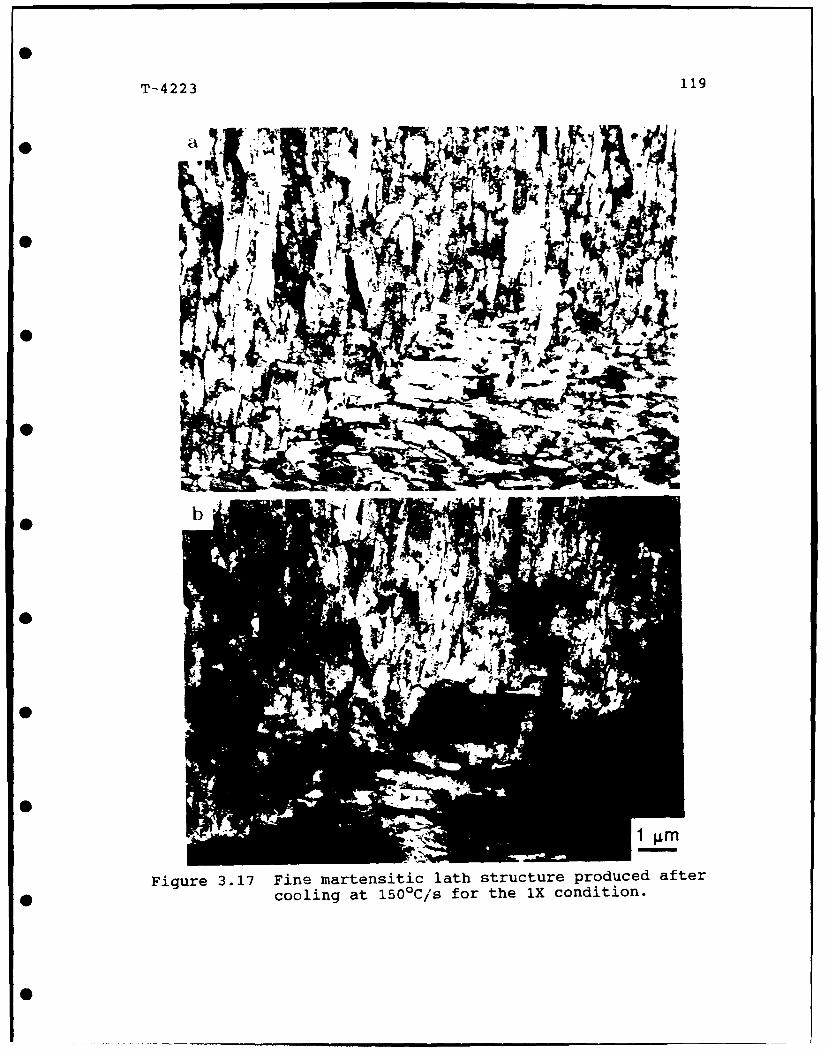
T-4223 119
aj
~ '
1 m
Figure 3.17 Fine martensitic lath structure produced after
* cooling at 1500C/s for the 1X condition.

T-4223 120
pr
0a
4t%
0w
fi
Figure 3.18 Fine martensitic lath structure produced after* cooling at 150OC/s for the 1X condition.
T-4223 121
* increased cooling rate.
A comparison between the etching and electropolishing
behaviors of the as-received structure and the specimens
* cooled at 150 0C/s indicates major differences between these
two structures. The as-received steels are much easier to
etch than specimens cooled at 150 0C/s and show better
• contrast in the light microscope. The strong etching effect
was evident in electrochemically polished foils examined in
the TEM as shown by Figure 3.14. In contrast, the
* martensitic specimens are not easy to etch, yet they
electropolish much more uniformly. These observations,
coupled with the existence of the upper plateau in the
hardness profile for fast cooling rates, are indicative of
differences in the mechanisms of austenite transformation
for the as-received steels (cooling rate of about 1C/s),
versus the Gleeble samples cooled at 1500C/s. Figure 3.19
strongly supports the martensitic reaction at these high
cooling rates. The presence of twinned martensite leaves no
doubt about the martensitic nature of these microstructures.
The presence of the spherical particles arrowed in
Figure 3.19 is probably a redeposition effect associated
with thin foil preparation during electropolishing. These
particles were not observed on surfaces of specimens from
the as-received condition. This indicates that the
0 |I I

T- 4223 122
010
0M
Fiue310wne atnit ntesml olda
b5*/,frte Xcniin
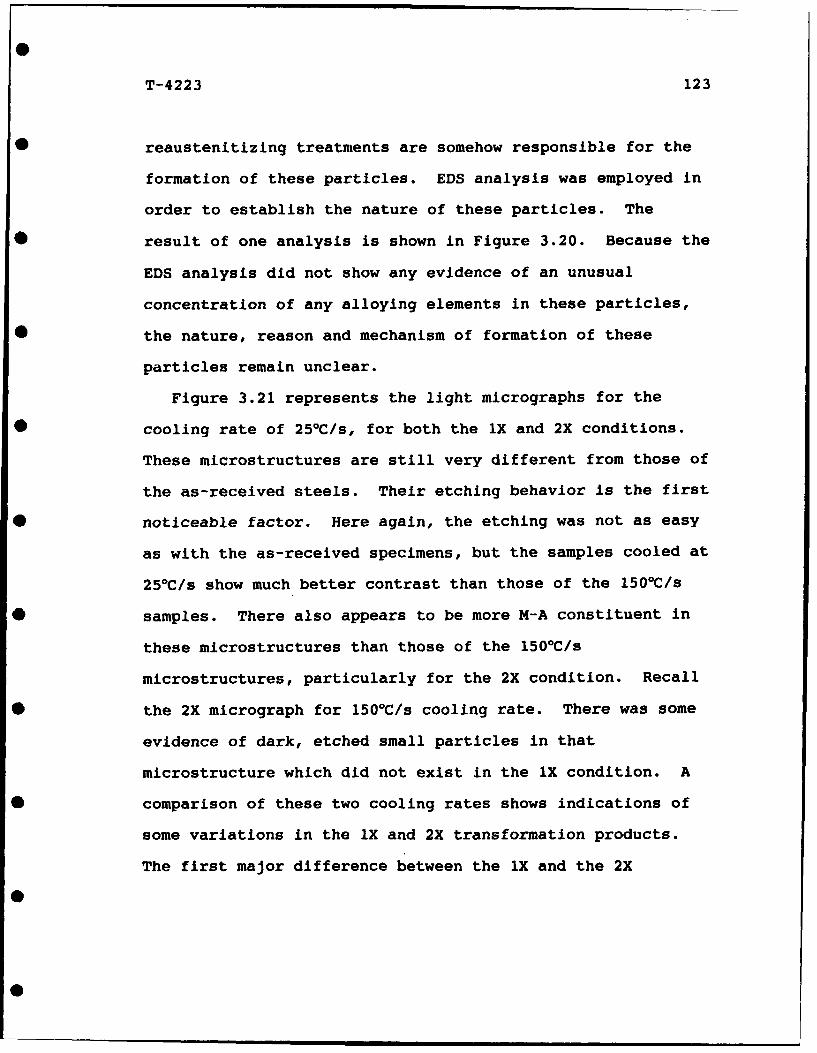
T-4223 123
* reaustenitizing treatments are somehow responsible for the
formation of these particles. EDS analysis was employed in
order to establish the nature of these particles. The
* result of one analysis is shown in Figure 3.20. Because the
EDS analysis did not show any evidence of an unusual
concentration of any alloying elements in these particles,
* the nature, reason and mechanism of formation of these
particles remain unclear.
Figure 3.21 represents the light micrographs for the
* cooling rate of 25 0C/s, for both the IX and 2X conditions.
These microstructures are still very different from those of
the as-received steels. Their etching behavior is the first
* noticeable factor. Here again, the etching was not as easy
as with the as-received specimens, but the samples cooled at
25 0C/s show much better contrast than those of the 150 0 C/s
samples. There also appears to be more M-A constituent in
these microstructures than those of the 150 0C/s
microstructures, particularly for the 2X condition. Recall
the 2X micrograph for 150 0C/s cooling rate. There was some
evidence of dark, etched small particles in that
microstructure which did not exist in the 1X condition. A
comparison of these two cooling rates shows indications of
some variations in the lX and 2X transformation products.
The first major difference between the lX and the 2X
"0- mm ||

T-4223 1240
P-4
0
E-4
S............... •..- .............. -.............. i-.............. -... .... ...... ..... ..... . .......... ..! ! • • i: i
.....,., . ... ....,................. •..............•............. .... .......... ... .. ......... : . :.. : .... a .
......... ....... ............ : ::::::::::::::" o. ..........
- ii ?Iiii.. iiiiiiii 0
0 I4J. -- ~'-!of* ... ... 0.
-~~ ............. U
k-=I
............................................................... : :::: ::: ::::::: ~ 0
* iiii~iiii :i~iiii~iil
. . . . . . . . . .. . . . . . .. . . . . . . . . . . . . .. ...... .. .... .I , .......
-A-•W .. ?A "-4
.. .... .......
~~~~~~~~~~~~~~~~~. ......... ............ .......... ...........................== ===== == = ===== = == =
0
S. ... ..... ... ... .. .. ...... .... ' .. .. .... .. ..... " .... .. ....... ... . ... ......... . •...... ....,,
k
* r34
0 .......

T- 4223 125
J-.
rV4V
NN - - -
- .. '%"]i _."
'4;~
Figure 3.21 Light micrograp fteseimn olda250C/s.~~~~~~~_W (aWXcniinad bXcniin
00ýL

T-4223 126
conditions is in prior austenite grain sizes. Coupled with
this difference, the 1X condition has a lower transformation
temperature and a higher hardness value. This is consistent
for all of the cooling rates. The double reaustenitizing
treatment (2X) could give rise to a more complex
transformation behavior which leads to these differences.
It is very likely that the 2X samples contain more acicular
ferrite and retained austenite than the 1X samples.
To get a better understanding of the transformation
behavior of these steels at cooling rate of 25 0C/s,
examination of TEM micrographs is essential. Figures 3.22
and 3.23 represent the lath structure of the 1X and 2X
conditions, respectively. A close look at these micrographs
shows that the M-A islands are present, but the relative
number density of these islands seems to be far less than
that of the as-received steels. This structure is concluded
to be acicular ferrite with M-A islands. In addition to
this feature, the average lath width is about 0.35 pm, which
shows about 0.15 pm increase compared to that of the 150 0 C/s
cooling rate.
Figure 3.24 shows a pair of BF and CDF images for the
lX condition. These micrographs compare favorably with
Figures 3.17 and 3.18, suggesting similar austenite
transformation behavior. The only apparent difference is in
0

T-4223 127
.- 41
-ve -t A -
0. pm
Fiur 3.2Mcotutr fspcmncoe t20/for th Xcniin
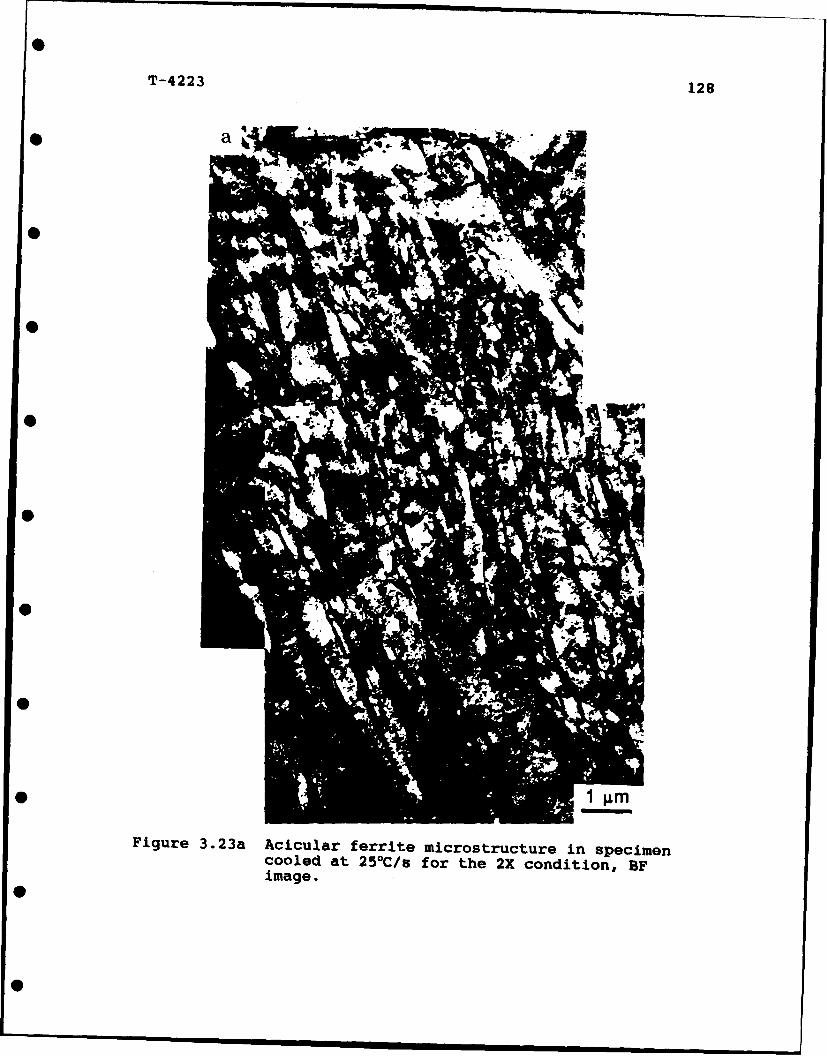
T-4223 128
Sa
Figure 3.23a Acicular ferrite microstructure in specimencooled at 250C/s for the 2X condition, BFimage.
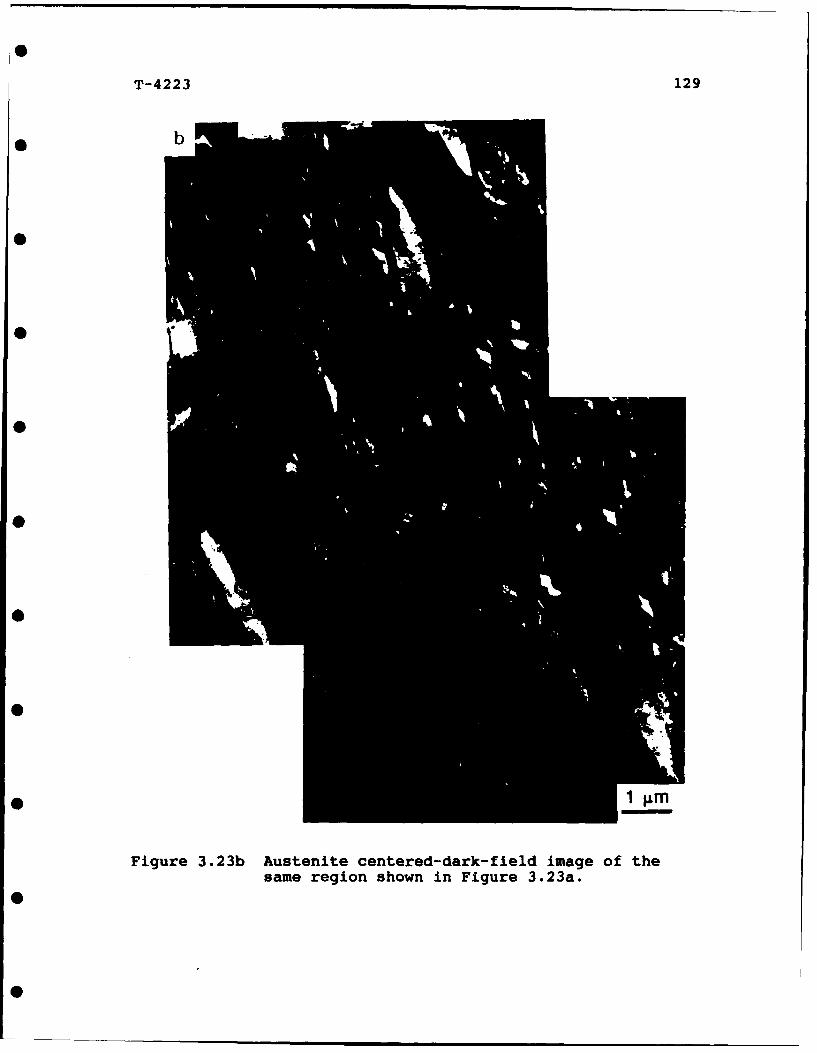
0
T-4223 129
Figure 3.23b Austenite centered-dark-field image of thesame region shown in Figure 3.23a.

T-4223 130
.
4*
0P
Figure 3.24a Martensitic microstructure in specimen cooledat 250C/s for the 1X condition, BF image.

i I I I I I II I I I I I i
T-4223 131
I.
I. III
i• I
i I •m
Figure 3.24b Martensite centered-dark-field image of thesame region shown in Figure 3,24a,
O
: ,, • . . i I II I I II I I I I I I I I I l

T-4223 132
* the lath width, which is related to the cooling rate. The
diffraction pattern related to these packets of martensite
shows two dominant orientations, Figure 3.25. The angle
* between these two packets of martensite is 31.50, which is a
high angle boundary.
Figure 3.26 shows a dark-field image of the
• precipitates present within foils of the 2X condition. The
origin and identity of these particles are uncertain.
A clnser examination of TEM micrographs for the 2X
* condition shows that, opposed to the 1X condition, there are
further differences between this treatment and the ones at
150 0C/s. Figure 3.27 shows a pair of BF-CDF images for the
* 2X condition at 25 0C/s cooling rate. The presence of M-A
islands at a density similar to what was observed in the as-
received steels is another indication that there is a
* transition in transformation mode in the vicinity of this
cooling rate, at least for the 2X condition. The presence
of the fine twinned martensite and interlath M-A islands in
• Figure 3.28 supports this hypothesis. A comparison between
the hardness values shows that the hardness value for the 1X
condition is on the upper plateau, but that of the 2X
• condition is in the lower plateau region. This evidence
suggests that at 25 0C/s there is a mixture of acicular
ferrite and primarily martensite for the iX condition, while
0I

T-4223 133
0M
0
"CO I
Figure 3.25 SADP from the region shown in figure 3.24."I"M" and "Im" are from two different martensitepackets. "T" is the transmitted beam.
S
0•m mmRmi ( a

T-4223 134
0.5 pm
Figure 3.26 DF image showing precipitates observed within a• TEM foil. Cooled at 250C/s, 2X condition.
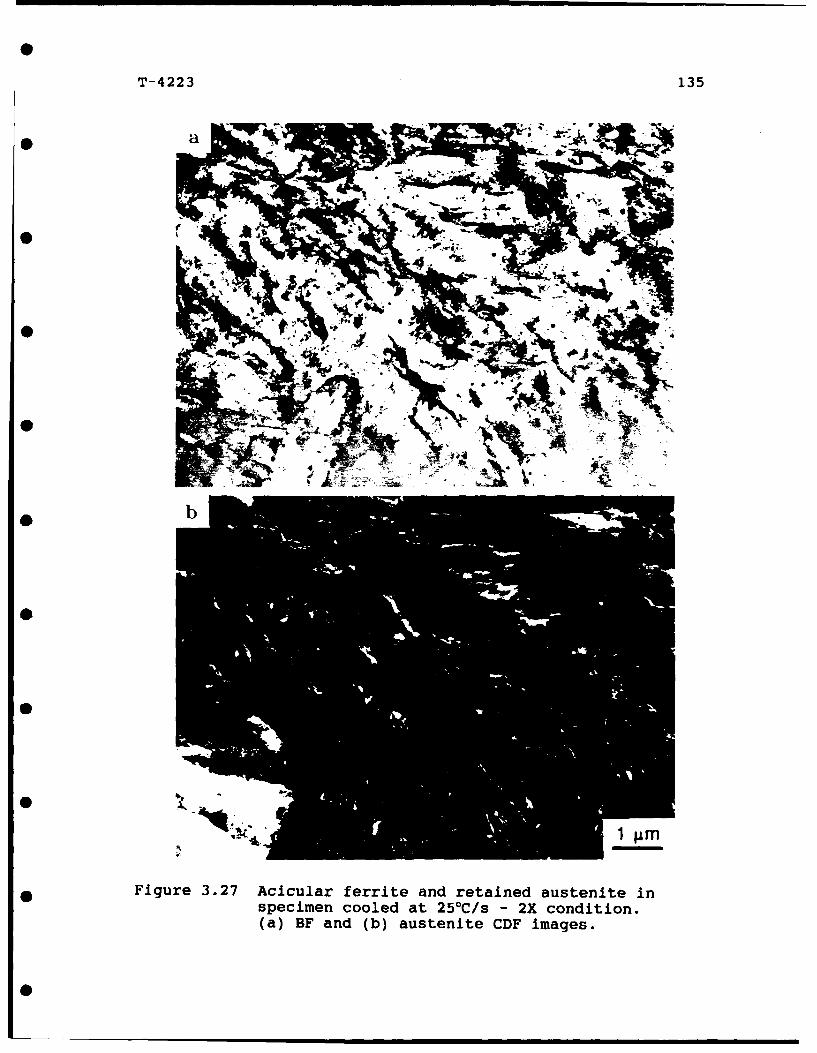
T-4223 135
a -r
SW
0.
1Jim
*Figure 3.27 Acicular ferrite and retained austenite inspecimen cooled at 250C/s - 2X condition.(a) BF and (b) austenite CDF images.

T-4223 136
Figure 3.28 A pool of twinned martensite between laths ofacicular ferrite in specimen cooled at 25*C/s,2X condition.
S... • =. Ui-mn n ma | i i

T-4223 137
* the microstructure of the 2X condition consists mostly of
acicular ferrite.
An example of a mixed microstructure is shown in the
* SEM micrograph of Figure 3.29. This microstructure
represents the cooling rate of 70C/s for a 1X condition.
Although it is difficult to judge about the presence of
* martensite packets in this micrograph, the following reasons
can explain why this microstructure contains both acicular
ferrite and martensite. The acicular nature of the
• microstructure, the lath width and the M-A pool sizes are
consistent with the previous observations. The hardness
value for this cooling rate on the lX hardness profile is
* not on the lower or upper plateau, thereby providing more
evidence that this microstructure may be a mixture of
acicular ferrlze and martensite. The amount of acicular
* ferrite in the 2X condition compared to that of the 250C/s-
lX condition has increased, and that explains the improved
etching behavior and the decrease in the hardness. At
* slower cooling rates (3.3 0C/s), the microstructures shown in
Figure 3.30 resemble those of the as-received specimens.
Etching behavior in these samples was relatively good, as
* shown by the many clear features in the light micrographs.
The number of retained austenite/martensite islands has
increased, and the acicularity of the microstructure is
0 . . l a | | i i

T-4223 138
4 gm
Figure 3.29 Acicular microstructure in a specimen cooled at70C/s, 1X condition. SEM micrograph.
0

T- 4223 139
* awk
pJ Z
* w Id
-is
*~ N-6I
___IV e;-~ ,0.* ~ ~*Y'u e';,d Y"
, ** ~10 g .
Figure ~ ~ ~ ~ ~ ~ ~ ~ ~ ~ ' 3.0 Lgt i rg ap so h s ei esrold a
3 - 30~s (a Xcniinad()2
conditio.3T~ *

T-4223 140
* still evident. There is no evidence of a granular
structure, and this observation is consistent with the as-
received structure. The hardness profiles for both the lX
* and 2X conditions show that the hardness values of these
specimens are in the lower plateau, which represents the
acicular ferrite region.
* Observations with the transmission electron microscope
support the above conclusions. Figure 3.31 shows a
representative micrograph of the specimen for the 1X
* condition. The ferrite laths are elongated and the
dislocation density is high. Although the dislocation
density was not measured, it seems to be consistent with the
* previous observations for the acicular ferrite
microstructure. Some pools of retained austenite/martensite
are present in this microstructure. In addition, as with
* the as-received microstructure, the jagged edges of some
ferrite laths are evident (arrowed). This phenomenon was
observed in the as-received samples and the possible reasons
for that were explained in association with Figure 3.13c.
The montage in Figure 3.32 represents a bigger picture of
this microstructure. The acicular nature of ferrite laths
is very obvious, and the islands of the M-A constituent are
elongated between the ferrite laths. Considering this
montage and the light micrograph for this cooling rate, it
0.. . m m m
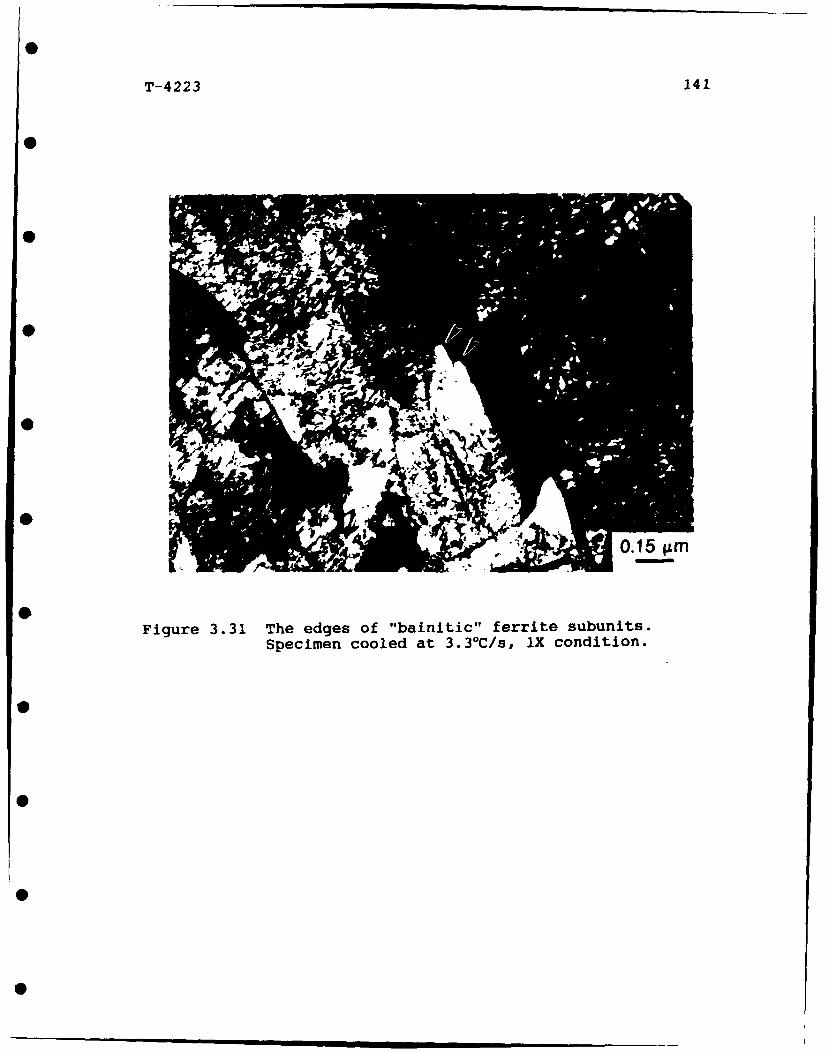
T-4223 141
01
0.15 vm
Figure 3.31 The edges of "bainitic" ferrite subunits.Specimen cooled at 3.3 0C/s, lX condition.
0
"0" - , m am I I l l Ie

T-4223 142
S Figure 3.32 Acicular ferrite and M-A islands in specimencooled at 3.30C/s, 1X condition.

T-4223 143
* is clear that the rows of small dark islands in the light
micrograph represent both acicularity of the microstructure
and the retention of some austenite between ferrite laths.
* The measured average lath width for these microstructures is
about 0.45 pm and the size of M-A islands are about 1 to 1.5
pm, consistent with the other cooling rates.
• It is interesting to notice the same directions of the
ferrite laths within different packets. The low-angle
features of the ferrite boundaries make them insensitive to
* etching, therefore only packet boundaries and interfaces
between ferrite crystals and M-A islands can be revealed in
the light microscope.
* Figures 3.33 and 3.34 represent two different regions
of a specimen cooled at 3.3*C/s for the 2X condition. There
is not much difference between the 1X and the 2X conditions.
The presence of small round particles indicates the same
redeposition effect observed at the higher cooling rates.
As mentioned before, reaustenitizing treatments may be
responsible for this phenomenon. In particular,
precipitation and coarsening may occur at 9050C.
The light micrographs in Figure 3.35 represent the
microstructure of both 1X and 2X conditions for specimens
cooled at 0.1 0C/s. The relatively good etching behavior of
these specimens is similar to that of the as-received and
0 m

T-4223 144
Al
0. i
0iue33 cclrfrit nseie olda
0.0/,2 cniin

T- 4223 145
0. P
Figure 3.34 Acicular ferrite in specimen cooled at* 3.30C/s, 2X condition.
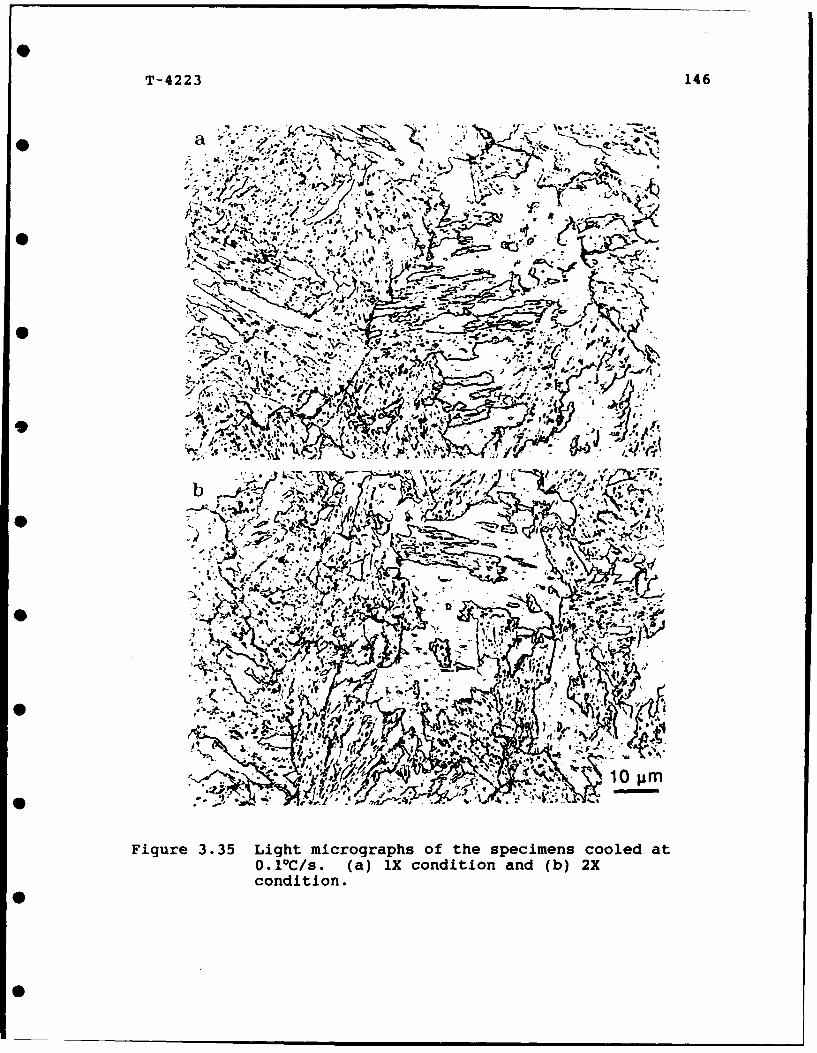
T-4223 146
'xii ~W fA t~4P
* 4 1
*1. " -
it~
N ,& A N*
S, 0 Ji m
Figure ~ ~ 3.5Lgtmcorpso h pcmn olda0. 10C~. (a ) IX codto ad()2
3- Xrco nditon

T-4223 147
* the 3.3 0 C/s cooling rate specimens. All the features in
these microstructures are similar to what was observed for
the 3.3 0C/s cooling rate. Although the cooling rate is very
* slow, the rows of retained austenite pools are indicative of
the acicular nature of these microstructures. The hardness
values of both the IX and 2X conditions are in the lower
• plateau, an implication of non-martensitic structure. There
is no indication of a granular structure.
TEM micrographs show the acicularity of these
• microstructures in more detail. Figure 3.36 is a montage
(with a very slight gap) from the 2X condition. Notit the
acicular ferrite laths and their interwoven nature. A large
* packet of ferrite "C" has separated the two sections of
packets "A" and "B". A BF montage for the IX condition is
shown in Figure 3.37, and the CDF corresponding to the same
* area is represented in Figure 3.38. Notice the similarity
of this microstructure with that of the as-received
specimens. The different directions of ferrite packets are
* clearly shown in Figure 3.38.
Polishing behavior is the reason that some areas in
these micrographs do not show the elongated laths. As
* mentioned before, the etching and polishing behaviors of
these specimens act inversely. The electropolishing and
thinning behavior is very good for the martensitic
0l a | ~ |

T-4223 148
Y*
44
R0I
0A
Figure 3.36 Acicular ferrite in specimen cooled at0. l0C/s, 2X condition.

T-4223 149
Irk
dilk
AIL
Figure 3.37 Acicular ferrite in specimen cooled at0.10C/s, 2X condition. BF image.
, , I I II
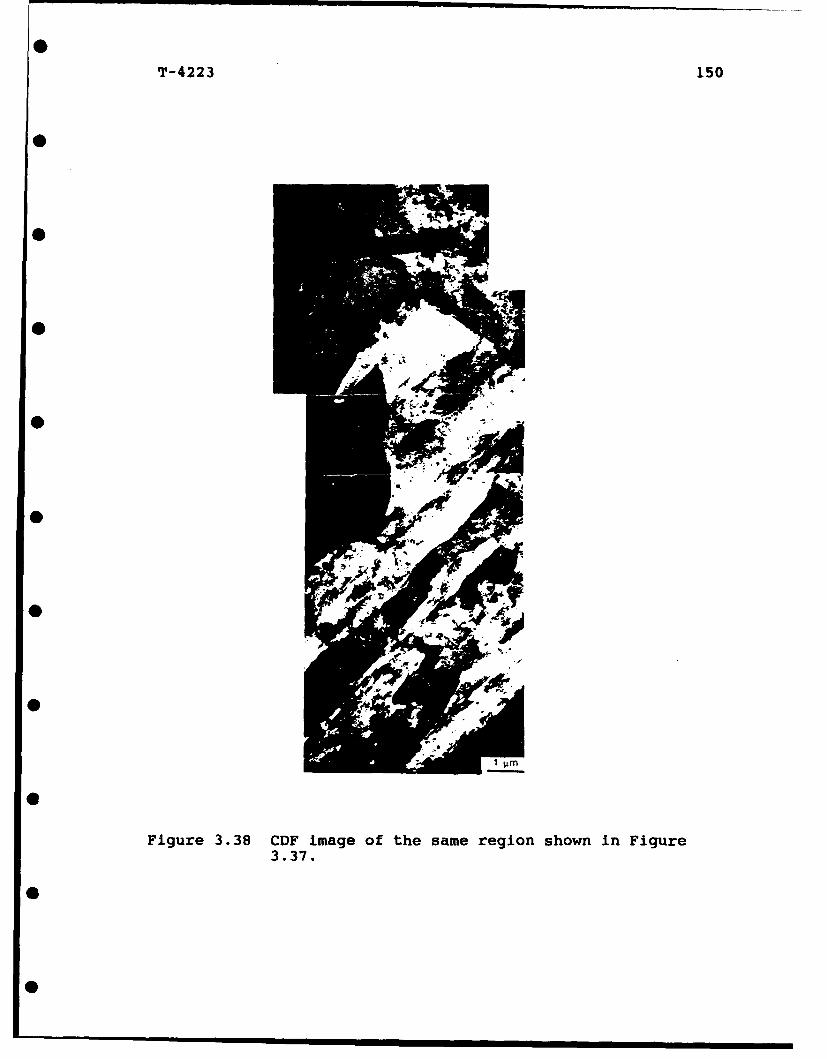
T-4223 150
0|
-g0
F3ifm i o
Figure 3.38 CDF image of the same region shown in Figure3.37.
0II I II

T-4223 151
0 specimens, but they do not etch well. In opposition to this
behavior, the acicular ferrite structure responds better to
the etching, but does not polish well. This behavior makes
• the thin areas on the TEM foil very small. Such behavior
also explains why the etching behavior of the specimens
cooled at different cooling rates can be a basis for
0 comparison of the microstructures corresponding to each
cooling rate.
In addition, an obscure but interesting feature was
* occasionally observed in these microstructures. Figure 3.39
shows an example of this observation. A block of martensite
about 5.5 pm long and 0.6 pm thick seems to be perpendicular
* to the direction of ferrite laths. An interlath island of
retained austenite/martensite which is almost perpendicular
to the direction of this block indicates the direction of
* ferrite laths. The exact reason for this phenomenon is not
clear. The lighter marks on this block suggest a
martensitic structure. The accumulation of carbon in this
* region could be responsible for this phenomenon.
0

T-4223 152
0
4b".
so--
-4 -x* v- . , !
* 77
Figure 3.39 Angular martensite island in specimen cooled at0.1 0C/s, 2X condition.
0
0 l ilI1

T-4223 153
* 3.6 Mechanical Properties
3.6.1 Tensile Properties
Tensile data for as-cooled (10C/s, 1X and 2X) and as-
cooled-plus tempered steels A, B and C are given in the
* appendix. These data include a 0.2% offset yield strength,
tensile strength and total elongation.
Figure 3.40 represents these data in graphical form as
*• a function of manganese content. As it is seen in this
figure, the tensile strength and the yield strength increase
with mangenese content. The total elongation decreases
* slightly with an increase in manganese content, which is
expected to demonstrate an inverse relationship with the
ultimate tensile strength behavior. The increase in tensile
* strength is a reflection of the increase in the hardness
values as a function of manganese content, as described
before.
* There are two features about the tensile behavior of
these steels to discuss. First is the behavior of the
steels as a function of reaustenitizing cycles. The second
• feature is the effect of tempering on the tensile behavior
of these steels.
The data show that both the yield strength and the

T-4223 154
0 .4
0 0 wC4-4 $
*~ 416
S0$4)
k& C4 4J
0 0
* .44
(a N N OW1
41
41 0
IV.41.4
04)0
*~ mm
t>=)>- ow
$4
~)-qt W4l
* ('d.I) KLN31U~S

T-4223 155
* ultimate tensile strength are higher for the 1X condition.
This is consistent with the hardness values as a function of
cooling rate, Figure 3.9. Since tensile tests were
* conducted on specimens cooled at about 10C/s, the specimens
are expected to have a microstructure of acicular ferrite
and M-A islands. The effect of grain size on the strength
* of steel has been discussed before. In acicular ferrite,
several microstructural features play important roles in
addition to the prior austenite grain size. The lath and
* packet size (also the degree of misorientation between the
packets), the average dislocation density and the M-A island
size and number density are the major factors that influence
* the strength of steels with this microstructure (10,12,60).
These features are influenced by the austenite
transformation temperature and steel composition. The lower
* the transformation temperature, the more dislocated the
structure, and the finer the lath size. This discussion
provides the basis for explaining the difference in the
* tensile strengths of iX and 2X conditions. Since the IX
condition has a lower transformation temperature, finer
packet size and higher dislocation density should be
expected.
Coldren et al. showed that the presence of A-A
constituents increases the tensile strength of steel (126).
0 • •m

T-4223 156
* This phenomenon could be explained by the role of austenite-
martensite islands as nucleation sources for mobile
dislocations during deformation. It is possible that there
* is some difference in the average volume fraction of M-A
islands which could lead to the difference in tensile
strength between the 1X versus 2X conditions. Since the
* volume fraction of M-A islands has not been measured, this
hypothesis is subject to verification.
The effects of tempering on the tensile properties of
* steel A for both the iX and 2X conditions are shown in
Figure 3.40b. Tempering at 620 0C for 35 minutes caused a
noticeable drop in the yield strength, but the effect on the
* tensile strength was dramatic. It has been shown (128) that
tempering of low-carbon bainitic steels decreases their
tensile strength and improves the fracture toughness. The
increase in total elongation values for both 1X and 2X
conditions is in agreement with previous observations.
* 3.6.2 Charpy Impact Properties
Charpy impact data for the as-cooled and the as-cooled-
* plus-tempered steels A, B and C are given in the appendix.
These data include both the test temperature and the
absorbed energy.
0

T-4223 157
* Figure 3.41 shows a graphical representation of these
data. The data reveal that the 2X condition shows a better
impact toughness and a lower transition temperature than the
* 1X condition. This is not true for steel C which contains
1.76% manganese. Generally, the effect of manganese on
impact toughness is opposite of its effect on the strength
• of these steels. Steel A, with the lowest manganese level,
shows the best impact toughness, while steel C has the
lowest toughness among all of the three steels. This
observation is true for both the 1X and 2X conditions.
The superiority of the 2X condition in impact
properties over the 1X condition is due to the smaller prior
austenite grain size and lower strength of the 2X condition.
It is well known that grain refinement improves the impact
properties of steel (3,128). The high-angle prior austenite
grain boundaries are effective obstacles to propagation of
cracks. When a crack reaches a high-angle grain boundary, a
change in the direction of the crack is unavoidable. The
propagation of the crack at this stage requires more energy.
In discussion of the difference in tensile strengths between
the 1X and 2X conditions, it was pointed out that this
difference could be partly due to the presence of more M-A
constituents in the 1X microstructure. Here, the higher
transition temperature of the 1X condition could be related
"0 l ,

T-4223 158
00
*, 040
I0
. o
* '4 '-4in0
04O
o.° 1. .4
0 0?A.4 14-.
C.' 4
""~n - -• 0 10 V I:~~ x 0 x,0 %0
Jl J4) (r )
in 0 in U-•
(O 0A .0
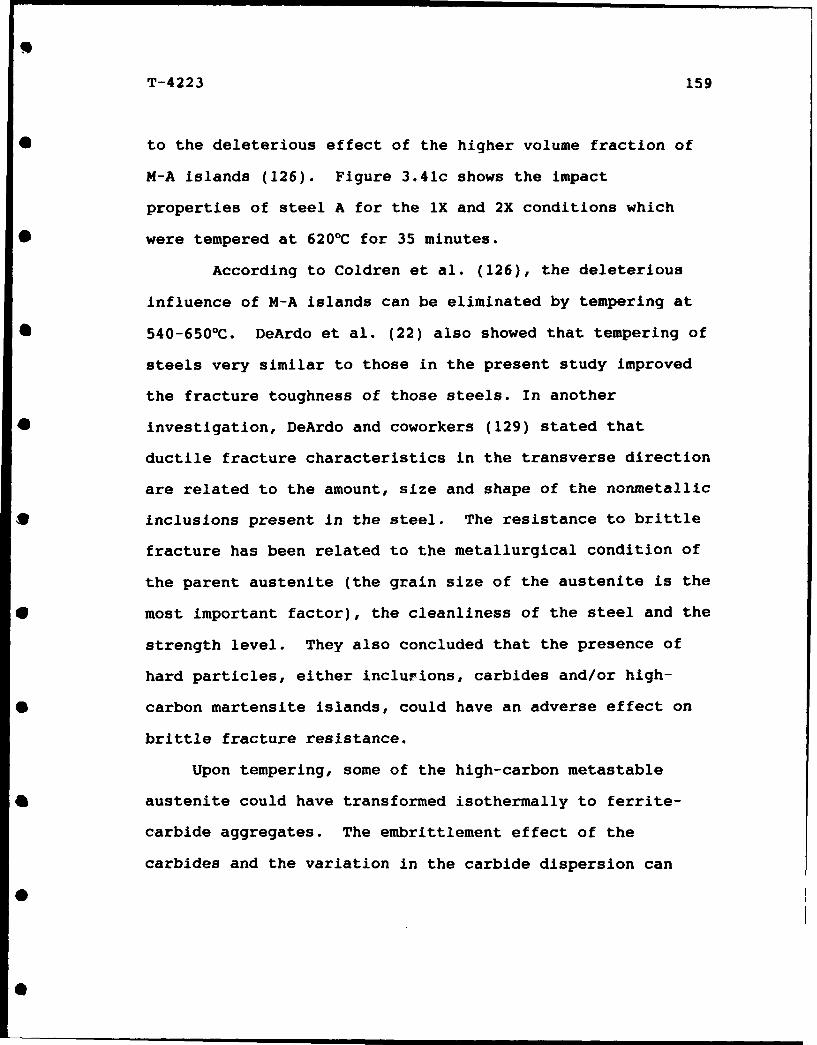
T-4223 159
* to the deleterious effect of the higher volume fraction of
M-A islands (126). Figure 3.41c shows the impact
properties of steel A for the 1X and 2X conditions which
* were tempered at 620 0C for 35 minutes.
According to Coldren et al. (126), the deleterious
influence of M-A islands can be eliminated by tempering at
* 540-6500 C. DeArdo et al. (22) also showed that tempering of
steels very similar to those in the present study improved
the fracture toughness of those steels. In another
* investigation, DeArdo and coworkers (129) stated that
ductile fracture characteristics in the transverse direction
are related to the amount, size and shape of the nonmetallic
* inclusions present in the steel. The resistance to brittle
fracture has been related to the metallurgical condition of
the parent austenite (the grain size of the austenite is the
* most important factor), the cleanliness of the steel and the
strength level. They also concluded that the presence of
hard particles, either inclusions, carbides and/or high-
* carbon martensite islands, could have an adverse effect on
brittle fracture resistance.
Upon tempering, some of the high-carbon metastable
* austenite could have transformed isothermally to ferrite-
carbide aggregates. The embrittlement effect of the
carbides and the variation in the carbide dispersion can

T- 4223 160
vmxr~-400
0 00 c
00
* *0
0:
o4 4)
0.w 41
o F.90 4)4)
>VS
0000
*044 C4 4
C$4 Vo 0 0 0Coc 0 0
r3
00
00

T-4223 161
* lead to lower toughness. This has been confirmed by Smith
et al. (16).
With this in mind, tempering of the steels with the
6 presence of M-A constituents may have mixed results.
Although the transition temperature of the 2X condition has
shifted to lower temperatures, the effect of tempering on
* the upper shelf energy is not very clear. The appearance of
a "dual upper shelf" could be the result of the mixed effect
of tempering when M-A constituents are present. There is
0 another possibility for this behavior. A delamination
effect, which will be shown in the fractography of the non-
tempered specimen, could be responsible. One can also argue
* that the so-called delamination did not have such an effect
on the as-cooled specimens, which may make the rbcve
argument invalid.
* The effects of tempering showed an absolute inverse
effect on the transition temperature of the 1X condition.
Here again, the possibility of more M-A islands for the 1X
* condition arises. As indicated above and according to the
previous observations, the presence of M-A islands could
have negative effect on the toughness of steel after
* tempering.

T-4223 162
* 3.6.3 Fractography
An investigation of the fracture surfaces of steel B
for the lX and 2X conditions was conducted using SEM. Three
samples, from the lower shelf (-195 0C), the transition
region (23 0C) and the upper shelf (100 0C), were examined for
* each condition. Figure 3.42 shows the fracture surfaces of
specimens tested at all three temperatures for the 1X
condition. At 15X magnification, the transition from the
* brittle fracture to the ductile fracture is clear. Notice
the "delamination" in Figure 3.42c.
Figure 3.43 represents the fracture surfaces for the IX
* and 2X conditions at -195 0 C. It is clear from these
pictures that a cleavage fracture developed in both
conditions. The energy absorbed was about 3 J for both
* samples. A comparison between the facet sizes in Figures
3.43a and b clearly shows the larger facet size associated
with the lX condition.
• Figure 3.44 shows the fracture surfaces for both the 1X
and 2X conditions at room temperature. Both of the samples
showed a mixed mode of fracture, although there was more
* ductile rupture in the 2X condition compared to the MX. The
energy absorbed for the 1X condition was 74 J while that of
the 2X condition was 84 J. The higher strength and larger
0. ... . . . . . • a I H i H

T-4223 163
;'."1 ~ k:. Nj.
N
404
0V
* ~ C1 1 , 1
Figure 3.42 SEM micrographis of the fracture surfaces aftertesting at (a) -195'C, (b) 230C and (c) ioo0C.
* Steel B, IX condition.

T-4223 164
_,N' •: -. . , •
* .... . , v*. .
W . '••
(a X n (bIXcndtos
a.
IL
04

T-4223 165
*a
4W t4
4 cv' f
<1. ir Nt, h
A,
~pit
414S.tip
4'~ ax,
Figure 3.44 Fracture surfaces for steel B tested at 230C.(a) 1X and (b) 2X conditions.

T-4223 166
* grain size of the IX condition explain this difference. The
presence of small particles are apparent where ductile
rupture has occurred.
• The fracture surfaces of the specimens tested at about
100 0C are shown in Figure 3.45. The energy absorbed by each
sample was 167 and 179 J, for the 1X and 2X conditions,
* respectively. Ductile microvoid nucleation, coalescence and
growth produce this type of fracture surface. The presence
of inclusions within each dimple is in agreement with the
* role of the hard particles, including inclusions, in the
initiation of fracture (128). Elongated inclusion particles
in the rolling direction caused the elongated shape of the
* dimples, while round Inclusions do not show the same effect.
These observations reinforce the idea that cleanliness is an
important factor in determining the fracture toughness of
* the steel (128,129). Irvine and Pickering (128) suggested
that the presence of particles in every dimple is not
necessary for the formation of dimples. Most of the dimples
• in these micrographs contain inclusions. This indicates the
high inclusion content of these steels, which is probably
responsible for their having a lower toughness than what was
* expected.
0mmmI mu nmm

T-4223 167
-: * --.. ° . ,Wa
*- - , '" I r
I' @•~C L/ -' -•4* -- 4
" . -
b. ..C ,-•: •,-I4x• •_
_ * /- . - *,_• ." •..,.
.. e. ., -.- .. .' N•• b" i.ian- , 5 • 0
* , ha.
.e - .--
%w -- A'-i
U p
LI IL.
Figure 3.45 Fracture surfaces for steel B tested at 100C.(a) iX and (b) 2X conditions.

T-4223 168
3.7 Summary and Conclusions
The continuous cooling transformation of these very
low-carbon steels revealed interesting features of their
transformation behavior. Although the broad, flat-topped CCT
diagrams do not present any noticeable indication of changes
in the transformation products upon cooling at different
cooling rates, the hardness profiles are clearly indicative
of important changes. These changes are coupled with
differences in the etching and electropolishing behavior of
the specimens cooled at different cooling rates to prove the
existence of changes in austenite transformation behavior.
0 The light microscopy and transmission electron
microscopy of the specimens examined for generation of the
CCT diagrams, as well as the as-received specimens, showed
the following features:
1. A martensitic microstructure is the product of fast
cooling rates. At cooling rates faster than about 25°C/s,
the 1X condition (i.e. prior austenite grain size of about
30 Mm) exhibits predominantly martensitic microstructure.
For the 2X condition (i.e., prior austenite grain size of
about 7 Mm), martensite is formed at cooling rates faster
than about 37 0C/s. These structures do not respond well to
the chemical etching, but their response to electropolishing

T-4223 169
* (thinning for TEM) is quite good. The upper plateau on
the hardness profiles corresponds to the martensitic
structure. Very fine, elongated and sometimes interwoven
* lath structures, in addition to some twinned martensite, are
characteristics of this structure.
2. Acicular ferrite is the dominant austenite decomposition
* product for the cooling rates below about 70C/s for the IX
condition. For the 2X condition this range is below about
25 0C/s. Elongated ferrite laths, interlath retained
* austenite and/or martensite and high dislocation density are
characteristics of this microstructure. The lowest cooling
rate examined was 0.05°C/s. The etching response of these
* structures is much better than the martensitic structures,
but their response to electropolishing is very poor. The
lower plateau on the hardness profiles corresponds to the
* acicular ferrite structure.
3. At cooling rates intermediate to those at which the
martensitic structure and the acicular ferritic structure
* form, mixed microstructures consisting of acicular ferrite
and martensite form during cooling. The higher the cooling
rate, the more martensite is in the microstructure. This is
* consistent with the higher hardness values for higher
cooling rates.
4. The ferritic lath width increases with decreasing
0

T-4223 170
0 cooling rate. This value is about 0.2 pm for the
martensitic structure produced at a 150 0 C/s cooling rate,
and increases to about 0.55 Mm for the acicular ferrite
0 formed upon cooling at 0.1 0 C/s. An anomaly was found in the
as-received steel (0.8 Mm), but this was probably due to an
insufficient number of measurements.
0 5. Both the yield strength and the ultimate tensile strength
increased with manganese content. However, the lX condition
shows higher strength than the 2X condition regardless of
the manganese content. This is consistent with the hardness
data. Tempering at 620 0 C for 35 minutes decreased both the
tensile and the yield strengths of steel A.
6. The Charpy impact behavior of all three steels is
consistent with other data. The 2X condition showed higher
impact toughness and a lower transition temperature than the
1X condition. Generally, the effect of manganese on impact
toughness is opposite its effect on the strength of these
steels.
* Tempering lowered the transition temperature and
increased the toughness of steel A for the 2X condition.
For the lX condition, the transition temperature increased
after tempering. This is attributed to the possible higher
number density of M-A island. in the IX condition than the
2X condition.
0

T-4223 171
* REFERENCES
1. E.E. Fletcher, High-Strength, Low-Alloy Steels: Status,Selection and Physical Metallurgy, Battelle Press,
* Columbus, Ohio, 1979.
2. F.B. Pickering, "High-Strength, Low-Alloy Steels - ADecade of Progress", Proceedings of an InternationalSymposium on High-Strength. Low-Alloy Steels,Microalloying 75, Union Carbide Corp., New York, N.Y.,1977, pp. 9-31.
3. F.B. Pickering, Physical Metallurgy and the Design ofSteels, Applied Science Publishers, London, England,1978.
* 4. W.C. Leslie, The Physical Metallurgy of Steels,McGraw-Hill, Tokyo, Japan, 1982.
5. J.M. Rigsbee and P.J. VanderArend, "Laboratory Studiesof Microstructures and Structure-Property Relationshipsin 'Dual-Phase' HSLA Steels", in Conference
* Proceedings: Formable HSLA and Dual-Phase Steels, ed.A.T. Davenport, AIME, New York, N.Y., 1977,pp. 56-86.
6. R.L. Brockenbrough, "Design Trends for High-Strength,Low-Alloy Steels", Processing and Properties of Low
* Carbon Steel, ed. J.M. Gray, AIME, New York, N.Y.,1973, pp. 389-397.
7. I. Takahashi, T. Kato, T. Tanaka and T. Mori,"Development of a High Strength, Hot Rolled Steel With100 ksi Yield Strength", in Conference Proceedings:
* Toughness Characterization and Specifications for HSLAand Structural Steels, ed. P.L. Mangonon Jr., AIME, NewYork, N.Y., 1979, pp. 308-337.
8. J.D. Evensen, J. Lereim and J.D. Embury,"Microstructural Aspects of the Fracture Parameters of
* Controlled Rolled HSLA Steels", in ConferenceProceedings: Toughness Characterization andSpecifications for HSLA and Structural Steels, ed.P.L. Mangonon Jr., AIME, New York, N.Y., 1979, pp. 187-215.
S
0

T-4223 172
* 9. High-Strength, Low-Alloy and High-Strength IntermediateManganese Steel, AISI Steel Products Manual 17, 1967.From ref. 4.
10. F.B. Pickering, "The Structure and Properties ofBainite in Steels", in Symposium: Transformation and
• Hardenability in Steels, Climax Molybdenum Co.,Ann Arbor, Michigan, 1967, pp. 109-132.
11. R.W.K. Honeycombe and F.B. Pickering, "Ferrite andBainite in Alloy Steels", Metallurgical Transactions,Vol. 3, 1972, pp. 1099-1112.
12. A.J. McEvily, R.G. Davies, C.L. Magee and T.L.Johnston, "Structure, Hardenability and Toughness ofLow-Carbon High-Strength Steels", Symposium:Transformation and Hardenability in Steels, ClimaxMolybdenum Co., Ann Arbor, Michigan, 1967, pp. 179-194.
13. A.J. McEvily and C.L. Magee, "Transformation-Structure-Property Characteristics of Low-Carbon Alloy Steels",in Low-Alloy Steels, ISI Publication 114, London,England, 1968, pp. 111-117.
• 14. K.J. Irvine and F.B. Pickering, "Low-Carbon BainiticSteels", JISI, London, England, 1957.
15. A.P. Coldren, Y.E. Smith and R.L. Cryderman,"Microstructure and Properties of Low-Carbon Mn-Mo-CbSteels", Processing and Properties of Low Carbon Steel,
* ed. J.M. Gray, AIME, New York, N.Y., 1973, pp. 163-189.
16. Y.E. Smith, A.P. Coldren and R.L. Cryderman,"Manganese-Molybdenum-Niobium Acicular Ferrite SteelsWith High Strength and Toughness", Symposium:Toward Improved Ductility and Toughness, Climax
* Molybdenum Co., Ann Arbor, Michigan, 1971, pp. 119-142.
17. R.R. Irving, "A Cost Effective Replacement for HY-80",Iron Age, May 16, 1986, pp. 53-55.
18. A.P. Coldren and T.B. Cox, "Development of 100 ksi* Yield Strength HSLA Steel", AMAX Report No. CPR-20,
1986.
19. L.G. Kvidahl, "An Improved High Yield Strength Steelfor Shipbuilding", Welding Journal, Vol. 64, 1985,pp. 42-48.
S

T-4223 173
* 20. D.J. Colvin, "The Physical Metallurgy of Some Low-Carbon, Cu-Bearing HSLA Plate Steels", M.Sc. Thesis,T 3600, Colorado School of Mines, Golden, CO, 1988.
21. Sherri A. Richardson, "The Effects of ThermalProcessing on the Microstructure and MechanicalProperties of a HSLA-100 Plate Steel", M.Sc. Thesis,T 3949, Colorado School of Mines, Golden, CO,1990.
22. M.R. Blicharski, C.I. Garcia, S. Pytel and A.J. DeArdo,"Structure and Properties of ULCB Plate Steels forHeavy Section Applications", in Processing,Microstructure and Properties of HSLA Steels, ed. A.J.DeArdo, AIME, New York, N.Y., 1988, pp. 317-329.
23. H.K.D.H. Bhadeshia and D.V. Edmonds, "The BainiteTransformation in a Silicon Steel", MetallurgicalTransactions A, Vol. 10A, 1979, pp. 895-907.
24. H.K.D.H. Bhadeshia and D.V. Edmonds, "Bainite inSilicon Steels: New Composition-Property Approach Part1", Metal Science, Vol. 17, 1983, pp. 411-419.
25. H.K.D.H. Bhadeshia and D.V. Edmonds, "Bainite in9 OSilicon Steels: New Composition-Property Approach Part
2", Metal Science, Vol. 17, 1983, pp. 420-425.
26. V.T.T. Miihkinen and D.V. Edmonds, "MicrostructuralExamination of Two Experimental High-Strength BainiticLow-Alloy Steels Containing Silicon", Materials Science
* and Technology, Vol. 3, 1987, pp. 422-431.
27. H.I. Aaronson and H.J. Lee, "Another Visit to the ThreeDefinitions of Bainite", Scripta Metallurgica, Vol. 21,1987, pp. 1011-1016.
* 28. First Progress Report of Subcommittee XI: "ElectronMicrostructure of Steel", ASTM Committee E-4,Proceedings ASTM, Vol. 50, 1950, pp. 444-492.
29. Second Progress Report by Subcommittee XI of CommitteeE-4, "Electron Microstructure of Bainite in Steel",
* Proceedings ASTM, Vol. 52, 1952, pp. 543-572.
30. D.N. Shackleton and P.M. Kelly, "Morphology ofBainite", Physical Properties of Martensite andBainite, ISI, Special Report 93, London, England, 1965,pp. 126-134.
9-• m m | | |

T-4223 174
* 31. J.M. Oblak and R.F. Hehemann, "Structure and Growth ofWidmanst~tten Ferrite and Bainite", Symposium:Transformation and Hardenability in Steels, ClimaxMolybdenum Co., Ann Arbor, Michigan, 1967, pp. 15-38.
32. H.K.D.H. Bhadeshia and A.R. Waugh, Proc. Int. Conf. on* Solid-Solid Phase Transformations, ed. by Aaronson,
Laughlin, Sekerka and Wayman, AIME, New York, N.Y.,1982, p. 1581.
33. G.R. Purdy and M. Hillert, "On the Nature of theBalnite Transformation in Steels", Acta Metallurgica,
* Vol. 32, No. 6, 1984, pp. 823-828.
34. R.H. Goodenow, R.H. Barkalow and R.F. Hehemann,"Bainite Transformations in Hypoeutectoid Steels",Physical Properties of Martensite and Bainite, ISI,Special Report 93, London, England, 1965, pp. 135-152.
35. L.J. Habraken and M. Economopoulos, "BainiticMicrostructures in Low-Carbon Alloy Steels and TheirMechanical Properties", Symposium: Transformation andHardenability in Steels, Climax Molybdenum Co., AnnArbor, Michigan, 1967, pp. 69-108.
36. S.W. Thompson and G. Krauss, "Structure and Propertiesof Continuously Cooled Bainitic Ferrite-Austenite-Martensite Microstructures", in Mechanical Working andSteel Processing Proceedings, 1989, pp. 467-481.
37. S.W. Thompson, D.J. Colvin, and G. Krauss, "ContinuousCooling Transformations and Microstructures in a Low-Carbon, High-Strength Low-Alloy Plate Steel",Metallurgical Transactions A, Vol. 21A, 1990, pp. 1493-1507.
38. B.S. Kloberdanz, ongoing M.S. thesis work, ColoradoSchool of Mines, 1992.
39. J.H. Woodhead and J.A. Whiteman, "Structure andProperties of Apolygonal Ferrites", Processina andProperties of Low Carbon Steel, ed. J.M. Gray, AIME,New York, N.Y., 1973, pp. 145-162.
40. S.H. Avner, Introduction to Physical Metallurgy, SecondEdition, McGraw-Hill, Singapore, 1985.
0m m mmmmm ~
T-4223 175
* 41. E.C. Bain and H.W. Paxton, Alloying Elements in Steels,Second Edition, Third Revised Printing, ASM, MetalsPark, Ohio, 1966.
42. S.W. Poole and J.E. Franklin, "High-Strength Structuraland High-Strength Low-Alloy Steels", Metals Handbook,
* 9th Edition, ASM, Metals Park, Ohio, pp. 403-420.
43. R.J. Jessman and G.J. Murphy, "Precipitation HardeningAlloy Steels Provides Strength and Low TemperatureToughness Under Sever Service Conditions", IndustrialHeating, Sept. 1979, pp. 27-32.
44. George Krauss, Steels: Heat Treatment and ProcessingPrincipals, ASM, Metals Park, Ohio, 1989.
45. Y.J. Park and F.B. Fletcher, "Effects of Manganese,Chromium, and Molybdenum on the IsothermalTransformation of Austenite in Eutectoid Steels",J. Heat Treating, Vol. 4, No. 3, 1986, ASM,pp. 247-252.
46. P. Henry, The Importance of Molybdenum in Heavy SteelSections, Climax Molybdenum Co., London, England, 1972.
47. J.C. Greenbank, "Carbon Solute Interactions in Fe-Cr-C,Fe-Mo-C and Fe-W-C Alloys", Journal of the Iron andSteel Institute, 1971, pp. 986-990.
48. H. Wada, "Thermodynamics of the Fe-Mo-C System at985K", Metallurgical Transactions A, Vol. 17A, 1986,pp. 391-398.
49. J.A. Straatmann, D.V. Doane and Y.J. Park, "Using CCTDiagrams in the Development of Low-Carbon, HighStrength Steels" in Processing, Microstructure andProperties of HSLA Steels, ed. A.J. DeArdo, AIME, NewYork, N.Y., 1988, pp. 287-303.
50. F.G. Berry and R.W.K. Honeycombe, "The IsothermalDecomposition of Austenite in Fe-Mo-C Alloys", Met.Trans., Vol. 1, 1970, pp. 3279-3286.
51. R.A. DePaul and A.L. Kitchin, "The Role of Nickel,Copper, and Columbium (Niobium) in Strengthening a Low-Carbon Ferritic Steel", Metallurgical Transactions,Vol. 1, Feb. 1970, pp. 389-393.

T-4223 176
52. A.P. Coldren and G.T. Eldis, "Using CCT Diagrams toOptimize the Composition of an As-Rolled Dual-PhaseSteel", Journal of Metals, March 1980, pp. 41-48.
53. M.R. Krishnadev and A. Galibois, "Development of aHigh-Strength Low-Alloy Steel Strengthened byTransformation Substructure and Precipitation of Copperand Niobium", Metals Technology, Vol. 1, 1974,pp. 300-302.
54. K.J. Irvine, JISI, 1962, p. 820.
55. R.L. Smith, G. Spangler and R.M. Brick, Trans Am. Soc.Metals, Vol. 46, 1954, p. 973.
56. E.O. Hall, Proc. Phys. Soc., London, Vol. B64, 1951, p.747.
57. N.J. Petch, JISI, Vol. 174, 1953, p. 25.
58. R.W.K. Honeycombe, Structure and Strength of AlloySteels, Climax Molybdenum Co., London, England.
59. R.W. Armstrong, "The Influence of Polycrystal GrainSize on Several Mechanical Properties of Materials",Met. Trans., Vol. 1, 1970, pp. 1169-1176.
60. K.J. Irvine, "A Comparison of the BainiteTransformation With Other Strengthening Mechanisms inHigh-Strength Structural Steels", Sympo.ium: Steel-Strengthening Mechanisms, Climax Molybdenum Co.,Greenwich, Connecticut, 1969, pp. 55-65.
61. J. Malcolm Gray, "Columbium (Niobium) as a GrainRefiner in Hot-Rolled Steels", Processing andProperties of Low Carbon Steel, ed. J.M. Gray, AIME,New York, N.Y., 1973, pp. 225-247.
62. M. Durbin and P.R. Krahe, "Controlled Rolling and theProperties of Very Low Carbon, High Manganese SteelsContaining Strong Carbide Formers", in Processing andProperties of Low Carbon Steel, ed. by J.M. Gray, AIME,New York, N.Y., 1973, pp. 109-131.
63. I. Kozasu and T. Osuka, "Processing Conditions andProperties of Control-Rolled Steel Plates", inProcessing and Properties of Low Carbon Steel, ed.by J.M. Gray, AIME, New York, N.Y., 1973, pp. 47-67.

T-4223 177
* 64. Tomo Tanaka, N. Tabata, T. Hatomura and C. Shiga,"Three Stages of the Controlled-Rolling Process",Proceedings of an International Symposium on High-Strength. Low-Alloy Steels, Microalloying 75, UnionCarbide Corp., New York, N.Y., 1977, pp. 107-119.
* 65. B. Karlsson, "Grain Refinement in Fe-C Alloys byThermal Cycling", Materials Science and Engineering,Vol. 11, 1973, pp. 185-193.
66. J.Y. Koo and G. Thomas, "Thermal Cycling Treatments andMicrostructures for Improved Properties of Fe-0.12% C-
* 0.5% Mn Steels", Materials Science and Engineering,Vol. 24, 1976, pp. 187-198.
67. R.A. Grange, Trans. Am. Soc. Metals, Vol. 59, 1966,p. 26.
68. R.B. Nicholson, "Strong Microstructures From the SolidState" in Strengthening Mechanisms in Crystals ed. A.Kelly and R.B. Nicholson, John-Wiley and Sons, NewYork, N.Y., 1971, p. 542.
69. J.H. Bucher, "The Toughness of Ferritic SteelStrengthened by Precipitation of CbC", Trans. AIME,Vol. 239, 1967, pp. 478-485.
70. E.C. Hamre and A.M. Gilroy-Scott, "Properties ofAcicular-Ferrite Steel for Large-Diameter Line Pipe",in Proceedings of an International Symposium on High-Strength, Low-Alloy Steels, Microalloy!ng 75, UnionCarbide Corp., New York, N.Y., 1977.
71. Paul E. Repas, "Control of Strength and Toughness inHot-Rolled Low-Carbon Manganese-Molybdenum-Columbium-Vanadium Steels", Proceedings of an InternationalSymposium on High-Strength, Low-Alloy Steels,Microalloying 75, Union Carbide Corp., New York, N.Y.,1977, pp. 387-398.
72. T. Gladman, D. Dulieu and Ian D. McIvor, "Structure-Property Relationships in High-Strength MicroalloyedSteels", in Proceedings of an International Symposiumon High-Strength, Low-Alloy Steels, Microalloying 75,Union Carbide Corp., New York, N.Y., 1977, pp. 32-58.

T-4223 178
73. P.R. Kirkwood, "Welding of Niobium ContainingMicroalloyed Steels", in Niobium: Proceedings of theInternational Symposium, edited by Harry Stuart, AIME,New York, N.Y., 1981, pp. 761-802.
74. A.L. Mincher, R.A. Bosch and P.R. Morgan, "CommercialProduction of High-Strength, Titanium-Bearing Hot-Rolled Steel", Proceedings of an InternationalSymposium on High-Strength, Low-Alloy Steels,Microalloying 75, Union Carbide Corp., New York, N.Y.,1977, pp. 251-260.
75. B. Aronsson, "The Microstructure and MechanicalProperties of Some Martensitic Steels With SpecialReference to the Influence of Niobium and Molybdenum",Symposium Steel-Strengthening Mechanisms, ClimaxMolybdenum Co., Greenwich, Connecticut, 1969, pp. 77-87.
76. S.W. Thompson and G. Krauss, "Precipitation and FineStructure in Medium-Carbon Vanadium andVanadium/Niobium Microalloyed Steels", MetallurgicalTransactions A, Vol. 20A, 1989, pp. 2279-2288.
77. T. Tanaka, "Controlled Rolling of Steel Plate andStrip", International Metals Review, 1981, pp. 185-212.
78. N.P. Allen, "Effect of Solute Element on theMechanical Properties of Iron" ,in Proceedings of aConference on Iron and Its Dilute Solid Solutions,ed. C.W. Spencer and F.E. Werner, IntersciencePublishers, New York, N.Y., 1963, pp. 271-314.
79. R.E. Reed-Hill, Physical Metallurgy Principles, VanNostrand Co., New York, N.Y., 1964.
80. George E. Dieter, Mechanical Metallurgy, SecondEdition, McGraw-Hill, New York, N.Y., 1984.
81. P.M. Kelly and J. Nutting, "Strengthening Mechanisms inMartensite", Physical Properties of Martensite andBainite, ISI, Special Report 93, London, England, 1965,pp. 166-170.
82. G.R. Speich and P.R. Swann, "Yield Strength andTransformation Substructure of Quenched Iron-NickelAlloys", JISI, 1965, pp. 480-485.
0

T-4223 179
* 83. G.E. Hicho, S. Singhal, L.C. Smith and R.J. Fields,"Effect of Thermal Processing Variations on theMechanical Properties and Microstructure of aPrecipitation Hardening HSLA Steel", Journal of HeatTreating, Vol. 3, No. 3, 1984, pp. 205-212.
* 84. W.E. Creswick, "Commercial Development of a Rimmed Low-Alloy Precipitation-Hardening High-Strength Steel",Strong Tough Structural Steels, ISI No. 104, London,England, 1967, pp. 86-92.
85. P. Morcinek, V. Smid, T. Heczko and T. Prenka,* "Structural Steels With Acicular Ferrite", in
Proceedings of an International Symposium onHigh-Strength. Low-Alloy Steels, Microalloying 75,Union Carbide Corp., New York, N.Y., 1977, pp. 272-278.
86. M. Cohen and W. S. Owen, "Thermo-mechanical Processingof Microalloyed Steels" Proceedings of an InternationalSymposium on High-Strength, Low-Alloy Steels,Microalloying 75, Union Carbide Corp., New York, N.Y.,1977, pp. 2-8.
87. M.G. Gemmill, "The Merits and Demerits of StrengtheningMechanisms is Low-Alloy Steels", SymDosium: Steel-Strengthening Mechanisms, Climax Molybdenum Co.,Greenwich, Connecticut, 1969, pp. 67-75.
88. J.W. Christian, "Military Transformations: AnIntroductory Survey", Physical Properties of Martensiteand Bainite, ISI, Special Report 93, London, England,1965, pp. 1-25.
89. R.F. Hehemann, K.R. Kinsman and H.I. Aaronson, "ADebate on the Bainite Reaction", MetallurgicalTransactions, Vol. 3, 1972, pp. 1077-1094.
90. K.R. Kinsman and H.I. Aaronson, "Influence ofMolybdenum and Manganese on the Kinetics of theProeutectoid Ferrite Reaction", Symposium:Transformation and Hardenability in Steels, ClimaxMolybdenum Co., Ann Arbor, Michigan, 1967, pp. 39-55.
91. H.I. Aaronson, "On the Problem of the Definitions andthe Mechanisms of the Bainite Reaction", The Mechanismof Phase Transformations in Crystalline Solids,pp. 270-312.
0

T-4223 180
92. J.W. Christian, "The Origin of Surface Relief Effectsin Phase Transformations", in Decomposition ofAustenite by Diffusional Processes, ed. by V.F. Zackayand H.I. Ironstone, InterScience Publishers, Easton,Pennsylavania 1962, pp. 371-386.
93. S.K. Liu and G.Y. Zhang, "The Effect of Mn and Si onthe Morphology and Kinetics of the BainiteTransformation in Fe-C-Ti Alloys", MetallurgicalTransactions A, Vol. 21A, June 1990, pp. 1509-1515.
94. H.K.D.H. Bhadeshia and J.W. Christian, "Bainite inSteels", Metallurgical Transactions A, Vol. 21A, April1990, pp. 767-797.
95. S.W. Thompson, Private communication based onunpublished research.
96. H.K.D.H. Bhadeshia, Proc. Int. Conf. Solid-Solid PhaseTransformations, ed. by G.W. Lorimer, Institute of
97. Bainite Committee of Iron & Steel Institute of Japan,Atlas for Bainitic Microstructures, Vol. 1, 1992.Metals, London, England, 1988, pp. 321-386.
98. G.R. Speich and H. Warlimont, "Yield Strength andTransformation Substructure of Low-Carbon Martensite",JISI, 1968, pp. 385-392.
99. W.D. Swanson and J. Gordon Parr, "Transformations inIron-Nickel Alloys", JISI, Feb. 1964, pp. 104-106.
100. D.W. Gomersall and J. Gordon Parr, "Transformations inIron-Manganese Alloys," JISI, March 1965, pp. 275-279.
101. J.M. Wallbridge and J. Gordon Parr, "Transformations inFe-Cr Alloys," JISI, Feb. 1966, pp. 119-121.
102. J. Gordon Parr, "Transformations in Fe-Co Alloys,"JISI, April 1967, pp. 426-427.
103. E.A. Wilson, "The y7c Transformation in Iron,"Scripta Metallurgica, Vol. 12, 1978, pp. 961-968.
104. E.A. Wilson, "The y4a Transformation in Iron and itsDilute Alloys," Scripta Metallurgica, Vol. 4, 1970, pp.309-312.

T-4223 181
*105. A. Gilbert and W.S. Owen, "Diffusionless Transformationin Iron-Nickel, Iron-Chromium and Iron-Silicon Alloys,"Acta Metallurgica, Vol. 10, 1962, pp. 45-54.
106. A.R. Marder and G. Krauss, "The Morphology ofMartensite in Iron-Carbon Alloys," Trans. ASM, Vol. 60,
*- 1967, pp. 651-660.
107. R.H. Goodenow and R.F. Hehemann, "Transformations inIron and Fe-9 Pct Ni Alloys," Trans. AIME, Vol. 233,1965, pp. 1777-1786.
108. J.M. Marder and A.R. Marder, "The Morphology of Iron-Nickel Massive Martensite," Trans. ASM, Vol. 62, 1969,pp. 1-10.
109. G. Krauss and A.R. Marder, "The Morphology ofMartensite in Iron Alloys," Met. Trans., Vol. 2, 1971,pp. 2343-2357.
110. Lee Dillinger, "Hardness Testing", Met-Tips, Ideas forMetallographic Procedures, Leco Corp., Michigan, 1980.
111. George T. Eldis, "A Critical Review of Data Sources forIsothermal Transformation and Continuous CoolingTransformation Diagrams", in Proceedings of anInternational Conference on Solid-Solid PhaseTransformations, TMS-AIME, Warrendale, PA, 1982,pp. 126-157.
112. "Standard Test Methods for Determining Average GrainSize", ASTM Designation: E112-88, Annual Book of ASTMStandards, Vol. 03.01, ASTM, Philadelphia, PA, 1989,pp. 284-306.
113. Halle Abrams, "Grain Size Measurement by InterceptMethod", Metallography, Vol. 4, 1971, pp. 59-78.
114. "Standard Test Methods for Characterizing Duplex GrainSizes", ASTM Designation: E1181-87, Annual Book of ASTMStandards, Vol. 03.01, ASTM, Philadelphia, PA, 1989,pp. 828-841.
115. E.E. Underwood, "Applications of QuantitativeMetallography", Metals Handbook, ASM, Metals Park,Ohio, 1988, pp. 37-47.

0
T-4223 182
* 116. Dynamic Thermal/Mechanical Metallurgy Using the Gleeble1500, Second Edition, Duffers Scientific Inc., Troy,N.Y., 1986.
117. G.R. Speich and T.M. Scoonover, "Continuous-Cooling-Transformation Behavior and Strength of HSLA-80 (A710)Steel Plates", in Processing, Microstructure andProperties of HSLA Steels, ed. A.J. DeArdo, AIME, NewYork, N.Y., 1988, pp. 263-286.
118. W.W. Cias, Phase Transformation Kinetics andHardenability of Medium-Carbon Alloy Steels, ClimaxMolybdenum Co., Greenwich, Connecticut.
119. "Standard Test Method for Vickers Hardness of MetallicMaterials", ASTM Designation: E92-82, Annual Book ofASTM Standards, Vol. 03.01, ASTM, Philadelphia, PA,1989, pp. 264-272.
120. "Standard Test Methods of Tension Testing of MetallicMaterials", ASTM Designation: E8-89, Annual Book ofASTM Standards, Vol. 03.01, ASTM, Philadelphia, PA,1989.
121. R.F. Johnson, "The Measurement of Yield Stress", StrongTough Structural Steels, ISI Publication 104, London,England, 1967, pp. 51-60.
122. "Standard Test Methods for Notched Bar Impact Testingof Metallic Materials", ASTM Designation: E23-88,Annual Book of ASTM Standards, Vol. 03.01, ASTM,Philadelphia, PA, 1989.
123. K.W. Andrews, "Empirical Formulae for the Calculationof Some Transformation Temperatures", JISI, London,England, 1965, pp. 721-727.
124. W. Steven and A.G. Haynes, "The Temperature ofFormation of Martensite and Bainite in Low-AlloySteels: Some Effects of Chemical Composition", JISI,London, England, 1956, pp. 349-359.
125. V. Biss and R.L. Cryderman, "Martensite and RetainedAustenite in Hot-Rolled, Low-Carbon Bainitic Steels",Metallurgical Transactions, Vol. 2, 1971, pp. 2267-2276.

T-4223 183
126. A.P. Coldren and R.L. Cryderman, "Strength and ImpactProperties of Low-Carbon Structural Steels ContainingMolybdenum", in Symposium: Steel-StrengtheningMechanisms, Climax Molybdenum Co., Greenwich,Connecticut, May 1969, pp. 17-44.
127. Written discussion by B.V. Narashima Rao, following G.Krauss, "Martensitic Transformation, Structure andProperties in Hardenable Steels," rv-ceedingsHardenability Concepts With Applic.,jons to Steel,editors D.V. Doane and J.S. Kirkaldy, AIME,
128. K.J. Irvine and F.B. Pickering, "The ImpactProperties of Low Carbon Bainitic Steels", JISI,London, England, 1963, pp. 518-531.
129. C.I. Garcia, A.K. Lis, S.M. Pytel and A.J. DeArdo"Ultra -Low Carbon Bainitic Plate Steels: Processing,Microstructure and Properties" I&SM, October 1991, pp.97-106.

I!
T-4223 184
Table 1. Charpy Impact Data
STEEL TEMPERATURE ENERGY ABSORBED (J) TEMPERATURE ENERGY ABSORBED (J)l°C) !x (0C) 2X
A -195 1.35 -195 1.35A -84 2.71 -84 2.71A -40 10.84 -40 12.20A -18 24.40 -20 27.11A 0 112.53 -18 108.46A 23 178.97 0 97.62A 61.7 184.39 23 146.43A 64.5 162.70 23 138.30A 103 166.76 61.7 173.54A 130 173.54 103 170.83A 156 166.76 130 178.97
156 185.75
B -195 1.35 -195 1.35B -84 2.70 -84 4.07B -40 6.78 -40 8.13B -18 10.85 -18 47.45B 0 24.45 0 86.77B 23 74.57 23 84.06B 44.5 136.94 44.5 151.85B 62 128.80 62 161.34B 103 135.58 103 178.96B 130 154.56 130 183.03B 160 143.71 160 173.54
C -195 1.35 -195 1.35C -84 2.70 -84 4.07C -40 5.42 -40 4.07C -18 10.85 -18 10.85C 0 10.85 0 47.45C 23 13.56 23 97.62C 44.5 71.86 61.7 111.17C 61.7 101.69 103 97.62C 103 128.80 103.5 123.38C 129 155.92 129 122.03C 159 135.61 159 142.36
AT* -197 2.70 -197 2.70AT -83 7.46 -83 6.10AT -40 42.03 -40 169.47AT -19 62.37 -19 151.85AT 0 58.30 0 216.93AT 24 181.60 24 138.29AT 60 138.29 60 223.71AT 100 165.41 100 174.90AT 145 189.81 145 196.59
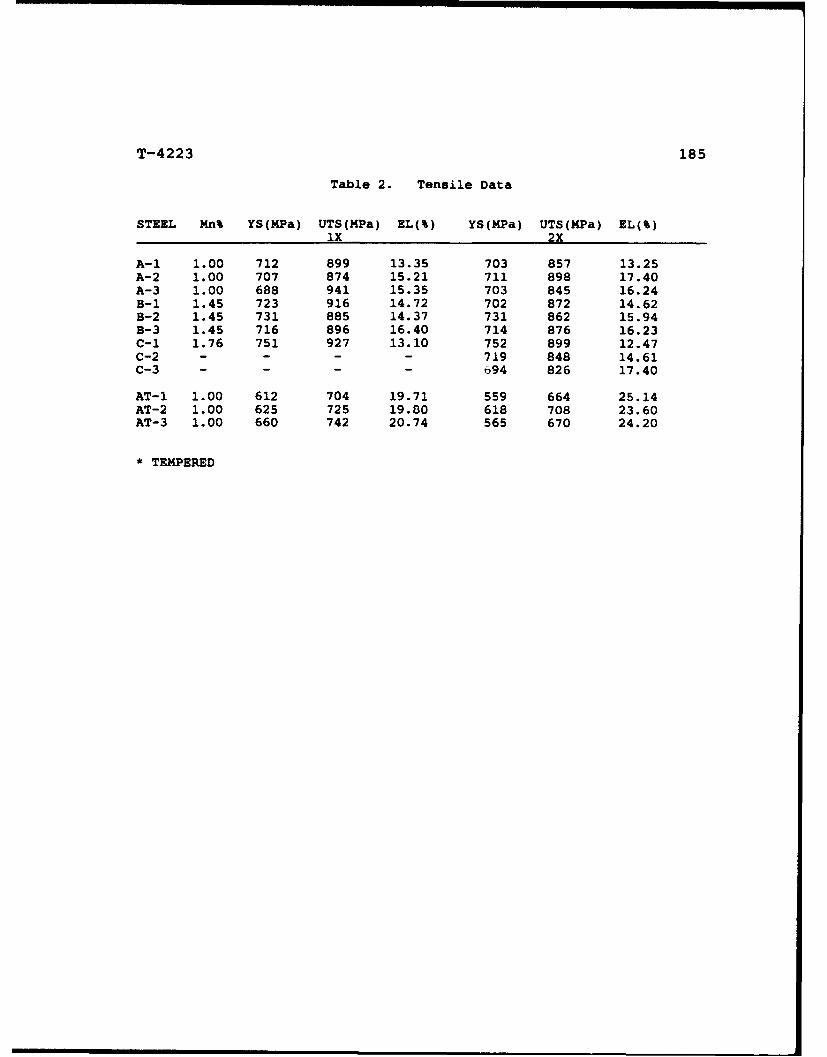
T-4223 185
Table 2. Tensile Data
STEEL Mn% YS(MPa) UTS(MPa) EL(%) YS(MPa) UTS(MPa) EL(%)ix 2X
A-1 1.00 712 899 13.35 703 857 13.25A-2 1.00 707 874 15.21 711 898 17.40A-3 1.00 688 941 15.35 703 845 16.24B-i 1.45 723 916 14.72 702 872 14.62B-2 1.45 731 885 14.37 731 862 15.94B-3 1.45 716 896 16.40 714 876 16.23C-I 1.76 751 927 13.10 752 899 12.47C-2 - - - - 719 848 14.61C-3 - - - - 694 826 17.40
AT-I 1.00 612 704 19.71 559 664 25.14AT-2 1.00 625 725 19.00 618 708 23.60AT-3 1.00 660 742 20.74 565 670 24.20
• TEMPERED


![[25]the Mechanism of Acicular Ferrite in Weld Deposits](https://img.dokumen.tips/doc/110x75/577cbff61a28aba7118e86b2/25the-mechanism-of-acicular-ferrite-in-weld-deposits.jpg)