Embed Size (px)
Citation preview

I'IIIIII--------..----------~~~-.-.. ~-.----~---- ~. ----- --
Manitoba ~ Energy and Mines ,
".I. J
••• ·~·.'.·. __ ·.'.·a'.'.·.=·.= ::ao:z_.' ... z .. a.a __ :a~ •• = •• :a .. _ = ••• sa.a •• Q::a = •• :8 .•.•.• :1 .•.•. :. .-a
MINERAL RESOURCES
GEOLOGICAL SERVICES
OPEN FILE REPORT O'84-l
PRELIMINARY RESULTS OF BIOGEOCHEMICAL STUDIES IN THE
LYNN LAKE AREA
by
M.A. F. FEIHKOW
1984
COiHRIBUTlON TO PROGR:),l~liNG CCilDUCTED UNDER THE CANADA - MANITOBA INTERIM AND MINERAL
DEVELOPMENT AGREEMENTS.

Electronic Capture, 2011 The PDF file from which this document was printed was generated by scanning an original copy of the publication. Because the capture method used was 'Searchable Image (Exact)', it was not possible to proofread the resulting file to remove errors resulting from the capture process. Users should therefore verify critical information in an original copy of the publication.
•
•
•
,'. -..
Manitoba ~. Energy and Mines ,
~ ~
Bon. Wilson D. Parasiuk Minister
MINERAL RESOURCES
Dick Chenier Actinq Deputy Minister
Ian Hauqh Assistant Deputy Minister
.............. ' ....... ' ................................ ' ................. . OPU FILE UPORT 01'8.-1
PRELIMINARY RESULTS OF B'IOGEOCBEMICAL STUDIES IN THE
LYNN LAKE AREA
by M.A.1'. FecUkow
Winnipeq 1984
...• -........ -.. ' .. ' .................................................... '

•
•
w
INTRODUCTION., ••••. PREVIOUS WORK •..•• RSGIONAL GEOLOGY •.
TABLE OP CONTENTS
GBOLOGICAL SBTTING OP THE AGASSIZ DEPOSIT •• BIOGEOCBIMICAL SURVEyS ••••••.••••••••.•••
Introduct iOIl •.•.•••••••••.•••••••.••• Sa.pling Methodology and Preparation. Analysis of Biogeocbe.ical Sa.ples •••
Atoaic Absorption Spectrophotoaetry. Instru.ental Neutron Activation Analysis.
Tbeory •••••.•.•••••...•.•.••...••.•••.• Results ............................... Trac. Ile •• nt Content of Plant Organs. Trac. Ile.ent Variation Witb Proxiaity To Tbe Agassiz D.po.it •••••••••••••••••••
Introduction ••••••...•••••.••••••••• Black Spruce (Picea .ariana) .••••••• Labrador T.a (Ledu. qroenlan4icu.) ••
Dot Lak. Ar.a ••••••• Introduction •• Methods •.••.•• R.sults •••••••• Black Spruce Ne.dles.
Zinc •••••. Mangan.se .• Copper ..•. Lead •..••..
Black Spruce Twigs. Arsenic •• Go14 ••.
Su_ary ••••••• Arbour Lak. Area.
Results Pranc.s Lak. Area ••
Introduction •• a.sults •••••.••
PEAT BOG GIOCHEMICAL SURVEYS .• Introduction •.•...•.••••.• Sa.pling M.thodology and Preparation Analysis of Peat Sa.ples ..•.•••.•.
R.su 1 ts ...................... . Part 1: Huaified Peat •. Part 2: P.rmafrost
BASAL TILL GEOCHEMICAL SURVEYS. Peat Bog Cores .•
Results ...................................... .
i
1 2 4 7
10 10 10 11 11 12 14 14 14
15 15 18 21 22 22 22 23 23 23 23 25 25 25 25 26 26 27 27 29 29 31 31 31 32 32 32 32 34 37 37

D I SevSS'I ON ." •• ' e' .' ••• ' ................................... e" e" ." .' .5 !Valuation of Sa.pling Technique...................... 4S !Valuatioa of Analytical Methods...................... 47 Inter-eleaent Relationships........................... 48 Trace Kleaent Conteat of Sa.pling Media............... 50
CONCLUS IONS. • • • .. • • • • • • • • • • .. • • • • • • • • • • • • • • • • • • • .. • • • • • • • • • • • 51 ACDOIILBDGIIIBNTS. • • • • • • • • • • • .. • • • • • • • • • • .. .. • • • .. • • • • • • • • • • • • • 53 UPBIlBMCBS.. • • .. • .. .. • • • • • • • .. • • • • • • • • .. • • • • • • • • • • • • • • • • • • • • .. • • • 5 ..
APPDDICBS
APPDDIX 1 .. An-alytical Results • ................... ' •• ' •• ' •• ' e" .' 59 . APpermIX 2 Analytical Reproducibility •••••.•••••••••••••• 16
APpermIX 3 Statistical Su_ary of Analytical Data •• " •• " •••• 83
APPDDIX 4 : Correlation Coefficients •••••.•.••••••.••••.•• 89 •
APPDDIX 5 Selected Hiatoqra .............................. " • 1.03
• TABU:
Table I: Su_ary of correlation coefficients for eleaeat pairs in biogeocheaical saaples. •••.••.•.•• 49
PIGUOS
ripre 1 SiapUfied regional geology of the Lynn Lake area. • . • • • • • • • • • • • • • • • • • • • • • .. • • • • • • • • • • • • • 5
rigure 2 Detailed geological setting of the "gas. iz depos it.. • • . • • . . . . . . . • . . • • . • • • . . . .. . . • . . • 9
Figure 3 Biogeochenaical and hullUs sanaple location map of the Agass iz depos it. . • . • . . . . . . • • . • • • . • • . • . • • 13
- ii -
..
•
. It
Pigure 4 Coapar'ison of Zn. As and Au contents in black spruce needles and twigs. Agassiz depo8 it. . ......... . ' .................... ' ." .... ' .' ." e"
Pigure 5: Coaparison of Zn. As and Au contents in Labrador tea leaves and twigs. Agassiz
16
depoe it. . ............................ . '.' .'. e" •••• ' • 17
Pigure 6 Variation in concentration of Zn and As in black spruce needles with proxiaity to the Agassiz deposit. • ••••••••••••••••••.•••• '... 19
Pigure 7 Variation in concentration of Zn. As and Au in black sprice twigs with proxiaity to the Agassiz deposit. • •••••.•••••••••.••••. '.' 20
Pigure 8: Variation in concentration of Zn and MIl in black spruce needles and As in black spruce twigs with proxiaity to the Rushed Shoving. Dot Lake. . .............•....... . ' .' ...• '
Pigure 9: Geological setting of the near solid sulphide occurrence. Arbour Lake area.
2.
Agassiz Metallotect. • • • • . • • • • • • • . • • • • • . . • • • • . • '28
Pigure 10 Additive and aultiplicative halos in black spruce needles with proxiaity to the Arbour Lake occurrence. ••••..•••••••••••.• 30
Pigure 11 : Variation in concentration of MD. and CU. Pb and Zn as an additive ratio with proxiaity to the Frances Lake aassive sulphide deposi t. • . . • . • • • . • . • . • • . • • • • • . • • • • • . • • 30
Pigure 12 Location of permafrost peat bog cores in vicinity of the Agassiz deposit. .•••••.•••••..• 33
pigure 13 Variation in concentration of As in huaus with proxiaity to the Agassiz deposit. .•. ••.•.• 33
Figure 14 Vertical profiles illustrating the varia-tion in concentration of Mn in peraafrost peat bogs. Agassiz depoisit. •.•..•••••....•...• 35
- iii -

rigure' 15 Vertical profiles illustrating the variation in concentration of Zn in peraafrost peat bogs, Agassiz aeposit. ••..•.•••••• ........ 35
rigure 16 Vertical profUes illustrating the variation in concentration of Pb in peraafrost peat bogs, Agassiz aeposit. .••.•.•••••••••.••.• 36
rigure 17 Vertical profiles illustrating the varia-tion in concentration of CU in peraafrost peat bog., Agassiz aeposit. •••.• .••••• ••••••••• 36
rigure 18 aa.al till saaple locations. Agassiz aepo.it. •••••••••••••••.•.••.•.. •••••••••••.•.• 38
rigure 19 The variation in concentration of Au in the heavy aineral fraction (S.G.~ 2.96) of ba.al till aaaples, Aga.aiz aeposit.
rigure 20 The variation in concentration of CU in tbe Ie.. than 2 aicron .ize fraction of b.s.l till aa.ples, Agaaaiz aepo.it ••.•••••••••
rigure 21 : The variation in concentration of Pb in the Ie.. than 2 aicron .ize fraction of
39
40
ba •• l till a.aplea, Agaaaiz aepoait. ••••• ••• • .••.• 41
rigure 22 : The variation in concentration of Zn in tbe Ie.. than 2 aicron aize fraction of b.a.l till a •• ple., Aga.aiz aeposit. .••.•••••.. 42
rigure 23 The vari.tion in concentr.tion of Ni in tbe Ie.. than 2 aicron size traction of b •• al till ••• ples, Aga •• iz aeposit. •• • •• • ••••. 43
riCJUre 24 The variation in concentration of As in the less tban 2 .icron aize traction of b.s.l till sa.ples, Agassiz deposit. ..••...•..• 44
- iv -
;

•
· •
INTRODUCTION
The application of vegetation geochemist ... y 0 ...
biogeochemist-... y to p ... oblems of mineral exploration in the Lynn Lake a ... ea ... as unde ... taken in an attempt to p ... ovide the mine ... al explo ... ation indust ... y ... ith a geochemical tool applicable to the sea ... ch fo ... bu ... ied 0 ... blind gold mineralization in a ... eas of little 0... no outc ... op. This biogeochemical study fo ... ms pa ... t of a la ... ge ... geological-geochemical investigation conce ... ned ... ith gold mine ... alization in the Lynn Lake area. and in particular the Agassiz Au-Ag deposit.
Geological studies in the Lynn Lake area have defined a sequence of cha ... acteristic ... ock units with a p ... obable strike length of greate ... than 35 km that host the Agassi2 mine ... alization as !Alell as the Dot Lake gold occur ... ences to the ... est and othe ... smaller gold occu ...... ences to the east. Unfo ... tunately, conventional exploration of this metallotect has been ... estricted by the lack of outc ... op.Geophysical investigations have successfully indicated a mo ... e or less continuous linear zone of coincident magnetic and elect ... omagnetic anomalies that impa ... t a cha ... acteristic g ... adiometric signatu ... e to the Agassiz Metallotect. To date. scattered diamond drilling of prima ... ily geophysical ta ... gets along the metallotect has failed to intersect significant gold mine ... alization in terms of g ... ade and tonnage.
The biogeochemical studies !Alere undertaken, therefore, to identify local areas of anomalous geochemistry along the metallotect by examining the definition of the response of pa ... ticular species of vegetation to the trace and minor element content of the overbu ... den developed ouer known gold mine",alization. Characte ... istically, the study area is ma ... ked by the ubiquitous presence of black spruce (Picea ma ... iana) and
1
... 111111111_ .... _____ ---------......... --~--- .~ ... -~~~~---.~.-~---~. - .~.--.--. ,- ... ---~- -
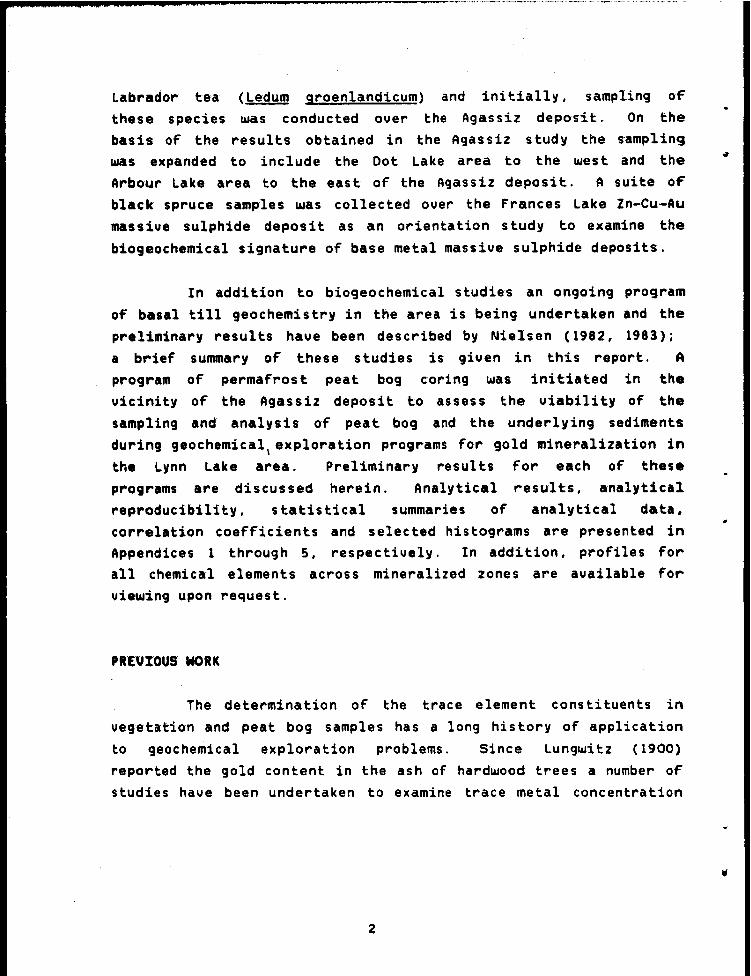
Labrador t'ea (Ledum qroenlandicum) and initially, sampling of' these species was conducted over the Agassiz deposit < On the basis of the results obtained in the Agas siz study the sampling !Alas expanded to include the Dot Lake area to the !Alest and the Arbour Lake area to the east of the Agassiz deposit. A suite of' black spruce samples was collected over the Frances Lake Zn-Cu-Au massive sulphide deposit, as an orientation study to examine the
biogeochemical signature of base metal massive sulphide deposits.
In addition to biogeochemical studies an ongoing program
of basal till geochemistry in the area is being undertaken and the preliminary results have been described by Nielsen (1982, 1983);
a brief summary of these studies is given in this report. A
program of permafrost peat bog coring !Alas initiated in the vicinity of the Agassiz deposit to assess the viability of the sampling and analysis of peat bog and the underlying sediments
during geochemical\ exploration programs for gold mineralization in the Lynn Lake area. Preliminary results for each of these
programs are discussed herein. Analytical results, analytical reproducibility, statistical summaries of analytical data. correlation coefficients and selected histograms are presented in Appendices 1 through 5, respectively. In addition, profiles for all chemical elements across mineralized zones are available for viewing upon request.
PREVIOUS WORK
The determination of the trace element constituents in
vegetation and peat bog samples has a long hi s tory of application
to geochemical exploration problems. Since Lung....,i tz ( 1900)
reported the gold content in the ash of hardwood trees a number or studies have been undertaken to examine trace metal concentration
2
. •
in a variety of plant species. Warren and Delavault (1949; 1955)
and Warren et al. (1955) discussed the application of
biogeochemical exploration methods in northern latitudes and the
problems encountered in sampling and analysiS of samples. Marmo
( 1953) revielAled the application of biogeochemical investigations
in Finland. A literature revielAl concerning the occurrence of gold
in vegetation has been presented by Jones (1970) and the mechanisms of the acquisition and siting of gold by plants is discussed by Girling and Peterson (1978; 1980). The analysis of biogeochemical sample~ by neutron activation analysis is presented
by Schiller et al. (1973). Practical applications of the method in exploration for a ""ide range of mineral commodities have been
described in the literature. Cannon (1960) and Dunn (1983)
describe the application of biogeochemistry to the search for
uranium in the Colorado Plateau and in the Athabasca Sandstone in SaskatchelAlan, respectively. The effectiveness of biogeochemical
surveys in the se~rch for silver is discussed by Hornbrook (1971) in the Cobalt, Ontario area and by Warren et al. (1984) in British
Columbia. Deposits of stratiform Cu-Pb-Zn in South Africa, Australia and Great Britain, Fe deposits in South America and phosphate deposits in Australia and their botanical expressions
are revielAled by Cole (1980). Biogeochemical exploration for gold
in Canada has most recently been discussed by Hoffman and Brooker
(1983) . The biogeochemical expression of metal-bearing till near
HopetolAln, Ontario has been described by Dilabio et a1. (1982).
A significant body of literature also exists for the ~tilization of peat bogs in geochemical exploration. Szalay (1964) describes cation exchange properties of humic acids in peat and Jackson et al. (1978) revie"" numerous aspects of the hydrogeochemistry of naturally occurring organic acids and their
relation to interactions between metal. sediment and waters. Salmi (1955, 1956, 1959) describes the use of peat geochemical
3

surveys a'round titanium, antimony, molybdenum, nickel, copper and
zinc deposits as ",ell as the physico-chemical characteristics of peat. Borovitskii (1970) discusses the successful application of
peat moss sampling in the vicinity of polymetallic and molybdenum deposits in western Transbaikal and the gold ore deposits of Yakutia, U.S.S.R. Meineke et al. (1977) present data from a case history study of a peat geochemical survey associated ",ith
copper-nickel mineralization in Minnesota. Smee (1983) provides a
thorough laboratory and field study on the utilization of organic
soil layers in geochemical exploration in the pr'esence of
lacustrine clay deposits.
In short, there exists numerous examples of vegetation
and peat bog geochemical surveys successfully undertaken in a
variety of climatic and geological environments, world",ide. To
date, the most complete texts describing sampling, analysis, case history descriptions and the design of geochemical exploration
programs utilizing vegetation and peat bog samples are provided by
Brooks (1972; 1983).
REGIONAL GEOLOGY
The regional geology of the
presented by Gilbert e t a1. (1980).
Lynn Lake area has been This report describes the
geology and geochemistry of the rock units that characterize the
Northern and Southern Belts of the Lynn Lake Greenstone Belt. The
following brief summary of the regional geological setting of the
study area is taken from their report. For more detailed
information the reader is referred to Gilbert et al. (1980). A
generalized geological map is presented in Figure 1.
4
III'"
&It
,_,,' ~'"O~~iOQ' <t:.~ .. ~ ~ ~ ;' '-7;: __ VI I •• ::::ES& I
Cl
•
r L -:ua' -II-. -}'\ •.. ~K . .; \ .. . .".J::JP'r--.'-- ~;o ~ ,,- It
(":0.' , ~;~ ~
. ,'·r.,. -64CII2
""y".e '0('.
Stela" Grow,
••••••• d •• OM
...... '~ .... r •••
"'III""IIIIIIDIIIQlIg...... «, ~6·)O·
IOO'I~t'
.'LOttU!Il5 ~ 0 ~ 10 I~ 10 l5 so IIILOMUIIU iHA
•• " ... 6th, D ....... ,_ .. r- Dull ... of L,ft.
I Ra.l.a, "'O~MtC ... -.... Lo'. Ptoi'" .... .ou •
D ........ Gr .. Po." ... to ...... tO., -@Y' H.", •• , T' •• I_iu • .,. Line fOC.~ •
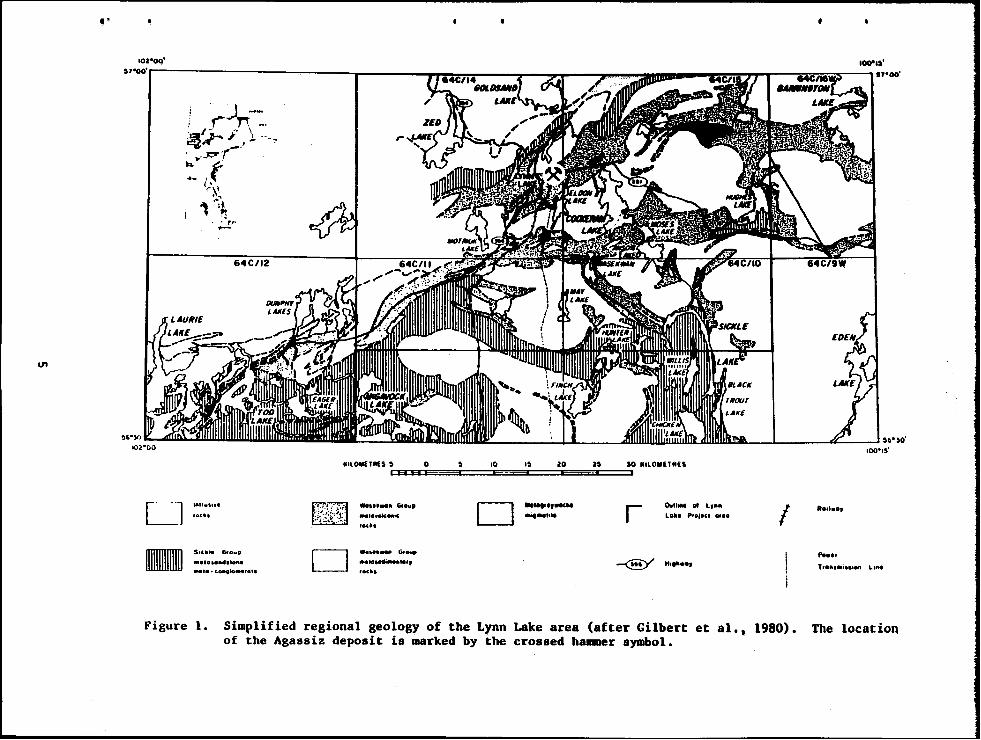
Figure 1. Simplified regional geology of the Lynn Lake area (after Gilbert et al., 1980). The location of the Agassiz deposit is marked by the crossed hammer symbol. .

The Lynn Lake Greenstone Belt is an east-trending sequence of rocks 160 km long and 60 km wide that is characterized
by metamorphosed volcanic, sedimentary and plutonic roc ks with an
Aphebian age of deposition, intrusion and metamorphism (Clark, 1980) . The sedimentary and volcanic rocks have been assigned to the Wasekwan Group (Bateman, 1945) and are unconformably overlain by Sickle Group sandstone and conglomerate (Norman, 1933). FollolAling deposition of the Sickle Group rocks the margins of the greenstone belt lAIere extensively deformed and intruded. Regional metamorphism attained upper greenschist to upper amphibolite conditions.
The Lynn Lake Greenstone Belt is divided into an older Southern Belt and a younger Northern Belt. The Southern Belt is
characterized by greater than 2000 m of tholeiitic, aphyric and porphyritic basalt overlain by discontinous units of sedimentary rocks in the western portion of the belt and a variety of mafic, intermediate and felsic rocks elselAlhere. The Northern Belt is
characterized by mafic volcanic rocks interlayered lAIith felsic and intermediate rock units. The Northern Belt rocks are chemically distinct from those of the Southern Belt and comprise tholeiitic basalt and andesite interlayered with high alumina basalt and
andesite (Al 20 3 ~ 18%). The Northern Belt has been divided into 6 main divisions. These divisions are. from stratigraphic bottom to stratigraphic top:
Division E (450m) basaltic tuff, flow, breccia
Division 0 (900-3300m) basal tic flow, breccia, tuff IoI.Ii th subordinate intermediate and felsic flow, breccia, tuff.
Division C (350m) greYIoI.Iacke, siltstone, conglomerate IoI.Iith subordinate volcanic flow, breccia and tuff.
6

•
D'ivision B (450-2000m) basalt,. andesite, breccia, tuff l.tJith subordinate felsic flow, breccia.
Division A (2500m) rhyolite l.tJi th subordinate mafic to intermediate volcanic rocks.
The biogeochemical study area is centered on the Agassiz
AU-Ag deposit which is hosted by rocks of Division D. These rocks
are described in more detail in the follol.tJing section.
GEOLOGI"CAL SETTING OF THE AGASSIZ AU-AG DEPOSIT
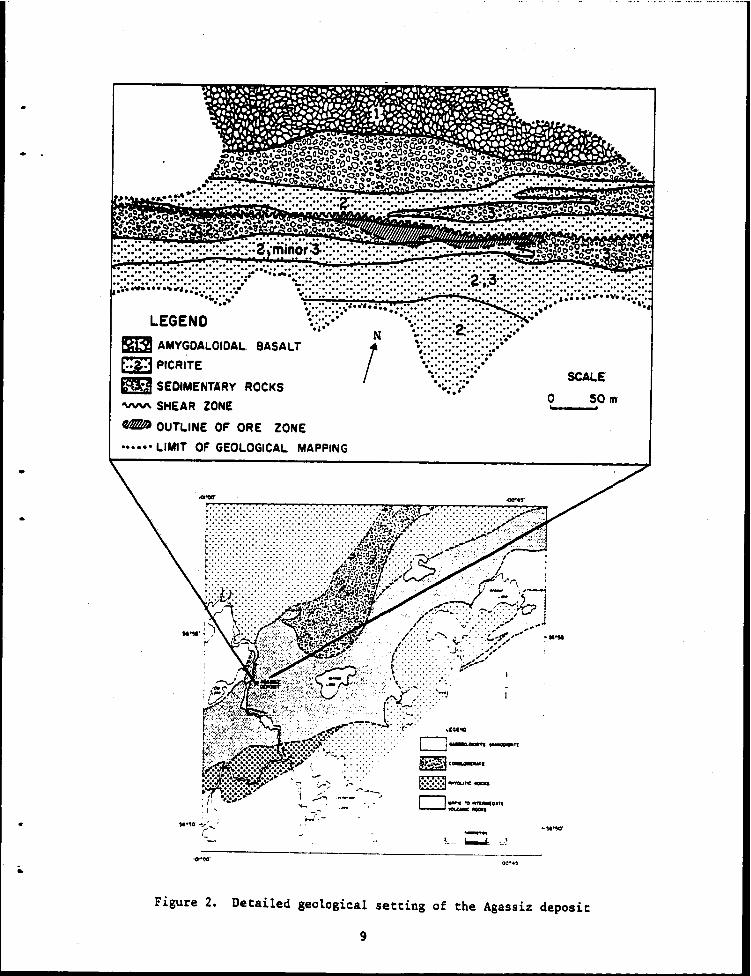
The Agassiz· deposi.t is hosted by a sequence of' steeply dipping clastic and chemical sedimentary rocks interlayered l.tJith
high Mg and Cr mafic rocks that have been interpreted as basalt and basaltic tuff (Gilbert et al., 1980). More recent geochemical studies suggest that these high Mg-Cr rocks may be, in part,
chemical sedimentary rocks.
of the host rocks is in illustrated in Figure 2.
A detailed report on the geochemistry preparation. The local geology is
The clastic sedimentary units and the high Mg-Cr rocks wary in thickness and may range from 8 em to 10 m. Laterally restricted oxide facies (magnetite-chert) iron formation occurs
within the sedimentary units. Gold mineralization in the Agassiz
deposit occurs as discrete particles throughout the host rocks and
at the interface between sulphide and silicate minerals. Ag
occurs in the native form as l.tJell as with freibergi te. Discontinuous quartz-carbonate-sulphide (pyrrhoti te, pyri te,
galena, arsenopyrite, sphalerite) laminae are present in both the clastic sedimentary rocks and the high Mg-Cr mafic rocks. These laminae are interpreted as veinlets that have been boudined and rotated into the N6So E foliation that overprints the rocks.
7

Higher gold' grades are as sociated with these laminae, the highest
gold assays are obtained where these laminae are associated with the clastic sedimentary rocks. Intense but localized zones of
carbonatization occur in the clastic sedimentary roc ks. Solid sulphide layers (10 em thick) of laterally continuous sphalerite
occur within the high Mg-Cr mafic rocks; barren iron sulphide layers are common in the clastic sedimentary rock units. The barren iron sulphide layers and the solid sulphide sphalerite together lAIith the oxide facies iron formation provide a reasonable explanation for the gradiometric signature that characterizes the
Agassiz metallotect.
The stratigraphic sequence at the Agassiz deposit is:
Hanging lAIall
Mineralized Zone
FootlAlall
Aluminous, fragmental flows
amygdaloidal and basalt; mafic debris
Interlayered clastic, sedimentary rocks and mafic rock units
chemical high Mg-Cr
High with rocks
Mg-Cr mafic rocks (basalt) lesser clastic sedimentary
The interlayered clastic and chemical sedimentary rocks and high Mg-Cr mafic rocks characterize the II Agassiz Metallotect II and
. this rock sequence represents the most prospective site for gold
deposition either as syngenetic protore or mobilized, epigenetic mineralization. All biogeochemical surveys related to gold mineralization lAIere conducted over mineralized zones within the
Agassiz Metallotect.
8
LEGEND ~ AMYGDALOIDAL BASALT rn PICRITE
m:l SEDIMENTARY ROCKS
'VVV\. SHEAR ZONE
~ OUTL.INE OF ORE ZONE
•••••• LIMIT OF GEOLOGICAL MAPPING
........................ '
.. .. .. .. N ··:\~@r~~~L ..
, .......... .
! ·*::"::"::"::"::0·· . .. .. .. . .. .. ~::::::::: ::: .. ... .. .•.......• -.. : .1-
_IGlNO
D~ .... · ....... ft
., ...-, ':::-::>'
il~c:-- .... r. ,-
i~ ',I '
''''.1)0'
SCALE
o 50 m "' __ -.or
.. ,.~
Figure 2. Detailed geological setting of the Agassiz deposit
9
BIOGEOCHEMICAL SURUEYS
Introduction
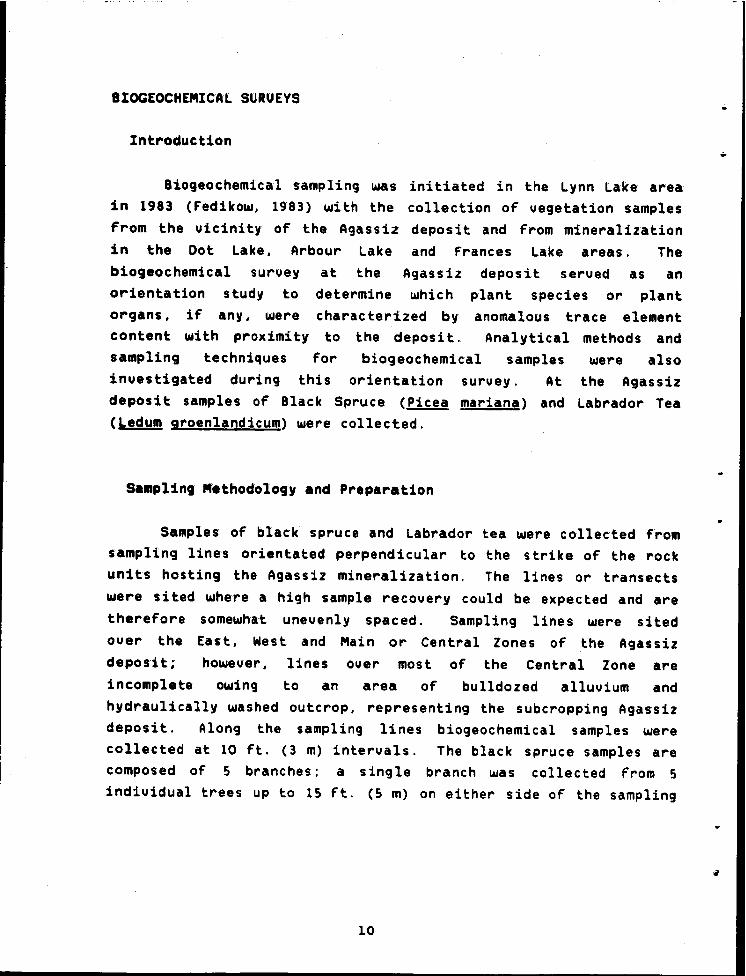
Biogeochemical sampling was init.iat.ed in t.he Lynn Lake area in 1983 (Fediko!Al, 1983) lAIith the collection of vegetation samples from the vicinity of the Agassiz deposit and from mineralization in the Dot Lake, Arbour Lake and Frances Lake areas. The biogeochemical survey at t.he Agassiz deposit. served as an orientation study to determine which plant species or plant organs, if any, lAIere characterized by anomalous trace element content with proximity to the deposit. Analytical methods and sampling techniques for biogeochemical samples lAIere also investigated during t.his orientation survey. At the Agassiz deposit samples of Black Spruce (Picea mariana) and Labrador Tea eLedum groenlandicum) were collected.
Sa.pling M.thodology and Preparation
Samples of black spruce and Labrador tea !Alere collected from sampling lines orientated perpendicular to the strike of t.he rock units hosting the Agassiz mineralization. The lines or transects lAIere sited where a high sample recovery could be expected and are therefore somelAlhat unevenly spaced. Sampling lines lAIere sit.ed over t.he East, West. and Main or Central Zones of the Agassiz deposit; however, lines over most of the Central Zone are
incomplete owing to an area of bulldozed alluvium and hydraulically lAIashed outcrop, representing the suberopping Agassiz deposit. Along t.he sampling lines biogeochemical samples lAIere collected at 10 ft.. (3 m) intervals. The black spruce samples are composed of 5 branches; a single branch lAIas collected from 5 individual trees up to 15 ft. (5 m) on eit.her side of the sampling
LO

.... -.. ---------------...-.~-~~----.~ .. -- ..
line. The branches were collected at chest height and did not exceed 6 mm in diameter. After discarding first year growth from the sample the branches were stored together in pre-labelled, ventilated plastic sample bags and allowed to dry. Following an approximate 3-4 week drying period ,- during which time the needles dropped from the branches, the needles and twigs were separated and stored in labelled, cloth sample bags. Labrador tea was sampled in the same manner as the black spruce. Leaves were separated from stems and stored separately in labelled cloth sample bags.
At the Agassiz deposita total of 368 Black Spruce samples was collected from 12 lines and 67 Labrador Tea samples were collected from 2 sampling lines over the deposit. Figure 3 illustrates the location of the sampling sites with respect to the Agassiz mineralization. Samples used in the orientation survey were collected from line 6551.
Analysis of Biogeochemical Samples
Biogeochemical samples were analyzed using atomic absorption spectrophotometry (AAS) and instrumental neutron activation analysis (INAA). The AAS analyses were undertaken by Bondar-Clegg &. Co. Ltd. (Ottawa) and the INAA by Nuclear Activation Seruices Ltd. (Hamilton). Sample preparat.ion for these analytical methods are described below.
Atomic Absorption Spectrophotometry (AAS)
The technique of atomic absorption spectrophotometry is well established as an inexpensive, rapid analytical tool for the
II

determination of trace metals in geologic materials and therefore the theory of AAS will not be repeated here. Biogeochemical samples analyzed for trace metals by AAS were firs t prepared by milling in a Wiley mill. The pulps were homogenized and a representat-ive split of -20 mesh was prepared according to the specifications f'or the analysis of the elements of interest. For the analysis of Cu, Pb, Zn and Mn a fixed weight of pulp was ashed at 4500 C and the ash digested using a hot HN03 HCl treatment. Au was determined by carbon rod AAS after preconcentration by fire assay and dissolution with agua regia. The per cent ash yield was determined gravimetrically. Analyses by AAS, therefore. are based upon (i) ppm of Cu, Pb, Zn and Mn in ash, and (ii) ppb of Au in raw sample. The reproducabili ty of AAS analyses generally falls within ±20%.
Instrumental Neutron Actiuation Analysis
The application of neutron activation analysis to geolo11ca1 and organic materials has provided the geologist with an analytical technique capable of determining a wide range of chemical elements at low levels of concentration and in an accurate and reproducable manner. This technique allows high sample throughput and the problems of sample loss and contamination are avoided.
The analysis of biogeochemical samples from the area of the Agassiz deposit was, in part, accomplished using direct irradiation instrumental neutron activation analysis for Au, As, Sb, and Zn. The method is described below.
12
...
..

50 0 .. 'i I
100 0"
I
100 , t
CENTRAL OR MAIN ZONE
Biogeochemical .nd humus s.mpl. loc.,ion m.p; Ag.SSll Au-leg tHposil. Slack Spruc. (PICH mlff.n.). L.brador I .. (Ledum groen/.ntllcum) coll«led from tina L65SI.ncJ LWI; humlfled PMt also cotl«ted from LWI: black spruc. s.mplN only coll«ted Irom rem.lfld.r of sampl. fin.s. The 1I0lll0nl., blr repres.nts • smgl. Nmpte locI/lOll on lhe samplIng 1m •.
EAST ZONE
I'\i \ D I~
Figure 3. Biogeochemical sampling sites. Agassiz deposit.
13

Theory
Using instrumental neutron activation analysis CINAR) for biogeochemical samples, such as needles and twigs from black
spruce. requires that the sample is dry and free of inorganic
material. The sample is macerated, homogenized and 8 grams of
material are pressed into a briquette. This briquette is irradiated in a neutron flux by inserting the samples into a nuclear reactor core (such as the SLOWPOKE nuclear generator).
The majority of elements in the sample become radioactive and emit
gamma radiation marked by characteristic wauelengths. After a fixed time of exposure to the neutron flux the sample is removed
and stored in proximity to a gamma-ray detector. This detector is usually a germanium crystal maintained at the temperature of liquid nitrogen. The interaction of gamma-rays being emitted by
the sample with the germanium detector results in the production
of discrete voltage pulses that are proportional in height to the incident gamma-ray energies. The detector is equipped with a multichannel analyzer that separates the uol tage pulses according to size and then digitally constructs a spectrum of gamma-ray energies versus intensities. A comparison of internal standards and spect"ral peak positions and areas allows the qualitatiue and quantitatiue identification of the elements in the sample.
Results
Trace Element Content of Plant Organs
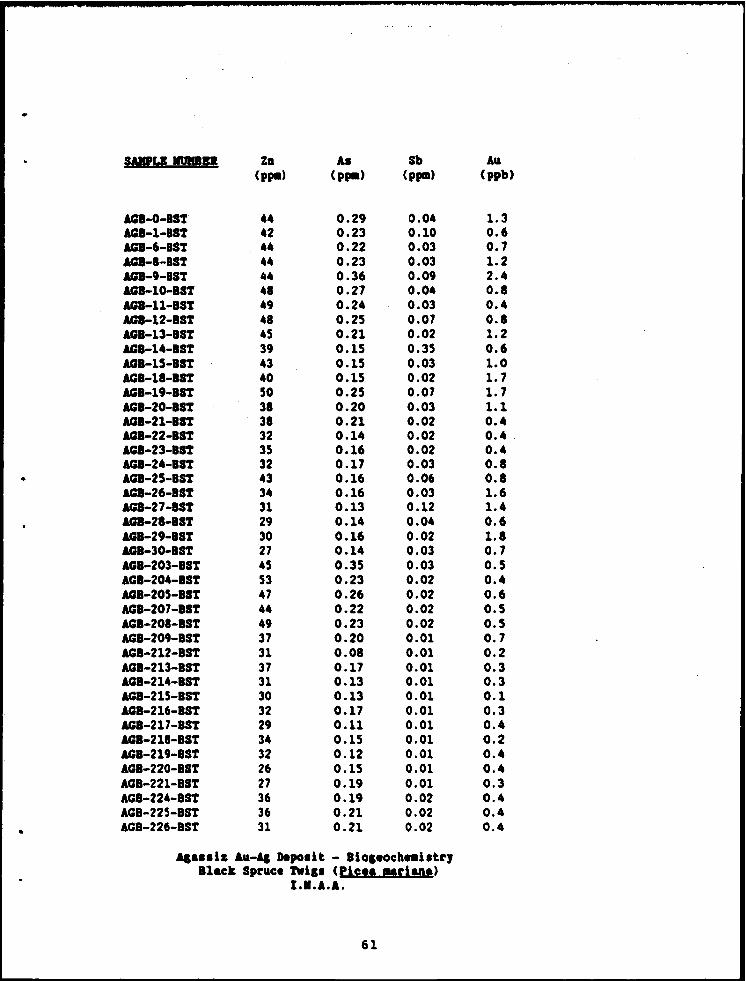
The needles and twigs from 19 samples of black spruce and
the leaves and twigs from 29 samples of Labrador tea collec ted from line 6551 over the Agassiz deposit were analysed for Au, As, Sb and Zn by I.N.A.A. Sb was generally at or below the limits of
14
•
detection for the majority of samples and subsequently is not
discussed further. The results of these analyses are presented in
terms of trace element concentration in needles versus tlAligs for
black spruce and for leaves versus twigs for Labrador tea.
Figures 4, and 5 illustrate the selective enrichment of the
various plant organs in each of the elements of interest. In the black spruce samples Au and Zn are concentrated in the needles whereas the twigs overwhelmingly concentrate As. The results are similar for Labrador tea samples lAIith Au and Zn concentrated in the leaves and As divided equally between leaves and twigs.
In terms of the metal content of the various plant organs
the black spruce needles and the Labrador tea leaves
preferentially accumulate Au and Zn whereas As mayor not be
concentrated in the twigs of both species.
Trace Element Variation .... ith Proximity to the Agassiz Oeposit
Introduction
The follolAling section describes the results of the
geochemical analysis of black spruce, Labrador tea and humified peat samples collected from line 6551 over the Central Zone of the Agassiz deposit. The topography over which these samples were collected is variable. The subcropping exposure of the Agassiz mineralization is located midway on a gently sloping hillside with peat bog to the south and higher ground to the north. The high ground is capped by a thin layer of littoral sand and sandy till
that gradually thickens and is overlain by peat bog dOlAlnslope. Approximately 2/3 of the hillside is overlain by 8 - 10 cm of
humified peat and sphagnum moss that also thickens dOlAlnslope.
This topographic setting indicates the potential for hydromorphic
lS

..
"N Zit ppm
IBN A, ,.",
ISH Au " IIPII
+-T......,r---r-'-r"..,........,.-.,......---.. T 40 .0
'8
Zit II"".
1ST Au IIPb
Figure 4. Comparison of Zn, As and Au contents in Black Spruce needles (BSN) and Black Spruce twigs (BST) (~mariana), Agassiz deposit. Large circle represents more than one sample.
16

•
LTL Zit ppm
--'II~ ___ --.-or--------LTT fO
LTL A. ppm
·f
·f '3
LTL Au ppb
3
f
20 30
'S '7
Zit ppm
LTT A. ppm
LT1 Au ppb
Figure 5. Comparison of Zn, As and Au contents in Labrador Tea Leaves (LTL) and Labrador Tea Twigs (LTT) (Ledum groenlandicum). Agassiz deposit.
17

dispersion of metals From the Agassiz deposit. to a site lower down
the hillside. Consideration must also be given to the presence of waste rock piles located on the higher ground to the north of the study area. Meteoric waters percolating through the waste rock and flowing downslope may be responsible for masking or altering the variation in concentration of trace metals in biogeochemical samples collected from the site of the orientation suruey.
Black Spruce (Picea mariana)
A total of nineteen samples were collected from line 6551
ouer the Central lone of the Agas siz deposit. The samples wel"e divided into needles and twigs and each was analysed separately
for Au, As, S~ and Zn by INAA.
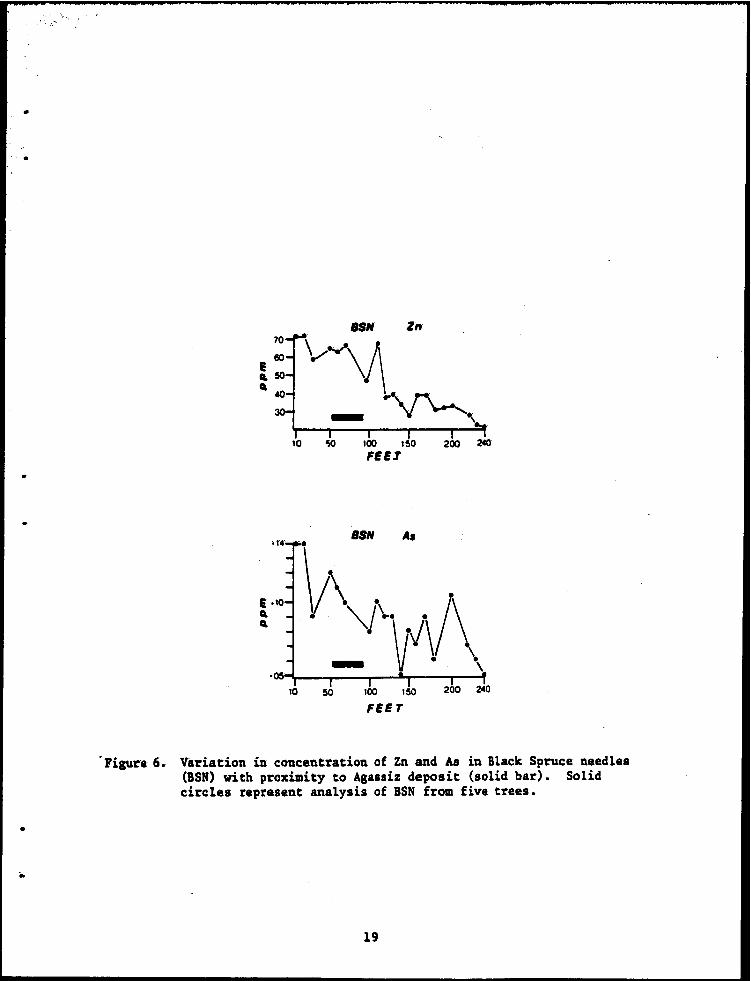
Black spruce needles are charactel"ized by abrupt increases in the Zn and As concentration with proximity to the Agassiz
mineralization (Fig. 6). The increase in Zn ranges fl"om 20 - 45 ppm representing apparent backgl"ound to 45 - 75 ppm ouer the 120
ft. (37 m) anomalous pOl"tion of the tl"end. As giues a less
well-defined anomaly; nevertheless. the increase in concentration is from 0.05 - 0.10 ppm to 0.10 - 0.14 ppm. The In anomaly pl"ogressiuely increases downslope and may be reflecting
hydl"omorphic dispersion of In. enrichment in In at the lip of the peat bog and subsequent uptake by the Black Spruce.
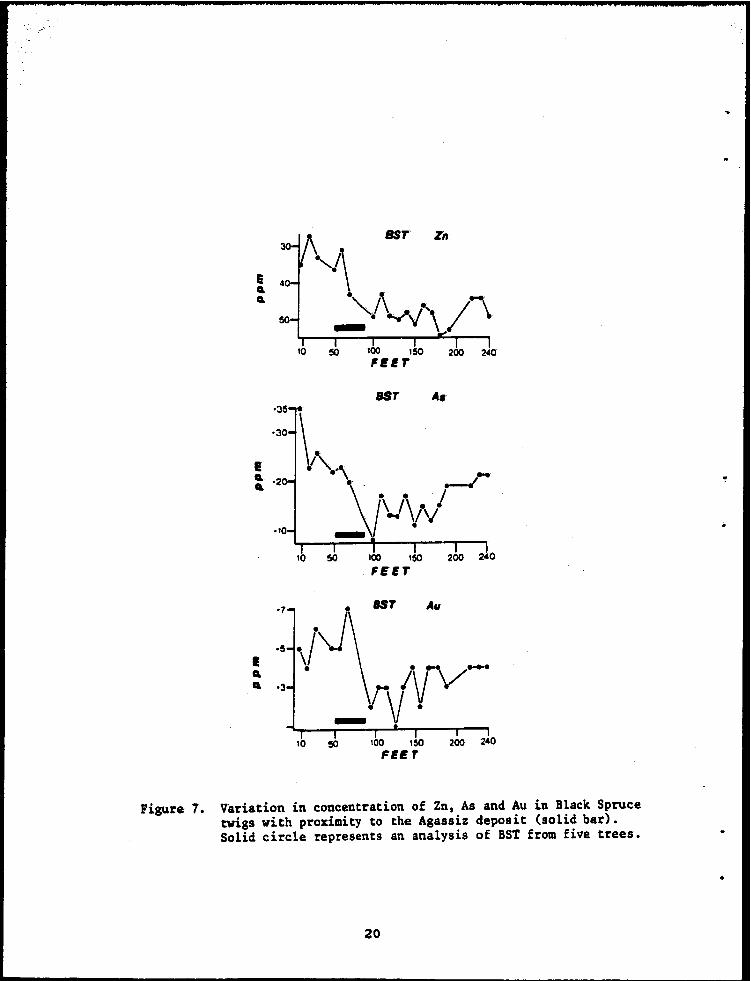
Black spl"uce twigs al"e chal"acterized by mal"ked incl"eases in
the concentration of Au, As and Zn with proximity to
mineralization (Fig. 7). The anomalies occur fol" approximately
100 ft. (30 m) along line 6551. Au incl"eases fl"om 0.1 - 0.4 ppb
to 0.4 - 0.7 ppb; As incl"eases from 0.12 - 0.23 to 0.23 - 0.35;
and Zn incl"eases fl"om 30 - 31 ppm to 38 - 53 ppm. The twigs, as
18
;,
•
•
Zn
10 Iclo I~O FEEr
.14-,.., aSN A,
~ ~ ~ -vV\ · .05 Ii \
10 J Iclo I ~O 2bo 2JO
FEET
'Figure 6. Variation in concentration of Zn and As in Black Spruce needles (BSM) with proximity to Agassiz deposit (solid bar). Solid circles represent analysis of BSM from five trees •
19
SST' Zn
,~ ,L, I 200
I 2.0
FEET
1ST Au
,~ 4 ,~o ,~o FEET
Figure 1. Variation in concentration of Zn, As and Au in Black Spruce twigs with proximity to the Agassiz deposit (solid bar). Solid circle represents an analysis of BST from five trees.
20

------------~~~~~-~-~-~-- .. _.-.-
!Alell as the needles, of the black spruce appear to be reflec·ting anomalous concentrations of Au, As and Zn. These anomalies occur, in part~ over the subcropping Agassiz mineralization but also from black spruce gro!Aling in the edge of the peat bog to the south.
The ability of peat bogs to fix trace metals, in this case from dO!Alnslope migration of metal enriched meteoric !Alaters, may provide
a partial explanation for the observed biogeochemical anomalies in
the black spruce samples.
Labrador tea (Ledum groenlandicum
A total of 30 samples of Labrador tea !Alere collected from line 6551 over the Central Zone of the Agassiz deposit. Each
sample !Alas diuided into leaves and t!Aligs and analyzed for Au, As, Sb and Zn by INAA.
The trace element. content of the labrador tea leaues does
not suggest proximity to mineralization. Progressive increases in
As and Zn concentrations in the leaues occur dO!Alnslope towards the peat bog !Alith the highest As and Zn in leaves from Labrador tea growing in the thickest part of the peat bog. Accompanying this topographic change As increases from 0.10 ppm to 0.10 - 0.40 ppm and Zn increases from 14 ppm to 15 - 22 ppm.
The use of Labrador tea as a biogeochemical sampling medium
to define anomalous concentrations of Au, As, Sb and Zn related to
Agassiz-type mineralization cannot be recommended. As and Zn contents in the leaues and Zn contents in the twigs suggest the
distribution and deposition of trace metals has been modified by hydromorphic dispersion phenomena to such an extent as to mask any anomaly related to the deposit.
21

au '$ $.
Dot Lake Are.
Introduction
An occurrence of a 10 - 20 m thick zone of gold-bea'rin'g' iron sulphide and base metals characterized by high As content (3%) has been outlined by Sherritt Gordon Mines Ltd. in the vicinity of Dot Lake west of the Agassiz deposit. This occurrence is associated with oxide facies iron formation (interlayered chert. magnetite :t iron sulphide). clastic sedimentary rocks and high Mg-Cr basalt. The geological setting of this mineralization indicates it forms part of the "Agassiz Metallotect".
This occurrence was selected for biogeochemical investigations because samples could be collected from a well drained area of high outcrop density over Agassiz-type mineralization. In this way any identifiable patterns of metal enrichment and depletion in the samples could be related to the uptake of metals by vegetation from overburden deueloped over the mineralization without total masking of the trends by drainage phenomena. The thickness of ouerburden in the vicinity of this occurrence is generally less than 0.5 m. Topography slopes gently northwestward ouer the extent of the sampling traverse.
Method
Samples of black spruce needles and twigs were collected along a 450 ft. (137 m) line that cuts the mineralized zone at right angles. The sampling procedure and preparation is consistent with that used for the Agassiz study. Black Spruce needles were analysed for Cu. Pb. Zn and Mn by AAS and the twigs were analysed for Au and As by INAA.
22
Results
Figures 8 illustrates the variation in concentration of Zn and Mn in the black spruce needles and As in the black spruce tlAligs collected from the sampling traverse. The results indicate that patterns of enrichment and depletion in the needles and tLlligs are present IAIith pro~imity to the mineralized zone. Each element is discussed in turn; Cu, Pb and Au are no~ illustrated.
Black Spruce N.·edles
Zinc
A broad halo of zinc in the needles is apparent in Figure 8. The halo is characterized by an increase in Zn concentration from approximately 750 ppm to 2000 ppm LIlith a ma~imum of 2500 ppm corresponding to a sampling point directly ouer the mineralized zone. Increased scatter of the chemical data is obserued LIlith proximity to the mineralization. The halo probably e~tends farther than the limits of sampling.
Manganes.
A marked increase in the Mn concentration occurs ouer a distance of 300 ft. (91 m) along the sampling trauerse LIlith proximity to the mineralized zone. The anomaly is marked by a" increase in concentration from an apparent background concentration of 1.6% to a high of 6%. The westward shift of the anomaly is attributed to the dOlAlnslope hydromorphic dispersion of fIIn; accordingly the westward limits of the anomaly are unknown. Increased uariability of the chemical data with pro~imity to mineralization is observed.
23

.. DOT LAKE
.' h 1\ Zn r I\~. ""'" X
GO
v0~ v\ 4
7 UN
• 5 -1 ·
'·a SST
• Aa """.
·75
• , !\.At·l
·25 ...
f 2 3 if 5 FEET X 100
FIgure 8. Variation in concentration of Zn and Mn in BSN and As in SST, with proximity to the Rushed Showing, Dot Lake area.
24
"

•
•
•
Copper
An irregular,. spiked pattern for Cu is observed along the sampling traverse. Nevertheless, a broadly defined Cu anomaly is present with an increase from 40 - 45 ppm to 70 - 80 ppm in proximi ty to mineralization. Anomalous concentrations of Cu are observed along most of the traverse suggesting that the limits of the anomaly have not been identified.
Lead
Lead concentrations represent. a spatially res'tricted anomaly with respect to the mineralization. The trend is characterized by a general range of 20 - 30 ppm over the most of the traverse with a single sample anomaly of 65 ppm corresponding to a sample collected directly over the mineralization. A secondary seven sample anomaly occurs immediately east of the Single sample anomaly. Overall. anomalous samples represent a spatially restricted zone that is less extensive than the mineralization.
Black Spruce TlAligs
Arsenic
A broadly defined As anomaly is apparent in Figure 8. The anomaly is characterized by a "rabbit's ear" configuration in proKimity to mineralization with As concentrations ranging from 0.9 to 1.1 ppm. The flanks of the anomaly are marked by subtle increases of 0.3 to 0.7 ppm. The limits of the anomaly are undefined .
25

Gold
Generally,. the pattern for the distribution of gold along the sampling traverse is erratic without indication of the presence of mineralization except for a three sample anomaly directly over the mineralized zone. This anomaly has the range of
2.8 - 3.3 pp~ whereas the remainder of the samples have the range 0.4 - 1. 7 ppb. A possible area of interest might be in the
vicinity of the 400 ft. (122 m) station on the sampling trauerse
~here a peak of 3.5 ppb is obtained in association with a variable
(1 - 1.8 ppb) multi-sample data population.
Sunnary
This orientation survey illustrates the variabilHy of Au. As, Cu. Pb, Zn and Mn in black spruce needles and t~igs with proximity to the Dot Lake mineralization. The elements studied
indicate that hydromorphic dispersion of anomalies may occur when
samples are collected from undulating topography (cf. fig. 8; Mn)
and that the configuration of anomalies can be distorted, possibly
by electrochemical processes (cf. Fig. 8; As). The biogeochemical halos are much larger than the mineralized zone; the 10 - 20 m
thick mineralized zone at Dot Lake has both a Zn and an As halo of about 140 m. Biogeochemical samples analyzed for Zn, Mn, Cu and
As would be most useful in defining the overall geochemical
anomaly ~hile Au and Pb could be used to more closely define the mineralization.
26

• Arbour Lake Area
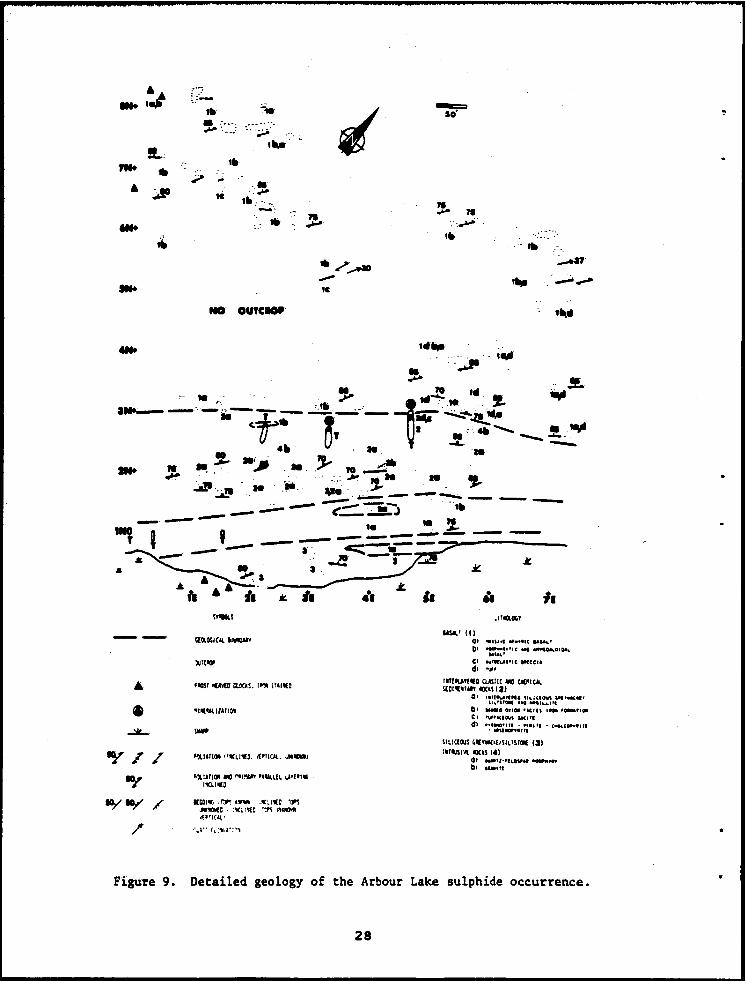
A series of three trenches exposing solid sulphide to near solid sulphide Po - Py mineralization occurs on the northwest
shore of Arbour Lake (Fig. GS-1S-3; Fedikow, 1983). The host rocks for this occurrence are rus ty-weathering siliceous siltstone and "dacite" (Gilbert et al., 1980) overlain by fragment-bearing
basalt and basaltic tuff (Fig. 9). The occurrence forms part of the Agassiz metallotect in the vicinity of Arbour Lake and as such a series of three short biogeochemical sampling traverses were sited in the area. A total of 31 black spruce (Picea mariana)
samples IIIere collected ouer the mineralization. The collection
and preparation of the sample !Alas consistent 1111 th the techniques
used in the Agassiz study. The black spruce needle samples IIIere
ashed and analyzed for Cu, Pb, Zn and Mn by AAS; tllligs IIIere analyzed for Au and As by INAA.
Results
The results of this biogeochemical survey indicate weak to erratic responses in the trace element content of Black Spruce
needles and tllligs !Alith proximity to the predominantly iron sulphide mineralization exposed in the trenches. The indistinct
trace element responses may be attributed to the failure to extend
sampling lines far enough from the zone of mineralization in order to attain "background" geochemical concentrations in the sample.
Another possibility is the lack of available base and precious metal in the overburden, derived from the mineralized zone. If this is true then the biogeochemical samples are indicating the
presence of barren iron sulphides rather than a layer enriched in
base metals and gold. In an attempt to derive more useful
information from the Arbour Lake data multiplicative, additive and
27
... !!..:
• ~
t'--;· : .. ; .....
,It, ;.; ..
!- :::"~: '-::;;,.;. . ' .....
tit '. .:-tit, " -'-
,:: .' NO OU'CIOfI
-= so'
--t. .!L
1110 D ,_ _ __---
• ~ ~ \ ~" ~-~-.. :L----JC---
•
Figure 9.
• ~I __ ---
.& -.' ----,-- J:. r •• - i." -& I. il
"IIlUll1ArrON
'olI.lArrOll110 I't1_ ....... LfL """'101; . l"UIll~
I[cDlor; .r~ ....... :IO("YO."~ JW*MO • :'I(U'I(C .• ~ J1II111M1 t(lr!C",,-'
" .. '" f ~ :"W,"': ....
I. I. I •
• "'.1 ., .. ,,, eau..' ....... '1' ................... ..... '
(I 16I'ta.AI'" lIteCI6 ell ~.
1.l(l\.IltlllD cusrrc 110 WlCAl. IlDI'"'''' ICC" I II
01 I.' ...... ~ ..... "IU.,.., ~'_'" '1"""_.IIO"'I~HI
01 ._a 0". 'tell' .... ' .. ". C. ""'tCloe., *lfI
d' '·'''''''f,· ""'1 . , .... , .... ,rt . "\I.., •• ". IILIC!M ~1Il"l(ISILrUrtll (II l.fOUSI'/{ lOCOS I.'
01 .-,:.,.1.1"" .... , .. ttl " ... ttl
Detailed geology of the Arbour Lake sulphide occurrence.
28
•
•
•
diuiditiue ratios were calculated and plotted for the t~ree
sampling lines. The results of the ratioing of the trace element data marginally improued the response of the samples to the presence of the mineralization. The best indicator was found to be Cu )( Pb )( Zn/Mn which produced a spatially restricted peak or anomaly ouer the mineralized zones and Cu + Pb + Zn/Mn which produced a trough ouer the mineralization (Fig. 10). The Au and As contents of black spruce twigs were ineffective in defining the mineralized zones.
Frances Lake Area
Introduction
A single line of Black Spruce (Picea mariana) samples (n-56) were collected ouer the Frances Lake deposit using the same sample collection and sample preparation procedures as !Alere utilized 'in the Agassiz study. The deposit is represented in diamond drill core by several irregular 1 - 2 m intersections of Zn-Pb-Ag-Au mineralization hosted by siliceous, tuffaceous (reworked pyrocl~stic?) quartz and feldspar phyric volcanic rocks. The deposit is ouerlain by a variety of surficial deposits including peat bog and sandy till. Outcrop is rare in the immediate uicinity of the deposit. Overburden depth is variable, ranging from less than 1 m to 10 m. The sampling line traversed topography varying from sandy till to the north progreSSing southward to gradually thinnin'3 sandy till to sphagnum and peat bog. Black spruce needles were analyzed by AAS for Cu, Pb, Zn, and Mn and black spruce twigs were analyzed for Au and As by INAA.
29

w 0
• •
i 8SH - 14 C I'll 11& 10
f ..... / ....... 6
.~ 11& . \ ::a U 2 .-. j\ '\ --_.
FEET
8SH 8l
j 6
~ " C N + 4
if .. -\ + 2 1"- .-\--::a _/ u - I ri I I I I I I I I
50 100 150
FEET
Figure 10. Additive and multiplicativ. halo in Black Spruce needles with proximity to the Arbour Lake occurrence (solid bar).
9
: ~.'\>~\~ ;rJ #.
C a ,..,~ ..
. • joN ~ ..
I I I 400 6()()
950 c , ~~. c \ +. 550 -r/1.. • .. \"''i yJl ~~ V ~ "\ ~. \t· I · ., t · _I.... .. u 150
Q 20Q 400 600
FEET
Figure 11. Variation in concentration of MD, and Cu, Pb and Zn as an additive ratio with proximity to the Frances Lake massive sulphide deposit, (solid bar), Lynn Lake area.
"
------~-...... --~--~~~ .. ~.
•
•
•
Results
With the exception of Mn, single element profiles lIJere relatively ineffective in defining anomalous geochemical patterns related to the Frances Lake deposit. Within 100 ft. (31 m) of the deposit along the sampling traverse there is a marked increase in the concentration of Mn as well as in the variability of the data (Fig. 11). Directly over the mineralization there is a trough of 4 - 5~ Mn flanked on either side by Mn concentrations ranging from 5.5 - 9~. Additive Cu, Pb, Zn over Mn (Fig. 11) define a discrete peak ~ith troughs on either side o~er a distance of approximately 100 ft. (31 m) centered on the surface proj ection of the mineralization. In this case the geochemically anomalous zone related
ratios ha~e indicated a to mineralization that is
less extensive than the anomaly for Mn. The use of element ratios has not increased the extent, nor has it improved the resolution. of the geochemical anomaly.
PEAT BOG GEOCHEMICAL SURVEYS
Introduction
A total of 28 samples of humified peat were collected from the thin (8 - 10 cm), onlapping edge of a peat bog that overlies and extends south of the Agassiz deposit. The samples ~ere
collected from line 6551 o~er the Central Zone of the Agassiz deposit. The deeper frozen parts of the bog ~ere sampled using a CRREL frozen peat corer which provided 40 samples from 7 cores (Fig. 12). The shallow, non-cored humified peat samples ~ere
collected from line 6551 where black spruce and Labrador tea samples were obtained. Figure 12 illustrates the location of the peat bog cores.
31
Sampling M.~hodology and Preparation
Humified peat samples were collected with a spade at 10 ft. (3 m) intervals along line 6551. These samples were stored in
cloth sample bags and air dried. After drying the sample was
macerated using a Waring commercial blender and a homogenized split removed for analysis. The peat cores were first logged and then split into appropriate sample lengths according to changes in colour, texture or components of the p~at. When no obvious changes were observed sample length averaged 10 cm. As the 10 ... er
portions of the core were frozen (below SO cm) the peat cores ... ere allo ... ed to thaw, the ... ater was drained and the peat allo ... ed to dry. No pH measurements were taken; this measurement will be incorporated in future studies. After drying the peat was
macerated in a Waring commercial blender, homogenized and a split removed for analysis.
An.ly~i. of Peat Sampl.,
Humified peat samples were analyzed for Au, As, Sb and In by INAA and also for Cu, Pb, In, Mn and Au in ash by AAS.
R •• ulb
Part 1: Humified Peat
Figure 13 illustrates the variation in concentration of As in peat samples with proximity to the deposit. The elements Cu,
Pb r In, Mn, Au and Sb were ineffective in defining anomalous patterns or concentrations in humified peat with proximity to the
mineralization. A trough of 10... As concentration forms an
32
..

.... --------------"""---~~~---~- .... - , .. _---~-------_ .... __ ._ ..... _ .. _.-., ._-- ...... --- .. ~.- ..
•
Figure 12. Location of permafrost peat bog cores in vicinity of the Agassiz deposit, Lynn Lake.
3.0
25
As 2.0
p"". I.e
10
50
A, ••• ,.: Humus •
100 150 21)0 250
F •• ,
Figure 13. Variation in concentration of As in humus/humified peat with proximity to the Agassiz deposit (solid bar).
33
approximate 100-foot (30 mineralization. This trough is
1. 5 ppm As and is flanked
m) zone directly over the characterized by a range of 0.7 -on either side by higher As
concentrations ranging from 1.5 ppm to 3.0 ppm. This pattern has ..
been described as a "rabbit-ear" anomaly developed in response to
the secondary dispersion of metals related to the self-potential
effect. This phenomena is discussed in more detail at the end of this report.
'art: 2: Permafrost Peat: Bog Cores
The peat bog samples obtained by coring were analyzed for Cu, Pb, Zn and Mn in ash by AAS after a hot HN0
3 HCl
extraction; Au lAIas analyzed by fire assay (carbon rod) after an aqua regia digestion. Peat bog profiles are presented in Figures 14, 15. 16 and 17.
This part of the peat bog geochemical study represented an orientation survey for a much larger program, namely, the coring of permafrost peat bog associated lAIith the Agassiz Metallotect. The preliminary observations that can be made from the analYSis of the peat cores are:
1. The highest concentration of all metals occurs in the active layer or non-permafrost peat bog IAIhich is usually the upper
SO cm of the cores. An exception to this rule is the peat core
from site AP2. At that location the highest concentrations of Cu,
Zn and Mn appear to increase down the length of the core. This
may be explained in terms of the stratigraphy of the bog IAIhereby the active or upper SO em of the bog upslope from AP2 is equivalent to the deeper portions of the bog in AP2.
34
-.

•
..
•
100 -.I ~ ... III 200 Q
CONCENTRATION
o 250 I I
OJ API
o 200 , 6(X) (} 200 I I I J I I
a I
AP7
",. ppm'
1000 I
Figure 14. Vertical profiles illustrating the variation in concen-' tration of Mn in permafrost peat bogs, Agassiz deposit.
CONCENTRATION
0' 50 , 150 0 100 200 0 1000 I I I J I I I I I I I
100
o ... ~ ~ ~~ AP3
API ~~ 2
0 400 0 1000 0 I I I I I
~ ~ 740
,:r 2000
AP 7 APe
o 100 I I
AP"
1000 I
200 I
Z" ppm
Figure 15. Vertical profiles illustrating the variation in concentration of Zn in permafrost peat bogs, Agassiz deposit.
35

o
tOO
CONCENTRATION
o I
0 I
AP,
100 I
138
100 I
242
~ APS
a 50 L-J
0 I
.:J AP.
o I
100 f
o I
100' I
:::::::::::::r-395 172 ~ -~--~
AI. §r AP4
"" ppIft
100' 0 100 I I I
214 172
190 :=? A" 7
Figure 16. Vertical profiles illustrating the variation in concentration of Pb in permafrost peat bogs. Agauiz deposit.
0' S I I
3:=J o=J AP.
100
CONCENTRATION
0 8 ~ I I I
580
2400
AP7
o f
a I
o a. ~ I I I I I
API
~ ::s _...,... ___ 5'20
Cu Pllm
Figure 17. Vertical profiles illustrating the variation in concentration of Cu in permafrost peat bogs, Agassiz deposit.
36

•
•
2. The high concentration of trace metals in the ac'Uve layer may be the result of contamination from waste rocklmuck at
the Agassiz deposit .
3. The uncons'olidated sandy till underlying the pe'at bog
has very much IOlAler trace element content than the peat, albeit
this observation is based on a single sample.
4. Airborne pollution from past mining activity in the vicinity of Lynn Lake other than at the Agassiz deposit may have
contributed to the levels of trace metals in the active layers of
the peat bog.
BASAL TILL GEOCHEMICAL SURUEYS
A preliminary account of sampling methods, analytical
techniques and results has been presented by Nielsen (1982,
1983). Only the most important results of that survey and the
implications for biogeochemical surveys are discussed here.
Results
Basal till samples were collected from 42 sites at an
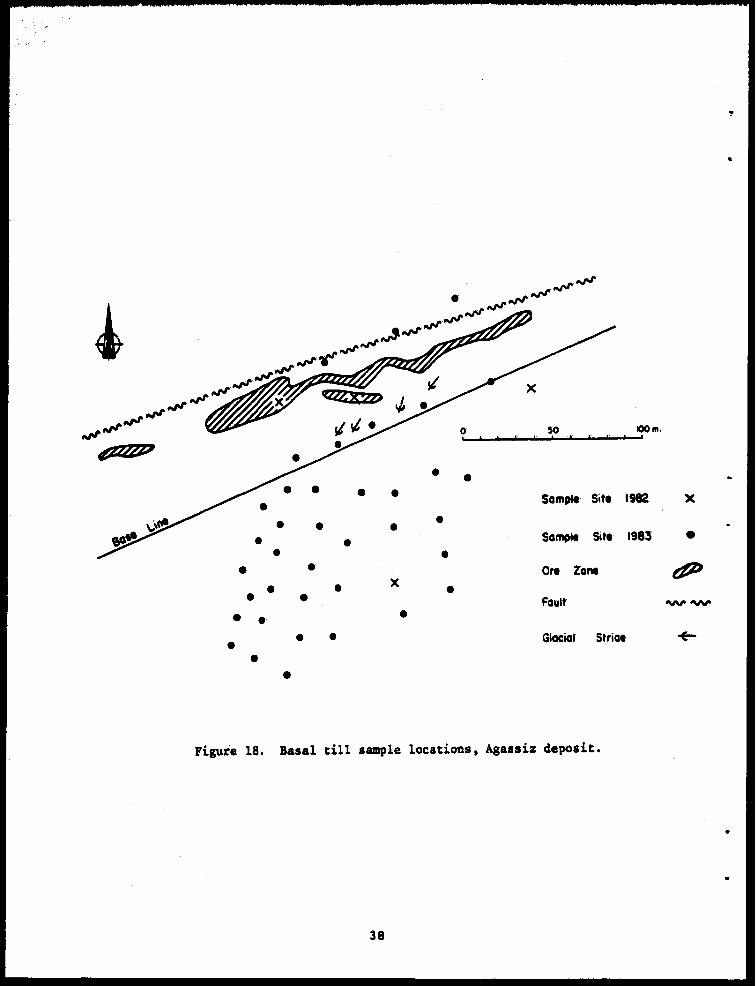
average depth of 1 m using a backhoe and shovel (fig. 18). The
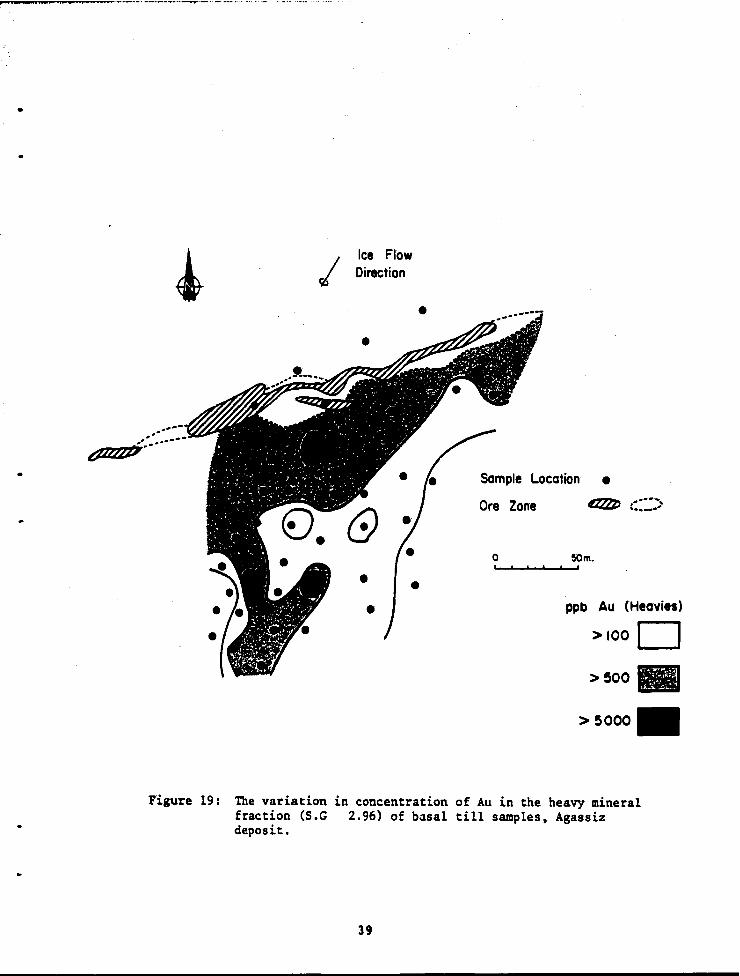
till samples were divided into a heavy mineral fraction (S.C.> 2.96) using a shaker table and heauy liquids and a clay-sized
fraction ( < 2 }J) after centrifuging. The heauy mineral fraction was analyzed by fire assay (carbon rod) and the results for Au
presented in figure 19. The c:: 2 ,.. fraction lAIas analyzed by AAS for
Cu, Ph, Zb and Ni; after an aqua regia digestion; As lAIas
determined colorimetrically. Results for Cu, Pb, Zn, Ni, and As
are presented in figures 20, 21, 22, 23 and 24.
37
•
• • • • • Sampl. S't. 1M2 X
• • • • • Sampl' Sit. 1983 •
• • • • • • • •
0,. Zone tP • Foult 'VV' 'VV'
x
• • • • • • Glaciol Stria • ~
• •
Figure 18. Basal till sample locations. Agassiz deposit.
•
38
•
Ice Flow Direction
• •
•
Sample Location •
Ore Zone
ppb Au (Heavies)
>looD
>~oo.
>5000
Figure 19: The variation in concentration of Au in the heavy mineral fraction (S.G 2.96) of b3sa1 till samples, Agassiz deposit.
39
tce Flow Direction
• •
•
•
sample Location •
Ore Zone
o !Om . .... ' --"-'~"'--"
ppm Cu «2p)
60 D 100
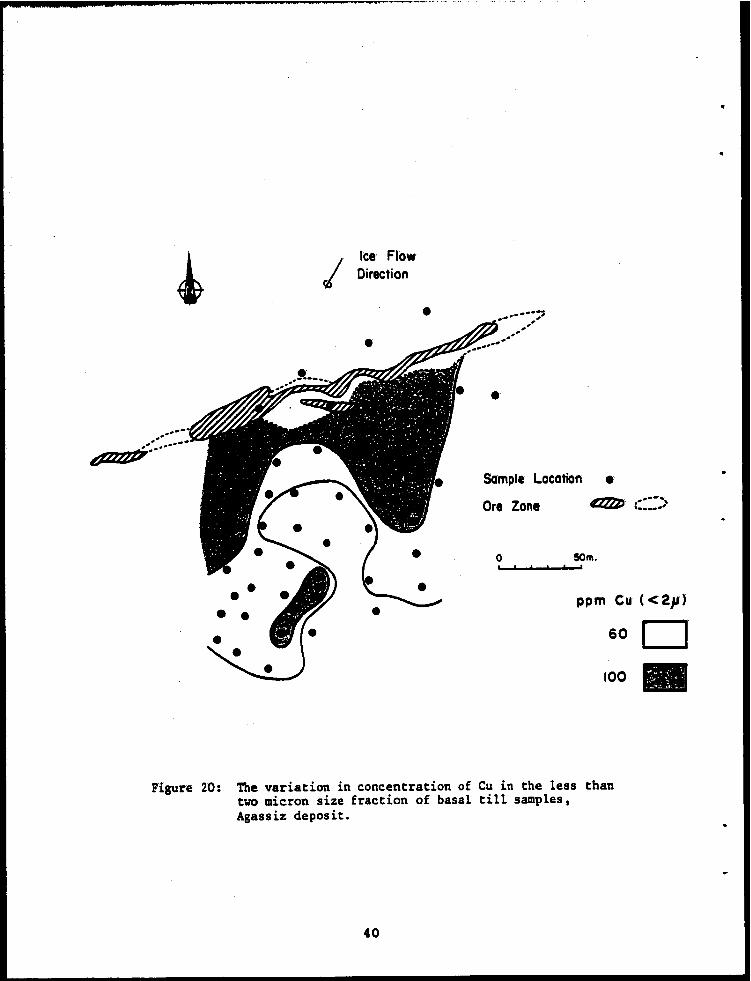
Figure 20: The variation in concentration of Cu in the less than two micron size fraction of basal till samples, Agassiz deposit.
40
~~-------------~-~~~.-- ...
•
•
• • • • • • •
• • •
/
•
Ice Flow Direction
•
•
•
Sample Location •
Ore Zone
o !!Om . 1...' ~ ...... ,,--,,"-,'
ppm Pb «21')
25 0 100.
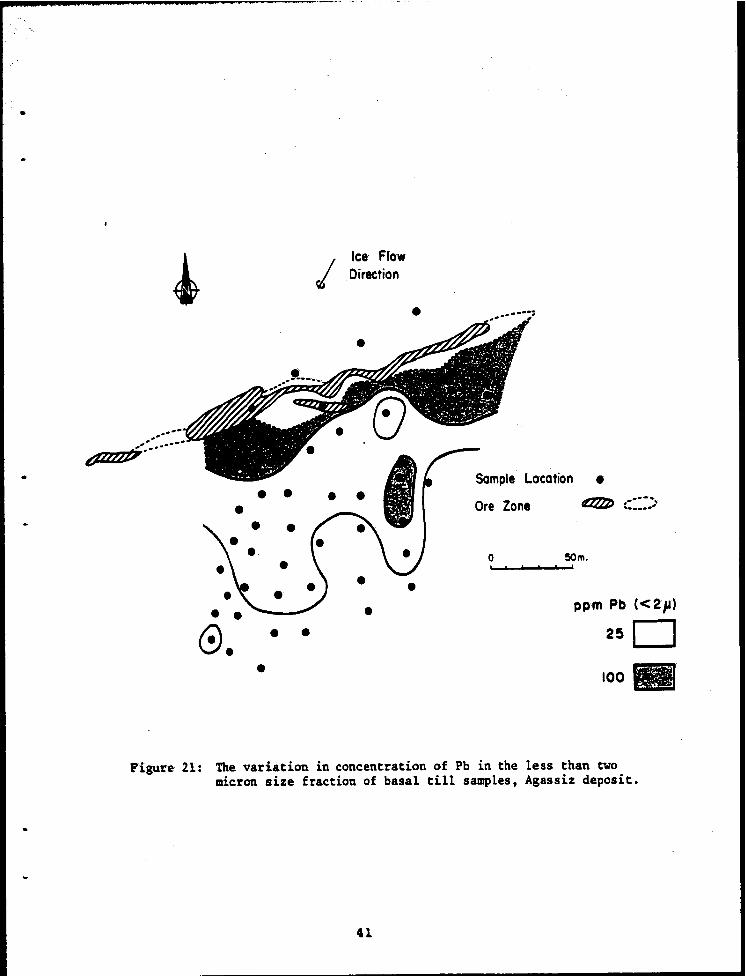
Figure Zl: The variation in concentration of Pb in the less than two micron size fraction of basal till samples, Agassiz deposit.
41
• •
• • • •
Ice Flow Direction
•
• • •
•
Sample Location •
Ore Zone .,.-_ .... " , ____ 1
0 ,
• ppm Zn «2p)
• • • 110 D
200
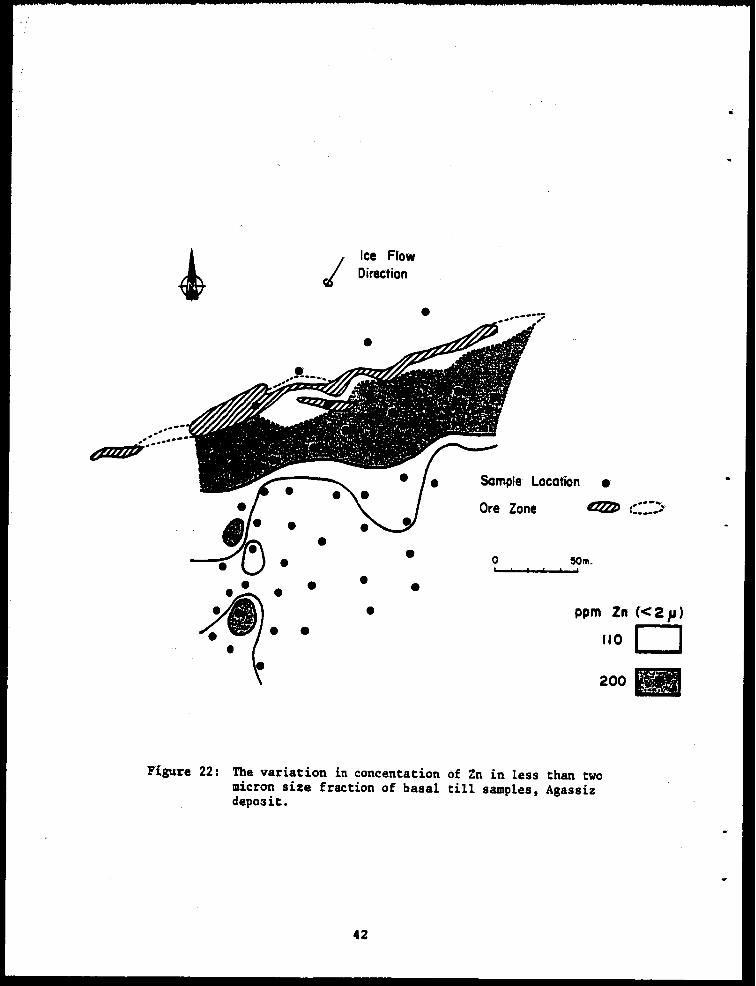
Figure 22: 'nle variation in concentation of Zn in less than two micron size fraction of basal till samples, Agassiz deposit.
42

•
I Ice Flow Direction
• •
•
Sample Location • Ore Zone 0ZlZJ
0 5Om •
ppm NI
50
100
Figure 23: The variation in concentation of Ni in the less than ewo micron size fraction of basal till samples, Agassiz deposit.
43
,:::;;
C<2p)
D

I Ice Flow Direction
• •
• • •
Sample Location •
Ore Zone
0 !SOm. e I
ppm As «2p)
20 D 100
Figure 24: The variation in concentration of As in the less than two micron size fraction of basal till samples, Agassiz deposit.
44
..

An appro)(imate 150 m dispersion Fan of Cu, Pb,. Zn,. Ni, As and Au is reflected in the basal till samples collected down-ice From the Agassiz deposit. The exact definition of this fan is uncertain due to the limited availability of suitable samples;
however, some 400 m to the south across a swamp, basal till samples refl'9ct erratic but anomalously high values for the same suite of elements. This suggests the dispersion fan is, in fact, more extensive than the 150 m depicted in Figures 19 through 24.
In terms of biogeoch'emical surveys. the ouerburden hosting
the root systems of the black spruce is characterized by high
concentrations of a variety of trace elements ~ithin a minimum of
150 m of the mineralized zones. It is not surprising, therefore.
that samples of black spruce needles and twigs reflect high
concentrations of these trace elements. It appears that basal
till sampling provides not only an effective exploration tool For Agassiz-type gold mineralization but aids in the explanation for the source of the high trace metal concentrations in the Black Spruce needle and twig samples in proximity to the mineralized
zones. Although the extent of till deposits associated with the
Agassiz Metallotect is limited to islands of till surrounded by peat bogs these studies can be incorporated into the overall geochemical study and utilized for the effective selection of geochemically anomalous regions.
DISCUSSION
Evaluation of Sampling Technique
Black spruce and labrador tea biogeochemical samples were collected using the same sampling technique. Sampling lines or
transects were orientated perpendicular to the strike of the
4S

mineralization and the host rocks. When more than one line of samples was collected sampling lines were generally equidistant. Sample sites along the lines were 10 ft. (3 m) apart. Initially, this close sample spacing was considered necessary because the magnitude of the response of the trace element concentration in
the uegetation to the trace element content of the ouerburden was
unknolAln. Sampling extended for up to 10 times the thickness of the mineralized zone on either side of the target. The extent of
sampling was considered to be neces sary in order to attempt to
approximate background concentrations of trace elements in the
biogeochemical samples. Each sample consisted of S branches of black spruce or Labrador tea collected from 5 separate trees/shrubs up to 20 ft. (6 m) on either side of the sampling line. The area of influence of the sample at each site along the sampling line is, therefore, 40 ft. (12 m). The sampling line represents, in fact, a 40 ft. (12 m) wide path comprised of 10 ft. (3 m) sampling sites each of which averages S black spruce
trees or Labrador tea bushes. Indiuidual samples were collected
at chest height without regard for the exact age of the branch. The maximum diameter of any branch never exceeded 1/4 inch
(6 mm). Some samples became mouldy during transport, however,
this did not affect trace metal abundance in the sample.
Ideally, samples should be collected from well drained areas from standardized topography, avoiding vegetation in areas of ponded rainwater. The topography inherent to the study area,
however, makes this impossible and samples collected from swampy or poorly drained areas invariably show some differences in trace
metal concentration from samples collected over well drained
outcrop or sand ridges. The results of this orientation study
indicate that the element most affected by drainage is Mn. Samples collected from a gently sloping ridge in the Dot Lake area (cf. Fig. 8, Dot Lake) indicated a Mn anomaly, associated
46
•
with mineralization, that LOas displaced a~proximatelr 150 ft. (46 m) in a downslope direction. to the hydromorphic dispersion of
downslope. Generally. Cu, Pb, Zn,
the same extent as Mn in this ~ay.
This pattern may be attributed
Mn as meteoric waters drained
Au and As were not affected to
Based on preliminary results the sampling technique utlized for this study appears to be suitable. For biogeochemical surveys attempting to define more regional trace element anomalous the sampling procedure should be modified. Because root of vegetation samples may unevenly distribute trace throughout the tree or shrub, one branch of the tree may
zones, systems metals
contain
high trace metal concentration whereas another branch may not. To
avoid "missing" an anomaly 3 or 4 equally spaced branches should
be collected from around the perimeter of each tree wi thin a 10 m2 area. This method has been described and implemented by
Brooks (1983) and is considered to provide a representative analysis of a particular trace metal at a single sampling site .
Evaluation of the Analytical Methods
The methods of analysis utilized for this study were atomic abso~ption and instrumental neutron activation. over mineralized zones were analyzed using techniques with similar results in each case.
Samples collected
both of these Generally, the
absolute concentration of an element in the biogeochemical samples determined by INAA is 10LOer than that by AAS. Matrix interference effects in the AAS scheme may explain this difference. Both methods are, however, acceptable over the more conventional concentration range, say greater than S ppm. The analysis of biogeochemical samples, however, requires lOLOer limits of
detection in the order of 0.1 ppb for gold and 0.2 ppm for As.
47

The analyses must also be reproducible at these lower concentration levels. For this reason the use of INAA has an
advantage in that counting times of irradiated samples may be
adjusted in order to attain the 10lAler limits of detection "'hile ~aintaining reproducability.
For the determination of Cu, Pb, Zn, Fe and Mn in biogeochemical samples the use of AAS will give reproducible
results upon which interpretations regarding trace and minor
element concentrations can be made. Due to the low levels of
concentration of Au and As in the vegetation analyzed for this study the use of INAA is recommended. The INAA results are probably best suited for determining "high" or "101Al"
concentrations of an element since slight inhomogeneities at extremely 101.11 limits of detection may result in non-reproducible results.
Inter-element Relationships
Correlation coefficients for the biogeochemical samples collected from each study area are summarized in Table 1.
Although deriving meaningful information from correlation
coefficients calculated on the basis of small sample populations
is tenuous, some interesUng observations can be dralAln from the data in Table 1. The correlations of Cu and Zn ",ith ash yield (Dot Lake, Arbour Lake, Frances Lake) suggest ash content may be
an important consideration ",hen interpreting Cu and Zn trends from
these three areas and that some form of normalization of trace
element data to a standard LOI concentration, such as:
N element - Element Concentration
( l-LOIl100)
48
•

N r-( 95"; 2 • leled)
q ... i& HUIlitleci Peat 21 .375 (AAI; lNAA)
8S1; 8ST 19 .456 (IIfAA)
l.tL; Lft 30 .361 UNAA)
Dot Lake 8SN; BST 45 .297 (AAS. llIAA)
A1'bour- l.at. 8SN; Bft 31 .356 (AIS; IIIAA)
Pr.ac.. (.au 8SN; BST 56 .254 (AU; IIIAA)
BSN BSt
~tL
Ltt
BSN
Bst
BSN
Bst
BSN
Bst
SIGNIFICANt 1LDD't PAIlS
Au-Pb; AI-Sb Cu-Za; Zn-Aab
Aa-Za Au-Za; Au-u Au-Sb; AI-%a
A.-Za A.-%a
(Cu-Alb) ; (%a-Alb); (Cu-Za)
(Cu-Alb); (Plf-Za'
Cu-Za; ZD-IIa; Zn-Aab (AI-Au)
tab 1. 1 :' Suaarl of correlation coefficients tor deunt pairl in bioseoch_ical I .. plel. N - numbeL" of I .. plel; r - correlation coetrident or .e.lure of relation.hip at 95" conUdence lillitl; BSN - Bl.ck Spruce aeeellel; 8ST - 8lack Spr-uee twisl; US - atollic ablorption Ipeetrophoto.et~; INAA - inltrumental aeutron activation analrlh. Bracketl enelolh, el ... nt pairl indicatel a nesative correlation.
49

may have to be considered. The remainder of the apparently
significant element pairs are explainable in terms of the concentrations of Cu, Pb, Zn, Mn, Au, As and Sb in the overburden
tapped by the root systems of Picea mariana. Nielsen (1983)
indicated heauy metal dispersion fans in a dOlA.ln-ice direction from the Agassiz deposit for a uariety of elements including most of those mentioned aboue. These heavy metal fans characterize the overburden in the uicinity of the study areas; the reflection of these anomalies in biogeochemical samples rooted in the overburden
is not surprising. Further, the correlation between many of the
trace metals indicates that anomalies present in the
biogeochemical samples should be reflected by either of the correlatable elements thereby reducing the number of potential indicator elements that are required for a more regional suruey.
Trace Element Content of Sampling Media
The relative abundance of Zn, Au and Sb in basal till, peat,.
labrador tea and black spruce is given below.
Zn Ti.ll«2,u) :> Humified Peat >aSN :> aST :> LTL:> LTT
Au Till (>2.96S.0.) > Humified Peat:> lTL:> LTT :>BSN :>BST
Sb Humified Peat :> BSN :> aST > L TL :> L TT
In summary, the overburden (till, peat) is marked by
containing higher concentrations of Zn, Au and Sb than the black
spruce and Labrador tea.
50
...
•
•
CONCLUSIONS
This preliminary study, concerned with the chemical analysis of uegetation samples and logically extrapolated to include peat and basal till geochemistry, indicates the following:
1. Blac k spruce (Picea mariana) can be used as a geochemical exploration sampling medium for Agassiz-type gold
mineralization .... hereas Labrador tea (Ledum qroenlandicum) cannot.
2. The needles and twigs of the bla~k spruce as well as the leaues and stems of the Labrador tea selectively concentrate a specific suite of chemical elements.
3. Analysis of these organs in proximity to gold mineralization indicates broad ( )140 m) trace element geochemical
halos which represent a significantly enhanced exploration
target. Biogeochemical samples collected over barren iron
sulphides were unsuccessful in defining anomalous concentrations of Au, As, Cu, Pb, Zn and Mn.
4. Analysis of these materials can be undertaken using AAS and INAA r AAS appears to be more sui table above the concentration range of 5 ppm for Cu, Pb, Zn and Mn; however, INA A can be used to
obtain values indicating high or low concentrations of elements such as Au, As and Sb.
5. In the interpretation
of the variation of trace metals
normalization of trace metals required.
51
of analytical results the problem
with ash yield must be addressed;
to a fixed ash content may be

6., Trace metal anomalies can be distorted by hyd'romorphic dispersion phenomena directly related to the drainage and topography of the study area. Of the elements surveyed in this
study, Mn ",as affected the most by hydromorphic phenomena.
1. The use of peat samples in geochemical exploration
programs for Agassiz-type gold mineralization appears to have application for the definition of geochemically anomalous areas; however, the optimum place to sample a permafrost peat bog (active layer? permafrost?) is, as yet, undetermined. This
suggests the need for continued vertical and lateral profile
sampling of peat bogs.
8. The high chelating or "filtering" capacity of peat bogs
",ith respect to trace elements indicates the need for an
unders tanding of the ground",ater flolAl regime in the study area. The edge or lip of peat bogs "'ill undoubtedly reflect high trace metal content due to scavenging from ground",ater runoff.
9. Selective digestions "'ill be analyses in order to distinguish betlAleen hydromorphically diffused ions that
mineralization.
required for pea't. bog the clastic component and
may be related to
10. Trace metal abundances in each of the sampling media
utilized during this study reflect a progression from high to
lo",er concentrations from basal till to peat to vegetation samples.
11. Extensive statistical manipulation of biogeochemical data !Alas found to be unnecessary in order to make preliminary
interpretations of the data.
52
•

• 12i Basal till sampling represents an effective geachemical
exploration tool in the search for Agassiz-type gold
mineralization. It also provides a partial explanation for the
source of the metals in the biogeochemical samples.
ACKNOWLEDGEMENTS.
I would like to acknowledge the able assistance of Mr. Rob
Charlesworth who was responsible for the bulk of the sampling
conducted for- this study. Monica Guetre is thanked for computer
graphics and statistics. Dis cussions and reference materials made
available by Colin Dunn of the SaskatcheLtJan Geological Survey were
very much appreciated. The assistance of Ron Dilabio of the
Geological Survey of Canada in the initial stages of this study is
gratefully acknowledged as is the ongoing cooperation LtJith
Eric Nielsen, Geological Services Branch, Manitoba Department of
Energy and Mines. This manuscript has benefited from the
constructive criticism of George Gale. The Word Processing Centre
is thanked for typing this report.
53
REFERENCES
Bateman, J.D. 1945: McUeigh Lake area, Manitoba; Geological Survey of
Canada Paper 45-14.
Borovitskii, V.P. 1910: The application of" bog sampling in prospecting for
are deposits in perennial frost regions; Journal of Geochemical Exploration, v. 5, no. 1, p. 67-10.
Brooks, R.R. 1972: Geobotany
exploration; and biogeo'chemistry in mineral Harper and Ro~, Ne~ York.
1983: Biological methods of prospecting for minerals: Harper and Ro~, Ne~ York.
Cannon, H.L. 1960: The development of botanical methods of prospecting'
for uranium on the Colorado Plateau; United States Geological Survey Bulletin, lOSS-A.
Clark, G. 1980: Rubidium-strontium geochronology in the Lynn lake
greenstone belt, northwestern Manitoba; Mani toba Mineral Resources Division, Geological Paper GP80-2.
Cole, M.M. 1980: Geobotanieal expression of orebodies; Transactions
of the Institute of Mining and Metallurgy, v.89, p. 1373 - 1399.
Oilabio r R.N.W., Rencz, A.N., and Egginton, P.A. 1982: Biogeochemical expression of a
train of metalliferous till near Canadian Journal of Earth p. 2297-2305.
S4
classic dispersal Hopetown, Ontario;
Sciences, v.19,
•

•
•
..
Dunn, C.E. 1983: The biogeochemical expression of deeply buried
uranium mineralization in Saskatchewan, Canada; Journal of Geochemical E~ploration, v.1S, p. 417-452.
Fedikow, M.A.F. 1983: Geological and geochemical studies at
Au-Ag deposit, Lynn Lake, Manitoba; Mineral Resources Division, Report Activities, 1983, p. 94-97.
Gilbert, H.P., Syme, E.C. and Zwanzig, H.V.
the Agassiz in Manitoba -of Field
1980: Geology of the metavolcanic and uolcaniclastic metasedimentary rocks in the Lynn Lake area; Manit~ba Mineral Resources Diuision, Geological Paper GP80-1.
Girling, C.A., and Peterson, P.J. 1978: Uptake, transport and localization of gold in
plants; Trace Substance. In Environmental Health, u.12, p .. 105-118.
1980: Gold in plants; Gold Bulletin, v. 13(4), p. 151-157 .
Hoffman, E.L. and Brooker. E.J. 1983: Biogeochemical prospecting for gold
some Canadian gold deposits; in: Biological Systems and Mineral Symposium, 1983, U.C.L.A.
Hornbrook, E.W.
wi th reference to Organic Matter,
Exploration A
1971: Effectiveness of geochemical and biogeochemical exploration methods in the Cobalt area, Ontario; in: Geochemical Exploration (ed. R.W. Boyle and J.I. McGerrigle), Canadian Institute of Mining and Metallurgy, Special Volume 11, p. 435-443.
Jackson, K.S., Jonasson, l.R., and Skippen, G.B. 1978: The nature of metals-sediment-water interactions in
freshwater bodies, with emphasis on the role of organic matter; Earth-Science Reviews, v. 14, 97-146 .
55

;a PC .. 4 $I
10nes, R.S. 1970: Gold content of water, plants and animals; United •
States Geological Survey, Information Circular 625.
LunglAlitz, E.E. 1900: The lixiviation of gold deposits by vegetation and
its geological importance; Mining Journal, London, pp.318-319.
Marmo, U. 1953: Biogeochemical investigations in Finland; Economic
Geology, v. 48, no. 3, p. 211-224.
Meineke. D.G .• Uadis, M.K. and Klaysmat. A.W. 1977: Pilot study on peat exploration geochemistry. Birch
Lake area. Lake County, Minnesota; Minnesota Department of Natural Resources. Report 108-1.
Nielsen. E. 1982: Overburden sampling in the Lynn Lake area; in:
Manitoba Mineral Resources Division ,. Report of Field Activities, 1982. p. 81-83.
1983: Overburden sampling in the Lynn Lake area, Manitoba; Manitoba Mineral Resources Division. Report of Field Activities. 1983, p. 98-100.
Norman. C.W.H. 1933 : Granville
Geological p. 23-41.
Lake district. northern Manitoba; Survey of Canada. Summary Report. Part C, Maps 301A (1934). 343A, 344A (1936).
Salmi. M. 1955: Prospecting for bog-covered ore by means of peat
investigations. Bulletin de la Commission Geologique de Finlande. no. 169.
1956: Peat and bog plants as indicators of ore minerals in Vihanti ore field in western Finland; Bulletin de la Commission Geologique de Finlande. no. 175.
1959: On peat-chemical prospecting in Finland; International Geological Congress, XX Ses sion. Sym. de Exploration Geoquimica, Tomo 2, Mexico. p. 243-254.
56

• Schiller, P .. , Cook, G.B., Kit.zinger-Skalova, A. and Wolfl, E.
1973: The influence of the season variation for gold determination in plants by neutron activation analysis; Radiochemical and Radioanalytical Letters, v.13, no.5-6. p. 283-286.
Smee, B.W., 1983 :
Szalay, A. 1964:
Laboratory and field evidence in support of electrogeochemically enhanced migration of through glaciolacustrine sediment; Journal Geochemical Exploration, u. 19, p. 277-304.
Cation exchange properties of humic acids and importance in the geochemical enrichment of and other cations; Geochimica et Cosmochimica v.28, p. 1605-1614.
Warren, H.U .• and Oelauault, R.E.
the ions
of
their U02++ Acta,
1949: Further studies in biogeochemistry; Bulletin of the Geological Society of America, v.60, p. 531-56.
1955: Biogeochemical prospecting in northern latitudes. Transactions of the Royal Society of Canada, XLIX, Series III, u.66, Section IV, p. 229-238
Warren. H.V., Oelauault, R.E., and Fortescue, l.A.C. 1965: Sampling in biogeochemis try; Bulletin of the
Geological Society of America, v.66, p. 229-238.
Warren" H.V., Horsky, S.J. and Barakso, J.J. 1984: Preliminary studies of the biogeochemistry of silver
in British Columbia. Bulletin of the Canadian Institute of Mining and Metallurgy, v. 77, no. 863, p. 95-98.
57

Appendix 1 Analytical Results
Part 1 Black Spruce Needles and Twigs, Agassiz Deposit
Part 2 Labrador Tea Leaves and Twigs, Agassiz Deposit
Part 3 Bumus/Humified Peat, Agassiz Deposit
Part 4 Black Spruce Needles and Twigs, Rushed Showing, Dot Lake
Part 5 Black Spruce Needles and Twigs, • Arbour Lake
Part 6 Black Spruce Needles and Twigs, Frances Lake Deposit
•
S9

Part 1 .- Black Spruce Needles and Twigs, . Agassiz Deposit
SAllPIil IIUIIIII ZIl A. Sb Au (p,.) (Ppl) (p(lll) (ppb)
AGI-o-8SJ1 21 0.11 0.01 0.5 AlaI-1-8S1 23 0.10 0.01 0.3 AG8-6-8S1 2. 0.10 0.01 0.7 &G8-1-8S1 .0 0.10 n.eI. 0.5 AGI-9-8S1 30 0.28 0.01 0.4 &G8-10-8S1 35 0.16 n.eI. 0.4 AGI-1l-8S1 23 0.30 0.01 0.5 &G8-12-IS1 32 0.51 n.eI. 0.1 AGI-13-IS1 36 0.31 0.01 0.8 &G1-1.-IS1 33 0.23 n.eI. 0.3 &G1-15-IS1 32 0.13 n.eI. 0.4 &G1-11-8S1 35 0.06 n.eI. 0.3 &G8-19-IS1 3. 0.10 n.eI. 0.4 &G1-20-IS1 33 0.10 n.eI. 0.6 &G8-21-8S1 37 0.07 0.01 0.5 &G8-Z2-8S1 30 0.07 n.eI. 0.6 AG8-23-8S1 Z5 0.06 0.01 0.3 &G8-Z.-8S1 30 0.01 n.eI. 0.1 &G8-25-8S1 31 0.07 0.01 0.4 &G8-Z6-IS1 Z9 0.12 n.eI. 0.6 AG8-27-8S1 22 0.10 n.eI. 0.4 &G8-Z1-8S1 21 0.06 n.eI. 0.5 &G8-Z9-IS1 20 0.05 n.eI. 0.4 A08-30-8S1 29 0.07 n.eI. 0.5 AGI-Z03-8S1 72 0.14 0.01 0.5 AG8-Z0.-8S1 72 0.14 0.01 0.5 AG8-Z05-8S1 59 0.09 0.01 0.6 &G8-207-8S1 65 0.12 0.02 0.7 &G8-Z01-8S1 63 0.11 0.01 0.8 AG8-209-8S1 67 0.10 n.eI. 0.6 AG8-212-8S1 52 0.08 0.01 0.6 AGI-213-IS1 67 0.10 0.01 0.6 &G8-2U-ISI 31 0.09 0.01 1.1 &G8-215-8S1 40 0.09 0.01 0.6 &G8-216-ISI 34 0.05 0.01 0.4 AOI-217-ISI 28 0.08 n.eI. O.S AGI-218-IS1 39 0.07 n.eI. 0.5 AOI-219-ISI 39 0.09 n.eI. 0.6 AG8-220-IS1 31 0.06 n.eI. 0.5 AGI-221-IS1 32 0.09 n.eI. 1.0 AGI-2Z4-ISN 28 0.07 0.01 0.6 AOI-225-ISI 23 0.06 n.eI. O.S AGI-226-ISN 22 O.OS 0.01 0.4
Ala •• lz AU-AI Depo.lt - Iloseoche.l.tr, • 81ack Spruce leedl.. (Plce. "EllO')
I.I.A.A. a.eI. -. lot eletected, below tbe u.n. of eletection for tbla utlJtictl _tbocl
60
WlPfli. NUllSla ZD AI Sb Au (PPII) (ppa) (ppm) (ppb)
AG8-0-IST .. 0.29 0.0. 1.3 AG8-1-lft U 0.23 0.10 0.6 AG8-6-IST •• 0.22 0.03 0.7 AG8-1-IST •• 0.23 0.03 1.2 AG8-9-IST .. 0.36 0.09 2 .• AG8-10-BST .. 0.27 0.0. 0.1 AG8-11-BST • 9 0.2. 0.03 0 •• AG8-12-Bft .1 0.25 0.07 0.1 AG8-13-BST .5 0.21 0.02 1.2 AG8-U-BST 39 0.15 0.35 0.6 AG8-15-BST .3 0.15 0.03 1.0 AG8-11-BST .0 0.15 0.02 1.7 AG8-19-BST 50 0.25 0.07 1.7 AG8-20-BST 31 0.20 0.03 1.1 AG8-21-IST 31 0.21 0.02 0 •• AG8-22-BST 32 O.U 0.02 0 •• AG8-23-BST 35 0.16 0.02 0 •• AG8-2.-BST 32 0.17 0.03 0.1 AGI-25-BST .3 0.16 0.06 0.1 AG8-26-IST 3. 0.16 0.03 1.6 AG8-27-BST 31 0.13 0.12 1 •• AG8-21-IST 29 0.14 0.0. 0.6 AG8-29-Bft 30 0.16 0.02 1.1 AGB-lO-Bft 27 0.14 0.03 0.7 AG8-203-BST .5 0.35 0.03 0.5 AG8-20.-BST 53 0.23 0.02 0 •• AG8-205-8ST .7 0.26 0.02 0.6 AG8-207-BST •• 0.22 0.02 0.5 AG8-20e-BST .9 0.23 0.02 0.5 AG8-209-BST 37 0.20 0.01 0.7 AG8-212-BST 31 0.01 0.01 0.2 AG8-213-BST 37 0.17 0.01 0.3 AGB-214-B8t 31 0.13 0.01 0.3 AG8-215-BST 30 0.13 0.01 0.1 AG8-216-BST 32 0.17 0.01 0.3 AGB-217-BST 29 0.11 0.01 0 •• AG8-211-Bft 3. 0.15 0.01 0.2 AGB-219-BST 32 0.12 0.01 0 •• AGB-220-BST 26 0.15 0.01 0 •• AGB-221-BST 27 0.19 0.01 0.3 AGB-22.-BST 36 0.19 0.02 0 .• AGB-225-BST 36 0.21 0.02 0 .•
• AGB-226-BS'r 31 0.21 0.02 0 .•
Ala.llz AU-AI Dlpollt - Bloleoch .. lltrJ Black Spruce twill (Plcea "r1aoa)
I ••• A.A.
61

Part 2 .. Labrador Tea Leaves and Twigs, . Agassiz Deposit
SAIIPL& ..... ZIl A8 Sb Au (PIIII) (PPII) (PIIII) (ppb)
AGI-351-lotL 17 0.13 0.01 1.1 AG8-352-lotL 15 0.12 0.01 1.3 AGI-353-lotL 19 0.15 0.02 0.5 AGB-354-lotL 22 0.31 0.01 0.5 AGI-355-lotL 17 0.38 D.d. 1.5 AGI-356-lotL 15 0.12 0.01 0.4 AGI-357-lotL 17 0.10 0.02 0.3 AGB-358-lotL 22 0.13 0.01 1.2 AGI-35'-lotL 19 0.12 0.01 2.1 AGI-360-lotL 15 0.21 0.01 5.7 AGI-361-lotL 18 0.10 0.04 0.9 AGI-362-lotL 14 0.08 0.04 2.3 AGI-363-lotL 14 0.08 0.01 0.& AGI-364-lotL 15 0.07 0.01 1.5 AGI-36S-lotL 13 0.08 0.13 4.4 AGI-366-lotL 15 0.08 0.01 1.4 AGI-36 7 -lotL 14 0.09 0.02 1.7 AGI-361-lotL 15 0.07 0.01 1.2 &G1-369-lotL 15 0.07 0.01 0.4 AGI-370-lotL 13 0.04 0.01 4.2 AGI-371-lotL 11 0.05 0.01 0.5 .1G1-372-lotL 12 0.06 0.01 0.& AGI-373-lotL 13 0.10 0.06 6.1 AGI-374-lotL 16 0.06 0.01 0.9 AGI-375-LtL 16 0.05 0.01 0.5 AGI-376-lotL 14 0.04 0.01 1.1 AGI-37 7 -lotL 12 0.06 0.01 0.& &G1-37&-lotL 15 0.07 D.d. 0.3 AGI-37'-lotI. 14 0.06 D.d. 0.7 &G1-380-lotI. 11 0.03 0.04 5.0 &G1-38l-lotI. 15 0.06 0.03 0.4 &G1-382-lotI. 12 D.d. 0.02 0.4 &G1-383-lotI. 14 0.05 0.01 0.5 &G1-384-lotI. 14 0.07 0.02 0.9 &G1-385-lotI. 18 0.06 0.02 1.0 &G1-386-lotI. 17 0.09 0.01 0.6 &G1-38 7 -loti. 16 0.04 0.01 0.4 &c1-38&-lotI. 15 0.07 0.01 3.3 &C8-389-lotI. 13 0.06 0.01 0.3 &c1-390-lotI. 14 0.03 0.03 1.4 &G1-391-lotI. 17 0.07 0.01 0.3 A.G8-392-LtI. 18 0.08 0.01 0.9 A.G8-393-LtI. 16 0.05 0.02 0.5 A.G8-394-LTL 13 0.06 0.03 0.4 •
62

•
SAllPLI IIUIIIP ZII A. Sb Au (PPII> (PPIt) (PIIII) (ppb)
AGI-395-LtL 15 0.04 0.02 0.6 AGI-396-LtL 15 0.04 0.06 0.1 AGB-397-LtL 11 0.04 0.01 0.3 AGI-391-LtL 11 0.04 0.01 0.3 AGB-399-LtL 13 0.06 0.01 0.5 AGB-400-LtL 11 0.04 0.01 0.5 AGI-401-LtL 10 0.05 0.01 0.4 AGB-402-LtL 12 0.08 0.02 0.6 AGB-403-LtL 13 0.06 0.01 0.7 AGB-404-LtL 15 0.10 n.d. 1.1 AGI-405-LtL 12 0.10 0.02 0.5 AGB-406-LtL 17 0.07 0.01 0.5 AGB-407-LtL 16 0.05 n.d. 0.6 AGB-401-LtL 16 0.09 0.03 5.0 AGB-409-LtL 17 0.09 n.d. 1.9 AGI-41O-LtL 11 0.09 0.01 0.7 AGB-411-LtL 16 0.10 0.01 0.6
AI .. 81& a-AI Depo81 t - Bloleocb_htr, Labrador 1'.a I.eav •• (I.e_ Imglydle.)
I ••• A.A. •••• - .ot detect .. , below tb. U.1t. of nt.eUOD for tbh aaa1,Ucal _tJaod.
63

•
SAIIPLI !lUllBR Zn A. Sb All Pb (PPII) (PPII) (PPII) (ppb) (PPII)
AGB-3S1-Lon 11 0.09 0.01 0.8 AGB-3S2-Ln 15 0.12 0.01 0.6 AGB-3S3-Ln 14 0.01 0.02 0.3 AGB-3S.-Ln 22 0.14 0.01 0.2 AGB-3S5-Ln 18 0.13 n.d. 1.0 AGB-3S6-Ln 19 0.05 0.01 0.3 AGI-3S7-Ln 12 0.07 n.d. 0.3 AGB-3SI-Ln 14 0.06 0.01 1.0 AGB-3S9-Ln 10 0.07 0.04 0.4 AGB-360-Ln 14 0.11 0.01 0.4 AGB-361-Ln 14 0.13 n.d. 0.6 AGB-362-Ln 13 0.06 0.01 0.6 AGB-363-Ln 9 0.10 0.01 0.3 AGB-36.-Ln 13 0.08 0.02 0.8 AGB-365-Ln 14 0.70 n.d. 1.1 AGB-366-Ln 12 0.01 0.01 0.5 AG8-367-Ln 11 0.13 0.02 0.9 AG8-361-Ln 11 0.07 n.d. 0 •• AG8-369-Ln 17 0.01 0.02 0.4 AGB-370-Ln 12 0.06 0.01 2.2 AG8-371-Ln 14 0.06 0.01 0.4 AG8-372-Ln 10 0.07 0.01 0.1 AG8-373-Ln 11 0.04 0.01 1.7 AG8-37.-Ln 19 0.10 0.02 0.9 AG8-375-Ln 17 0.09 n.d. 0.6 AG8-376-Ln 12 0.05 D.d. 0.2 AG8-377-Ln 12 0.05 D.d. 0 •• AG8-371-Ln 15 0.09 D.d. 0.4 AG8-379-Ln 9 0.03 0.10 1.0 AG8-310-Ln I 0.01 0.01 0.9 AG8-311-Ln 15 0.06 0.16 0.5 AG8-312-Ln 17 0.08 0.03 0.4 AGB-313-Ln 11 0.04 D.d. 0.6 AG8-31.-Ln 13 0.06 0.05 0.7 AGB-315-Ln 11 0.05 0.07 0.6 AG8-316-Ln 22 1.0 0.01 1.1 6 AG8-317-Ln 15 0.03 0.01 0.9 6 AGB-311-Lon 13 0.05 0.01 1.5 4 AGB-319-LotT 12 0.03 0.01 1.1 4 AG8-390-LotT 17 0.09 0.01 2.5 6 AG8-391-LotT 21 0.03 0.01 0.7 4 AG8-392-LotT 17 0.03 0.01 0.4 4 AGB-393-LtT 12 0.03 0.01 0.7 6 AGB-394-LotT 19 0.03 0.01 0.9 5
64

SlIP" IUIIID Zil AI Sb Au Pb' (p.,.> (ppa) (ppa) (ppb) (p.,.)
AGI-395-Lft 14 0.6 0.01 1.0 4 AGI-396-Lft 16 0.3 0.01 0.2 4 AG8-397-Lft 14 0.7 0.01 0.5 2 AGI-391-Lft 20 1.1 0.01 o.a 4 AGB-399-Lft 19 1.5 0.01 0.7 4 AGI-400-Lft 13 1.3 0.01 o.a 4 AGI-401-Lft 15 1.7 0.01 1.0 6 AGI-402-Lft I 1.2 0.01 0.7 4 AGl-403-Lft 13 4.0 0.01 0.7 5 AGl-404-Lft 11 2.1 0.01 1.2 6 &GI-40S-Lft 14 2.5 0.01 0.6 2 AGB-406-Lft 12 0.05 D.d. 0.3 AGB-407-Lft 17 0.06 0.01 0.6 AGB-401-Lft 14 0.07 0.03 1.1 AGB-409-Lft 1. 0.01 D.d. 0.7 AGB-410-Lft 15 0.05 . 0.02 0.2 AGB-411-Lft 11 0.10 0.0. 0 ••
AI ... I& Ala-AI Depollt - 8Ioaeocb ... tr, Labrador r •• twill CLtcIga Implydle.)
I ••• &.a. •••• - Dot detect", .1_ t.. U.l tl of detectloD for tbll ua1,tlcal _~od.
65

Part 3 .' HumusIHUmified Peat, . Agassiz Deposit
WlPIII NUllBII eu Pb ZD lID Au A.b Yield (PIIII) (PPII) (PPI) (pplt) (ppb) (ft)
AGB-U2 132 24 14 200 3 26.20 AG8-U3 124 40 76 650 5 12.62 AG8-U5 110 14 42 540 2 19.19 AGB-U5 154 22 54 1100 D.el., 14.17 AGB-U6 106 16 32 1450 2 10.41 AG8-417 74 10 32 920 n.el. 11.85 AG8-418 109 14 31 2435 3 10.45 AGB-419 56 4 26 1150 2 17.38 AG8-420 148 6 26 3000 2 9.11 AG8-421 106 70 30 2200 2 16.11 AG8-422 76 14 21 335 4 12.87 AG8-423 62 12 14 395 2 10.30 AGB-424 64 12 24 94 2 7.37 AG8-U5 114 9 11 78 3 1.41 AG8-426 56 12 21 85 1 11.10 AG8-427 176 24 56 51 1 14.29 AG8-428 136 18 52 27 2 9.71 AG8-429 86 28 28 28 n.el. 12.88 AG8-430 54 12 33 27 1 10.30 AG8-431 78 36 24 34 3 14.45 AG8-432 51 16 32 46 n.el. 7.64 AG8-433 66 18 28 50 1 7.37
, AG8-434 52 16 26 59 2 14.22 AG8-435 78 20 30 94 2 6.17 AG8-436 62 20 30 380 2 5.99 AG8-437 69 19 25 182 2 8.83 AG8-438 68 216 22 640 1 5.78 AG8-439 51 32 20 114 2 7.04
qu.lz Au-Aa Depollt - I_ifl. 'eat Geocll_htr, All
D.eI. - Dot detect •• below tile u.n. of detection for tilt. aaal,Ucal _tllocl.
66

.iii.i.-'.' •• _____ IIl,.,---'. ----""""' ... -------~--.- .--,-,-.-.-........ ., .- .
118" IlUBII ZD AI Sb Au Pb (PPII) (PPII) (PPII) (ppb) (PPII)
~12 11 3.1 0.1 5.0 10 AGI~13 10 2.2 0.2 6.0 • AGII-U. a.el. 1 •• 0.1 6.1 • AG8~15 a 1 •• 0.2 3.9 6 AGI-U6 a.el. 1.7 0.1 3.6 • AGI~17 7 3.6 0.6 9.4 2 AGI-UI a.el. 1.5 0.2 •• 9 3
AGI-"19 13 1.5 0.1 2.8 8
AGII-"20 a.el. 1.4 0.2 2.6 2 AG8~21 5 1.0 0.1 1 •• 2 AGI-"22 7 1.2 0.2 2.5 2 AG8-"23 a.el. 0.7 0.2 3.5 2
AG8-"2" a.el. 0.7 0.1 a.el. 2 AG8-"25 a.el. 1.0 0.2 2.9 2 AGI~26 5 1.7 0.1 2.2 2 AGI-"27 a.el •. 1.0 0.1 2.3 • AGI-"28 5 6.6 0.7 2.1 • AG8-.29 10 2.3 0.3 2.8 2 AGI-.30 a .el.· 2.0 0.1 1.0 2
AGI-"31 a.el. 1.5 0.1 3.1 D.el. AG8-"32 a.el. 2.1 0.3 1.7 2 AG8-"33 5 2.1 0.2 1.8 I.el. &08-.3" a.el. 1.7 7.0 2.2 a.el AGI-"35 a.el. 2.2 0.5 1 •• 2 AGI-"36 a.el. 2.4 0.6 1.9 2 AG8-"37 5 2.0 0 •• 2 .• 2 AG8-.31 a.el. 1.7 0.3 2.1 2 AG8-"39 7 0.8 0.2 1.7 2
&1 .. 11& AM-Aa Depollt - .ualtled Pe.t Geoeb .. lltrJ 1.1.&.&.
D.cI. - Dot cleteetecl. below tbe Ualtl of cleteetloD for tbll u.tJtled _tltCMI.
67
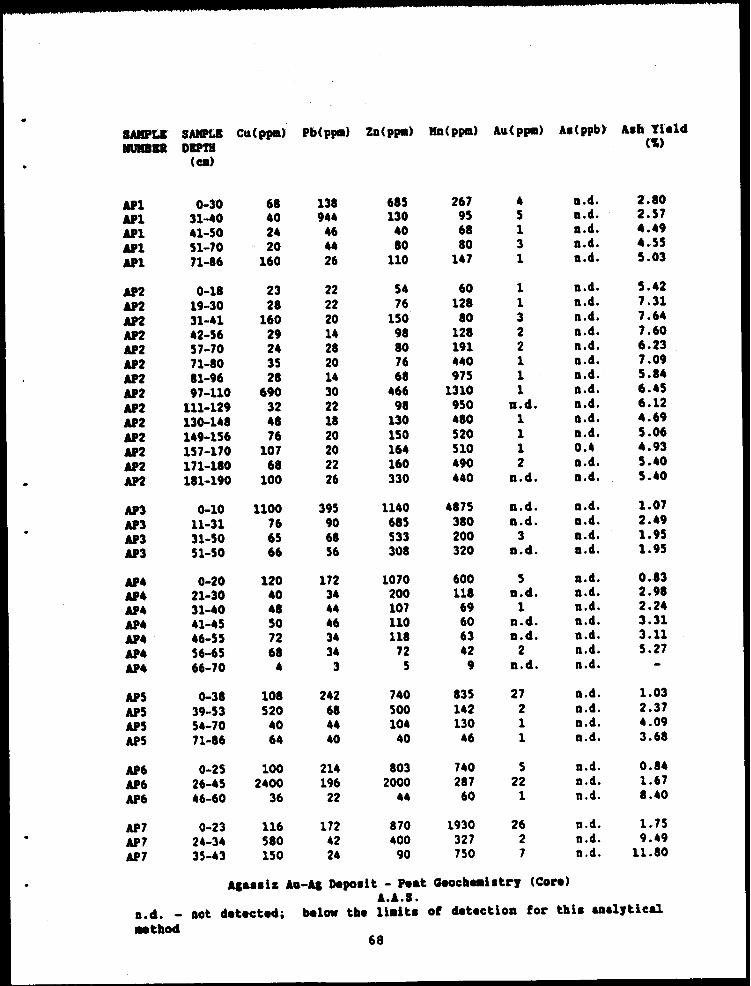
UllPU S_La Cu(ppa) Pb(ppa) ZD(Ppa) lIn(ppa) All ( ppa) AI(ppb) Alh Yield IIUIIIID DIPTH (t.)
(ca)
API 0-30 68 138 685 267 4 D.d. 2.80 API 31-40 40 9U 130 95 5 D.d. 2.57 API 41-50 24 46 40 68 1 D.d. • •• 9 API 51-70 20 •• 80 80 3 D.d. ..55
API 71-86 160 26 110 147 1 D.d. 5.03
AP2 0-18 23 22 54 60 1 D.d. 5.42
AP2 19-30 28 22 76 128 1 D.d. 7.31
AP2 31-41 160 20 150 80 3 D.d. 7.6. AP2 • 2-56 29 14 98 128 2 D.d • 7.60 AP2 57-70 24 28 80 191 2 D.d. 6.23 AP2 71-80 35 20 76 440 1 D.d. 7.09 AP2 81-96 28 14 68 975 1 D.d. 5.8. AP2 97-110 690 30 466 1310 1 D.d. 6.45 AP2 111-129 32 22 98 950 D.el. D.d. 6.12
AP2 130-148 .8 18 130 .80 1 D.d. ..69
AP2 149-156 76 20 150 520 1 D.d. 5.06 AP2 157-170 107 20 164 510 1 0 •• •• 93 AP2 171-180 68 22 160 490 2 D.d. 5.40
AP2 181-190 100 26 330 440 D.d. D.d. 5.40
AP3 0-10 1100 395 1140 4875 D.d. D.d. 1.07 AP3 11-31 76 90 685 380 D.d. D.d. 2.49 AP3 31-50 65 68 533 200 3 D.d. 1.95 AP3 51-50 66 56 308 320 D.d. D.d. 1.95
U4 0-20 120 172 1070 600 5 D.d. 0.83 AP4 21-30 • 0 3 • 200 118 D.d . D.d. 2.98 AP4 31-40 • 8 4. 107 69 1 D.d. 2.2. AP. 41-45 50 • 6 110 60 D.d . D.d. 3.31 AP4 46-55 72 34 118 63 D.d. D.cS. 3.11 AP4 56-65 68 34 72 42 2 D.d. 5.27 U. 66-70 4 3 5 9 D.d. n.d.
AP5 0-38 108 242 740 835 27 n.d. 1.03 AP5 39-53 520 68 500 142 2 n.d. 2.37 AP5 50\-70 .0 U 104 130 1 n.d. 0\.09 AP5 71-86 64 40 40 46 1 D.d. 3.68
AP6 0-25 100 214 803 740 5 D.cS. 0.8. AP6 26-45 2400 196 2000 287 22 n.d. 1.67 AP6 46-60 36 22 •• 60 1 n.cS. 8.40
AP7 0-23 116 172 870 1930 26 n.cS. 1.75 AP7 24-30\ 580 42 400 327 2 n.cS. 9.49 AP7 35-43 150 24 90 750 7 n.d. 11.80
Alalliz AU-AI Depolit - Peat Geoch .. iltry (Care) A.A.S.
D.el. - Dot detectedi below the u.nl of detectioD for thil ual,Ucal _tbacl
68

Part 4 Black Spruce Needles and Twigs, Rushed Showing Dot Lake
SMP" NUlBP CU (pDI) Pb (p.) Zn (p.) 1!L.1l) Asb Tielel (S)
1GI~40-BSII 39 25 1110 3.29 4.85 1GI-4U-8SI1 43 21 940 2.39 4.46 AGI-442-8SI1 U 25 820 3.10 4.17 AGI~43-8SI1 41 22 1110 2.30 4.15 AGI-444-8SN 51 18 990 3.50 3.62 AGI-445-8SI1 46 19 700 3.01 4.42 AGI-446-8SI1 42 26 1055 4.09 4.57 AG8-447-8SI1 40 32 1140 4.20 4.58 AGI-448-BSII 42 17 1335 4.50 4.27 1GI~49-8SI1 67 30 1055 5.25 3.52 AGI~50-8SN 69 27 12S0 3.36 3.27 AGI-451-8SI1 72 20 980 4.98 3.75 AG8-452-BSII 45 24 1335 3.66 4.74 AGI-4S3-8SI1 61 23 1305 5.00 3.85 AGI-454-8SI1 54 22 1770 6.15 4.04 AGI-455-ISN 61 27 1655 3.05 4.26 AGI-456-8SI1 67 21 1535 2.23 3.25 1G1-457-8SI1 73 31 1810 2.14 3.66 AGI-458-8SI1 61 24 1810 3.18 3.62 AG8-459-8SI1 60 19 2270 3.30 3.68 AG8-460-8111 61 23 1575 2.0S 3.44 AG8-461-8SI1 57 24 1885 2.39 3.59 ABG-462-8111 54 23 1655 4.70 3.30 1G1-463-8111 63 21 1885 3.70 3.84 AG8-464-ISI1 72 65 2175 3.25 4.61 AG8-465-8SI1 76 29 2405 1.96 3.04 AG8-466-8SI1 AG8-467-8SI1 67 32 2115 2.95 3.05 AG8-468-BSN 84 28 1615 1.05 3.30 AG8-469-8SI1 79 28 1385 1.80 3.15 &08-470-88N 59 30 1615 1.68 4.14 A08-471-B811 44 29 2075 1.65 5.17 AG8-472-8SI1 57 37 1470 1.26 4.17 AG8-473-8811 53 26 1170 1.22 4.22 AG8-474-8SN 51 22 1690 1.64 4.63 AG8-475-8811 54 22 1440 1.70 4.47 &08-476-88N 64 21 1375 1.55 3.51 A08-477-8SN 60 26 1730 1.85 3.35 A08-478-88N 54 31 1110 1.96 3.92 AOI-479-88N 64 19 960 1.42 4.73 AOI-410-88N 66 26 1110 1.96 3.49 AOI-41l-8SN 50 23 1390 1.85 4.54 AOI-482-18N 49 27 1055 1.60 4.45 AOI-483-ISN 42 24 860 1. 79 4.86 AOI-484-ISN 49 34 1025 1.88 4.83 AOI-485-ISN 45 28 800 1.16 3.69
Dot Late - Iloaeocb .. istrJ 8lack Spruc. lIedl.. (Pic •• IfrllDa)
A.A.S./Asb
69

WlPIiI' IUll8I1 A. All (PIIII) (ppb)
AGB-.40-BSr 0.27 1.4 AGB-4U-8st AGB-442-8Sr 0.30 1.2 AGB-U3-8Sr 0.46 1.4 AGB-444-BSr 0.42 0.8 AGB-O\45-ISr 0.34 0.6 AGB-U6-8st 0.35 1.2 AGB-447-ISr 0.50 1.2 AGB-US-ISr 0.34 0.8 AGI-449-8Sr 0.40 0.6 AGB-450-ISr 0.40 1.4 AGB-451-8st 0.38 0.7 AGB-452-ISr 0.46 0.7 AGB-453-lst 0.53 1.1 AGB-454-lst 0.40 0.8 AGI-455-8Sr 0.73 1.3 AGB-456-ISr 0.56 1.1 AGB-o\57-ISr 0.94 1.6 AGB-45S-8Sr 0.64 0.8 AGI-459-ISr 0.56 2.8 AGB-460-ISr 0.41 3.2 AGB-461-ISr 0.49 1.2 AGB-462-ISr 0.40 0.9 AGB-463-ISr 0.46 1.2 AGI-464-ISr 0.45 3.0 AGB-465-ISr 0.57 0.8 AGB-466-ISr AGI-467-ISr 0.63 0.4 AGB-468-BSr 1.30 0.7 AGB-469-ISr 1.00 1.3 AHB-470-ISr 0.48 0.5 AGB-471-BST 0.40 0.8 AGB-472-ISr 0.52 0.9 AGB-473-ISr 0.60 1.3 AGB-474-ISr 0.38 1.0 AGB-475-BSr 0.37 1.7 AB0-476-ISr 0.29 0.5 AGB-477-BSr 0.45 3.4 AGB-471-BSr 0.32 0.7 AGB-479-BSr 0.38 1.7 AGB-410-BST 0.33 1.2 AGB-481-BSr 0.60 1.6 AGB-482-BSr 0.31 0.9 AGB-483-BST 0.26 1.2 AGB-4"-BSr 0.32 1.8 AGB-485-BSr 0.38 0.5
Dot Late - BloSeGch .. l.trJ Black Sprllc. TWISI (Pic., .. r1ao')
I ••• A.A. 70

Part 5 Black Spruce Needles and Twigs, Arbour Lake
IAMPy IIUIIIIII CU Pb Za lID A8 Au (ppa) ('PIIII) (p,.) (to) (p,.) (ppb)
ALI-l-Un .1 38 2099 1.08 0.19 1.5 ALI-2-Lln 60 3. 1229 0.40 0.23 0.8 AL8-3-L1n 24 18 1637 0.63 0.27 1 •• ALI-4-Lln 22 18 1629 0.75 0.29 0.9 ALI-5-Un 52 58 725 0.14 0.20 0.8 ALI-6-Lln U 50 962 0.29 0.21 1.6 ALI-7-Lln 45 60 1688 0.73 0.30 0.9 ALI-I-Un 60 52 1783 0.73 0.25 1 •• ALI-9-Un 63 86 70. 0.56 0.25 1.0 ALI-l0-Lln .9 29 1766 0.85 0.19 0.8 ALI-ll-L1T3 .1 28 1619 0.75 0.20 1.0 ALI-12-L1n 50 •• 999 1.48 0.16 0.9 ALI-13-L1n 57 138 785 1.40 0.25 1 •• ALI-14-L1n .8 62 902 1.30 0.23 1.1 ALI-IS-Lin .. 38 701 0.79 0.2. 1.3 AL11-16-Lln 3. 38 1156 1.06 0.18 1.0 AL11-17-L1T2 .. 34 1301 0.65 0.19 1.1 ALII-ll-L2T2 .0 24 1706 0.53 0.17 1.0 AL11-19-L2T2 32 28 1445 0.30 0.26 0.6 AL11-20-L2T2 53 25 1765 0.69 0.23 8.6 ALI-21-L2T2 46 142 860 0.90 0.21 2.7 AL11-22-L2T2 .8 56 11.2 0 •• 9 0.19 1.2 ALI-23-L2T2 36 20 1075 1.09 0.17 1.2 ALI-2.-L2T2 6. 26 1319 0.85 0.19 0.9 ALI-25-L3Tl 53 32 1625 1.20 0.17 1.2 ALI-26-L3Tl 53 36 1601 0.79 0.17 0.9 ALI-27-L3T1 46 102 1701 0.82 0.17 0.5 ALI-21-L3Tl 36 66 130. 0.92 0.13 0 •• ALI-29-L3Tl .6 38 21.0 0.64 0.13 1.1 ALI-3a-L3Tl .6 43 979 0.62 0.11 0.8 ALI-31-L3T1 .2 38 959 0.51 0.14 2.7
~boar Lake IloleGcb .. lltrJ Ilack Spruc. .HCIl..I
(CU, n, %a, .. bJ A.A.S. 1. ub) Black Spruc. twlll
(Au, A8 bJ I ••• A.A.) (2aSII .arilll)
71

Part' 6 .' Black Spruce Needles and Twigs, . Frances Lake Deposit
SAIP" IlUllBP Cq (p.) Pb (ppa) Zp (ppa) !I!!.J!) Alb Yield (f.)
rLB-G-BU .5 .. a58 2.55 3.90 rLB-I-BU • 8 .. 611 1.30 3.86 rLB-2-BSI 52 .0 818 1.96 3.72 rLB-3-BSI 52 26 990 1.90 •• 33 rLB __ -BSI 5. 2. 926 1.81 3.61 rL8-5-BSI 52 28 921 1.92 3.69 rL8-6-BU 70 28 11.9 2.18 3.26 rLB-7-BSI 52 3. 1266 2.23 3.53 rLB-I-BSI 52 30 1210 2.83 3.92 rt.I-9-BSI .. 20 1378 3 •• 5 •. 19 rLB-10-BU 56 .7 1273 3.04 3.U rt.I-ll-BSI 52 30 1352 2.95 3.53 rt.I-12-BSI 56 38 1418 3.25 3.99 rLB-13-BU 50 146 1297 3 •• 0 3.02 rLI-1.-BSI 67 70 119. 3.45 3.01 rLI-lS-BD 62 .8 1383 3.06 3.01 rLI-16-ISI 52 131 1253 2.76 2.93 rL8-17-BSI 52 3. 1451 3.00 3.12 rLI-11-BSI 61 68 1303 3.65 2.67 rLB-19-BSI 70 56 1456 3.52 3.61 rL8-20-BSI 63 .2 147. 3.66 2.81 rLB-21-BSI 62 30 1587 3.5a 3.13 rLB-22-BSI 56 38 1150 3.35 3 •• 0 rt.I-23-BSI 50 58 1376 6.33 3.96 rLB-2.-BSI 51 30 11.6 5.31 3.77 rL8-2S-BSI 63 U 10.3 5.58 3.51 rLB-26-BSI 80 72 1310 •. 38 3.42 rL8-27-BSI 70 38 1469 4.68 3 •• 3 PU-21-BSI 60 36 1517 3.93 3.62 rL8-29-BSI 52 28 1452 ••• 5 •• 31 PU-30-BSI 5. .0 1311 •• 72 3.51 rL8-31-BSI 5. 36 15.9 3.70 •• 25 PU-32-BSI 58 30 1377 6.55 •. 05 rt.I-33-BSI 62 32 1514 5.11 3.62 rt.I-3.-BSI 6. 26 153. 1.39 3.93 rL8-35-BSN 63 30 l225 5.80 3.79 PU-36-BSI 57 3. 13.6 •. 60 3 .• 9 rL8-37-BSI 56 2. 12.5 3.60 3.99 PU-38-BSI 60 32 1632 2.20 •. 07 rL8-39-BSN 46 30 1155 2.06 •. 50 rt.I-.O-BSN 69 41 1313 3.31 •. 07 PU-41-BSN 60 60 1587 3.08 4.06 rL8-.2-BSN 80 24 1130 2 •• 0 4.08 rU-43-BSN 65 44 1661 6.35 •. 12 rU-U-BSN 62 38 1511 1.85 3.77
72

. ",r''':.','".
URLIIlUpQ Cu (p.) Pb' Cp.) Zg (p.) lin (~) AU Yi,ld (~)
PLI-45-8S. 62 16 1314 1.95 ".29 PLI-"6-IS. "I 14 11"6 1.91 ".16 PLl-47-8S. 52 "0 193 3.59 4.60 PLI-"1-8S. "0 II 122" 3."0 4.69 PLI-49-8S. 60 30 103" 3."0 3.92 PLI-50-8S. 52 25 1232 ".00 4.65 PLI-51-IS. 50 30 1451 3.99 3.63 PLI-52-8S. 50 72 1121 4.61 4.27 PLI-53-8S. 52 32 13"1 4.08 5.02 rLB-54-8S. 5" "6 1673 5.05 3."2 rLB-55-8S. 5" 32 1"33 6.33 ".21
ft .. e .. Late' Dtpallt - 81oleoc:btdltr, 8lack Spnc. 1I!!d1.. (Pic" MEl y&)
•••• S./Alb
73
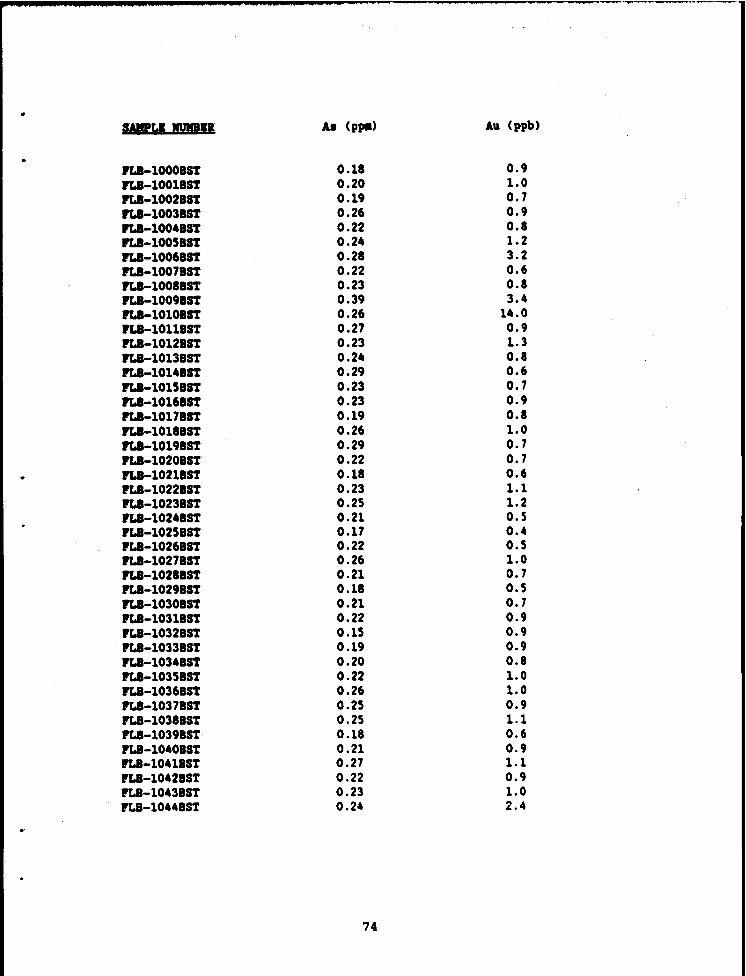
UP" IlUllBII A8 (ppa) All (ppb)
rLB-1OOOIST 0.18 0.9 rLB-1001IST 0.20 1.0 rLB-10021ST 0.19 0.7 rLB-10031ST 0.26 0.9 rLB-1OO.BST 0.22 0.8 rLB-1OO5BST 0.2. 1.2 rLB-1006BST 0.28 3.2 rLB-1007IST 0.22 0.6 rLB-100IBST 0.23 0.8 rLB-10091ST 0.39 3.4 rLB-1010BST 0.26 1 •• 0 rLB-10llBST 0.27 0.9 rLB-1012BST 0.23 1.3 rLB-1013BST 0.2. 0.8 rLB-10l.BST 0.29 0.6 rLB-1015BST 0.23 0.7 rLB-1016BST 0.23 0.9 rLB-1017BST 0.19 0.8 rLB-101IBST 0.26 1.0 rLB-10191ST 0.29 0.7 rLB-1020BST 0.22 0.7 rLB-1021BST 0.18 0.6 rLB-1022BST 0.23 1.1 rLB-1023BST 0.25 1.2 rLB-102.IST 0.21 0.5 rLB-1025BST 0.17 0.4 rLB-1026BST 0.22 0.5 rLB-1027BST 0.26 1.0 rLB-1021BST 0.21 0.7 rLB-1029BST 0.18 0.5 rLB-1030BST 0.21 0.7 rLB-1031BST 0.22 0.9 rLB-1032BST 0.15 0.9 rLB-1033BST 0.19 0.9 rLB-103.BST 0.20 0.8 rLB-1035BST 0.22 1.0 rLB-1036BST 0.26 1.0 rLB-1037BST 0.25 0.9 rLB-1038BST 0.25 1.1 'LB-1039BST 0.18 0.6 'LB-10.OBST 0.21 0.9 rLB-1041BST 0.27 1.1 PLB-10.2BST 0.22 0.9 PLB-10.3BST 0.23 1.0 'La-10.4BST 0.24 2.4
74

SMJ.IIUIIR
PJ.8-1CM5IST PJ.8-10.'IST PJ.8-10.78ST PJ.8-10.'ln PJ.8-10.9IST PJ.8-1050IST PJ.8-1051IST PJ.8-1052IST PJ.8-1053IST PJ.8-105.IST PJ.8-1055IST
U (p(III)
0.22 0.22 0.17 0.18 0.19 0.23 0.20 0.17 0.2. 0.2. 0.32
rruc •• Late· Depolit - Iloc.acb_lItrJ 11ut Spruc. ~ll' (PiCII .rIM')
I .•.•.•.
7S
Au (ppb)
1.4 2.1 1.8 2.5 3.0 1.9 1.9 1.6 1.6 2.8
22.0

• >.~
Appendix 2 Analytical Reproducibility
Part 1 Black Spruee N.edles and Twiql. Aqasllz Depolit
Part 2 Labrador Tea Leavel and Twigl. Aq .. llz Depolit
Part 3 Buaul/Ruai f ted Pea t • Aqas.lz.Depolit
Part " Black Spruce Needle. and Twiq •• RUlhed Showing. Dot Lake
Part S " Black Spruce N.ene. and Twiql. , Arbour Lake
Part' " Black Spruce Neene. and Twiql. , Prancel Lake Deposit
76

Part I Black Spruce Needles and Twiqs. Aqassiz Deposit
SBPLK IlUll8D ZIl (PPI) 'I (pi'll) Sb (Pi'll) A.a' (ppb) 1 2 1 2 1 2 1 2
lGI-20e-BSI 69 57 0.10 0.11 0.01 D.el. 1.1 0 ••
AGB-216-BSI 36 32 0.06 0.0. 0.01 D.el. 0 •• 0 ••
AGI-2Z.-BSI 28 28 0.08 0 .. 06 0.01 0.01 0.6 0.5
Trace ele.eDt reproeluc:ibility of I.N.A.A. data in Black Spruce (Pice. "dag') Deeell.. collected over the Central Zone of the A9 ••• 1z Depolit. 11ne 6551.
UlPY rmpp
AGB-20e-BST
AGB-216-BST
AGB-22.-BSI
Za (PPI) 1 2
•• 5.
33 31
33 38
'I (PPI) 1 2
0.22 0.23
0.17 0.17
0.19 0.19
Sb (PPI) Aa (ppb)
1 2 1 2
0.01 0.02 0.3 0.7
0.·01 0.01 0 •• 0.2
0.02 0.01 0 .• 0 ••
Trace de.ent reproducibility of I.N.A.A. data in Black Spruce (Pice. ..riID') twiqs collected over the Central Zone of the A9.1.1z Depo.it. 11ne 6551.
77
~
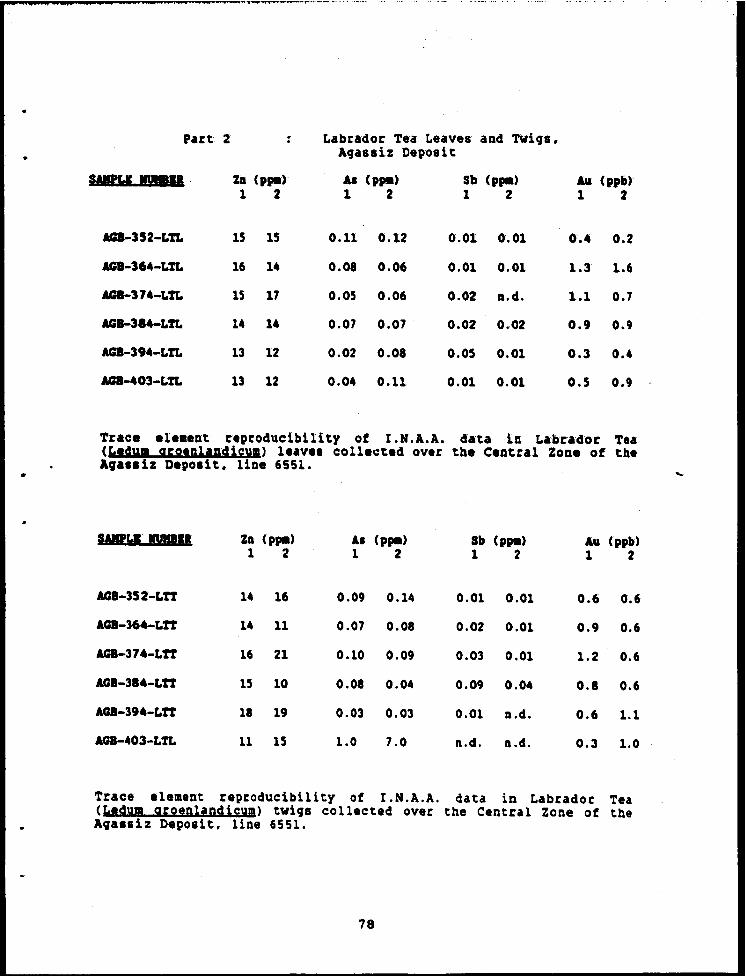
•
Part 2 Labrador Tea Leaves and Twigs. Agassiz Deposi t
IIRY IIUIIIIU . ZD (PPl) AI (PPII) Sb (PPI) All (ppb) 1 2 1 2 1 2 1 2
AGB-352-LtL 15 15 0.11 0.12 0.01 0.01 0.4 0.2
AGB-364-LtL 16 U 0.08 0.06 0.01 0.01 1.3 1.6
AGB-374-LtL 15 17 0.05 0.06 0.02 D.d. 1.1 0.7
AGB-314-LtL U 14 0.07 0.07 0.02 0.02 0.9 0.9
AGB-394-LtL 13 12 0.02 0.08 0.05 0.01 0.3 0 ••
AGB-403-LtL 13 12 0.0. 0.11 0.01 0.01 0.5 0.9
Trace el •• ent reproducibility ot I.N.A.A. data in Labrador Tea (Ledua qroenlandieu.) leave. collected over the Central Zone ot the Aqa •• 1z Depo.it. line 6551 •
SAIII'li. IUDII ZD (PPl) 'I (PPl) Sb (PPII) All (ppb) 1 2 1 2 1 2 1 2
AGB-352:"Ln U 16 0.09 O.U 0.01 0.01 0.6 0.6
AGB-364-Ln U 11 0.07 0.08 0.02 0.01 0.9 0.6
AGB-374-Ln 16 21 0.10 0.09 0.03 0.01 1.2 0.6
AGB-314-Ln 15 10 0.08 0.04 0.09 0.04 0.8 0.6
AGB-394-Ln 18 19 0.03 0.03 0.01 D.d. 0.6 1.1
AGB-.03-LtL 11 15 1.0 7.0 n.d. l1.d. 0.3 1.0
Trace element reproducibility of I.N.A.A. data ia Labrador Tea CLedum qroenlaadieum) twigs collected over the Central Zone ot the Aqa •• iz Deposit. line 6551.
78
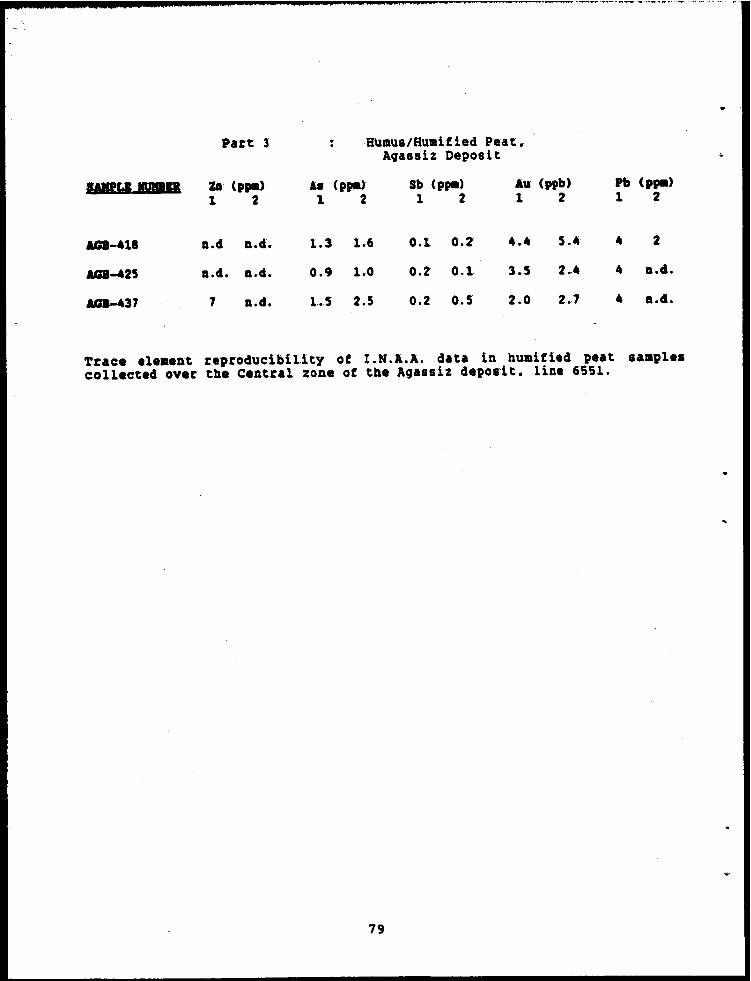
Part: 3 : HUlIlus/HulIlitied Peat. Agassiz Oeposi t
BAllPY IlUBBD ZIt (PPl) '1 (ppa' Sb (ppa) Au (ppb) Pb (PPI) 1 2 1 2 1 2 1 2 1 2
&GI-UI D.eI D.d. 1.3 1.6 0.1 0.2 ••• 5 •• • 2
&GI~25 D.eI. D.d.- 0.9 1.0 0.2 0.1 3.5 2 .• • D.d •
&G1-437 7 D.d. 1.5 2.5 0.2 0.5 2.0 2.7 4 D.eS.
Trace Ile.ent reproducibil.ity ot I.N.A.A. data in humiU,d peat saapl .. collecteeS over the Central zone of the Agassiz deposit. lint 6551.
79
;.
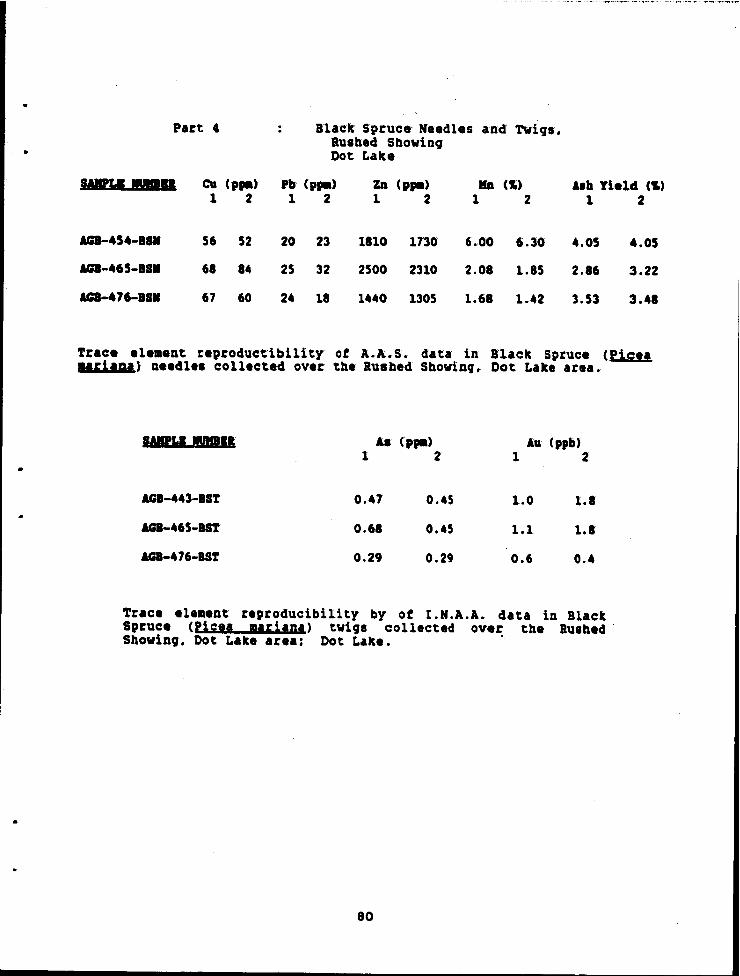
•
Part 4 Black Spruce' Needles and Twigs. Rushed Sbowing Dot Lake
IIIR"--11 CU (PPI) Pb' (PPII) Zn (PPI) lID (I;) Alb Yield (f.) 1 2 1 2 1 2 1 2 1 2
AGI-4S4-8S. 56 52 20 23 1810 1730 6.00 6.30 4.05 4.05
AG8-465-8S. 61 84 25 32 2500 2310 2.08 1.85 2.86 3.22
AG8-476-8S. 67 60 24 18 lUO 1305 1.68 1.42 3.53 3.48
Trace ele.ent reproduct'ibility ot A.A.s. data in Black Spruce (Pieea uriaga ) needle. coUected OVU tbe Rushed Showing" Dot Lake aua.
UllPWI IUll8II Aa (PPII) Au (ppb) 1 2 1 2
AG8-443-BS'f 0.47 0.45 1.0 1.8
AG8-465-BS'f 0.68 0.45 1.1 1.8
AG8-476-BS'f 0.29 0.29 0.6 0.4
Trace ele.ent reproducibility by of I.N.A.A. data in Black Spruce (Picea .. riana) twigs collected over tbe Rusbed Sbowing. Dot Lake area: Dot Lake. •
80

Par~ 5 Black Spruce Needles and Twigs, Arbour Lake
SABPl.I .... O ell (PPI) Ph (PPI) ZD (PPI) IfJI (t;) A.1l Yield (t;) 1 2 1 2 1 2 1 2 1 2
ALB-Io-ISI •• .9 2. 30 1819 1713 0.91 0.91 4.21 3.65
ALB-20-ISII 57 .9 26 24 1691 1832 0.79 0.69 3 •• 0 3.79
ALB-30-ISI 4. 4. 50 36 1027 931 0.98 0.68 3.00 3.07
Trace dellent reproducibili~y of A.A. S. dau in Black Spruce (Pic .. lIariaga) needle.: Arbour Lake area.
Part , . Black Spruce Needl .. and Twig_,. Prance. Lake Depolit
II.y .... U A. (PPI) All (ppb) 1 2 1 2
ALB-I0-BST 0.18 0.19 1.1 0.5
ALB-20-BST 0.25 0.21 14.0 3.1
ALB-30-BST 0.13 0.09 0.7 0.8
Tract eltllent reproducibility of I.N.A.A. data in Black Spruce (Pic.a •• rilDa) twig.: Arbour Lake arta.
81
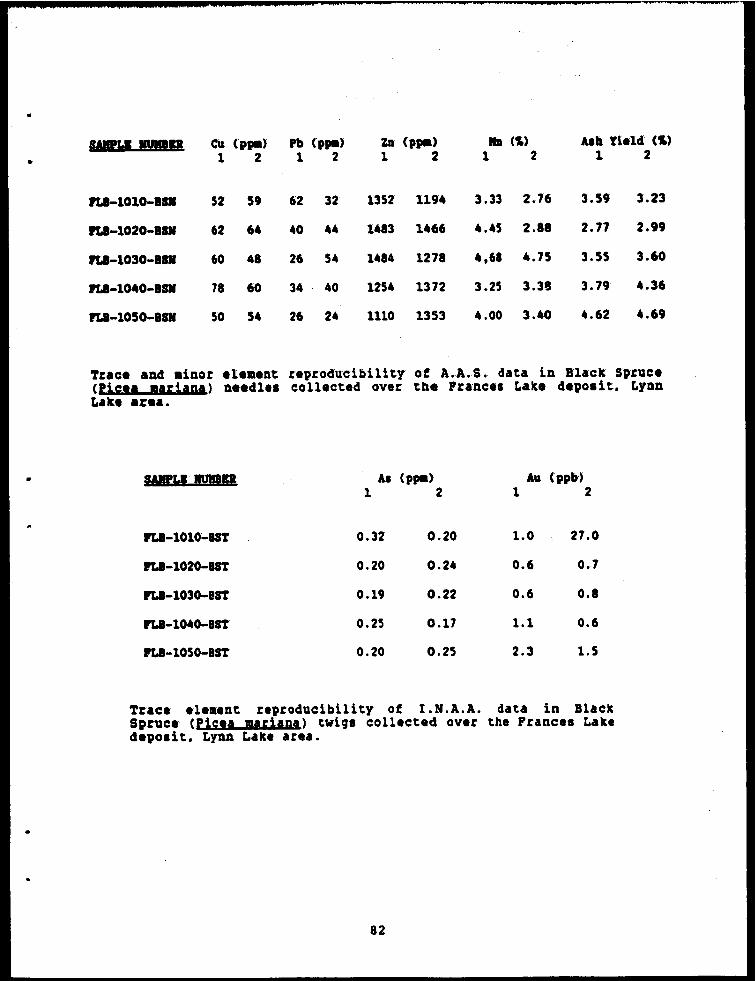
•
1_1& IIUIIID Cu (PPI) Pb (p(III) Zn (PPIa) In (t.) lab Ylelel (t.)
1 2 1 2 1 2 1 2 1 2
rt.B-I010-BD 52 59 62 32 1352 119. 3.33 2.76 3.59 3.23
fLI-I02G-BI. 62 6. .0 .4 1.83 1466 •• 45 2.88 2.77 2.99
rt.8-1030-BI. 60 48 26 54 148. 1278 •• 61 •• 75 3.55 3.60
rt.8-1040-BS. 78 60 3. .0 1254 1372 3.25 3.38 3.79 4.36
rt.8-1050-BS. 50 54 26 24 1110 1353 •. 00 3 •• 0 •. 62 4.69
Trace and ,inor ete.ent reproducibility of A.A.S. data in Black Spruce (Pice. I,dan.) need1l1 coUecud over the Prance. Lake deposit, LYall L.ke .re ••
SMPLlIIUIIP AI (PIIII) All (ppb) 1 2 1 2
rtJI-I010'-8ST 0.32 0.20 1.0 27.0
rtJI-I020-8ST 0.20 0.24 0.6 0.7
rtJI-1030-IST 0.19 0.22 0.6 0.8
rtJI-I040-8ST 0.25 0.17 1.1 0.6
rtJI-1050-8ST 0.20 0.25 2.3 1.5
Trace ele •• nt reproducibility of I.N.A.A. data in Black Spruce (Pice. ".riana) twiqs collected over the Funces Lake depolit, LYDIl Lake area.
82

..
Appendix 3 Statistical summary of Analytical Data
Part I Black Spruce Needles and twigs, Agassiz Deposit
Part ~ .- Labrador Tea Leaves and Twigs, · Agassiz Deposit
Part 3 .- Humus /Bumif ied Peat, · Agassiz Deposit
Part 4 .- Black Spruce Needles' and Twigs, · Rushed Showing, Dot Lake
~
Part 5 Black Spruce Needles Arbour Lake
and Twigs,
Part 6 .- Black Spruce Needles and Twigs, · Frances Lake Deposit
-.-
83
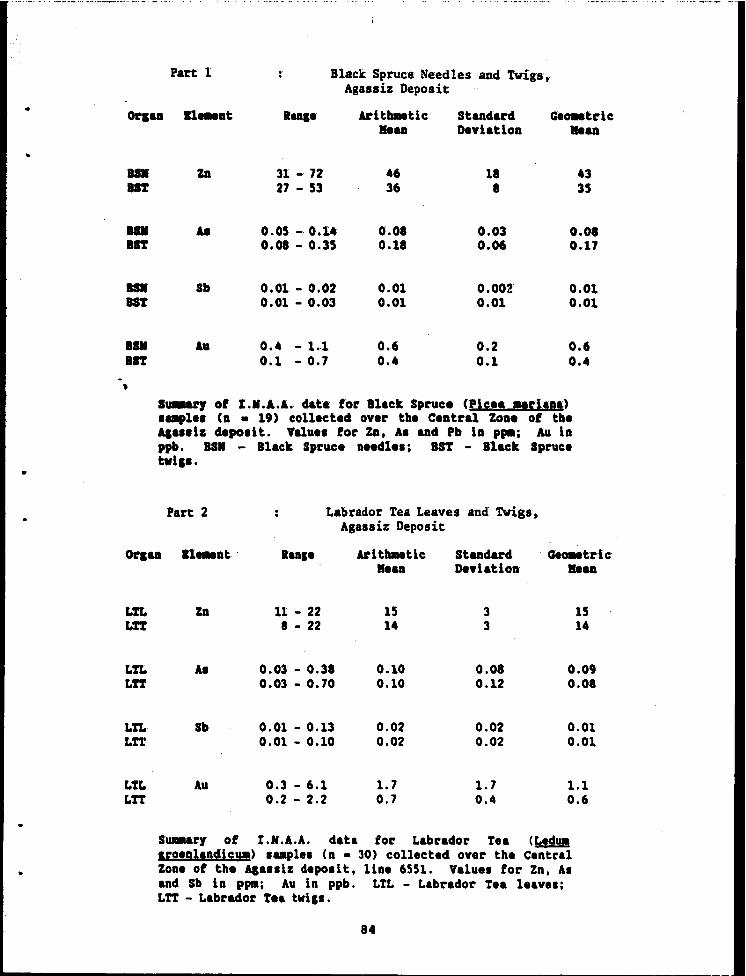
•
•
•
... 1ft
... 1ft I. 1ft
I. 1ST ,
Part 1
Zn
Sb
'u
.' . Black Spruce Needles and Twigs, Agassiz Deposit
IuS'
31 - 72 27 - 53
0.05 - 0.14 0.08 - 0.35
0.01 - 0.02 0.01 - 0.03
0.4 - 1.1 0.1 -0.7
AritbMtlc lieu
46 36
0.08 0.18
0.01 0.01
0.6 0.4
Studard Deviation
18 8
0.03 0.06
0.002 0.01
0.2 0.1
ce .. trlc lieu
43 35
0.01 0.17
0.01 0.01
0.6 0.4
S~J of I.I.A.A. data for Ilack Spruc. (Pic., arhOl) luplel (n • 19) coll.cteel over tb. C.ntral Zone of tb. 1Ialliz d,polit. Valu'l for Zn. AI uel Pb in P~i Au in ppb. lSI - Black Spruc. D •• dl.1 i BST - Black Spruce twiSI .
Part 2
lUI'
Labrador Tea Leaves and Twigs, Agassiz Deposit
ArithMtlc lieu
Standard Deviation
ce .. trlc .. ean
Ln. Zn 11 - 22 I - 22
15 14
3 3
15 14 Lft
Ln. Lft
Ln. Lft
LtL Lft
Sb
Au
0.03 - 0.31 0.03 - 0.70
0.01 - 0.13 0.01 - 0.10
0.3 - 6.1 0.2 - 2.2
0.10 0.10
0.02 0.02
1.7 0.7
0.01 0.12
0.02 0.02
1.7 0.4
0.09 0.08
0.01 0.01
1.1 0.6
Su.l&rr of I.N.A.A. data for Labrador tea (L.dUII lEo.nlanelicwa) ... pl'l (n • 30) coll.ct.el ov,r the C.ntral Zone of the Alalliz d'pollt. lin. 6551. Valu'l for Zn. AI and Sb in PPili Au in ppb. LtL - Labrador t.a 1.av'li LtT - Labrador t.a twiSI.
84
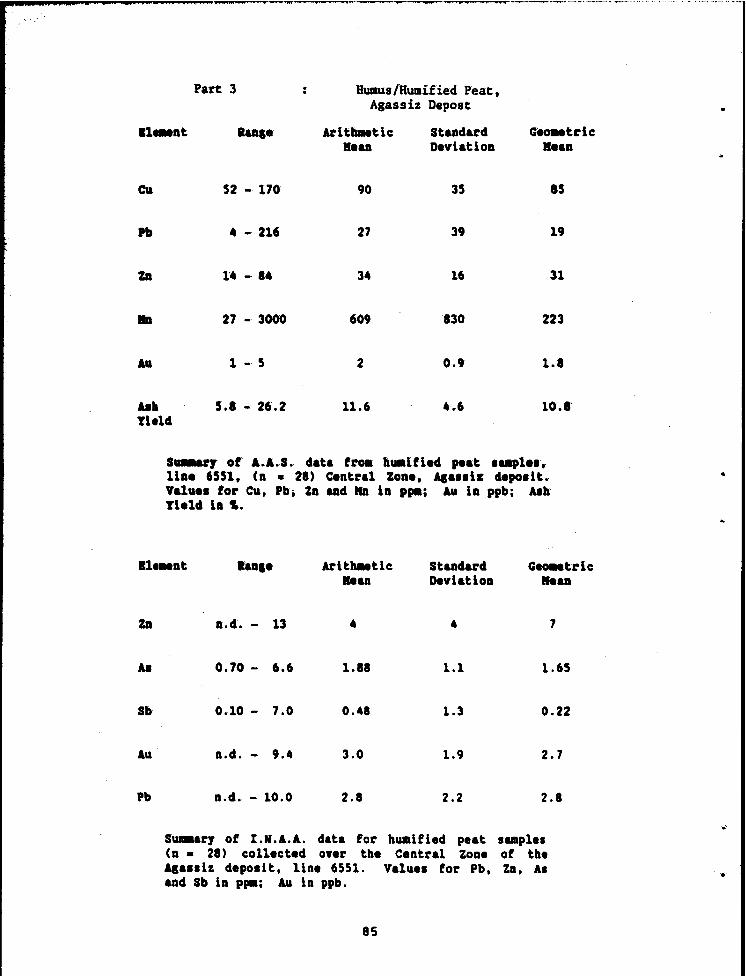
Part 3 HUmus/Humified Peat, Agassiz Depost
Ian,. Arit .... t1c Standard Geo_tric II .... Devi.t1on 1I •• n
52 - 170 90 35 85
Pb • - 216 27 39 19
34 16 31
lin 27 - 3000 609 830 223
1 - 5 2 0.9 1.1
ob Yield
5.8 - 26.2 11.6 4.6 10.8
S-.r1 of A.A.S. d.t. fro. buaiU.d pe.t • ..,1 •• , lln. 6551, (n • 21) C.ntral Zon., AI ... iz d.pollt. Valu •• for Cu, Pb. Zn and l1li in PPII; Au in ppb; Alb Yi.ld in ~.
IlIMnt Iu,. AritbMt1c Standard Geo_tric .... n Devi.tion lI.an
Zn n.d. - 13 4 7
0.70 - 6.6 1.11 1.1 1.65
Sb 0.10 - 7.0 0.41 1.3 0.22
Au D.d. - 9.4 3.0 1.9 2.7
Pb n.d. - 10.0 2.1 2.2 2.1
Sw..rr of I.N.A.A. data for hllllified pe.t supl •• (n • 21) coll.ct.d ov.r the Central Zan. of the AI ... h deposit, line 6551. V.lu •• for Pb, Zn, A. and Sb in ppa; Au in ppb.
85
.,
'.'

•
•
Part 4
39 - .4
.' . Black Spruce Needles and TWigs, Rushed Showing, Dot Lake
Adt .... Uc Standad aeOMtric lie an Deviation .ean
57 12 55
Pb 17 - 65 26 7 25
1412 426 1350 .. 1.05 - 6.15 2.73 1.26 2.47
ub Yielcl
3.04 - 5.17 4.00 0.57 3.97
S....arJ of A.A.S. analrUcal data tor Black Spruce (El.s.n _riapa) Deedle. (D • 45) collected over the lu.bed SbowiDI. Dot Lake area. Value. for Cu. Pb and ZD iD ppa; lin and Alb Yield in ~.
AI
Au
lanse Ari tbMt1c .. an
0.26 - 1.30 0.4'
0.4 - 3.4 1.2
StaDdard Deviation
0.2
0.7
aeOMtrlc .eaD
1.1
Sa.arJ of I.N.A.A. data for Blact Spruce (~ MEiya) twlS' (D • 45) collected over tbe lu.bed SbowIDS. Dot Lake are.. Value. for A. in p~; A~ In ppb.
86

-.. -... -..... -.,.------------~--------. _. -_._ ....
Part S
Pb
•. .
70. - 2602
UOO - UIOO
Black Spruce Needles and TWigs. Arbour Lake
AritbMUc lieu
•• 1365
7719
Studarei DeviaUoa
10
31
3175
CeOMtdc .eu
1217
6915
Alb 'field _
1.77 - 6.32 3.51 0.97 3.56
S....u, ot A.A.S. data tor Blick Spruce (ti£B -ria,,) a.edl.. (a • 31) Arbour Late area. Valu •• for Cu. Pb, Za ud Ilia ia PSlll; Alb Yield ia ~.
0.110 - 0.300
0.. - 1.6
ArithMUc .eu
0.202
1.31
staadard DeviaUoa
0.05
1 .• 3
CeOMtrlc .eu
0.197
1.12
s .... rr ot I.N.A.A. data tor Blick Spruce (E.l.su Mrl"a) tviS. (a • 31), Arbour Late ana. Valu •• tor A. ia p,.; Au 18 ppb.
87

•
•
•
Part 6
Pb
Zn
.' .
40 - 10
14 - 146
611 -, 1830
1.30 - 1.39
Black Spruce Needles and Twigs, Frances Lake Deposit
ArltbMtlc lIean
57
1319
3.68
Standard Deviation
8
24
284
1.47
aeOMtric lie aD
57
37
1293
3.41
Alb Yleld
2.67 - 5.02 3.80 0.51 3.77
A.
Su.arJ ot A.A.S. analytical data tor Blact: Spruce (llis .rian.) needle. (n • 56) collected over tbe rrancel Lake depoll t, Lynn Late .rea. V.lue. for Cu, Pb and Zn in PPII; lID and A.b Yield In to •
O. 4 - 22.0
0.15 - 0.39
Arlt_tic llean
1.79
0.22
Standard Deviation
3.32
0.04
aeOMtric lie an
1.14
0.22
S_arJ ot I.N.A.A. data for Black Spruce (Pic .. .. rian) twill (n • 56) collected over tbfl Fr.nc •• Lake depollt, Lynn Lake Irea. V.lue. for A. In ppa; Au In ppb.
88

wew u a 4 • • A •
•
Appendix 4 .. Correlation Coefficients · Part I Black Spruce Needles and Twigs,
Agassiz Deposit
Part 2 Labrador Tea Leaves and Twigs, Agalsiz Deposit
Part 3 HUIDUs/Bumified Peat, Agassiz Deposit
Part 4 .. Black Spruce Needles and twigs. · Rushed Showing, Dot Lake
• Part S : Black Spruce Needles and Twigs. Arbour Lake
Part 6 .. Black Spruce Needles and Twigs. · • Frances Lake Deposit
•
89

Part 1
Zn
0.1172 (.303)
0.7272 ( .001)
Sb 0.1124 (.360)
Zn
Black Spruce Needles and Twigs, Agassiz Deposit
Sb A. Au
0.24U 0.4333 (.253) ( .023)
0.2650 (196)
lendaU non-pulMtrlc correlation coeftlcient .. tria tor Black Spruce (Pic .. IIIFlana) ne.dle. (n • 19) eollected over tbe Central Zone of the Ala •• lz depo.lt. line 6551. Bracketed fllure denote. tbe atatl.tical alsnltlcance of the cOFrelatlon coetflcient. I ••• A.A. data.
Zn Sh A. All
All 0.2704 0.2693 0.4979 L 263) C.265) (.030)
A. 0.8689 0.3041 (.00l> (.205)
Sb 0.2115 (,375)
Zn
SpeaFlllan non-parametric correlation coefficient lIatrix for Blaclt Spruce (Picea mariana> ne.dl •• Cn • 19) collected over the Centt'al Zone of the A,a .. 1& depolit. 11ne 6551. Bucketed flsut'e denote. the Itatiltical .llniflcance of the cOL"t'elatlon coefflclent. I.N.A.A. data.
90

•
•
•
•
Zn Sb AI A"
Au 0.583. 0.6118 0.6898 (.009) (.005) ( .001)
AI 0.7525 0.'.56 ( .001) ( .001)
Sb 0.6671 (.002)
Speatllu non'-pu ... tric correlation coeftlcte .. t .. trb for Black Spruce (,icea mariana) twill (D • 19) collected over the Central Zone ot tile Asai,iz depo.it. line 6551. Bracketed flsure denote. the .tati.tical Ilsnltlcance of tile correlation coettlclent. I.N.A.A. data •
Za Sb AI Au
Au 0 •• 277 0.5U3 0.5527 (.018) ( .008) ( .002)
As 0.5758 0.73.8 (.001) ( .001)
Sb 0.5511 (.005)
Zn
'endall non-par ... tric e01"relatlon coeffident .atrb for Black Sprllce (Pice. madana) twis' (n • 19) collected over the Central Zone of the Asa,.i& deposit. line 6551. Bracketed fiSllre elenote. the statistical dsnificance of the correlation coefflcient. I.N.A.A. data.
91

Part 2'
Zn
Au -0.2651 ( .156)
A. 0.6702 ( .001)
Sb -0.1299 (.494)
ZIl
Labrador Tea Leaves and TWigs, Agassiz Deposit
Sb A. All
0.3202 0.069. (,085) (. 715)
0.0289 (.880)
Speal'llaft non-parlMtrlc correlation coeftlclent .. triz for Labrador tea (Ltd!' sroenl.ndicua) leave. (n • 30) collected over the Central Zone of the A!&I.lz depollt, Une 6551. Bracteted fllure denote. the .tati.tical Ilsniflc.nce of the correlation coefficient. I ••• A.A. data.
Sb A. Au
Au -0.2012 0.2556 0.0556 (,141) ( .087) ( .679)
0.5141 0.0168 ( .001) (.9tl)
Sb -0.1004 ( .514)
ZIl
lendall non-parametric correl.tion coefficient matril for Labrador tea (Ledum s[oenl.ndicwm) leave. (n • 30) collected over the Central Zone ol the Aea •• iz depo.it, line 6551. Br.cketed fleure denote. the .tatistical Ilsniflcance of the correlation coefficient. I.N.A.A. dat •.
92
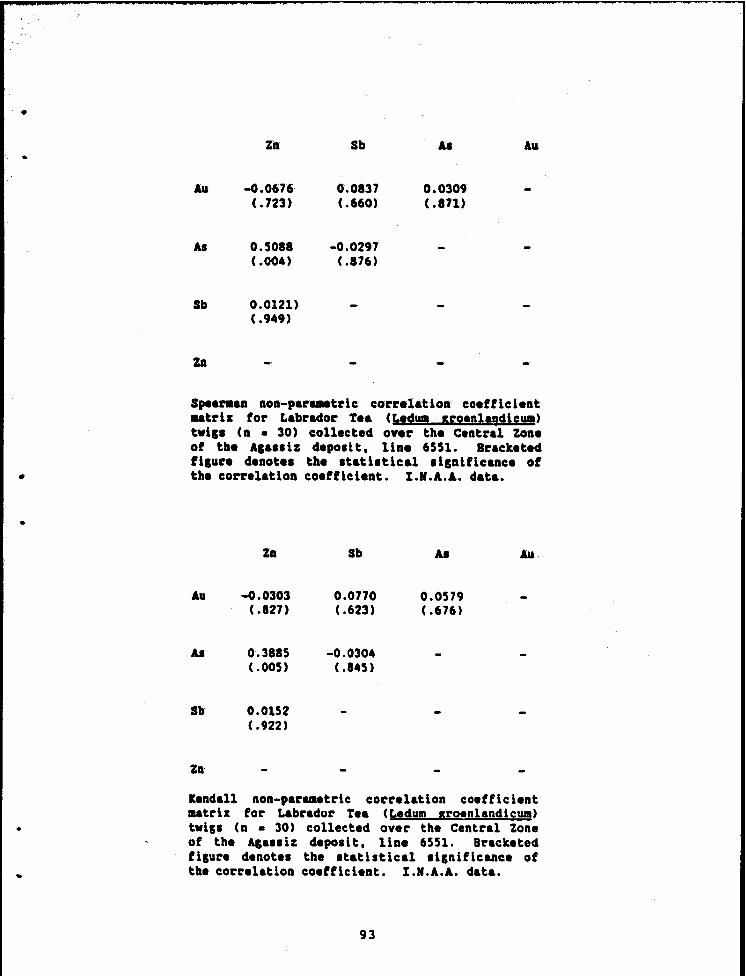
•
•
•
•
..
Zft Sb AI Au
Au -0.0676 0.0837 0.0309 (.723) ( .660) ( .871)
A. 0.5088 -0.0297 (,004) (.876)
Sb 0.0121) (.949)
Za
Sp .. l'tIaII non-parlMtrlc correlation coefUclent .. tl"b fOl" Labrador Tea (Ledy 1E0enlandlcUll) tvil' (a • 30) collected ovel" the Central Zoae of the Ala .. iz depodt. Une 6551. Bracketed fllUl"e denote. the .tathtical Illnltlcaace of the corl"elatloa coefficlent. I.N.A.A. data •
Za Sb AI Au
Au -0.0303 0.0770 0.0579 ( .827) (.623) (.676)
AI 0.3885 -0.0304 (.005) ('U5)
SI) 0.0152 (.922)
Zn
lendall non-pal" .. etrlc corl"elatlon coefficient matrix for Labrador tea (Ledum Broenlandiewn) tvlsi (n • 30) collected over the Central Zone of the Asa .. iz deposit. Une 6551. Bracketed fleure denote. the Itatistical Ilsniflcance of the correlatloa coefficlent. I.N.A.A. data .
93

Part 3 Humus/Humified Peat, • . Agassiz Deposit
Pb A\I Sb A. Za
ZD 0.3017 0.2159 -0.0145 0.,2132 (.066) (.U6) ( .918) (.151)
1. 0.0539 0.0121 0.3115 (.723) (.551) (.009)
Sb -0.2650 -0.OU4 (,102) (.756)
1u 0.3109 ( .001)
Pb
'endaU non-pulMtL"lc correlation coefriclellt , utl'iz tor buined peat •• ple. (n II 21) collected over tbe central Zone of tbe Alalliz depolit. line 6551. I.N.A.A. data.
Pb Au Sb A. Zn
Za 0.3528 0.2819 -0.0109 0.2672 (.066) (.146) (.956) ( .169)
0.0572 0.1339 0.4906 (.773 ) ( .• 97) ( .001)
Sb -0.3079 -0.0480 (.111) (.808)
A\I 0.5093 (.006)
Pb
Speat'llan Ilon-pu ... tric correlatioll coefficient • Ilatl'iz fol' bWftified peat ... pl.1 (n • 28) collected ovel' tbe Celltral ZOlle of the Asallh depolit. line 6551. I.N.A.A. data.
94
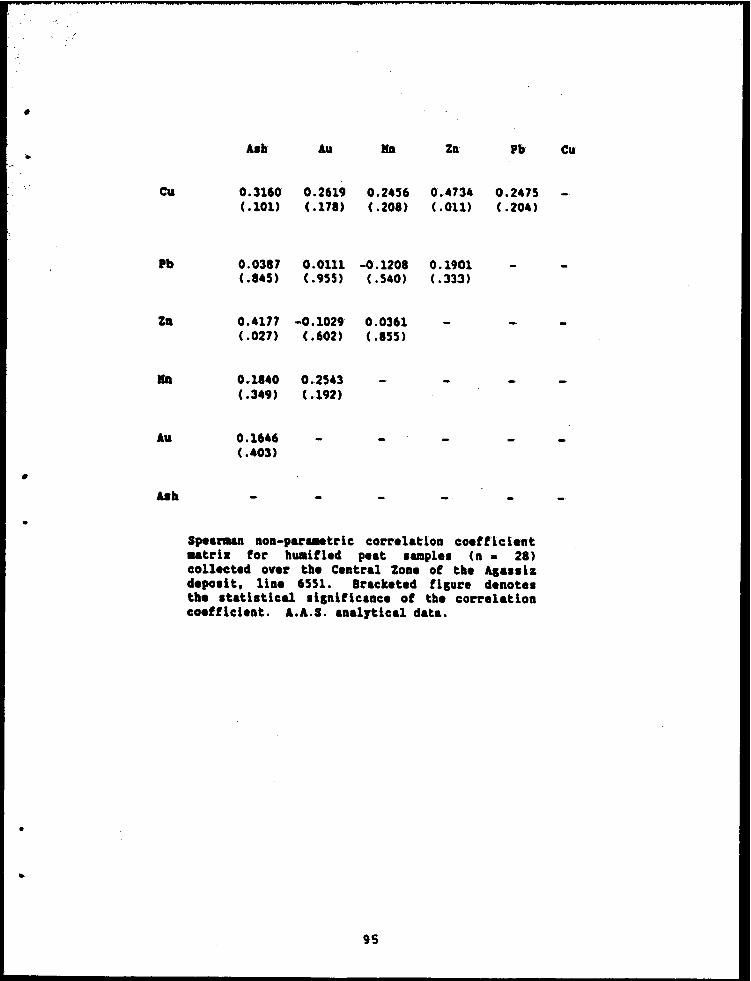
•
"
•
•
Au Zn Pb
Cu 0.3160 0.2619 0.2456 0.4734 0.2475
Pb
Zo
uh
(.101) (.178) (.208) (.011) (.204)
0.0387 0.0111 -0.1208 0.1901 ( .845) (.955) (.540) ( .333)
0.4177 -0.1029 0.0361 ( .027) (.602) (.855)
0.1840 0.2543 (.349) (.192)
0.1646 (.403)
Sp.&rIUIl non-pulMtrle correlation co.ffiel.nt atrlz for huaifi.d p.at .... pl.. (Il. 28) eoll.ct.d over tb. C.ntral Zone of the A,alliz d.po.it, lin. 6551. Brack.t.d fl,u~. d.not •• the .taU,Ueal ",Illtleanee of tb. cO~l"elatlon eo.ffiel.llt. &.A.S. allalrtleal data •
9S
CU

·b
Za
lID
ull
Alb lu Zil Pb
0.2163 0.2031 0.U89 0.3619 0.1631 (.109) (.178) (.185 ) (.008) ( .23.)
0.0108 0.0098 -0.0839 0.1572 (.937) (.9.9) (.539) (.256)
0.2819 -0.0982 0.0108 (.039) (.520) ( .937)
0.0798 0.2087 (.553) (.165)
0.1220 (.U7)
'endaU nOIl-parIMtrlc corre1aUon coettlcient _trlz for hllllln.d peat • ..,1.1 (n. 28) collected over the Central Zone of the "alliz depolit. line 6551. Bracketed tl&ure denote. tbe Itatistical Ilsnlflcance of tbe correlaUoll coefficient. I,A.S. anal,tical data,
96
'!
Cu ..
•
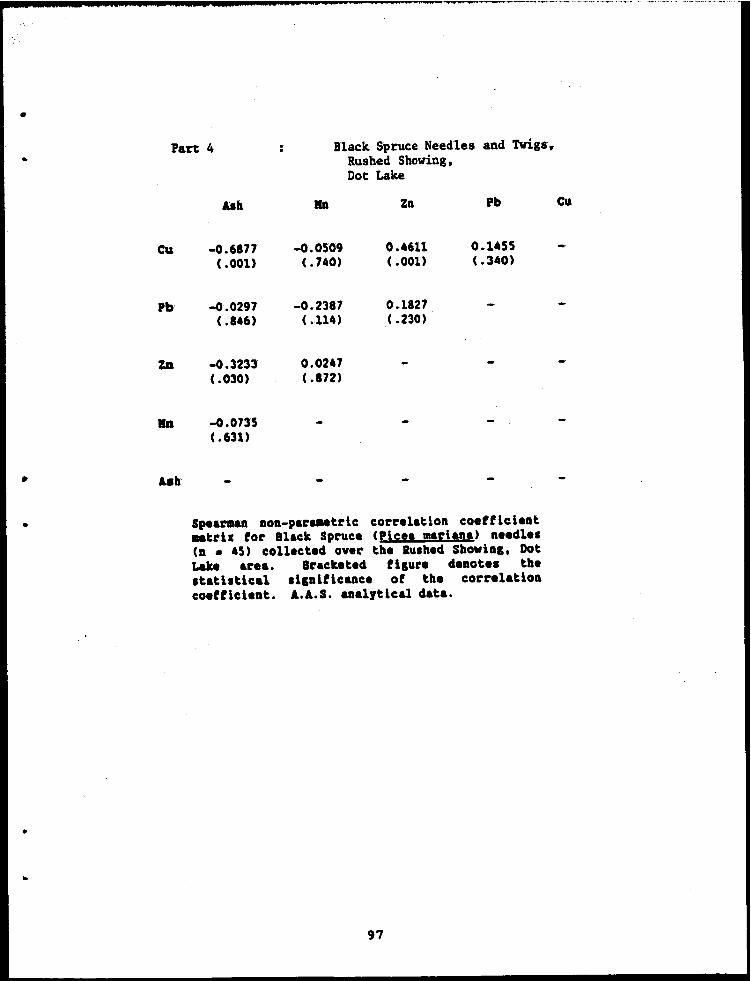
•
•
•
•
•
Part 4 .' . Black Spruce Needles and Twigs, Rushed Showing,
Ct.l
Pb'
Dot Lake
Asb III Zn Pb
-0.6177 -0.0509 0.4611 0.11\55 ( .001> (.740) ( .00l) (.340)
-0.0297 -0.2387 0.1127 (."6) (,114) ( .230)
-0.3233 0.0247 ( .030) ( .172)
-0.0735 (.631>
Speal'll&n aoa-par ... trlc correlation coefficieat .. trll for Black Spruce (Picea mariana) needle. (a • 45) collected over tbe Rusbed Sbowias. Dot Lake area. Bracketed nSure denote. tbe statistical Ilsaltlcance of tbe correlatioll coefficient. A.A.S. analytical data.
97
cu

.. __ .......... 1111111111-.... ------------~~--··-··-'·-- .... _ ....... .
, ub Zn Pb CU
• Cu -0.5203 -0.0359 0.3241 0.·0881
(,001) ( .·732) ( .002) (.409)
Pb -0.0176 -0.1604 0.1166 ( .868) (.128) ( .271)
Zn -0.2292) 0.·0285 (.028) (.78.)
lID -0.03 •• (.139)
Asb
'endall non-pulMtt"lc cot"relation coefriclent att"b fOt" 11ack Spnce (Picea uriana) needles , (n • 45) collected over the RUlbed Sbowlnl. Dot Lake at"ea. It"acteted tllure denotes the statlltlcal Illnificance of tbe correlation coefficient. A.A.S. analrtlcal data.
KINDALL COIllLATION COEFFICIENTS
AI r • 0.0519 witb Au Ill.. .0632
SP!AIKAN CORRELATION COEFFICIENTS
AI t" • 0.0194 witb Au Ill.. .609
Non-pat"uett"ic cot"t"elation coeffic ients fot" llack Spt"uce (Plcea muiane) twill (a • 45). RUI hed Shawl al • Do t Lake al'e&. I • N . A . A. • analrtlcal data.
98
•

•
-.
•
•
Part 5 Black Spruce Needles and Twigs.
Pb
Alh
Arbour Lake
Alh lID ZD Pb
-0.3580 0.1285 -0.0038 0.2601 ( .048) (.491) ( .984) C .158)
-0.0669 0.1243 -0.4399 (.535) (.505) ( .013)
0.U58 0.0411 (.240) (.826)
0.2116 (,240)
Speat'lllall nOD-paruetric correlation coefficient utrb for Black Spruce (Picu mariana) n.ed1e • CD • 31) Arbour Late area. Bracketed Ucure denotes the statistical sicnificance of the correlation coefficient. A.A.S. aDalytical data .
99
Cu

" '
Pb
ZI
lID
ub
A.b Za Pb
-0.2666 0.0970 -0.0176 0.1193 (,039) ( .453) ( .191) ( .146)
-0.0503 0.0719 -0.3141 (.695) (.539) ( .014)
0.0511 0.0194 (.613) (.171)
0.1473 ( .247)
'udall nOD-pat"IMtric cot"t"elatloD coefflcient _tria fot" Black Spt"uce (Picea m.t"iana) needle. (I • 31) ubour L.ke area. Bt".cketed t11Ut"e denote. tbe .tatl.tlc.l .llnlflcance of tbe cot"relatlon coefficieat. A.A.S. analrtic.l data.
lINDALL COlllLAtION COErPICIINrS
A. t" • 0.0903 witb Au II,.. .602
SPIAIIAN CORRELAtION COIPPICIINTS
A. r • 0.0940 witb Au Ill.. .615
Non-p.t"uaetric cot"t"elation coefficient. fot" Black Spt"uce (Pic .. mat"iana) tvi,. (n • 31) At"bout" Lake at".a. I.N.A.A. analytical data.
100
1
Cu •
,
;j"

•
•
•
•
•
Part 6 .' Black Spruce Needles and Twigs, . Frances Lake Deposit
Ash lin Zn Pb
CU 0.2423 0.2402 0.3555 0.1441 (.072) (.015) (.001) ( .289)
Pb 0.1681 0.1699 0.1404 ( .21.) (.210) (.302)
0.3108 0.3123 (.005 ) (.005)
JIll 0.0006 ( .971)
Ash
Speat'llWl non-paruetrlc correlation coeffielent, - .. trb tor Black Spruce (Pic.a mariana) needl ..
(n • 56) collected over the France. Lake deposl t. LJnn Lake area. the bracketed licure denote. the .tatiltical .llnlfleance of the correlatlon coefflclent. A.A.S. analJtlcal data.
101
cu

Pb
lin
ab ZD Pb
0.1668 0.1656 0.2439 0.,1121 ( .079) ( .011) (.010) ( .242)
0.1196 0.,1185 0.0939 (.202) ( .207) (.317)
0.2742> 0.2770 ( •• 99) ( .003)
0.0117 (.199)
'eDdall IlOD-parIMtrlc correlation. coefficient _trh for Black Spruce (Picu aariana) needl •• (n • 56) collected over the Prance. Late depod t. LJnn Late area. the bracketed filure denote. tbe .tati.tical lilnificance of the correlation coefficient. A.A.S. analJtical data.
KINDALL CORRELAtION COEPPICIENtS
AI r • -0.1776 witb Au liS.. .074
SPBARKAN CORRELAtION COEFPICIENTS
AI r • -0.2574 witb Au 11,.. .055
Non-parametric correlation coefficients for Black Spruce (Picu mariana) twill (n • 56) collected over the Pnncel Lake deposit. Lynn Lake area. I.N.A.A. analytical data.
102
~
eu •
.. '
.'

" Appendix 5 ,. .. ,.
,. Ag .. llz Humul
II
'- .. ,e II c: • i • • .. ~ •
• I
• • II
Au (Pllb)
II
Agalliz Humul ,e
~ • .. II • c: • ~ • cr • ~ a
..... - r-..... ~
n n I.' •.• II.' ' .............. .
Pb (Pllm)
,a
Ag.IIIZ .. ,. ,. \I e: I cr • ..
II.
~ • • . . • • • · ~ : ~ : • • • ,; ,; ,; ,; ,; ,; ,;
AI (Pllm)
0' o
LTL
• · · ,;
103
Selected Histograms
, . ,. .. II
,. II 'I e: • :I cr • .. ~
.. , . • a
,a
.. ,. 'I II e: • ::I cr • .. ~
Agaallz Humul
• •• •• U a. .. .. .. .. Zn (ppm)
Ag.lliz Humul
•.• a.. •.• ,... II.. ,... ••.• .... • •.•
• . : . • · •
AI" (pet)
• · • • . :
· . · .. • •
Zn (ppm)
Dot Lake BSN
: •
• · · • • • ·

" r- - Franc .. Lak.'
" 118N I.
n -
nn II II I. •• .1 •• '.
II
r- France. L.II. aSN
"' "
"
~
r--' -
I ~-I n I
104
II
"
JlI.' ••
~ • .. ., • It
.. U c: • i • It
II
.. II
I. I. II
"
. . . . . .
nn -
. ..
r-
. .
~
Francaa Lall.
. . . .. . .
IIIN
Franc •• Lelle' ISN
r--
r-
n
t
"