Embed Size (px)
Citation preview

iii
INFLUENCE OF MIDBLOCK U-TURN FACILITY ON TRAFFIC FLOW
REDUCTION AND ITS EFFECT ON KINEMATIC WAVE PROPAGATION
RAHA BINTI ABD RAHMAN
A thesis submitted in the fulfilment of the
requirements for the award of the degree of
Doctor of Philosophy (Civil Engineering)
Faculty of Civil Engineering
Universiti Teknologi Malaysia
NOVEMBER 2014

v
This thesis is especially dedicated to the followings who are very much appreciated
for their patience, steadfast and sympathy.
My parents
HJ ABD RAHMAN BIN ABDULLAH
HJH HAMIDAH BINTI ABDULLAH
My loving husband
MOHD FARID BIN HASSAN
My children
UMAR ABDUL AZIZ BIN MOHD FARID
UMAR LUQMAN AL HAQIM BIN MOHD FARID
May ALLAH swt. increase our faith and good deeds and save us from any calamities
and
disasters in the Day of Judgment and put us into His Heaven, Amin.

vi
ACKNOWLEDGEMENT
I would like to express sincere gratitude and thanks to my academic
supervisor Associate Professor Dr. Johnnie Ben Edigbe and my co-supervisor Dato.
Ir. Dr. Azmi bin Hassan, for their guidance, invaluable suggestions, patience and
active encouragement throughout the duration of this research.
I deeply appreciate to Public Work Department of Malaysia for giving me
opportunity to pursue my PhD study. I would also like to express my gratitude to the
Federal Malaysia Government for the financial support.
Also I would also like to thank Dr. Nordiana for the informal discussions,
moral support and friendship.
I would also like to extend thanks to JKR (D) Johor Bahru and JKR Johor for
their invaluable assistance in the preparation of instrumentation and the collection of
the field data.
Finally, I would like to thank all the members of my family especially my
loving husband Mohd Farid and my sons Umar Abdul Aziz and Umar Luqman Al
Haqim for their continual encouragement, interest and emotional support throughout
the duration of this research. Lastly a dedicated honour to my mom and dad for
giving me full love.

vii
ABSTRACT
Midblock median opening facilities are constructed on multilane highways in
Malaysia solely for the purpose of facilitating U-turn movements along federal road
segments. In Malaysia, a persistence problem of traffic conflicts and congestion at
multi-lane highway intersections forced the federal authorities to invest in midblock
median opening facilities as traffic conflict reduction mechanism. Although the
authorities have succeeded in reducing traffic conflicts at intersections, the
realisation of maximum traffic flow at the midblock zone is in doubt. The aim of the
study is to determine influence of midblock U-turn facility on traffic flow reduction
and its effect on kinematic wave propagation. The objectives are to determine traffic
volume, speeds as well as vehicle types at the midblock and free-flow zones for both
directional flows. As well as examine the effect of traffic flow reduction on
kinematic wave propagation. It was assumed that traffic density was a resultant of
speed and traffic flow hence not directly affected by midblock zone. It implies that
traffic flow reduction was fully the result of speed changes. Where traffic flow
reduction has occurred, the ensuing kinematic wave propagation would be
investigated in order to determine whether it is a rarefaction wave or traffic
shockwave. Vehicle types, traffic volumes and vehicles speeds were collected using
automatic traffic counters at each directional flow of the four surveyed sites for six
months. The survey data were collated and analysed. Passenger car equivalent values
were modified and used to convert traffic volume to flow. Results show that
midblock facility would cause about 4 per cent reduction in traffic flow at the
diverging section and 10 per cent reduction in traffic at the merging section. The
findings give traffic capacity values under different scenarios and can be
incorporated into a wider strategy for dynamic traffic management. Findings from
kinematic wave propagations confirm that midblock facility would cause traffic
shock wave at the merging not the diverging section. Estimated traffic flow
reduction from the study can be used as evidence to highlight the need to redesign
midblock facility in Malaysia. One possible solution among others is to incorporate
appropriate acceleration lane at the merging section thereby minimising the potential
for vehicle collision. The study concluded that midblock facility will cause traffic
significant flow reduction.

viii
ABSTRAK
Pembukaan kemudahan pembahagi jalan yang dibina pada jalan dua lorong
dua hala di Malaysia bertujuan memberi kemudahan kepada kenderaan membuat
pusingan „U‟ di sepanjang jalan Persekutuan. Di Malaysia, keadaan di mana masalah
dan konflik yang berlaku di jalan dua hala dua lorong telah mendorong Pihak
Berkuasa untuk memperkenalkan penggunaan pembukaan pembahagi jalan sebagai
salah satu mekanisma untuk mengurangkan konflik tersebut. Walaupun Pihak
Berkuasa telah berjaya mengurangkan konflik trafik di persimpangan jalan tetapi
realitinya maksimum aliran trafik di zon pembahagi jalan adalah diragui. Tujuan
kajian ini dilakukan adalah untuk menentukan pengaruh daripada kemudahan
pusingan „U‟ terhadap pengurangan aliran trafik dan kesannya terhadap gelombang
kinematik trafik. Objektif bagi kajian ini adalah untuk menentukan jumlah isipadu
lalulintas, kelajuan dan jenis kenderaan yang melalui zon aliran bebas dan zon
kemudahan pusingan „U‟ bagi kedua-dua arah dan seterusnya mencari kesan
pengurangan aliran trafik terhadap gelombang kinematik trafik. Dianggap bahawa
ketumpatan trafik adalah terhasil daripada kelajuan dan aliran trafik dan bukan
daripada kesan zon kemudahan pusingan „U‟. Telah didapati bahawa pengurangan
aliran trafik adalah berpunca daripada perubahan kelajuan kenderaan. Sekiranya
terdapat pengurangan aliran trafik, kajian terhadap gelombang kinematik trafik akan
dijalankan untuk menentukan samada ia adalah „rarefaction‟ atau kejutan gelombang
trafik. Data jenis kenderaan, jumlah lalulintas dan kelajuan kenderaan telah didapati
menggunakan alat „automatic traffic counters‟ di setiap arah trafik di empat lokasi
selama enam bulan. Data kaji ini kemudian dikumpulkan, disusun dan dianalisis.
Nilai bagi Setaraan Kenderaan Penumpang diubahsuai dan digunakan untuk menukar
isipadu trafik kepada aliran trafik. Daripada keputusan yang diperoleh, didapati
bahawa kemudahan pembahagi jalan pusingan „U‟ ini boleh menyebabkan terjadinya
pengurangan aliran trafik sebanyak 4% di bahagian pencambahan trafik manakala
10% pengurangan trafik di bahagian cantuman trafik. Penemuan ini memberi kapisiti
lalulintas kepada beberapa scenario berlainan dan ia membuka ruang dengan luasnya
kepada kajian terhadap pengurusan dinamik trafik. Penemuan daripada gelombang
kinematik trafik mengesahkan bahawa kemudahan pusingan „U‟ ini menjadi punca
kepada gelombang kejutan trafik di bahagian cantuman trafik dan bukan di bahagian
pencambahan trafik. Pengiraan dalam pengurangan aliran trafik hasil daripada kajian
ini boleh digunakan untuk mengkaji keperluan merekabentuk semula kemudahan
pusing „U‟ di Malaysia. Salah satu jalan penyelesaian yang boleh digunapakai untuk
mengurangkan risiko kemalangan adalah menyediakan panjang yang mencukupi di
laluan/jalan susurmasuk pada bahagian cantuman trafik. Kesimpulannya melalui
kajian ini mendapati bahawa kemudahan pusingan „U‟ boleh mengakibatkan
pengurangan aliran trafik .

ix
TABLE OF CONTENT
CHAPTER TITLE PAGE
DECLARATION
ii
DEDICATION iii
ACKNOWLEDGEMENTS iv
ABSTRACT v
ABSTRAK vi
TABLE OF CONTENTS vii
LIST OF TABLES xiii
LIST OF FIGURES xviii
LIST OF ABREVIATIONS xxi
LIST OF SYMBOLS xxii
1 INTRODUCTION 1
1.1 Overview 1
1.2 Background to the Research Problem 2
1.3 Research Objectives 3
1.4 Method of the Study 4
1.5 Research Scope and Limitations 4
1.6 Significance of the Study 5
1.7 Organisation of Thesis 6

x
2 THEORETICAL BACKGROUND 7
2.1 Overview 7
2.2 Midblock U-turning Facilities
2.2.1 Previous Studies of Traffic at Midblock U-turn
Facilities
8
12
2.3 Maximum Traffic Flowrate Concepts 14
2.3.1 Speed v Density 15
2.3.2 Flow v Density 16
2.3.3 Speed v Flow 18
2.3.4 Traffic Volume and Flow 18
2.4 Capacity Estimation Methods 19
2.4.1 Estimation with Headways 24
2.4.2 Estimation with Traffic Flows 26
2.4.2.1 Bimodal Distribution Method 27
2.4.2.2 Selected Maximal Method 28
2.4.2.3 Expected Extreme Value Methods 29
2.4.2.4 Asymptotic Method 30
2.4.3 Estimation with Traffic Speed/Flow 30
2.4.3.1 Product Limit Method 31
2.4.4 Estimation with Flow, Speed and Density 34
2.4.4.1 Fundamental Approach Using the
Quadratic Function
35
2.4.4.2 Malaysia Highway Capacity Manual
2011 (MHCM2011) Approach
38
2.4.4.2.1 Peak Hour Factor 38
2.4.4.2.2 Traffic Composition Factor 39
2.5 Impact of Midblock U-turn Facilities on Passenger
Car Equivalency (PCE)
41
2.6 Hypothetical Midblock Zone and Traffic Stream
Relationships
44
2.7 Traffic Kinematic Wave Propagations from
Midblock Facilities
47

xi
2.7.1 Traffic Shockwave
49
2.8 Summary 53
3
RESEARCH METHODOLOGY
54
3.1 Overview 54
3.2 Research Methodology 55
3.3 Criteria of Site Selection 58
3.4 Exploration of Selected Sites 63
3.4.1 Site 1: Senai Johor Bahru Highway FT001,
Johor
63
3.4.2 Site 2: Skudai Johor Bahru Highway FT005,
Johor
64
3.4.3 Site 3: Kota Tinggi Johor Bahru Highway
FT001, Johor
65
3.4.4 Site 4:Pasir Gudang Johor Bahru Highway
FT019, Johor
66
3.5 Survey Methods Used in the Study 67
3.5.1 Sample Survey 69
3.5.2 Survey Site Coding 70
3.5.3 Survey Team and Equipment 71
3.5.3.1 Survey Team Member 71
3.5.3.2 Installation of the Tube 72
3.5.3.3 Status of the Automatic Traffic
Counter
74
3.5.3.4 Automatic Traffic Counter Set Up 74
3.5.3.5 Downloading Data from the Detector 75
3.5.3.6 Problem Encountered in Setup and
Data Collections
77
3.5.4 Setting up Impact Site Studies 80
3.5.5 Traffic Volume Surveys 81
3.5.6 Vehicles Speeds Survey 82
3.5.7 Headway and Vehicle gap Surveys 83

xii
3.6 Appraisal of Sample Data and Analytical Methods 83
3.6.1 Reliability of Analytical Methods 87
3.6.2 Appraisal of Sample Data 87
3.6.3 Reliability of Maximum Flowrate
Estimation Method
89
3.7 Summary 97
4
EMPIRICAL RESULTS OF SAMPLES SURVEYS
98
4.1 Overview 98
4.2 Empirical Results from Surveyed Sites 99
4.2.1 Site 1D-Senai Johor Bahru Highway FT001,
Johor
101
4.2.2 Site 1M-Senai Johor Bahru Highway FT001,
Johor
104
4.2.3 Site 2D-Skudai Johor Bahru Highway FT005,
Johor
106
4.2.4 Site 2M-Skudai Johor Bahru Highway FT005,
Johor
109
4.2.5 Site 3D-Kota Tinggi Johor Bahru Highway
FT001, Johor
112
4.2.6 Site 3M-Kota Tinggi Johor Bahru Highway
FT001, Johor
115
4.2.7 Site 4D-Pasir Gudang Johor Bahru Highway
FT005, Johor
118
4.2.8 Site 4M- Pasir Gudang Johor Bahru Highway
FT005, Johor
121
4.3 Summary 124
5 TRAFFIC FLOWRATE ANALYSIS USING
MHCM2011 PCE VALUES
125
5.1 Overview 125
5.2 Establishing the Maximum Flowrate Contraction
using MHCM2011 PCE Values
128
xiii
5.2.1 Site 1D: Diverging Section of Midblock
Facilities
134
5.3 Site 2D: Diverging Section of Midblock Facilities 134
5.4 Site 3D: Diverging Section of Midblock Facilities 138
5.5 Site 4D: Diverging Section of Midblock Facilities 142
5.6 Model Coefficients for Diverging Section of
Midblock Facilities
146
5.7 Site 1M: Merging Section of Midblock Facilities 147
5.8 Site 2M: Merging Section of Midblock Facilities 151
5.9 Site 3M: Merging Section of Midblock Facilities 155
5.10 Site 4M: Merging Section of Midblock Facilities 159
5.11 Model Coefficients for Merging Section of
Midblock Facilities
163
5.12 Summary of Traffic Flow Contraction 164
5.13 Summary 167
6 ESTIMATION OF MODIFIED PCE VALUES 169
6.1 Overview 169
6.2 Assessment of PCE Values for Midblock and Free-
Flow Zones
170
6.3 Statistical Test of PCE Values 178
6.4 Summary 180
7 TRAFFIC FLOW ANALYSIS USING MODIFIED
PCE VALUES
182
7.1 Overview 182
7.2 Traffic Flowrate Estimation for Diverging Section
Using Modified PCEs‟
183
7.2.1 Traffic Flow Estimation for Site 1D 183
7.2.2 Site 2D: Diverging Section 188
7.2.3 Site 3D: Diverging Section 191
7.2.4 Site 4D: Diverging Section 194

xiv
7.2.5 Summary of Model Coefficients for Diverging
Section
197
7.3 Traffic Flow Estimation for Merging Section 198
7.3.1 Site 1M: Merging Section 198
7.3.2 Site 2M: Merging Section 201
7.3.3 Site 3M: Merging Section 204
7.2.4 Site 4M: Merging Section 207
7.3.5 Summary of Model Coefficients for Diverging
Section
210
7.4 Traffic Flow Contraction using Modified and
MHCM PCEs‟ Compared
211
7.5 Impact of Midblock on Traffic Kinematic Wave
Propagation
212
7.5.1 Traffic Kinematic Wave for Diverging Section 213
7.5.2 Traffic Kinematic Wave for Merging Section 218
7.6 Summary and Recommendations Based on Findings 223
8 CONCLUSIONS 225
8.0 General 225
8.1 Summary of Traffic Flow Reduction Analyses
Major Findings
8.2 Summary of Traffic Flowrate Contraction Analyses
Major Findings
227
228
8.3 Synthesis of Evidences Obtained From PCEs
Modifications
228
8.4 Synthesis of Evidences from Traffic Kinematic
Wave Propagations
229
8.5 Conclusions 230
8.6 The Way Forward 231
REFERENCES 233

xv
LIST OF TABLES
TABLE NO. TITLE
PAGE
2.1 Overview of Capacity-Estimation Methods 22
2.2 Classification of Roadway Capacity-Estimation Methods 23
2.3 Product Limit Method Calculation 33
2.4 Recommended Peak Hour Factor Based on Flowrate for
Multilane Highways
39
2.5 Passenger Car Equivalents for Multilane Highways 40
3.1 Summary of Feature for Survey Site 61
3.2 Survey Summary Sheets for All Sites 62
3.3 Example of Typical Survey Summary Sheets 68
3.4 Survey Site Coding Summary Sheets 70
3.5 Vehicle Logging Information 75
3.6 Sample of Individual Vehicles for Site 5D 88
3.7 Traffic Count During Peak Hour 89
3.8 Traffic Stream Data for Pilot Test Site 5D 88
3.9 Flow, Speed and Density Data During Peak Hour 95
3.10 Summary of Critical Density and Maximum Flowrate 96
4.1 Data Collection Schedule for Diverging Movement Sites 99
4.2 Data Collection Schedule for Merging Movement Sites 100
4.3 Site 1D Volume and Speed Data during Off-Peak 102
4.4 Traffic Composition at Study Site 1D 103
4.5 Site 1M Volume and Speed Data during Off-Peak 105
4.6 Traffic Composition at Study Site 1M 106

xvi
4.7 Site 2D Volume and Speed Data during Off-Peak 108
4.8 Traffic Composition at Study Site 2D 108
4.9 Site 2M Volume and Speed Data during Off-Peak 111
4.10 Traffic Composition at Study Site 2M 111
4.11 Site 3D Volume and Speed Data during Off-Peak 114
4.12 Traffic Composition at Study Site 3D 114
4.13 Site 3M Volume and Speed Data during Off-Peak 117
4.14 Traffic Composition at Study Site 3M 117
4.15 Site 4D Volume and Speed Data during Off-Peak 120
4.16 Traffic Composition at Study Site 4D 120
4.17 Site 4M Volume and Speed Data during Off-Peak 123
4.18 Traffic Composition at Study Site 4M 123
5.1a Computed Flows and Densities (Off Peak FZ) for Site 1D 129
5.1b Computed Flows and Densities (Off Peak MZ) for Site 1D 130
5.2 Site 1D Summary of Observed and Predicted Traffic
Parameter
134
5.3a Computed Flows and Densities (Off Peak FZ) for Site 2D 135
5.3b Computed Flows and Densities (Off Peak MZ) for Site 2D 136
5.4 Site 2D Summary of Observed and Predicted Traffic
Parameter
137
5.5a Computed Flows and Densities (Off Peak FZ) for Site 3D 139
5.5b Computed Flows and Densities (Off Peak MZ) for Site 3D 140
5.6 Site 3D Summary of Observed and Predicted Traffic
Parameter
141
5.7a Computed Flows and Densities (Off Peak FZ) for Site 4D 143
5.7b Computed Flows and Densities (Off Peak MZ) for Site 4D 144
5.8 Site 4D Summary of Observed and Predicted Traffic
Parameter
145
5.9 Summary of Model Coefficients for Off-Peak Traffic 146
5.10a Computed Flows and Densities (Off Peak FZ) for Site 1M 148
5.10b Computed Flows and Densities (Off Peak MZ) for Site 1M 149

xvii
5.11 Site 1M Summary of Observed and Predicted Traffic
Parameter
150
5.12a Computed Flows and Densities (Off Peak FZ) for Site 2M 152
5.12b Computed Flows and Densities (Off Peak MZ) for Site 2M 153
5.13 Site 2M Summary of Observed and Predicted Traffic
Parameter
154
5.14a Computed Flows and Densities (Off Peak FZ) for Site 3M 156
5.14b Computed Flows and Densities (Off Peak MZ) for Site 3M 157
5.15 Site 3M Summary of Observed and Predicted Traffic
Parameter
158
5.16a Computed Flows and Densities (Off Peak FZ) for Site 4M 160
5.16b Computed Flows and Densities (Off Peak MZ) for Site 4M 161
5.17 Site 4M Summary of Observed and Predicted Traffic
Parameter
162
5.18 Summary of Model Coefficients for Off-Peak Traffic 163
5.19 Off-Peak Results Summary for all Sites at Diverging Road
Section
164
5.20 Off-Peak Results Summary for all Sites at Merging Road
Section
165
6.1 Summary of Modified PCE Values 172
6.2 Computed PCEs for FZ at Diverging Section 174
6.3 Computed PCEs for MZ at Merging Section 175
6.4 Computed PCEs for FZ at Diverging Section 176
6.5 Computed PCEs for MZ at Merging Section 177
6.6 PCE Values for Study and MHCM2011 178
6.7 Chi-Square Test MHCM and Modified PCE Values 179
7.1a Computed Flows and Densities (Off-Peak FZ) for Site 1D 184
7.1b Computed Flows and Densities (Off-Peak MZ) for Site 1D 185
7.1c Site 1D Summary of Flow, Speed and Density 187
7.2a Site 2D Summary of Traffic Parameters 188
7.2b Computed Flows and Densities (Off-Peak FZ) for Site 2D 189
7.2c Computed Flows and Densities (Off-Peak MZ) for Site 2D 190
7.3a Site 3D Summary of Traffic Parameters 191

xviii
7.3b Computed Flows and Densities (Off-Peak FZ) for Site 3D 192
7.3c Computed Flows and Densities (Off-Peak MZ) for Site 3D 193
7.4a Site 4D Summary of Traffic Parameters 194
7.4b Computed Flows and Densities (Off-Peak FZ) for Site 4D 195
7.4c Computed Flows and Densities (Off-Peak MZ) for Site 4D 196
7.5 Model Coefficients for Diverging Section 197
7.6a Site 1M Summary of Traffic Parameters 198
7.6b Computed Flows and Densities (Off-Peak FZ) for Site 1M 199
7.6c Computed Flows and Densities (Off-Peak MZ) for Site1M 200
7.7a Site 2M Summary of Traffic Parameters 201
7.7b Computed Flows and Densities (Off-Peak FZ) for Site 2M 202
7.7c Computed Flows and Densities (Off-Peak MZ) for Site2M 203
7.8a Site 3M Summary of Traffic Parameters 204
7.8b Computed Flows and Densities (Off-Peak FZ) for Site 3M 205
7.8c Computed Flows and Densities (Off-Peak MZ) for Site3M 206
7.9a Site 4M Summary of Traffic Parameters 207
7.9b Computed Flows and Densities (Off-Peak FZ) for Site 4M 208
7.9c Computed Flows and Densities (Off-Peak MZ) for Site4M 209
7.10 Model Coefficients for Merging Section 210
7.11a Estimated Traffic Flow Contraction using Different PCE
Values
211
7.11b Estimated Traffic Flow Contraction using Different PCE
Values
212
7.12 Summary of Model Coefficients for Diverging Flowrate
before MZ
213
7.13 Compute Flow and Density for All Sites 214
7.14 Summary of Model Coefficients for Diverging Flowrate at
MZ
214
7.15 Compute Flow and Density for All Sites 214
7.16 Comparative Flow/Density at Diverging Sections 215
7.17 Summary of Model Coefficients for Merging Flowrate
before MZ
218
7.18 Compute Flow and Density for All Sites 218

xix
7.19 Summary of Model Coefficients for Merging Flowrate at
MZ
218
7.20 Flowrate and Density for Merging Road Segment 219
7.21 Comparative Flow/Density at Merging Sections 219

xx
LIST OF FIGURES
FIGURE NO. TITLE
PAGE
1.1
2.1
Typical Direct Midblock U-turn Facility in Malaysia
Example of a Divided Multilane Highway in Malaysia
3
9
2.2 Direct U-turn in Malaysia 11
2.3 Indirect U-turn in Malaysia 11
2.4 Maximum Traffic Flowrate Continuity 14
2.5 Speed v Density 16
2.6 Flow v Density 17
2.7 Speed v Flow 18
2.8 Flow / Density Relationship 36
2.9 Typical Layout of Midblock Opening 45
2.10 Hypothetical Traffic Flow Rate Contraction at Midblock
Zone
46
2.11 Flow-Density Curve With kinematic Wave ABC 50
3.1 Flow Chart Logic of the Analytical Procedure 57
3.2 Selected Federal Route FT001, FT003, FT005 and
FT017
59
3.2
3.3
3.4
3.5
3.6
3.8
Location of Sites
Schematic Diagram Site 1
Schematic Diagram Site 2
Schematic Diagram Site 3
Schematic Diagram Site 4
Installation Process
60
63
64
65
66
72
3.9 Portable Automatic Traffic Counter Place on Site 72
3.10 Portable Automatic Traffic Counter 73

xxi
3.11 Downloading Process 76
3.12 Downloading Profiles 77
3.13 Flat Engine Belt 78
3.14 Drilling Holes Process 78
3.15 Screw installation 79
3.16 Layout of Typical Survey Site 80
3.17 Speed Survey Using Automatic Traffic Counter 82
3.18 Headway and Vehicle Gap 83
3.19a Sample Worksheet for Data Processing in the
Excel Platform
85
3.19b Sample Worksheet for Data Processing in the Excel
Platform
86
3.20 Flow-Density Relationship with Constant During Peak
Hour
92
3.21 Free Flow Zone Flow/Density Model for Test Site 5 94
3.22 Midblock Zone Flow/Density Model for Test Site 5 94
3.23 Site 5 Flow-Density Model Plot for FZ and MZ 96
4.1 Site 1D Traffic Flow Profile 101
4.2 Site 1D Volume-Density Plot 101
4.3 Site 1M Traffic Flow Profile 104
4.4 Site 1M Volume-Density Plot 104
4.5 Site 2D Traffic Flow Profile 106
4.6 Site 2D Volume-Density Plot 107
4.7 Site 2M Traffic Flow Profile 109
4.8 Site 2M Volume-Density Plot 109
4.9 Site 3D Traffic Flow Profile 112
4.10 Site 3D Volume-Density Plot 112
4.11 Site 3M Traffic Flow Profile 115
4.12 Site 3M Volume-Density Plot 115
4.13 Site 4D Traffic Flow Profile 118
4.14 Site 4D Volume-Density Plot 118
4.15 Site 4M Traffic Flow Profile 121

xxii
4.16 Site 4M Volume-Density Plot 121
5.1 Schematic Evaluation Procedure 127
5.2 Flow/Density Curves for Site 1D 132
5.3 Flow/Density Curves for Site 2D 137
5.4 Flow/Density Curves for Site 3D 141
5.5 Flow/Density Curves for Site 4D 145
5.6 Flow/Density Curves for Site 1M 150
5.7 Flow/Density Curves for Site 2M 154
5.8 Flow/Density Curves for Site 3M 158
5.9 Flow/Density Curves for Site 4M 162
7.1 Diverging Movement Kinematic Waves Graphical
Illustrations for Site 1D
216
7.2 Diverging Movement Kinematic Waves Graphical
Illustrations for Site 2D
216
7.3 Diverging Movement Kinematic Waves Graphical
Illustrations for Site 3D
217
7.4 Diverging Movement Kinematic Waves Graphical
Illustrations for Site 4D
217
7.5 Merging Movement Kinematic Waves Graphical
Illustrations for Site 1M
221
7.6 Merging Movement Kinematic Waves Graphical
Illustrations for Site 2M
221
7.7 Merging Movement Kinematic Waves Graphical
Illustrations for Site 3M
222
7.8 Merging Movement Kinematic Waves Graphical
Illustrations for Site 4M
222

xxiii
LIST OF ABBREVIATIONS
ADT - Annual Daily Traffic
ATC - Automatic traffic count
FD - Fundamental Diagram
FHWA - Federal Highway Administration
GQM - Generalised queuing model
HCM - Highway capacity manual
JKR - Jabatan Kerja Raya
LOS - Level of service
MHA - Malaysian Highway Authority
MHCM - Malaysian Highway Capacity Manual
PCE - Passenger car equivalency values
PSD - Passing sight distance
PWD - Public Work Department
SPM - Semi-poisson model
SSD - Stopping sight distance
TRB - Transportation Research Board

xxiv
LIST OF SYMBOLS
a - acceleration
D - sight distance
Db - braking distance
Dp - passing sight distance
Dr - reaction distance
Ds - stopping sight distance
g - gap
h - headway
hm - mean time headway
hij - Headway of vehicles class i under condition j
hp - time of headway vehicle p to preceding vehicle
k - density
kc - critical density
kj - jam density
L average length of vehicles in the traffic stream
q - flow
Q,qc - capacity
qm - maximum traffic flowrate
s - distance
Sw - Shockwave
t - time
tf - travel time at free-flow speed
u - speed
u, v - initial velocity and final velocity, respectively
uf - free-flow speed
uo - optimum speed
uo-v - Mean speed

CHAPTER 1
INTRODUCTION
1.1 Overview
Flow, speed and density are known three parameters that govern traffic
stream operations. For the purpose of quantifying traffic flow, often flow/density
relationship is used where flow is the dependent variable and density the
independent. Traffic flow contracts when capacity is oversubscribed. Direct
midblock opening on multi-lane highways is one of the factors that may trigger
traffic flow contraction and kinematic waves to an extent that has yet to be
quantified.
In Malaysia, peak hour traffic conflicts and congestions that at daily
occurrences at the highway intersections have continue to worsen. One commendable
attempt by authorities to solve the problems of intersection conflicts and congestion
is the installation of direct midblock facilities that will allow motorists to make U-
turning movements before reaching the intersection.
This thesis presents studies that investigated the influence of direct midblock
U-turn facilities at multilane highway on traffic flow reduction and their kinematic
wave implication. Relying on the flow, density and speed fundamental relationships,
traffic flow scenarios with and without midblock U-turn facilities under daylight and
dry weather conditions were modeled and compared. Where there are evidences to
show that traffic flow contraction has occurred, associated kinematic waves
propagations were investigated.
2
This chapter has been divided into six sections; in the immediate Section 1.2,
background to the research problem is presented. It will be followed by the research
objectives in Section 1.3. The method of study is discussed in Section 1.4. The scope
and limitations of the study are described in Section 1.5. The significance and
contributions of the study presented in Section 1.6. Organization of the thesis is
presented in Section 1.7.
1.2 Background to the research problem
Roads have a major impact on our daily lives. Roads serve as the primary
mean of access to employment, services and social activities. Moreover, by linking
people and other modes of transport, roadways are a tremendous asset for achieving
greater travel passage within and beyond Malaysia. Generally roads are built to
provide better accessibility and enhance mobility in Malaysia. Malaysia consists of
thirteen states and three federal territories and has a total landmass of 329,847m2
separated by the South China Sea into two similarly sized regions, Peninsular
Malaysia and Malaysian Borneo. The capital city is Kuala Lumpur. In 2010, the
population exceeded 27.5 million, with over 20 million living on the Peninsular.
Malaysia has a good road network. Roads are paved or unpaved, private or public.
Public roads are often referred to as highways and a road network is an
amalgamation of highways. A highway irrespective of functional classification is
made up of segments and intersections/interchanges.
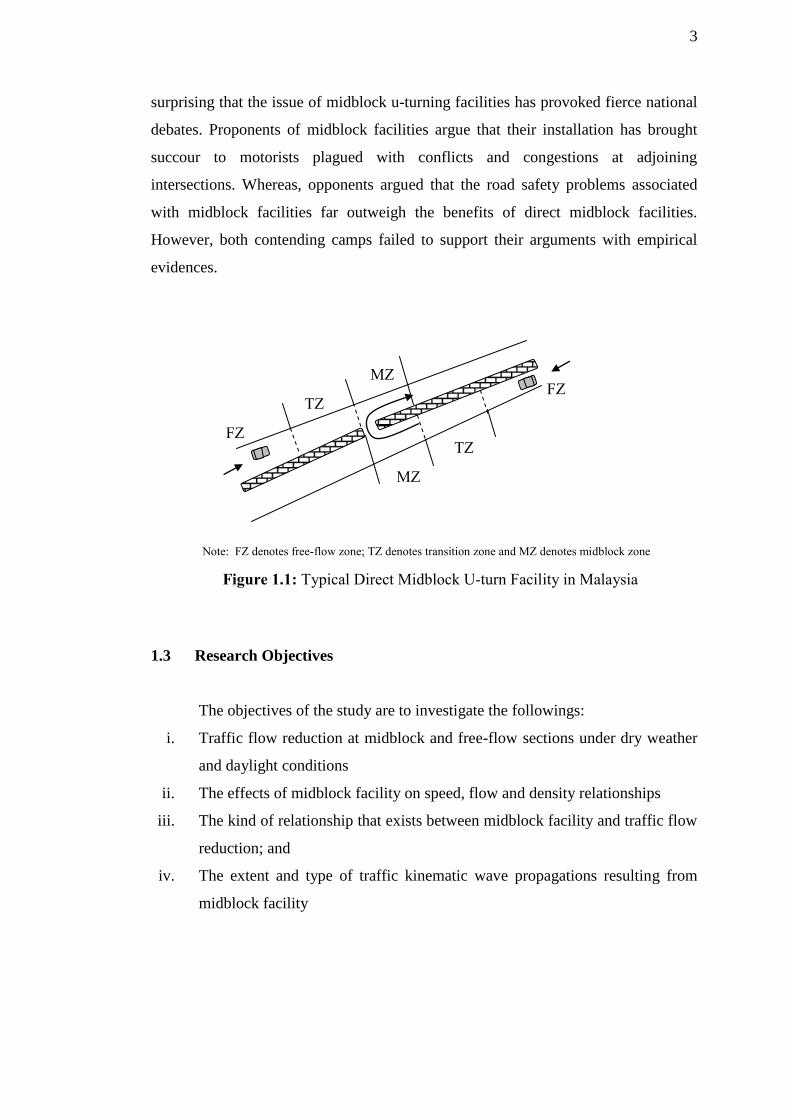
Midblock facilities are median openings on multi-lane highways as illustrated
in Figure 1.1. They are built as u-turning facilities aimed at easing traffic conflicts
and pressures at highway intersections. While some are built as complimentary
facilities to existing road geometric designs, others are built as a complete
replacement to existing facilities on the premises that they will reduce conflicts and
ease traffic congestions at adjoining intersections. In Malaysia, where the left hand
driving rule is in place, drivers decelerate when diverging; accelerate when
converging at the midblock facilities. These dangerous manoeuvres beg the
questions; „What are the traffic flow consequences when the lead vehicle decelerates
or accelerates abruptly? It can be argued that when the lead vehicle decelerates
abruptly in a traffic stream, kinematic waves can be triggered. Therefore, it is not
3
surprising that the issue of midblock u-turning facilities has provoked fierce national
debates. Proponents of midblock facilities argue that their installation has brought
succour to motorists plagued with conflicts and congestions at adjoining
intersections. Whereas, opponents argued that the road safety problems associated
with midblock facilities far outweigh the benefits of direct midblock facilities.
However, both contending camps failed to support their arguments with empirical
evidences.
MZ FZ
TZ
FZ TZ
MZ
Note: FZ denotes free-flow zone; TZ denotes transition zone and MZ denotes midblock zone
Figure 1.1: Typical Direct Midblock U-turn Facility in Malaysia
1.3 Research Objectives
The objectives of the study are to investigate the followings:
i. Traffic flow reduction at midblock and free-flow sections under dry weather
and daylight conditions
ii. The effects of midblock facility on speed, flow and density relationships
iii. The kind of relationship that exists between midblock facility and traffic flow
reduction; and
iv. The extent and type of traffic kinematic wave propagations resulting from
midblock facility
1.4 Method of the study

4
1.4 Method of the study
The method of study is both empirical and analytical. It is empirical because
sample surveys were taken at selected sites and analytical because flow, density and
speed relationships were used to develop models. Models were developed for two
scenarios (midblock facility and free-flow zones) under daylight and dry weather
conditions. Empirical data collected at selected sites reflected the study objectives as
stated in Section 1.3. Multi-lane highway with direct midblock facilities was divided
into three sections to reflect free-flow, transition and midblock restrained. Automatic
traffic counters were installed at the sections in order to collect traffic volume, speed,
headway, vehicle type continuously per time period. Collected data were collated and
fed into the developed models for evaluation of relevant traffic parameters. Once the
traffic contraction objective was achieved, associated kinematic wave propagations
as well as the acceptability of Malaysian Highway Capacity Manual (MHCM 2011)
passenger car equivalent values were investigated. Passenger car equivalent values
were adjusted where necessary and reapplied into the models.
1.5 Research Scope and limitations
The scope of this research is restricted to multi-lane highways because
midblock facilities with direct U-turning movements can only be found on such
roads. Multi-lane highways are classified as federal routes in Malaysia. There
carriageways are physically separated by central medians. All traffic volume and
speed survey data were collected with automatic traffic counters continuously for
eight weeks, only dry weather and daylight data were used for analysis. This is
needed in order to minimise multiple traffic flow contraction constraints aside from
midblock facilities. All selected sites have the same geometric design, good road
surface and layout so as to minimise errors associated with traffic volume and speed
data collection. Each directional flow is treated exclusively. Different empirical road
capacity estimation methods were considered and tested for suitability before using
the fundamental diagrams. Malaysian Highway Capacity Manual passenger car
equivalent values were modified and used to convert traffic volume to flow. With
regard to the research limitations; monsoon periods being November-January and
5
April to June were avoided in order to minimise the effect of wet and rainy
conditions on survey data. Only motorised vehicles were considered. The total
number of survey sites was constrained by fund, equipment and manpower;
nonetheless, eight sites were surveyed. Automatic traffic counters were often chained
to the nearest pole to minimise theft and vandalism. Survey sites were visited daily
during data collection period partly to check the state of the equipment and also to
download captured data from the equipment to a laptop.
1.6 Significance of the study
The influence of midblock facilities on traffic flow reduction and its effect on
kinematic wave propagation, have neither been fully explored, nor well understood.
Often passenger car equivalent values were broadly applied to all conditions and
kinematic wave treated as shockwave propagation in previous studies. In this study,
dynamic passenger car equivalent values were used and traffic shockwave taken as
function of traffic congestion. Modified passenger car equivalent values can point to
overestimation or underestimation of capacity values on specific sites and under
prevailing conditions. Traffic shockwave irrespective of what triggered it, is a safety
indicator on the roadway. The study would throw more light on the issues of traffic
shockwave at midblock facilities and by extension assist policy and decision making
process in Malaysia. The flow-speed relationships available in Malaysia Highway
Capacity Manual have serious limitations. This is so because speed is not a function
of flow. In particular they cannot be used to predict future traffic states. Whereas
the fundamental diagram approach used in the study gives a robust predictive tool for
computing traffic variables at the capacity state. The results of the capacity
predictions are consistent with attainable values on roadway sections and in line with
standard specifications. The findings in this thesis give highway capacity values
under different scenarios and can be incorporated into a wider strategy for dynamic
traffic management. Predicted capacity states can also be used for traffic
management scenario building.

6
1.7 Organisation of Thesis
The thesis is made up of eight chapters. This section provides brief
information about each chapter. Chapter 2 presents a theoretical background on
traffic flow contraction and disturbances. It provides the theoretic arguments on
which the research hinges. Empirical road capacity definitions, estimation methods,
generalised and specific capacity disturbances and their relationships with capacity,
passenger car equivalent values are discussed. Traffic kinematic, rarefaction and
shockwaves are all covered in this chapter.
Chapter 3 presents literature two-lane perdirection highways and midblock
facilities in Malaysia.
Chapter 4 is on midblock facilities impact study setup and data collection. It
gives the criteria for site selection, assessment of the selected sites, the survey
method employed, analytical framework, data, hypothesis and equipment testing.
Chapter 5 presents the empirical results from surveyed sites that include
traffic volume and speed profiles, graph dispersion plots, empirical evidence of flow
contraction, and macroscopic data and site summary.
Chapter 6 is on the main traffic flow contraction analysis using standard
Malaysia Highway Capacity Manual passenger car equivalent values.
Chapter 7 is based on traffic flow contraction using modified passenger car
equivalent values. The implications of traffic flow contraction on kinematic wave
propagations are also discussed.
Chapter 8 is the concluding chapter and it gives some research directions for
the future works.
REFERENCES
A Guide on Geometric Design of Roads, REAM-GL 2/2002, Road Engineering
Association of Malaysia.
Aggarwal,P.(2008). Fuzzy Model for Estimation of Passenger Car Unit. WSEAS
Transcations on Information Science and Applications., Vol.5(No.4),449-458.
Ahmed, A., Younghan, J. and Hesham, R. (2005). Developing Passenger Car
Equivalent Factors for Heavy Vehicles During Congestion. Journal Transportation
Engineering, 131(7), 514-523.
Ahmed, F. A., Fred, L. H. and Emily, S. R. (2002). Developing Passenger Car
Equivalent Factors for Heavy Vehicles on freeway During Queue Discharge Flow.
Transportation Research Part A: Policy and Practise, 36,725-742.
Akcelik. R.,(1991) “Travel Time Functions for Transportation Planning Purposes:
Davidson‟s Function, Its Time Dependent Form and an Alternative Travel Time
Function”, Australian Road Research, September 1991 Vol. 21, No.3
Alhassan, H.M. and Ben-Edigbe, J. (2011) Effect of Rainfall Intensity Variability on
Highway Capacity, European Journal of Scientific Research, 2011 b. 49(1): p. 117-
126; 123-129.

234
Al-Masaeid, H.R. 1999 Capacity of U-turn at median opening, Institution of
Transportation Engineering Journal, 69(6), 28-34
Arahan Teknik Jalan 1986 A guide on Geometric Design of Roads, No.8/86 Public
Works Departments Ministry of Works, Malaysia
Ben-Edigbe, J.; Ferguson, N. 2005. The Extent of Roadway Capacity Shift Resulting
from Pavement Distress. In Proceedings of the Institution of Civil Engineering,
Transport, 158(4): 27-32.
Ben-Edigbe, J. and Ferguson, N. (2009) Qualitative Road Service Reduction
Resulting from Pavement Distress, WIT International Conference on Urban
Transport, 23-25 July 2009. Bologna Italy.
Ben-Edigbe, J. (2010) Assessment of Speed, Flow and Density Functions under
Adverse Pavement Conditions, International Journal of Sustainable and planning 5
(3), 238-252.
Branston, D. (1976). Models of Single Lane Time Headway Distributions.
Transportation Science, 10(2).
Buckley, D. (1968). A Semi-Poisson Model of Traffic Flow. Transportation Science,
2, 107-133.
Ceulemans, W., Magd, A. W., Kurt De, P., and Geert, W. (2009). Modelling Traffic
Flow with Constant Speed using the Galerkin Finite Element Method, Proceedings of
the World Congress on Engineering London, U.K., Vol II.
Cunagin, W.D. and Messer, C.J. (1983). Passenger Car Equivalents for Rural
Highways Transportation Research Record, 905,61.

235
Davidson, K.B.A,(1966) “Flow-Travel Time Relationship for Use in Transportation
Planning”,Proc., 3rd 449 ARRB Conference, 1966 Vol. 3 No 1
Dowling, R., et al (1998) “The Accuracy and Performance of Improved Speed-flow
Curves” Road and Transport Research 1998 Vol.7 (2), pp 36-51
Elefteriadou,L., Torbic, D. and Webster, N. (1997). Development of Passenger Car
Equivalents for Freeways, Two-lane Highways and Arterials. Transportation
Research Record: Journal of Transportation Research Board, 1572,51.
FDOT Traffic Engineering and Operations Office Tallahassee, Florida March 2010.
Topic No 750-010-002, Speed Zoning For Highways, Roads and Streets in Florida.
Greenshields, B. D. (1935) A Study of Traffic Capacity; Highway Research Board
Proceedings, Vol. 14: 448-477.
Huber, M. J. (1982). Estimation of Passenger Car Equivalents of Trucks in Traffic
Stream. Transportation Research Record: Journal of Transportation Research Board,
869,60.
Hyde, T. and Wright, C.C. (1986). Extreme Value Methods for Estimating Road
Traffic Capacity. Transportation Research Part B,. 208(2), 125-138.
IDRA Road layout Design (2011) “Blueprint for Iskandar Malaysia” Iskandar
Development Regional Authority (IDRA), Johor Bahru, Malaysia ISBN 9 78-967-
5626-23-4 pp 15
James A. Bonneson, Patrick T. McCoy (2004) “Capacity and Operational Effects of
Midblock Left-Turn Lanes” Federal Highway Administration, National Research
Council (U.S.) Transportation Research Board 2004 Issue 395.

236
Keller, E.L. and Saklas, J.G. (1984). Passenger Car Equivalents from Network
Simulation. Journal of Transportation Engineering. Vol. 110, No.4. July. 397-411.
Kimber, R.M, Erica, M and Hollis (1979) Traffic queues and delays at road
junctions, Transport and Road research Laboratory report 909, Crowthorne, England.
Lighthill M.J and Whitham G, B (1955) “On kinematic waves, I: Flood movement in
long rivers. II: A theory of traffic flow on long crowded roads”, Proceedings Royal
Society,(London), A229, 281-345.
Malaysia Highway Capacity Manual (MHCM). 2011. Public Works Planning
Department, Ministry of Works, Malaysia.
Mallikarjuna, C. and Ramachandra, R.K. (2006). Modelling of Passenger Car
Equivalency under heterogeneous Traffic Conditions. Proceedings 22nd
ARRB
Conference-Research Into Practice., 1-13.
Miller, A.J. (1968). The Capacity of Signalised Intersections in Australia. Australian
Road Research Board Bulletin No.3.
Minderhoud, M.M.; Botma, H.; Bovy, P.H.L. 1997. Assessment of Roadway
Capacity Estimation Methods, Transportation Research Record: Journal of the
Transportation Research Board. DOI: http://dx.doi. org/10.3141/1572-08, 1572: 59-
67.
Pan Liu et al. (2008), “Capacity of U-turn Movement at Median Openings on Multilane
Highways” Journal of Transportation Engineering ASCE, pp 147-154.
Papendrect, H. Bothma, H. and Westland, D. (1980). Validation of Capacity
Estimators based on the Decomposition of the Distribution of Headways.
Transportation Research Laboratory, Delft University of Technology, Delft.

237
Planning Models”Transportation Research Record 1360.TRB National Research
Council, Washington D.C 1994
Rahman, M., and Nakamura, F. (2005). Measuring Passenger Car Equivalents (PCE)
for Non Motorized Vehicles (Rickshaws) at Midblock Sections., Journal of the
Eastern Asia Society for Transportation Studies., Vol. 6., 119-126.
Rahman, M., Okura, I. and Nakamura, F. (2003). Measuring Passenger Car
Equivalents (PCE) for Large Vehicles at Signalized Intersections., Journal of the
Eastern Asia Society for Transportation Studies., Vol. 5, 1223-1233.
Road Layout Design 2011 Blueprint for Iskandar Malaysia, Iskandar Development
Regional Authority (IDRA), Johor Bahru, Malaysia ISBN 9 78-967-5626-23-4 pp
15.
Seguin, E.L. et. Al (1998), Passenger Car Equivalents on Urban Freeways Interim
Report, DTFH61-C00100, Institute for Research (IR), State Collage, Pennsylvania
USA.
Source from WHO, 2009 Global status report on road safety stated that Malaysia in
ranked at No. 46 of 172.
Statistik Jalan (2011) Bahagian Senggara Fsiliti Jalan, Cawangan Kejuruteraan
Senggara, Ibu Pejabat JKR Malaysia, Kuala Lumpur.
Sumner, R.Hill. D., and Shapiro,S. (1984). Segment Passenger Car Equivalent
Values for Cost Allocation on Urban Arterial Roads. Transportation Research. Vol.
18A, No.5/6. Dec. 399-406.

238
Tanner, J.C (1962), A Theoretical analysis of delays at an uncontrolled intersection,
Biometrika, 49 (1962) pp 163-70
Transportation Research Board (1997) “Capacity and Operational Effects of
Midblock Left-Turn Lanes” NCHRP Report 395 Transportation Research Board
Washington DC USA
Transportation Research Board 2010 Highway Capacity Manual 5th
edition cover.
The Highway Capacity Manual (HCM), Transportation Research Board,
Washington, DC.
TRB,1997, Capacity and operational effects of midblock left-turn lanes. NCHRP
Report 395 Transportation Research Board, Washington DC, USA.
U.S. Department of Transportation (2003). Manual on uniform traffic control devices
for streets and highway (MUTCD). U.S. Department of Transportation, Washington,
DC.
U.S. Highway Capacity Manual (1965). Highway Research Board National Research
Council, Department of Traffic and Operations, Special Report 87, Committee on
Highway Capacity, Washington, DC.
U.S. Highway Capacity Manual (1994). Special Report 209, Transportation Research
Board National Research Council,, Washington, DC.
U.S. Highway Capacity Manual (1998). Special Report 209, Transportation Research
Board National Research Council,, Washington, DC.,USA (“HCM 1997).
U.S. Highway Capacity Manual (2000)., Transportation Research Board National
Research Council,, Washington, DC.

239
U.S. Highway Capacity Manual (2010., Transportation Research Board National
Research Council,, Washington, DC.
Van Aerde, M and Yagar,S. (1984). Single Regime Speed-Flow-Density
Relationship for Freeways and Arterials. Presented at the 74th
Annual Meeting,
Transportation Research Board, National research Council, Washington D.C.
Van Arem, B, et al. (1998) “Design of the Procedures for Current Capacity
Estimation and Travel Time Congestion Monitoring “DRIVE-11” Sept.1998 Project
V2044 Commission of the European Communities, (CEC)
Wasielewski, P. (1976). Car Following Headways on Freeways Interpreted by the
Semi-Poisson Headway Distribution Model. Tansportation Science, Vol. 13, No.1,
36-55.
Zhou, Hsu, Lu, and Wright (2003) Optimal Location of U-turn Median Openings on
Roadways Transportation Research Board 82nd Annual Meeting, January 12-16,
2003.