Embed Size (px)
Citation preview
ifoWORLD ECONOMIC SURVEY
2018May
Vol. 17
World Economic Climateifo World Economic Climate Deteriorates
Advanced Economies Upturn in the Advanced Economies Loses its Momentum
Emerging and Developing EconomiesRecovery in Emerging Market and Developing Economies Cools Down
Special TopicUS Tax and Trade Policy – Perceived Impact and Preferred Policy Responses Worldwide
ifo World Economic SurveyISSN 2511-7831 (print version)ISSN 2511-784X (electronic version)A quarterly publication on the world economic climatePublisher and distributor: ifo InstitutePoschingerstr. 5, D-81679 Munich, GermanyTelephone ++49 89 9224-0, Telefax ++49 89 985369, e-mail [email protected] subscription rate: €40.00Single subscription rate: €10.00 Shipping not included Editor of this issue: Dorine Boumans, Ph.D., e-mail [email protected] Reproduction permitted only if source is stated and copy is sent to the Ifo Institute.
All time series presented in this document plus additional series for about 70 countries may be ordered from the Ifo Institute. For further information please contactMrs. Ikonomou-Baumann ([email protected])
Authors of this publication:Dorine Boumans, Ph.D., e-mail [email protected] (ifo Center for Macroeconomics and Surveys)Carla Krolage, e-mail [email protected] (ifo Center for Macroeconomics and Surveys)Survey assistant: Sophia Tröger

ifo WORLD ECONOMIC SURVEY VOLUME 17, NUMBER II, MAY 2018
ifo World Economic Climate Deteriorates
Upturn in the Advanced Economies Loses Its Momentum 3
Recovery in Emerging Market and Developing Economies Continues Cools Down 6
US Tax and Trade Policy – Perceived Impact and Preferred Policy Responses Worldwide 10
Figures 20
NOTES
The World Economic Survey (WES) assesses global economic trends by polling transnational and national organ-isations worldwide on current economic developments in their respective countries. Its results offer a rapid, up-to-date assessment of the current economic situation internationally. In April 2018, 1,155 economic experts in 120 countries were polled.
METHODOLOGY AND EVALUATION TECHNIQUE
The survey questionnaire focuses on qualitative information: assessments of a country’s general economic situa-tion and expectations regarding key economic indicators. It has proven a useful tool, since it reveals economic changes earlier than conventional business statistics.
The qualitative questions in the World Economic Survey have three possible categories: “good / better / higher” (+) for a positive assessment resp. improvement, “satisfactory / about the same / no change” (=) for a neutral assessment, and “bad / worse / lower” (−) for a negative assessment resp. deterioration; The individual replies are combined for each country without weighting as an arithmetic mean of all survey responses in the respective country. Thus, for the time t for each qualitative question and for each country the respective percent-age shares (+), (=) and (−) are calculated. The balance is the difference between (+)- and (−)-shares. As a result, the balance ranges from -100 points and +100 points. The mid-range lies at 0 points and is reached if the share of positive and negative answers is equal.
The survey results are published as aggregated data. For aggregating the country results to country groups or regions, the weighting factors are calculated using the gross domestic product based on purchasing-power-par-ity of each country.
3ifo World Economic Survey II/ 2018 May Volume 17
ifo World Economic Climate Deteriorates
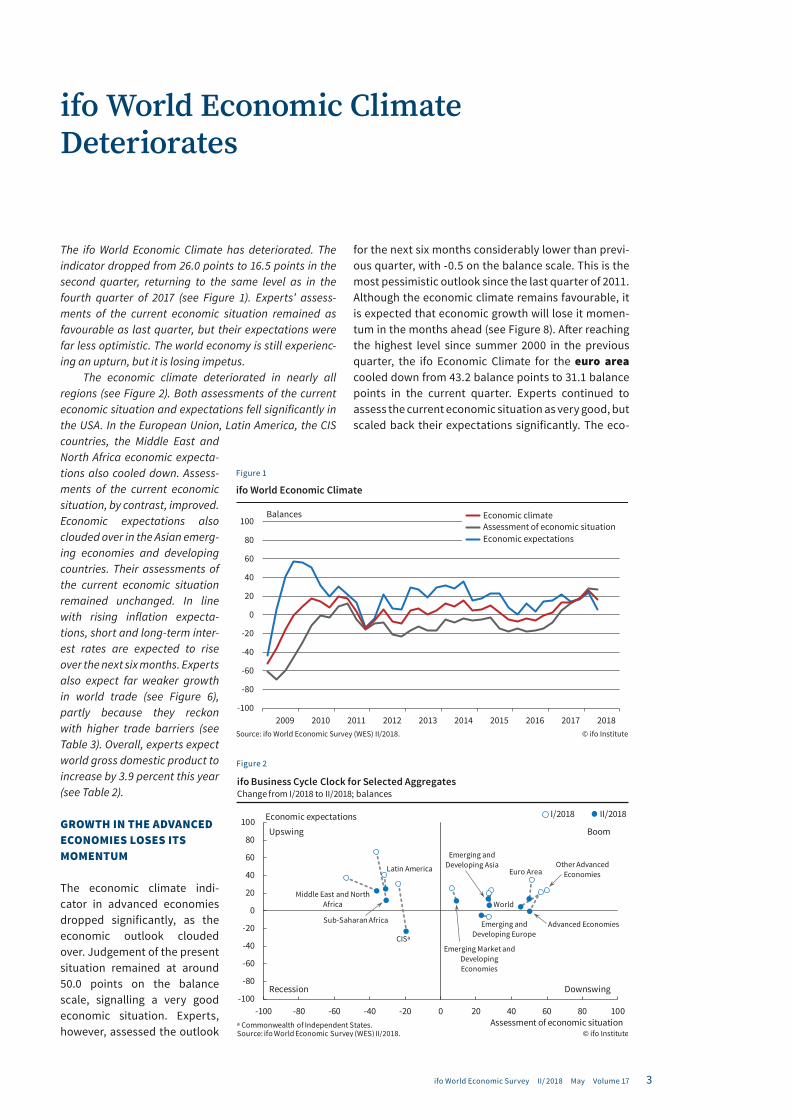
The ifo World Economic Climate has deteriorated. The indicator dropped from 26.0 points to 16.5 points in the second quarter, returning to the same level as in the fourth quarter of 2017 (see Figure 1). Experts’ assess-ments of the current economic situation remained as favourable as last quarter, but their expectations were far less optimistic. The world economy is still experienc-ing an upturn, but it is losing impetus.
The economic climate deteriorated in nearly all regions (see Figure 2). Both assessments of the current economic situation and expectations fell significantly in the USA. In the European Union, Latin America, the CIS countries, the Middle East and North Africa economic expecta-tions also cooled down. Assess-ments of the current economic situation, by contrast, improved. Economic expectations also clouded over in the Asian emerg-ing economies and developing countries. Their assessments of the current economic situation remained unchanged. In line with rising inflation expecta-tions, short and long-term inter-est rates are expected to rise over the next six months. Experts also expect far weaker growth in world trade (see Figure 6), partly because they reckon with higher trade barriers (see Table 3). Overall, experts expect world gross domestic product to increase by 3.9 percent this year (see Table 2).
GROWTH IN THE ADVANCED ECONOMIES LOSES ITS MOMENTUM
The economic climate indi-cator in advanced economies dropped significantly, as the economic outlook clouded over. Judgement of the present situation remained at around 50.0 points on the balance scale, signalling a very good economic situation. Experts, however, assessed the outlook
for the next six months considerably lower than previ-ous quarter, with -0.5 on the balance scale. This is the most pessimistic outlook since the last quarter of 2011. Although the economic climate remains favourable, it is expected that economic growth will lose it momen-tum in the months ahead (see Figure 8). After reaching the highest level since summer 2000 in the previous quarter, the ifo Economic Climate for the euro area cooled down from 43.2 balance points to 31.1 balance points in the current quarter. Experts continued to assess the current economic situation as very good, but scaled back their expectations significantly. The eco-
-100
-80
-60
-40
-20
0
20
40
60
80
100
2009 2010 2011 2012 2013 2014 2015 2016 2017 2018
ifo World Economic Climate
© ifo Institute
Balances
Source: ifo World Economic Survey (WES) II/2018.
Economic climateAssessment of economic situationEconomic expectations
Figure 1
World
Euro Area
CISᵃ
Latin America
Advanced Economies
Emerging and Developing Asia
Emerging and Developing Europe
Emerging Market and Developing Economies
Middle East and North Africa
Other Advanced Economies
Sub-Saharan Africa
-100
-80
-60
-40
-20
0
20
40
60
80
100
-100 -80 -60 -40 -20 0 20 40 60 80 100
Upswing
DownswingRecession
Change from I/2018 to II/2018; balances
Economic expectations
Assessment of economic situation© ifo InstituteSource: ifo World Economic Survey (WES) II/2018.
Boom
II/2018I/2018
ifo Business Cycle Clock for Selected Aggregates
ᵃ Commonwealth of Independent States.
Figure 2
4 ifo World Economic Survey II/ 2018 May Volume 17
nomic upturn will slow down as a result. Experts expect growth of 2.2 percent for this year, versus 2.4 percent growth in 2017. The economic climate deteriorated in all key countries in the euro area. The only exception is Spain, where the climate indicator rose again after slumping at the end of 2017. The referendum on Cat-alan independence on the first of October in 2017 has caused economic and political insecurity. This, in turn, resulted in a pessimistic outlook in the October survey of 2017. The economic outlook is currently recovering for the second quarter in a row, resulting in a more posi-tive economic climate. Political instability nevertheless remains the most pressing economic problem facing Spain, with 85.7% of Spanish respondents indicating this as an economic problem. This is slightly down from 91.2% from the October survey in 2017. In Italy, the cli-mate clouded over heavily, with experts significantly scaling back both their assessments of the current eco-nomic situation and their expectations. Italy is the only country from the euro area where the economic climate deteriorated that much that it entered the recession quadrant (see Figure 4). Italian experts do not seem to have any confidence in the economic policy of their government, as 92.3% of the experts indicated this as a problem facing Italy. In addition, experts reported legal and administrative barriers for business (92.3%) and political instability (80.0%) as hindering the economy. Survey participants in Germany and France are also more pessimistic about the future than in the previous survey, but their assessments of the current economic situation remain firmly positive. According to 92.3% experts, the main economic problem facing France now is the lack of international competitiveness. Across the Euro Area, the experts surveyed were far more neg-ative about the outlook for domestic investment, pri-vate consumption and export demand (for trade expec-tations see Figure 6). The expected inflation rate for this year edged downwards to 1.6 percent (see Table 1). Sur-vey participants cited a shortage of qualified staff as a constraint on growth. Only long term interest rates are expected to rise in the coming months (see Figure 7).
The economic climate in the remaining G7 coun-tries showed a similar development, with the economic outlook dropping just below the zero line and assess-ments of the present situation downwardly adjusted. Here, the only exception proved to be the United King-dom, where assessments of the current economic per-formance and the economic outlook, although they remain at a low level (see Figure 9.3). In contrast to the Euro Area, the outlook for investment and private con-sumption were also upgraded in the UK, but remain negative. UK experts cited a lack of confidence in the current government’s economic policy as a constraint on growth (87.1%). Other problems cited included inad-equate infrastructure (74.2%), shortage of qualified staff (70.0%) and a widening income inequality (70.0%). Canada’s economic climate also improved as expert’s assessments on the economic outlook were more pos-itive than in the previous survey. Trade barriers to
Box1
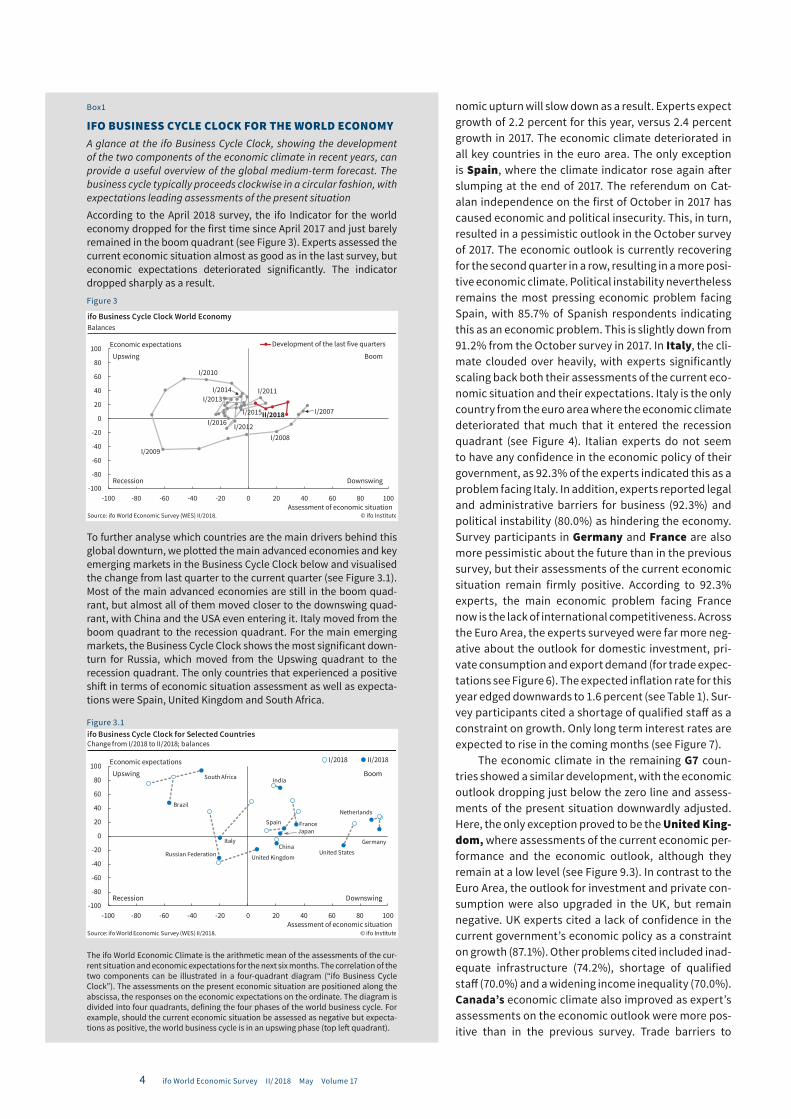
IFO BUSINESS CYCLE CLOCK FOR THE WORLD ECONOMYA glance at the ifo Business Cycle Clock, showing the development of the two components of the economic climate in recent years, can provide a useful overview of the global medium-term forecast. The business cycle typically proceeds clockwise in a circular fashion, with expectations leading assessments of the present situation
According to the April 2018 survey, the ifo Indicator for the world economy dropped for the first time since April 2017 and just barely remained in the boom quadrant (see Figure 3). Experts assessed the current economic situation almost as good as in the last survey, but economic expectations deteriorated significantly. The indicator dropped sharply as a result. Figure 3
To further analyse which countries are the main drivers behind this global downturn, we plotted the main advanced economies and key emerging markets in the Business Cycle Clock below and visualised the change from last quarter to the current quarter (see Figure 3.1). Most of the main advanced economies are still in the boom quad-rant, but almost all of them moved closer to the downswing quad-rant, with China and the USA even entering it. Italy moved from the boom quadrant to the recession quadrant. For the main emerging markets, the Business Cycle Clock shows the most significant down-turn for Russia, which moved from the Upswing quadrant to the recession quadrant. The only countries that experienced a positive shift in terms of economic situation assessment as well as expecta-tions were Spain, United Kingdom and South Africa.
Figure 3.1
The ifo World Economic Climate is the arithmetic mean of the assessments of the cur-rent situation and economic expectations for the next six months. The correlation of the two components can be illustrated in a four-quadrant diagram (“ifo Business Cycle Clock”). The assessments on the present economic situation are positioned along the abscissa, the responses on the economic expectations on the ordinate. The diagram is divided into four quadrants, defining the four phases of the world business cycle. For example, should the current economic situation be assessed as negative but expecta-tions as positive, the world business cycle is in an upswing phase (top left quadrant).
-100
-80
-60
-40
-20
0
20
40
60
80
100
-100 -80 -60 -40 -20 0 20 40 60 80 100
Development of the last five quarters
I/2007
I/2009
I/2008
I/2010
I/2011
I/2012
I/2013
Upswing Boom
DownswingRecession
ifo Business Cycle Clock World Economy
II/2018
I/2014
I/2015I/2016
Economic expectations
Assessment of economic situation© ifo InstituteSource: ifo World Economic Survey (WES) II/2018.
Balances
France
United States
Italy
SpainNetherlands
Brazil
ChinaGermany
United Kingdom
Japan
India
Russian Federation
South Africa
-100
-80
-60
-40
-20
0
20
40
60
80
100
-100 -80 -60 -40 -20 0 20 40 60 80 100
Upswing
DownswingRecession
Change from I/2018 to II/2018; balances
Economic expectations
Assessment of economic situation© ifo InstituteSource: ifo World Economic Survey (WES) II/2018.
ifo Business Cycle Clock for Selected Countries
Boom
II/2018I/2018
5ifo World Economic Survey II/ 2018 May Volume 17
exports, as well as lack of innovation, were most fre-quently cited as hindering the economy (64.3%). In addition, 61.5% of Canadian experts reported a lack of confidence in the government’s economic policy as a problem, compared to 33.3% in previous survey. The expected inflation rate for 2018 was upwardly revised from 2.0 to 2.3 (see Table 1). In the United States, the economic climate dropped from 46.0 to 23.9 points on the balance scale. The current situation was only mar-ginally scaled back, but the economic outlook plum-meted by -32.1 points and now sits at -13.0. This is also reflected in the outlook for investment, domestic con-sumption and export demand, as assessments turned negative on all three indicators. The biggest structural problem hindering the US economy remains the widen-ing income inequality gap and inadequate infrastruc-ture. Other problems facing the US include low confi-
dence in government economic policy and a shortage of qualified staff, with 73.3% of US experts identifying this as a problem. Nevertheless, interest rates, both short and long term are expected to increase by the end of the next six months (see Figure 7). In Japan, the eco-nomic climate deteriorated, but the indicator stayed positive at 13.2 points. Due to more negative assess-ments of both the current situation and the economic outlook, Japan is following the trend that is emerging in most developed countries. Economic growth will still expand, but at a lower rate in the coming months. 66.7% of experts cited a lack of innovation as hindering the economy, making it the biggest issue for Japan. Low confidence in its government economic policy was cited by 64.0% of the experts.
A slowdown in growth is also becoming apparent for Other Advanced Economies. The economic cli-
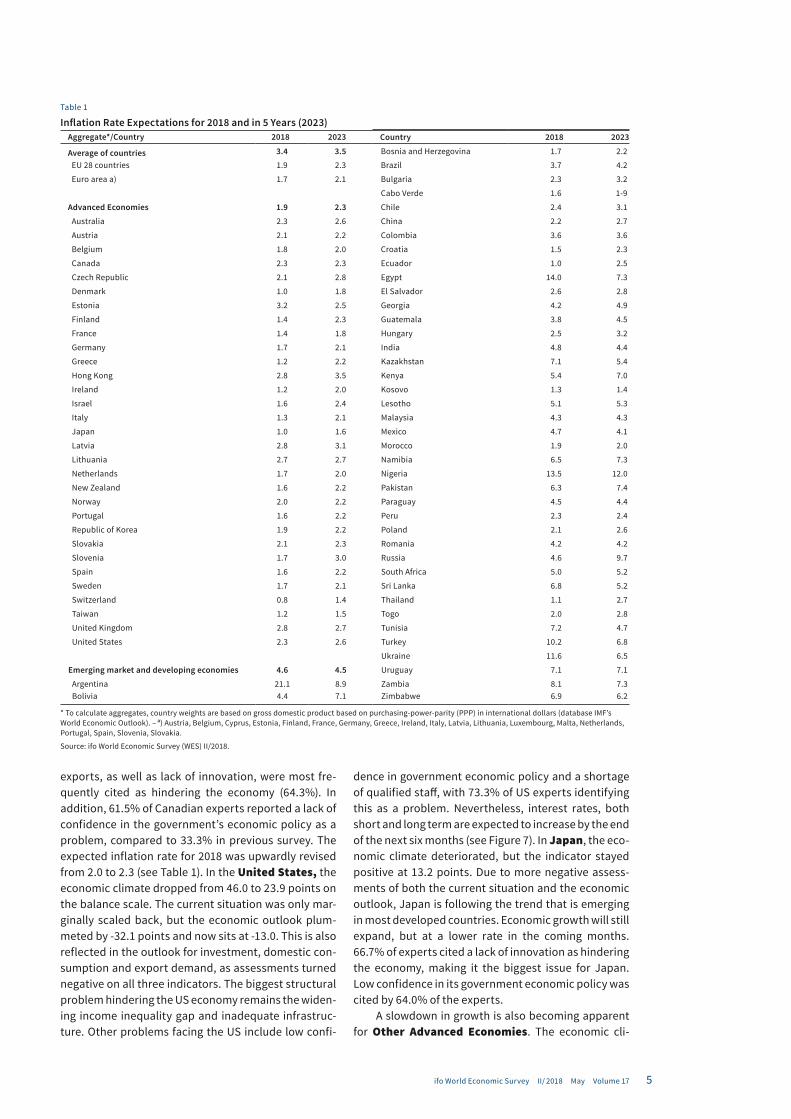
Table 1
Inflation Rate Expectations for 2018 and in 5 Years (2023)Aggregate*/Country 2018 2023 Country 2018 2023
Average of countries 3.4 3.5 Bosnia and Herzegovina 1.7 2.2
EU 28 countries 1.9 2.3 Brazil 3.7 4.2
Euro area a) 1.7 2.1 Bulgaria 2.3 3.2
Cabo Verde 1.6 1-9
Advanced Economies 1.9 2.3 Chile 2.4 3.1
Australia 2.3 2.6 China 2.2 2.7
Austria 2.1 2.2 Colombia 3.6 3.6
Belgium 1.8 2.0 Croatia 1.5 2.3
Canada 2.3 2.3 Ecuador 1.0 2.5
Czech Republic 2.1 2.8 Egypt 14.0 7.3
Denmark 1.0 1.8 El Salvador 2.6 2.8
Estonia 3.2 2.5 Georgia 4.2 4.9
Finland 1.4 2.3 Guatemala 3.8 4.5
France 1.4 1.8 Hungary 2.5 3.2
Germany 1.7 2.1 India 4.8 4.4
Greece 1.2 2.2 Kazakhstan 7.1 5.4
Hong Kong 2.8 3.5 Kenya 5.4 7.0
Ireland 1.2 2.0 Kosovo 1.3 1.4
Israel 1.6 2.4 Lesotho 5.1 5.3
Italy 1.3 2.1 Malaysia 4.3 4.3
Japan 1.0 1.6 Mexico 4.7 4.1
Latvia 2.8 3.1 Morocco 1.9 2.0
Lithuania 2.7 2.7 Namibia 6.5 7.3
Netherlands 1.7 2.0 Nigeria 13.5 12.0
New Zealand 1.6 2.2 Pakistan 6.3 7.4
Norway 2.0 2.2 Paraguay 4.5 4.4
Portugal 1.6 2.2 Peru 2.3 2.4
Republic of Korea 1.9 2.2 Poland 2.1 2.6
Slovakia 2.1 2.3 Romania 4.2 4.2
Slovenia 1.7 3.0 Russia 4.6 9.7
Spain 1.6 2.2 South Africa 5.0 5.2
Sweden 1.7 2.1 Sri Lanka 6.8 5.2
Switzerland 0.8 1.4 Thailand 1.1 2.7
Taiwan 1.2 1.5 Togo 2.0 2.8
United Kingdom 2.8 2.7 Tunisia 7.2 4.7
United States 2.3 2.6 Turkey 10.2 6.8
Ukraine 11.6 6.5
Emerging market and developing economies 4.6 4.5 Uruguay 7.1 7.1
Argentina 21.1 8.9 Zambia 8.1 7.3Bolivia 4.4 7.1 Zimbabwe 6.9 6.2
* To calculate aggregates, country weights are based on gross domestic product based on purchasing-power-parity (PPP) in international dollars (database IMF’s World Economic Outlook). – a) Austria, Belgium, Cyprus, Estonia, Finland, France, Germany, Greece, Ireland, Italy, Latvia, Lithuania, Luxembourg, Malta, Netherlands, Portugal, Spain, Slovenia, Slovakia.
Source: ifo World Economic Survey (WES) II/2018.
6 ifo World Economic Survey II/ 2018 May Volume 17
mate indicator of the other advanced economies dropped from 41.1 to 23.8 points, which is still very robust. The only country to see an improvement in its economic climate due to better assessments of eco-nomic performance and outlook was Australia (see Figure 9). The outlook on investment and was down-wardly revised, but remains positive. Expectations for the coming six months on domestic consumption and export demand improved slightly. The two most press-ing economic problems facing Australia, according to WES experts, are inadequate infrastructure and a lack of innovation. In the Czech Republic, all experts reported a favourable current economic situation, with the indicator reaching 100 points on the balance scale for the fourth consecutive quarter. However, the eco-nomic outlook clouded over for the first time since October 2012 and the indicator now sits at -33.3 points (see Figure 9). The economic climate, although less favourable than in the previous survey, remained posi-tive at 23.6 points (see Figure 5). The expected inflation rate was downwardly revised by 0.3 percentage points to 2.1 percent (see Table 1). A lack of qualified staff was reported by all Czech experts as constraining the economy.
RECOVERY IN EMERGING MARKET AND DEVELOPING ECONOMIES COOLS DOWN.
The climate for emerging markets and developing economies remained positive for the fifth quarter in a row. The indicator nevertheless decreased by 5.4 points to 10.2 on the balance scale. Although experts improved their assessments of the current situation to 9.0 points, the economic outlook clouded over. From the emerging market and developing economies, the CIS countries showed the greatest deterioration, as Russia’s economic climate plummeted (see Figure 10.3). Corruption, widening income inequality and a lack of innovation were the most pressing economic problems indicated by the WES experts in this region (see Table 3).
Economic performance in the main emerging mar-kets (Brazil, Russia, India, China and South Africa – BRICS) followed the trend led by the advanced econo-mies. Economic expectations were less positively assessed than in the previous survey, while assess-ments of present economic performance increased slightly. The only exception was South Africa, where almost all WES experts expect improvements in the next six months. Current economic performance remained low at -33.3 points. The economic outlook indicator reached 94.4 points, which is the highest value since 2000. Expectations of the newly-elected president Cyril Ramaphosa are high and the challenges facing him are huge, as all South African experts indi-cated corruption and widening income inequality as the main constraint on the country’s economy. Infla-tion rate expectations were downwardly revised by 0.5 percentage points to 5.0 percent for this year (see Table
1). Expected growth in GDP for South Africa increased from 0.9% in 2017 to 1.8% in 2018 (see Table 2). India’s economic climate slightly recovered thanks to better assessments of economic performance than in the pre-vious survey. The economic outlook, by contrast, dete-riorated slightly compared to the last survey, remains however very optimistic. The upward trend in the Indian economy is likely to continue. The outlook for investment, domestic demand and export demand was valued more negatively than previous survey, but remained positive. Experts in India expect GDP growth of 7.2 percent this year, 0.2 percent higher than their expectations in 2017. Factors hindering the economy, according to WES experts, include inadequate infra-structure, corruption and the widening income ine-quality gap. China’s economic climate dropped slightly by 3.2 points to 4.5 points on the balance scale. Assess-ments of the present economic situation remained the same as in the previous survey, while the economic out-look clouded over somewhat. Assessments of the out-look for the export sector in particular were more neg-ative. Tensions related to the threat of a trade war with the US is perhaps the underlying factor why an increas-ing number of WES experts for China report that trade barriers to exports, as wells as an unfavourable climate for foreign investors, are hindering the Chinese econ-omy. Nevertheless, the most pressing problem remains growing income inequality, according to the experts surveyed. The value of the US dollar is expected to decrease. GDP expectations for 2018 of 6.5%, are 0.5% higher than the expectations for 2017 (see Table 2). Inflation rate expectations for 2018 are set at 2.2% and 2.7% in 2023 (see Table 1). Both short and long-term interest rates were downwardly revised in this survey (see Figure 7). Current economic performance in Brazil dropped only slightly by 2.9 points, but was already very negative and now stands at -56.5 points on the bal-ance scale. The economic outlook is also less positive than in the previous survey, resulting in the economic climate turning negative for the first time since 2013. Over 80% of the experts surveyed indicated that insuf-ficient demand, inadequate infrastructure, a lack of international competitiveness, growing income ine-quality and corruption are hindering the Brazilian economy. However, a growing number of experts (57%) also mentioned trade barriers to exports as a con-straint, versus just 43.5% of experts previously. Expected growth in GDP for 2018 of 2.3% is significantly better than for 2017 (0.6%) (see Table 2). In Brazil, the short-term interest rates are expected to increase, whereas, the experts expect a big drop in long-term interest rates (see Figure 7). The GDP growth expecta-tions for Russia of 5.1% are significantly higher than expectations for 2017 (1.0%) (see Table 2). This, how-ever, was not reflected in the economic climate indica-tor, which deteriorated to -25.9 points on the balance scale, marking the worst climate value since the third quarter of 2016. This deterioration was due to a wors-ening of the economic outlook. Corruption was the
7ifo World Economic Survey II/ 2018 May Volume 17
World
United StatesCanadaMexico
Euro areaGermanyFranceItalySpainNetherlandsAustriaGreece
United KingdomSwitzerland
Czech RepublicHungaryPolandRussiaTurkey
Japan
ChinaIndiaSouth KoreaTaiwan
AustraliaBrazilSouth AfricaOPEC
I II III IV I II III IV I II III IV I II III IV I II III IV I II III IV I II III IV I II III IV I II III IV I II III IV I II III IV20132008 2009 2010 2011 2012 2014 2015 2016 2017 2018
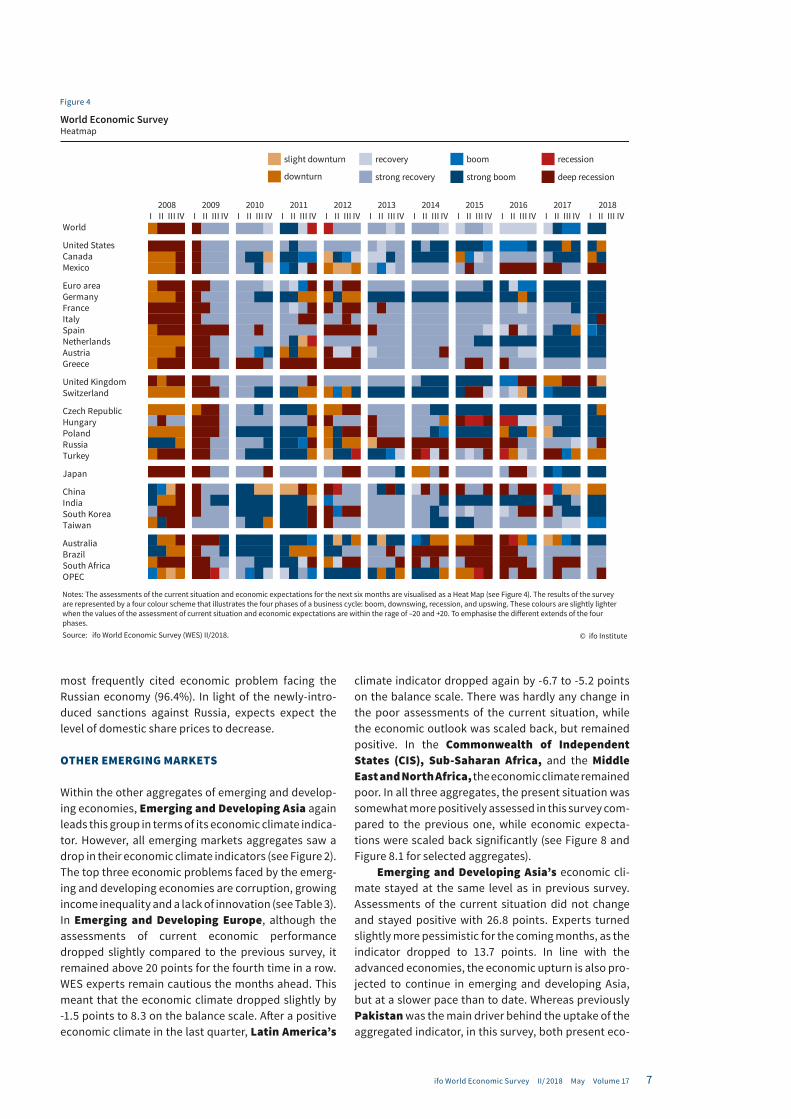
World Economic SurveyHeatmap
slight downturn
downturn
recession
deep recession
recovery
strong recovery
boom
strong boom
© ifo Institute
Notes: The assessments of the current situation and economic expectations for the next six months are visualised as a Heat Map (see Figure 4). The results of the survey are represented by a four colour scheme that illustrates the four phases of a business cycle: boom, downswing, recession, and upswing. These colours are slightly lighter when the values of the assessment of current situation and economic expectations are within the rage of –20 and +20. To emphasise the different extends of the four phases. Source: ifo World Economic Survey (WES) II/2018.
Figure 4
most frequently cited economic problem facing the Russian economy (96.4%). In light of the newly-intro-duced sanctions against Russia, expects expect the level of domestic share prices to decrease.
OTHER EMERGING MARKETS
Within the other aggregates of emerging and develop-ing economies, Emerging and Developing Asia again leads this group in terms of its economic climate indica-tor. However, all emerging markets aggregates saw a drop in their economic climate indicators (see Figure 2). The top three economic problems faced by the emerg-ing and developing economies are corruption, growing income inequality and a lack of innovation (see Table 3). In Emerging and Developing Europe, although the assessments of current economic performance dropped slightly compared to the previous survey, it remained above 20 points for the fourth time in a row. WES experts remain cautious the months ahead. This meant that the economic climate dropped slightly by -1.5 points to 8.3 on the balance scale. After a positive economic climate in the last quarter, Latin America’s
climate indicator dropped again by -6.7 to -5.2 points on the balance scale. There was hardly any change in the poor assessments of the current situation, while the economic outlook was scaled back, but remained positive. In the Commonwealth of Independent States (CIS), Sub-Saharan Africa, and the Middle East and North Africa, the economic climate remained poor. In all three aggregates, the present situation was somewhat more positively assessed in this survey com-pared to the previous one, while economic expecta-tions were scaled back significantly (see Figure 8 and Figure 8.1 for selected aggregates).
Emerging and Developing Asia’s economic cli-mate stayed at the same level as in previous survey. Assessments of the current situation did not change and stayed positive with 26.8 points. Experts turned slightly more pessimistic for the coming months, as the indicator dropped to 13.7 points. In line with the advanced economies, the economic upturn is also pro-jected to continue in emerging and developing Asia, but at a slower pace than to date. Whereas previously Pakistan was the main driver behind the uptake of the aggregated indicator, in this survey, both present eco-
8 ifo World Economic Survey II/ 2018 May Volume 17
nomic situation and expectations were more nega-tively assessed, resulting in a barely positive economic climate indicator of 3.5 points. The Asean 51 experts (see Figure 8) lowered their assessments of both pres-ent economic situation and the economic outlook. As a result, their economic climate worsened somewhat. Corruption and a lack of qualified staff were mostly cited as hindering economic growth in these countries.
The economic climate indicator in for Emerging and Developing Europe saw a slight drop of -1.5 points, but stayed positive at 8.3 points on the balance scale. The present economic situation was assessed as
1 Indonesia, Malaysia, Singapore, Philippines and Thailand.
favourable at 23.0 points. Experts remain slightly pes-simistic for the months ahead, but less so than in the previous survey. A lack of innovation and skilled labour were cited as hindering economic growth. Bulgaria, Croatia and Hungary saw their economic climate indi-cator drop, but it remained well above the zero line in all three countries. This suggests that economic growth will continue, but at a slightly slower pace than previ-ously. Romania, on the other hand, also saw its climate indicator drop to -6.1 points on the balance scale. This is mainly due to more pessimistic sentiment for the coming months. The current economic situation, by contrast, remained favourable at 21.7 points. In Tur-key, the experts surveyed lowered their assessments of the current situation back to 0.0 points on the bal-
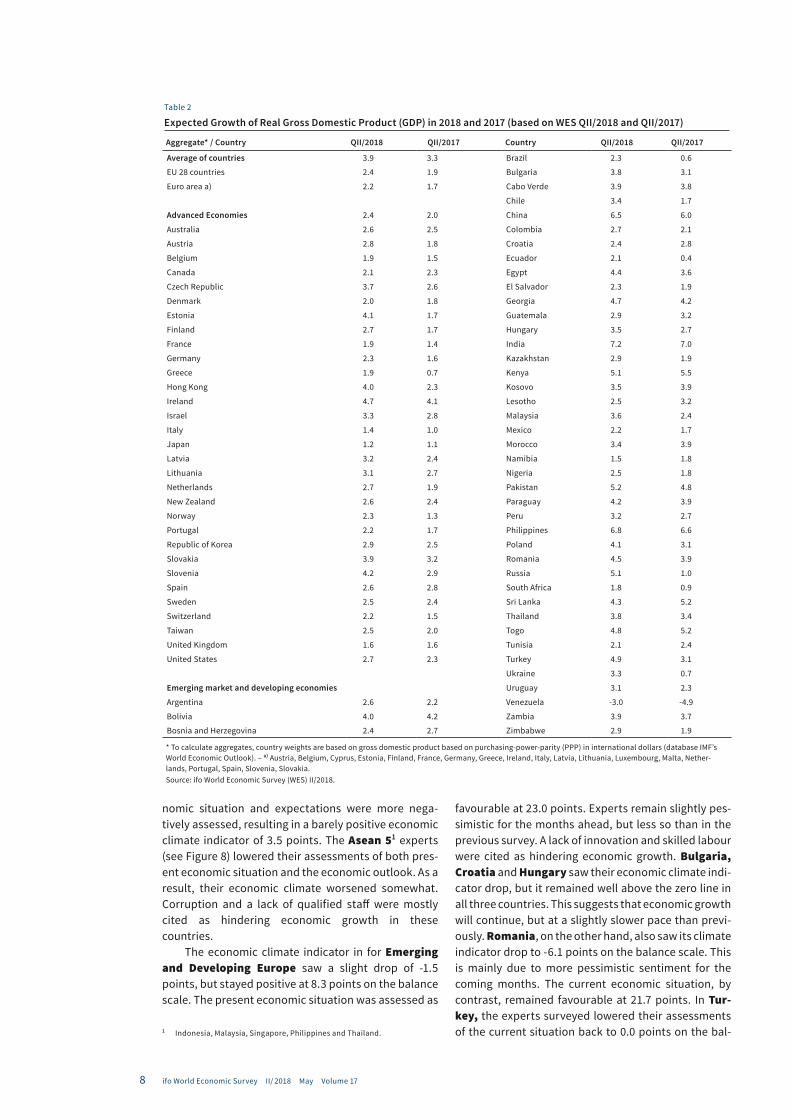
Table 2
Expected Growth of Real Gross Domestic Product (GDP) in 2018 and 2017 (based on WES QII/2018 and QII/2017)
Aggregate* / Country QII/2018 QII/2017 Country QII/2018 QII/2017
Average of countries 3.9 3.3 Brazil 2.3 0.6
EU 28 countries 2.4 1.9 Bulgaria 3.8 3.1
Euro area a) 2.2 1.7 Cabo Verde 3.9 3.8
Chile 3.4 1.7
Advanced Economies 2.4 2.0 China 6.5 6.0
Australia 2.6 2.5 Colombia 2.7 2.1
Austria 2.8 1.8 Croatia 2.4 2.8
Belgium 1.9 1.5 Ecuador 2.1 0.4
Canada 2.1 2.3 Egypt 4.4 3.6
Czech Republic 3.7 2.6 El Salvador 2.3 1.9
Denmark 2.0 1.8 Georgia 4.7 4.2
Estonia 4.1 1.7 Guatemala 2.9 3.2
Finland 2.7 1.7 Hungary 3.5 2.7
France 1.9 1.4 India 7.2 7.0
Germany 2.3 1.6 Kazakhstan 2.9 1.9
Greece 1.9 0.7 Kenya 5.1 5.5
Hong Kong 4.0 2.3 Kosovo 3.5 3.9
Ireland 4.7 4.1 Lesotho 2.5 3.2
Israel 3.3 2.8 Malaysia 3.6 2.4
Italy 1.4 1.0 Mexico 2.2 1.7
Japan 1.2 1.1 Morocco 3.4 3.9
Latvia 3.2 2.4 Namibia 1.5 1.8
Lithuania 3.1 2.7 Nigeria 2.5 1.8
Netherlands 2.7 1.9 Pakistan 5.2 4.8
New Zealand 2.6 2.4 Paraguay 4.2 3.9
Norway 2.3 1.3 Peru 3.2 2.7
Portugal 2.2 1.7 Philippines 6.8 6.6
Republic of Korea 2.9 2.5 Poland 4.1 3.1
Slovakia 3.9 3.2 Romania 4.5 3.9
Slovenia 4.2 2.9 Russia 5.1 1.0
Spain 2.6 2.8 South Africa 1.8 0.9
Sweden 2.5 2.4 Sri Lanka 4.3 5.2
Switzerland 2.2 1.5 Thailand 3.8 3.4
Taiwan 2.5 2.0 Togo 4.8 5.2
United Kingdom 1.6 1.6 Tunisia 2.1 2.4
United States 2.7 2.3 Turkey 4.9 3.1
Ukraine 3.3 0.7
Emerging market and developing economies Uruguay 3.1 2.3
Argentina 2.6 2.2 Venezuela -3.0 -4.9
Bolivia 4.0 4.2 Zambia 3.9 3.7
Bosnia and Herzegovina 2.4 2.7 Zimbabwe 2.9 1.9
* To calculate aggregates, country weights are based on gross domestic product based on purchasing-power-parity (PPP) in international dollars (database IMF’s World Economic Outlook). – a) Austria, Belgium, Cyprus, Estonia, Finland, France, Germany, Greece, Ireland, Italy, Latvia, Lithuania, Luxembourg, Malta, Nether-lands, Portugal, Spain, Slovenia, Slovakia.Source: ifo World Economic Survey (WES) II/2018.
9ifo World Economic Survey II/ 2018 May Volume 17
ance scale. Expectations improved somewhat at 10.0 points, but remained pessimistic at -9.1 on the balance scale. This led to a brighter economic climate in Turkey and an improvement of 1.0 points. The two most press-ing economic problems cited are a lack of innovation (90.0%) and capital shortage (81.8%). The outlook for investment and domestic consumption improved slightly compared to the previous survey, but remains negative. The outlook for export demand improved considerably.
The economic recovery may lose ground in Latin America, after a positive economic climate indicator last quarter. Assessments of the present economic sit-uation stayed the same compared to last quarter. The economic outlook stayed positive, but declined from 41.3 points to 24.7. This was reflected in a worsening of the economic climate from 1.5 points to -5.2 points on the balance scale. Argentina’s economic climate indi-cator dropped by 17.5 points to 10.7 points on the bal-ance scale. Experts’ assessments of the current eco-nomic situation turned negative. The economic outlook, although slightly more pessimistic than the previous survey, nevertheless remained positive. WES experts expect inflation to run at 21.1%, which is signif-icantly higher than the government’s target of 15%. Expected growth of GDP was nevertheless upwardly revised compared to the expectations of 2017, from 2.2% in 2017 to 2.6% in 2018. According to WES-experts, the Argentinian Peso is overvalued against all other
major currencies, which makes exports more expen-sive and hinders international competitiveness. A lack of international competitiveness was cited by 92.9% of the experts surveyed as hindering the economy. Fewer experts than in the previous survey expect any further increase in the value of the US dollar over the next six months, which could be beneficial for exports. Political instability was only indicated by 8.2% of the experts. On the other hand, a growing number of experts reported a lack of credible central bank policy and inef-ficient debt management as hindering Argentina’s economy. Chile’s economic climate indicator improved by 22.8 points to 49.2 points on the balance scale, marking its highest level since October 2011. All indica-tors for the current economic situation were upgraded, with particularly favourable assessments of domestic demand. The experts surveyed, however, valued the economic outlook indicators, albeit at a high level, as lower than in the previous survey. They signalled steady, but less buoyant growth for the months ahead. GDP growth expectations are considerably higher than last year at 3.4%, versus 1.7% in 2017 (see Table 2). All of the main currencies were assessed at their proper value compared to the Chilean peso. Only the US dollar is still assessed as undervalued, although less so than last quarter. A lack of innovation is still seen as the main fac-tor hindering Chile’s economy. In Mexico, the economic climate remains unfavourable at -21.9 points on the balance scale. The present economic situation,
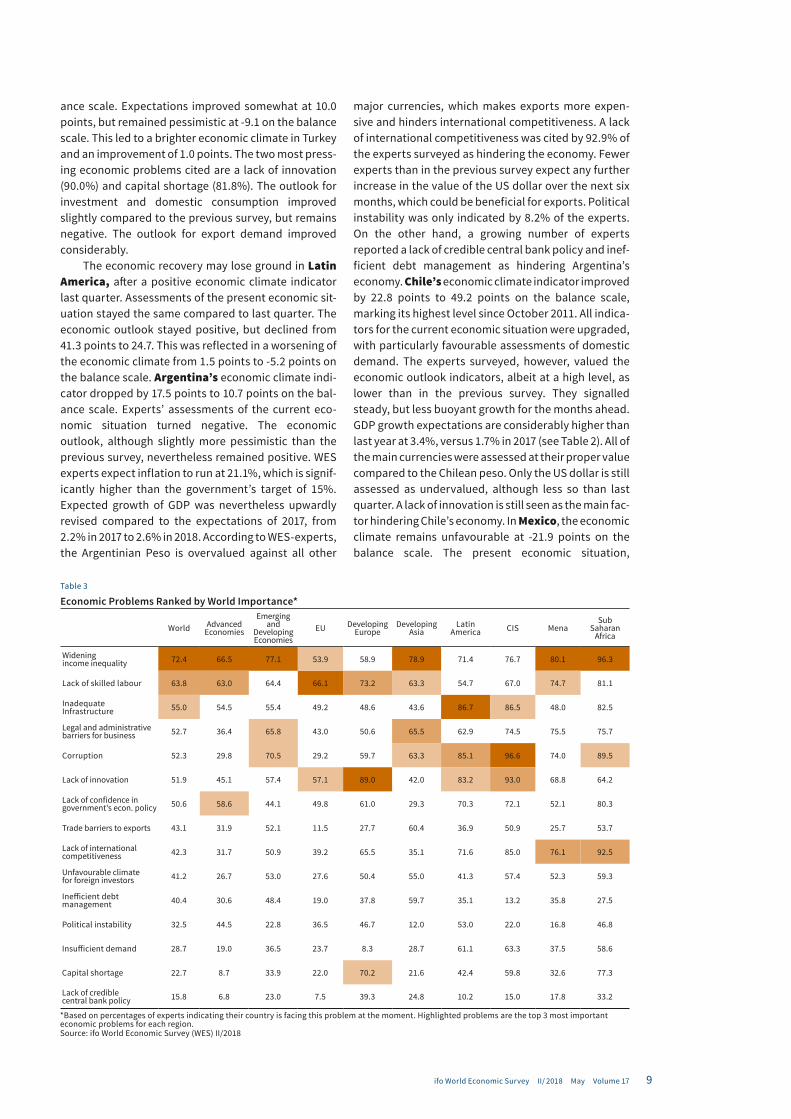
Table 3
Economic Problems Ranked by World Importance*
World Advanced Economies
Emerging and
Developing Economies
EU Developing Europe
Developing Asia
Latin America CIS Mena
Sub Saharan
Africa
Widening income inequality 72.4 66.5 77.1 53.9 58.9 78.9 71.4 76.7 80.1 96.3
Lack of skilled labour 63.8 63.0 64.4 66.1 73.2 63.3 54.7 67.0 74.7 81.1
Inadequate Infrastructure 55.0 54.5 55.4 49.2 48.6 43.6 86.7 86.5 48.0 82.5
Legal and administrative barriers for business 52.7 36.4 65.8 43.0 50.6 65.5 62.9 74.5 75.5 75.7
Corruption 52.3 29.8 70.5 29.2 59.7 63.3 85.1 96.6 74.0 89.5
Lack of innovation 51.9 45.1 57.4 57.1 89.0 42.0 83.2 93.0 68.8 64.2
Lack of confidence in government's econ. policy 50.6 58.6 44.1 49.8 61.0 29.3 70.3 72.1 52.1 80.3
Trade barriers to exports 43.1 31.9 52.1 11.5 27.7 60.4 36.9 50.9 25.7 53.7
Lack of international competitiveness 42.3 31.7 50.9 39.2 65.5 35.1 71.6 85.0 76.1 92.5
Unfavourable climate for foreign investors 41.2 26.7 53.0 27.6 50.4 55.0 41.3 57.4 52.3 59.3
Inefficient debt management 40.4 30.6 48.4 19.0 37.8 59.7 35.1 13.2 35.8 27.5
Political instability 32.5 44.5 22.8 36.5 46.7 12.0 53.0 22.0 16.8 46.8
Insufficient demand 28.7 19.0 36.5 23.7 8.3 28.7 61.1 63.3 37.5 58.6
Capital shortage 22.7 8.7 33.9 22.0 70.2 21.6 42.4 59.8 32.6 77.3
Lack of credible central bank policy 15.8 6.8 23.0 7.5 39.3 24.8 10.2 15.0 17.8 33.2
*Based on percentages of experts indicating their country is facing this problem at the moment. Highlighted problems are the top 3 most important economic problems for each region. Source: ifo World Economic Survey (WES) II/2018
10 ifo World Economic Survey II/ 2018 May Volume 17
although 14.5 points better than in the last survey, is still assessed as weak. The economic outlook deterio-rated by another 5.0 points and is now at -25.0 on the balance scale. All of the experts surveyed, since the launch of the indicator for Mexico in April 2016, unani-mously cite corruption as the most pressing economic problem that is blocking further growth. The inflation rate for 2018 was downwardly revised from 5.3% to 4.7% (see Table 1). GDP growth, on the other hand, is expected to turn out at 2.2% for 2018, versus 1.7% for 2017 (see Table 2).
The economic climate of the Commonwealth of Independent States (CIS) dropped back to 2016 lev-els, as the experts surveyed turned more pessimistic in their economic outlook. They expect economic perfor-mance to deteriorate in the months ahead. This is mainly due to a poorer economic climate in the biggest economy of this region, namely Russia. The other coun-tries surveyed by WES; Azerbaijan, Georgia, Kazakh-stan, and Ukraine, saw their economic climate improve. In all four countries, economic performance was more favourably assessed. The Ukraine was the only country where experts expressed greater pessi-mism about the economic outlook, and even expect it to deteriorate further in the coming months. A lack of innovation and corruption were most frequently cited as hindering economic performance.
Sub-Saharan Africa saw its economic climate indicator drop, after rising above the zero-line last quarter. The present economic situation was again assessed as negative, but better than in the last survey. In Sub-Saharan Africa and the Middle East and North Africa, the main economic problems are reported to be a lack of international competitiveness and growing income inequality. In the Middle East and Northern Africa, the economic climate improved somewhat, albeit at a low level. Experts remain optimistic for the months ahead, but not to the same extent as in the pre-vious survey.
US TAX AND TRADE POLICY – PERCEIVED IMPACT AND PREFERRED POLICY RESPONSES WORLDWIDE
Both the recently adopted US tax reform and the dras-tic change in US trade policy will have a significant impact on the global economy in the years ahead. Adopted on January 1st, 2018, the Tax Cuts and Jobs Act constitutes the largest reform to the US tax system since President Reagan’s 1986 reform. The recent reform slashes the federal corporate income tax rate from 35 to 21% and contains many further provisions for attracting corporate profits and capital to the US. At the same time, the US administration is currently over-hauling US trade policy, questioning whether trade relations are “fair” from the perspective of the US and installing tariffs. Both policy changes drastically affect businesses all over the globe and have led to heated debate over their impact, as well as appropriate policy
responses. Against this background, we asked the WES experts participating in our April 2018 survey to assess the changes featured in the latest US tax and trade reforms. Consulting our panel of over 1,100 economic experts around the world makes it possible to assess how the US reforms are perceived around the globe.
TAX VS TRADE – IS THERE ANY CONSENSUS AMONG WES EXPERTS?
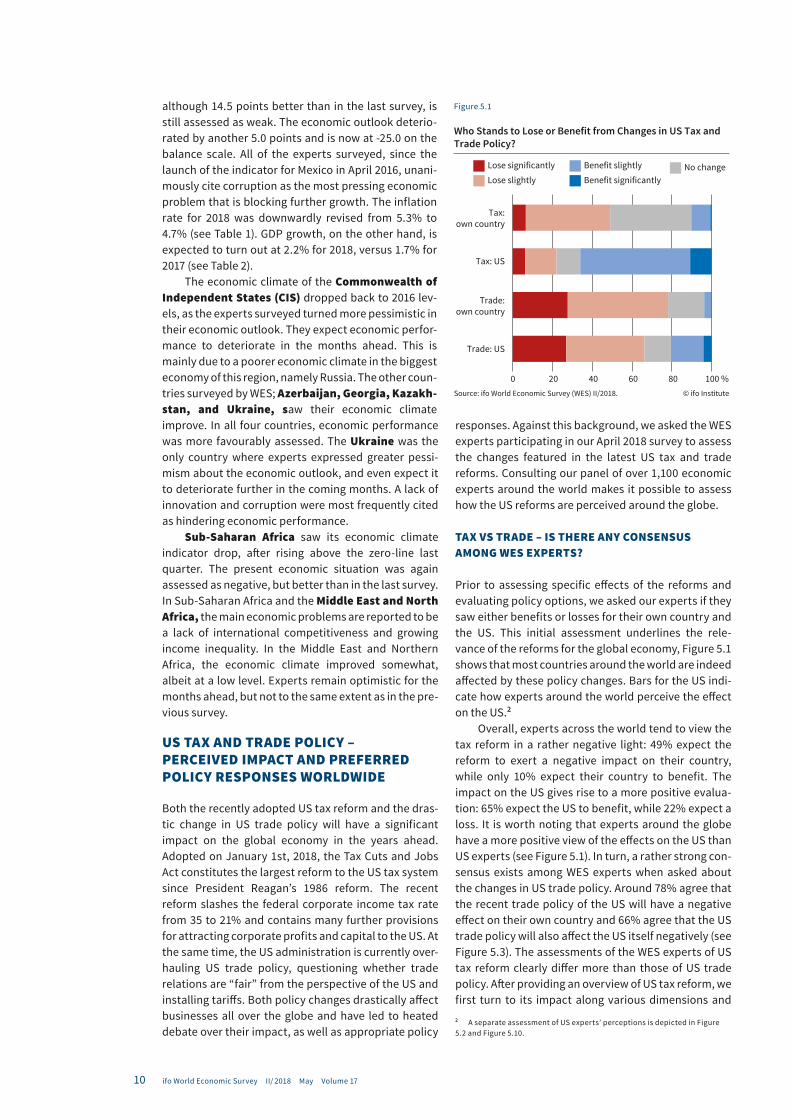
Prior to assessing specific effects of the reforms and evaluating policy options, we asked our experts if they saw either benefits or losses for their own country and the US. This initial assessment underlines the rele-vance of the reforms for the global economy, Figure 5.1 shows that most countries around the world are indeed affected by these policy changes. Bars for the US indi-cate how experts around the world perceive the effect on the US.2
Overall, experts across the world tend to view the tax reform in a rather negative light: 49% expect the reform to exert a negative impact on their country, while only 10% expect their country to benefit. The impact on the US gives rise to a more positive evalua-tion: 65% expect the US to benefit, while 22% expect a loss. It is worth noting that experts around the globe have a more positive view of the effects on the US than US experts (see Figure 5.1). In turn, a rather strong con-sensus exists among WES experts when asked about the changes in US trade policy. Around 78% agree that the recent trade policy of the US will have a negative effect on their own country and 66% agree that the US trade policy will also affect the US itself negatively (see Figure 5.3). The assessments of the WES experts of US tax reform clearly differ more than those of US trade policy. After providing an overview of US tax reform, we first turn to its impact along various dimensions and 2 A separate assessment of US experts’ perceptions is depicted in Figure 5.2 and Figure 5.10.
© ifo InstituteSource: ifo World Economic Survey (WES) II/2018.
Who Stands to Lose or Benefit from Changes in US Tax and Trade Policy?
0 20 40 60 80 100 %
Trade: US
Trade:own country
Tax: US
Tax:own country
Lose significantly
Lose slightlyNo changeBenefit slightly
Benefit significantly
Figure 5.1
11ifo World Economic Survey II/ 2018 May Volume 17
discuss preferred policy responses. Subsequently, we analyse the experts’ responses concerning changes in US trade policy.
US TAX REFORM
In addition to lowering the federal corporate tax rate from 35 to 21%, the Tax Cuts and Jobs Act will substan-tially alter the tax treatment of multinational corpora-tions by shifting from a worldwide to a territorial tax system. Prior to the reform, US companies were liable to taxation on their worldwide income, resulting in tax rates on repatriated profits of up to 35%. Following the reform, repatriated dividends are no longer subject to taxation. However, a one-time transition tax of between 8 and 15.5% is imposed on past foreign profits. Some measures were also implemented to prevent an ero-sion of the tax base. In particular, the reform introduced a minimum tax on foreign affiliates’ US income (BEAT) and implemented new rules for the taxation of global intangible income (GILTI) and income from foreign derived earnings stemming from domestic intangibles (FDII). These measures are explained in more detail when discussing the tax reform’s effects on profit shift-ing and the location of headquarters. The reform also entails further substantial provisions, such as a limita-tion on interest deductability and allowance of the immediate expensing of some capital spending.
Impact of US Tax Reform on Different Countries and across Various Dimensions
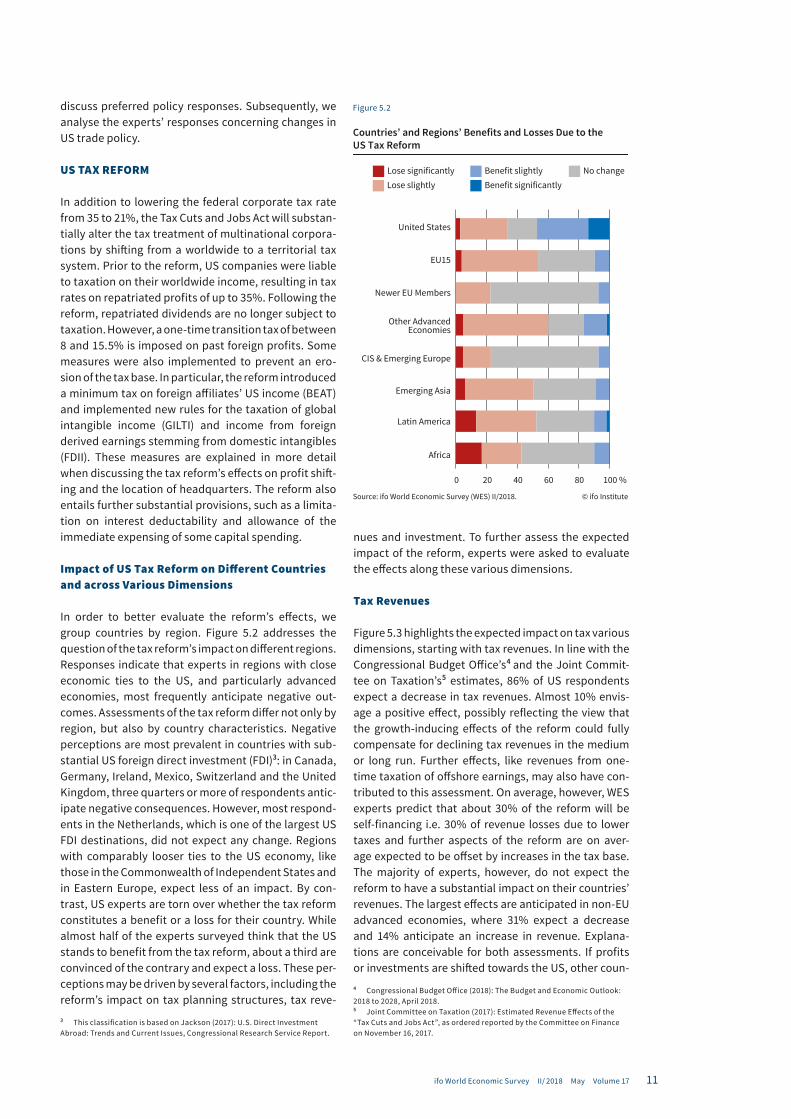
In order to better evaluate the reform’s effects, we group countries by region. Figure 5.2 addresses the question of the tax reform’s impact on different regions. Responses indicate that experts in regions with close economic ties to the US, and particularly advanced economies, most frequently anticipate negative out-comes. Assessments of the tax reform differ not only by region, but also by country characteristics. Negative perceptions are most prevalent in countries with sub-stantial US foreign direct investment (FDI)3: in Canada, Germany, Ireland, Mexico, Switzerland and the United Kingdom, three quarters or more of respondents antic-ipate negative consequences. However, most respond-ents in the Netherlands, which is one of the largest US FDI destinations, did not expect any change. Regions with comparably looser ties to the US economy, like those in the Commonwealth of Independent States and in Eastern Europe, expect less of an impact. By con-trast, US experts are torn over whether the tax reform constitutes a benefit or a loss for their country. While almost half of the experts surveyed think that the US stands to benefit from the tax reform, about a third are convinced of the contrary and expect a loss. These per-ceptions may be driven by several factors, including the reform’s impact on tax planning structures, tax reve-3 This classification is based on Jackson (2017): U.S. Direct Investment Abroad: Trends and Current Issues, Congressional Research Service Report.
nues and investment. To further assess the expected impact of the reform, experts were asked to evaluate the effects along these various dimensions.
Tax Revenues
Figure 5.3 highlights the expected impact on tax various dimensions, starting with tax revenues. In line with the Congressional Budget Office’s4 and the Joint Commit-tee on Taxation’s5 estimates, 86% of US respondents expect a decrease in tax revenues. Almost 10% envis-age a positive effect, possibly reflecting the view that the growth-inducing effects of the reform could fully compensate for declining tax revenues in the medium or long run. Further effects, like revenues from one-time taxation of offshore earnings, may also have con-tributed to this assessment. On average, however, WES experts predict that about 30% of the reform will be self-financing i.e. 30% of revenue losses due to lower taxes and further aspects of the reform are on aver-age expected to be offset by increases in the tax base.The majority of experts, however, do not expect the reform to have a substantial impact on their countries’ revenues. The largest effects are anticipated in non-EU advanced economies, where 31% expect a decrease and 14% anticipate an increase in revenue. Explana-tions are conceivable for both assessments. If profits or investments are shifted towards the US, other coun-4 Congressional Budget Office (2018): The Budget and Economic Outlook: 2018 to 2028, April 2018.5 Joint Committee on Taxation (2017): Estimated Revenue Effects of the “Tax Cuts and Jobs Act”, as ordered reported by the Committee on Finance on November 16, 2017.
© ifo InstituteSource: ifo World Economic Survey (WES) II/2018.
Countries’ and Regions’ Benefits and Losses Due to the US Tax Reform
United States
EU15
Newer EU Members
Other AdvancedEconomies
CIS & Emerging Europe
Emerging Asia
Latin America
Africa
0 20 40 60 80 100 %
Benefit significantlyLose significantlyLose slightly
No changeBenefit slightly
Figure 5.2

12 ifo World Economic Survey II/ 2018 May Volume 17
tries’ tax revenues would possibly decrease. However, firms around the world may also benefit from increas-ing consumption in the United States, and may even direct some of their possible revenue increases towards investment in other countries. Against this background, a recent survey of German firms finds that 14% of the German firms that plan to invest more in the US also plan to increase their investment in Germany. However, 17% of those firms seem to be shifting investments and reducing investments in Germany instead.6
Investment
One of the tax reform’s aims was to boost domestic investment by cutting corporate taxes and reducing the
6 Krolage and Wohlrabe (2018): Auswirkungen der US-Steuerreform auf deutsche Unternehmen – Ergebnisse einer Unternehmensumfrage. Ifo Schnelldienst 7/2018.
cost of investment. While the White House emphasizes companies’ increasing investments in the wake of the reform7, many firms are using their windfall profits to buy back shares. This may be one of the reasons why just over half of US experts agree that the reform raises investment (see Figure 5.3). By contrast, about a third of respondents in other countries expect a decline in domestic investment, which would be consistent with a shift of investment towards the US. Only 8% expect an increase. Negative assessments are particularly preva-lent across the border in Canada and Mexico, in emerg-ing and advanced Asian economies, as well as major European economies with substantial FDI, such as Ger-many and Ireland. In addition, negative perceptions are far more frequent in countries with moderately high marginal effective tax rates that now exceed those of 7 https://www.whitehouse.gov/briefings-statements/presi-dent-donald-j-trumps-tax-reform-delivering-americans/
© ifo InstituteSource: ifo World Economic Survey (WES) II/2018.
Effects of the US Tax Reform by Country Group
United States
EU15
Newer EU Members
Other AdvancedEconomies
CIS & Emerging Europe
Emerging Asia
Latin America
Africa
United States
EU15
Newer EU Members
Other AdvancedEconomies
CIS & Emerging Europe
Emerging Asia
Latin America
Africa
0 20 40 60 80 100 % 0 20 40 60 80 100 % 0 20 40 60 80 100 %
0 20 40 60 80 100 % 0 20 40 60 80 100 % 0 20 40 60 80 100 %
Increase DecreaseNo change
Tax revenues Investments
Location of IP rights Repatriation of offshore profits
Profit shifting to the respective country
Relocation of business headquarters
Figure 5.3
13ifo World Economic Survey II/ 2018 May Volume 17
the US (see Figure 5.3). All else being equal, those coun-tries used to offer comparatively better tax-related financing conditions, but have now lost this advantage.
Location of IP and Profit Shifting
Multinationals frequently conduct R&D activity and locate intellectual property (IP; e.g. patents, trade-marks and brands) in low-tax countries. Thereby, the profits accruing to IP are subject to low tax rates, while this also allows for further profit shifting, e.g. via license fees. Some countries like Ireland, France, the Nether-lands and the UK, offer preferential tax regimes (IP box), taxing income derived from patents and other forms of IP at a substantially reduced rate.8 Several provisions of the Tax Cuts and Jobs Act raise the attractiveness of locating IP rights in the US. First and foremost, the US introduced a reduced tax rate on foreign-derived intan-gible income (FDII). Like other countries’ IP boxes, this results in intangible income associated with IP held in the US being taxed at an effective rate of only 13.125%. In turn, a minimum tax on GILTI (Global Intangible Low Tax Income) subjects foreign subsidiaries’ income to a minimum tax rate, reducing the benefits from locating IP in low-tax jurisdictions abroad. As shown in Figure 5.3, roughly half of all US respondents expect the loca-tion of intellectual property rights to shift towards the US. Negative effects are predominantly feared in Asia and in advanced economies, including the EU-15, with the most negative assessment in Ireland and Canada. Positive assessments occur more frequently in emerg-ing economies. However, responses do not differ much between countries with and without an IP regime.9
Regardless of whether a scheme is in place, about 21% of the experts expect a decrease. In addition to strate-gically locating IP rights, multinationals can employ a variety of strategies, such as setting corresponding transfer prices for within-company transactions, to shift profits to low-tax jurisdictions. Other than the pre-viously mentioned GILTI and FDII regimes, the new Base Erosion and Anti-Abuse Tax (BEAT) plays a role here. This minimum tax on adjusted taxable income affects US subsidiaries of large foreign corporations. Restricting deduction possibilities for payments such as interest or royalties, it complicates shifting profits abroad. As shown in Figure 5.3, 66% of US respondents expect that more profits will be shifted towards the US following the reform. The picture varies between other countries: around 30% of experts in advanced econo-mies, in- and outside the EU, as well as in Asian econo-mies expect that profits will be shifted away from their countries, while this is expected by fewer experts in other regions of the world. Here it seems to make a dif-
8 In light of the Base Erosion and Profit Shifting (BEPS) initiative, many countries have recently been adjusting their IP regimes to comply with the modified nexus approach.9 Countries are classified as having an IP regime based on the OECD’s as-sessment in: OECD (2017): Harmful Tax Practices – 2017 Progress Report on Preferential Regimes: Inclusive Framework on BEPS: Action5, OECD/G20 Base Erosion and Profit Shifting Project, OECD Publishing, Paris.
ference whether a country has a patent box in place. While 31% of experts in countries with IP regimes expect decreased profit shifting, this only applies to 20% in other countries. By contrast, around 12% expects that more profits will be shifted towards their country.
Location of Business Headquarters
In recent years, corporate inversions have garnered substantial attention in the media, as several large companies have used mergers to relocate to low-tax countries such as Ireland.10 A corporate inversion refers to the practice of relocating a US multinational’s legal residence to a low tax country via a merger. Under the former US global tax system, multinationals with a US parent paid taxes on their US as well as their foreign income, while foreign multinationals with US subsidiar-ies were only liable to pay taxes on their US income. On average, companies reduced their ratio of worldwide tax expense to earnings from 29 % to 18% following an inversion.11 The tax reform’s shift from a global towards a territorial tax system drastically reduces incentives to invert as US corporations are only liable to taxes on their US profits now. However, some relocation incen-tives remain, as some of the Tax Cuts and Jobs Act’s provisions specifically apply to US corporations. Nota-bly, the reform imposes a minimum tax of 10.5% on GILTI (Global Intangible Low Tax Income), resulting in a taxation of high-return profits of US shareholders’ con-trolled foreign corporations. As shown in Figure 5.3, over half of US respondents believe the reform will result in an increasing number of headquarters being located in the US. As before, countries located in the vicinity of the United States like Canada, Mexico and some further Latin American countries, as well as those with substantial US FDI, such as Ireland, Switzerland, the UK and Germany, tend to expect the most negative impact. A similar finding applies to emerging Asian countries, with Chinese respondents more often expecting a relocation of headquarters than respond-ents in smaller Asian countries. By contrast, positive evaluations are not as concentrated across countries, but tend to occur more often in Emerging Europe, Asia, and Latin America.
Repatriation of Offshore Profits
The tax reform also drastically altered the treatment of offshore profits. Prior to the reform, overseas subsidi-aries of US corporations were entitled to a tax deferral if profits remained offshore. However, a company incurred tax rates of up to 35% when repatriating those profits. This lead to a substantial accumulation of untaxed offshore profits, in particular in low tax coun-tries. Moody’s estimated that US non-financial corpo-
10 See e.g. https://www.nytimes.com/2016/07/13/business/dealbook/ire-land-us-tax-inversion.html11 Congressional Budget Office (2017): An Analysis of Corporate Inversions.
14 ifo World Economic Survey II/ 2018 May Volume 17
rates’ offshore cash holdings amounted to $1.4 trillion in 2017.12 Also considering re-invested profits, the Joint Committee on Taxation estimated that undistrib-uted offshore earnings and profits even amounted to $2.6 trillion in 2015.13 With the reform constituting a shift from a global towards a territorial tax system, future offshore earnings will generally be taxed in the country where the income is generated, and not be sub-ject to US taxes. However, a repatriation tax of between 8 and 15.5% - depending on the liquidity of assets – will be charged on pre-reform offshore earnings. This tax will be charged regardless of whether those earnings are repatriated or not, resulting in large one-time tax payments for many companies. As a result, around 80% of US respondents expect an increased repatriation of offshore profits to the United States, as shown in Figure 5.3.Across the world, decreasing offshore profits are expected by 23% of experts, while 14% expect off-shore profits to rise in their country. Negative percep-tions are particularly high in some states. According to a Congressional Research Service Report14, 43% of US corporations’ overseas profits were reported in Ber-muda, Ireland, Luxemburg, the Netherlands, and Swit-zerland. Unsurprisingly, experts in those countries anticipate a particularly large impact, with 43% pre-dicting a decrease in offshore earnings in their country. Amongst the remaining countries, experts in advanced economies and Asian countries tend to most often expect a negative outcome. Overall, negative anticipa-tions are most frequent in countries with very low mar-ginal effective tax rates, as well as countries with mod-erate tax rates that now exceed those of the US.
Balance of Trade
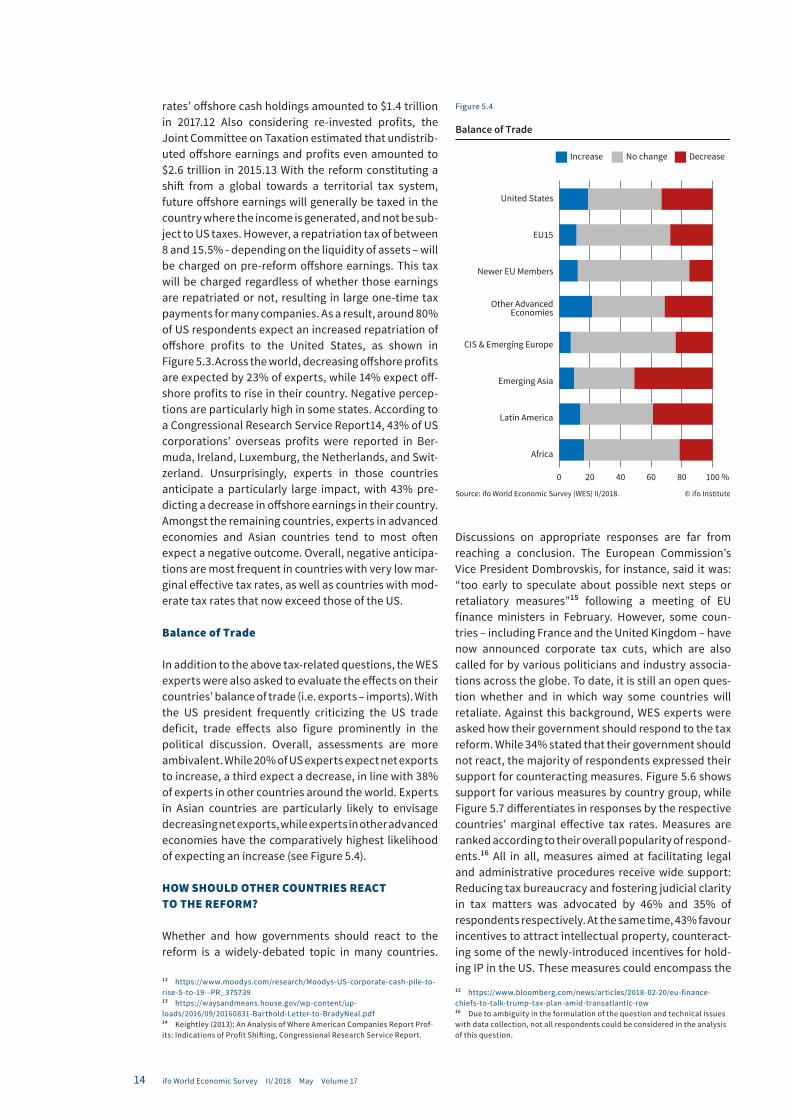
In addition to the above tax-related questions, the WES experts were also asked to evaluate the effects on their countries’ balance of trade (i.e. exports – imports). With the US president frequently criticizing the US trade deficit, trade effects also figure prominently in the political discussion. Overall, assessments are more ambivalent. While 20% of US experts expect net exports to increase, a third expect a decrease, in line with 38% of experts in other countries around the world. Experts in Asian countries are particularly likely to envisage decreasing net exports, while experts in other advanced economies have the comparatively highest likelihood of expecting an increase (see Figure 5.4).
HOW SHOULD OTHER COUNTRIES REACT TO THE REFORM?
Whether and how governments should react to the reform is a widely-debated topic in many countries.
12 https://www.moodys.com/research/Moodys-US-corporate-cash-pile-to-rise-5-to-19--PR_37573913 https://waysandmeans.house.gov/wp-content/up-loads/2016/09/20160831-Barthold-Letter-to-BradyNeal.pdf14 Keightley (2013): An Analysis of Where American Companies Report Prof-its: Indications of Profit Shifting, Congressional Research Service Report.
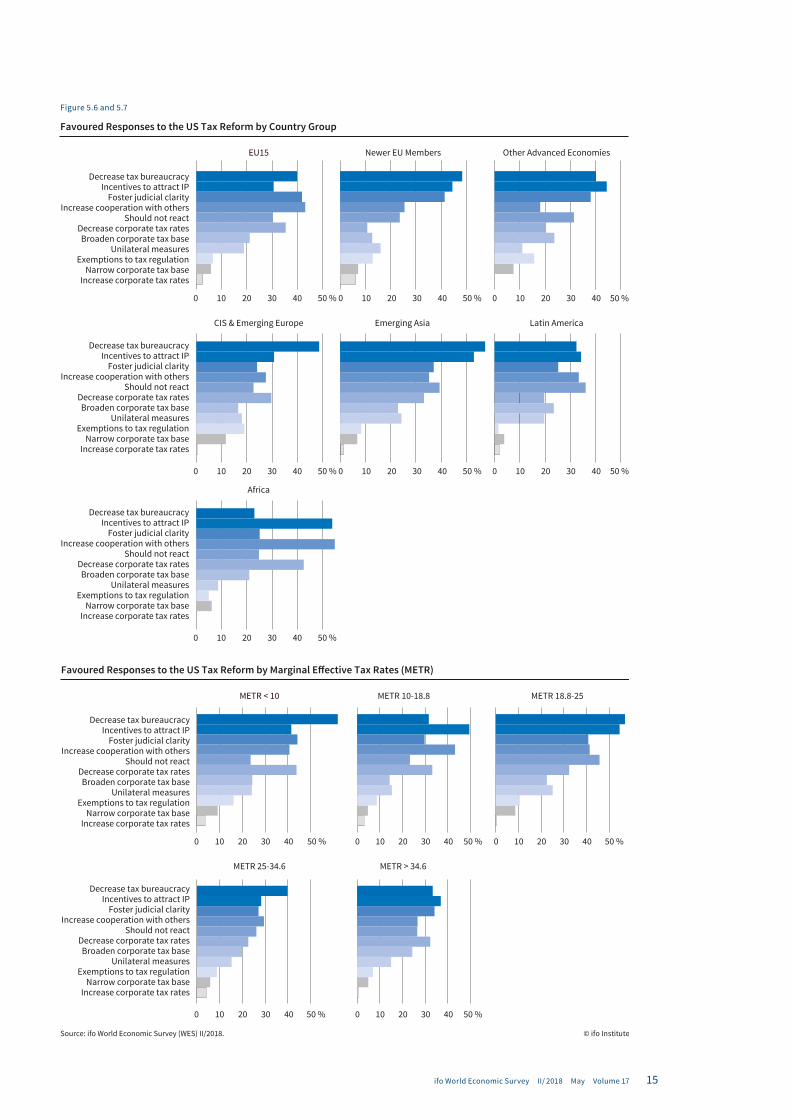
Discussions on appropriate responses are far from reaching a conclusion. The European Commission’s Vice President Dombrovskis, for instance, said it was: “too early to speculate about possible next steps or retaliatory measures”15 following a meeting of EU finance ministers in February. However, some coun-tries – including France and the United Kingdom – have now announced corporate tax cuts, which are also called for by various politicians and industry associa-tions across the globe. To date, it is still an open ques-tion whether and in which way some countries will retaliate. Against this background, WES experts were asked how their government should respond to the tax reform. While 34% stated that their government should not react, the majority of respondents expressed their support for counteracting measures. Figure 5.6 shows support for various measures by country group, while Figure 5.7 differentiates in responses by the respective countries’ marginal effective tax rates. Measures are ranked according to their overall popularity of respond-ents.16 All in all, measures aimed at facilitating legal and administrative procedures receive wide support: Reducing tax bureaucracy and fostering judicial clarity in tax matters was advocated by 46% and 35% of respondents respectively. At the same time, 43% favour incentives to attract intellectual property, counteract-ing some of the newly-introduced incentives for hold-ing IP in the US. These measures could encompass the
15 https://www.bloomberg.com/news/articles/2018-02-20/eu-finance-chiefs-to-talk-trump-tax-plan-amid-transatlantic-row 16 Due to ambiguity in the formulation of the question and technical issues with data collection, not all respondents could be considered in the analysis of this question.
© ifo InstituteSource: ifo World Economic Survey (WES) II/2018.
Balance of Trade
United States
EU15
Newer EU Members
Other AdvancedEconomies
CIS & Emerging Europe
Emerging Asia
Latin America
Africa
0 20 40 60 80 100 %
Increase DecreaseNo change
Figure 5.4
15ifo World Economic Survey II/ 2018 May Volume 17
EU15 Newer EU Members Other Advanced Economies
CIS & Emerging Europe Emerging Asia Latin America
Africa
Decrease tax bureaucracyIncentives to attract IP
Foster judicial clarityIncrease cooperation with others
Should not reactDecrease corporate tax ratesBroaden corporate tax base
Unilateral measuresExemptions to tax regulation
Narrow corporate tax baseIncrease corporate tax rates
Decrease tax bureaucracyIncentives to attract IP
Foster judicial clarityIncrease cooperation with others
Should not reactDecrease corporate tax ratesBroaden corporate tax base
Unilateral measuresExemptions to tax regulation
Narrow corporate tax baseIncrease corporate tax rates
Decrease tax bureaucracyIncentives to attract IP
Foster judicial clarityIncrease cooperation with others
Should not reactDecrease corporate tax ratesBroaden corporate tax base
Unilateral measuresExemptions to tax regulation
Narrow corporate tax baseIncrease corporate tax rates
0 10 20 30 40 50 % 0 10 20 30 40 50 % 0 10 20 30 40 50 %
0 10 20 30 40 50 %
0 10 20 30 40 50 %
0 10 20 30 40 50 % 0 10 20 30 40 50 %
© ifo InstituteSource: ifo World Economic Survey (WES) II/2018.
Favoured Responses to the US Tax Reform by Country Group
Figure 5.6 and 5.7
METR < 10 METR 10-18.8 METR 18.8-25
METR 25-34.6 METR > 34.6
Decrease tax bureaucracyIncentives to attract IP
Foster judicial clarityIncrease cooperation with others
Should not reactDecrease corporate tax ratesBroaden corporate tax base
Unilateral measuresExemptions to tax regulation
Narrow corporate tax baseIncrease corporate tax rates
Decrease tax bureaucracyIncentives to attract IP
Foster judicial clarityIncrease cooperation with others
Should not reactDecrease corporate tax ratesBroaden corporate tax base
Unilateral measuresExemptions to tax regulation
Narrow corporate tax baseIncrease corporate tax rates
0 10 20 30 40 50 % 0 10 20 30 40 50 % 0 10 20 30 40 50 %
0 10 20 30 40 50 % 0 10 20 30 40 50 %
Favoured Responses to the US Tax Reform by Marginal Effective Tax Rates (METR)
© ifo InstituteSource: ifo World Economic Survey (WES) II/2018.
16 ifo World Economic Survey II/ 2018 May Volume 17
implementation or extension of IP boxes, but could also extend to other measures destined to foster R&D. Lowering corporate tax rates also receives approval from 30% of experts. A substantial share of experts, however, tends to prefer cooperative behaviour over unilateral measures: 34% favour cooperating more with other countries, with the highest approval rates in African countries and the EU-15. This could encompass increased tax harmonization, within the EU for exam-ple, or strengthening the BEPS incentive. By contrast, just below 20% think their government should take uni-lateral measures, such as exit or minimum taxes, to curb profit shifting or relocation activities, and only 9% call for exemptions to tax regulation. Only a small minority advocates narrowing the corporate tax base or increasing corporate tax rates.
WILL TAX COMPETITION INTENSIFY IN THE FUTURE?
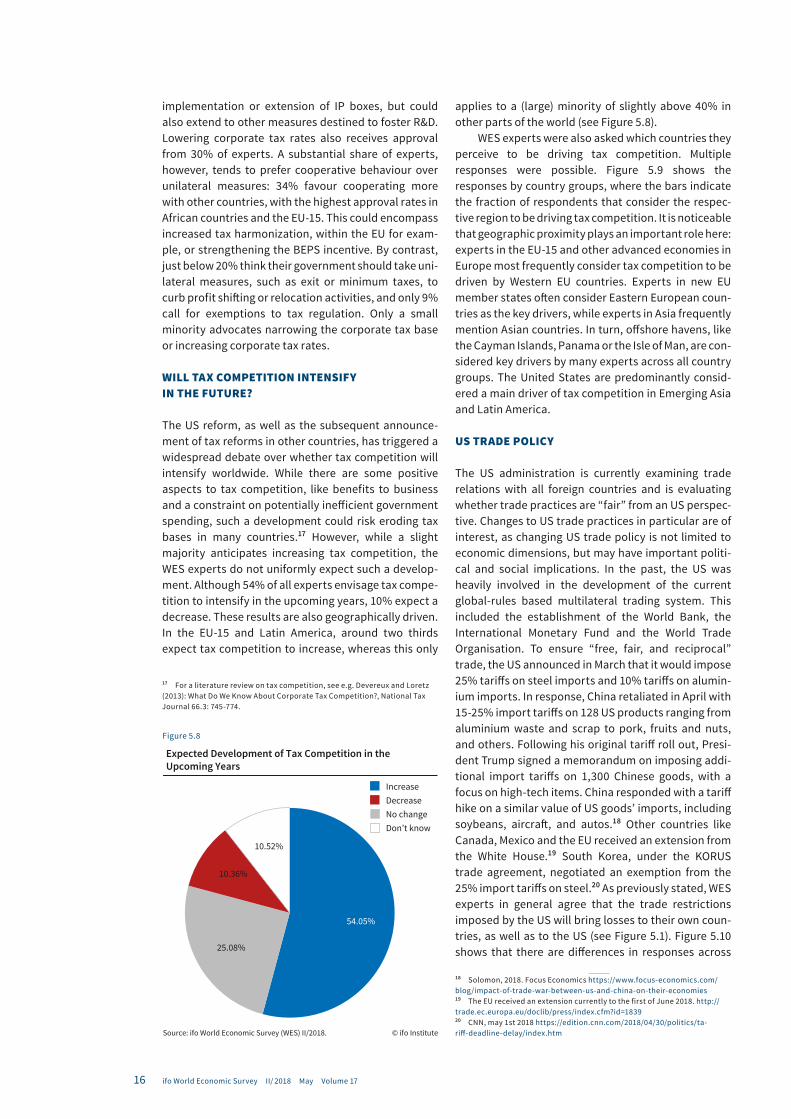
The US reform, as well as the subsequent announce-ment of tax reforms in other countries, has triggered a widespread debate over whether tax competition will intensify worldwide. While there are some positive aspects to tax competition, like benefits to business and a constraint on potentially inefficient government spending, such a development could risk eroding tax bases in many countries.17 However, while a slight majority anticipates increasing tax competition, the WES experts do not uniformly expect such a develop-ment. Although 54% of all experts envisage tax compe-tition to intensify in the upcoming years, 10% expect a decrease. These results are also geographically driven. In the EU-15 and Latin America, around two thirds expect tax competition to increase, whereas this only
17 For a literature review on tax competition, see e.g. Devereux and Loretz (2013): What Do We Know About Corporate Tax Competition?, National Tax Journal 66.3: 745-774.
applies to a (large) minority of slightly above 40% in other parts of the world (see Figure 5.8).
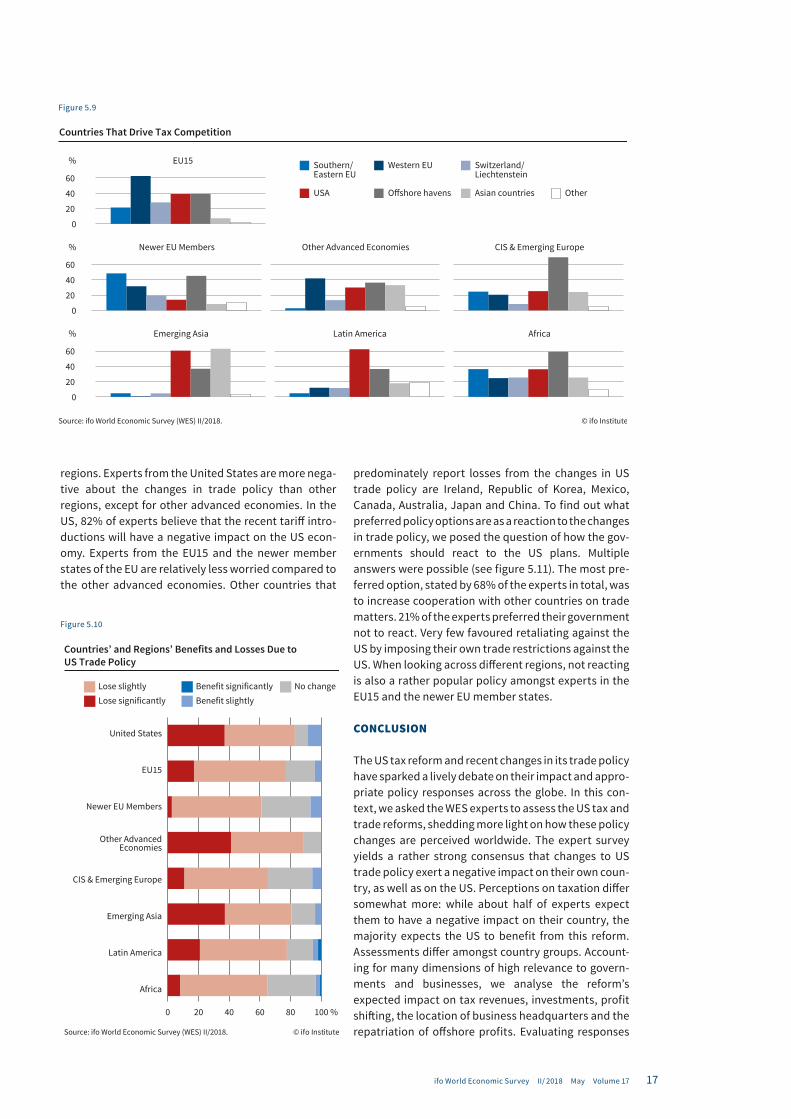
WES experts were also asked which countries they perceive to be driving tax competition. Multiple responses were possible. Figure 5.9 shows the responses by country groups, where the bars indicate the fraction of respondents that consider the respec-tive region to be driving tax competition. It is noticeable that geographic proximity plays an important role here: experts in the EU-15 and other advanced economies in Europe most frequently consider tax competition to be driven by Western EU countries. Experts in new EU member states often consider Eastern European coun-tries as the key drivers, while experts in Asia frequently mention Asian countries. In turn, offshore havens, like the Cayman Islands, Panama or the Isle of Man, are con-sidered key drivers by many experts across all country groups. The United States are predominantly consid-ered a main driver of tax competition in Emerging Asia and Latin America.
US TRADE POLICY
The US administration is currently examining trade relations with all foreign countries and is evaluating whether trade practices are “fair” from an US perspec-tive. Changes to US trade practices in particular are of interest, as changing US trade policy is not limited to economic dimensions, but may have important politi-cal and social implications. In the past, the US was heavily involved in the development of the current global-rules based multilateral trading system. This included the establishment of the World Bank, the International Monetary Fund and the World Trade Organisation. To ensure “free, fair, and reciprocal” trade, the US announced in March that it would impose 25% tariffs on steel imports and 10% tariffs on alumin-ium imports. In response, China retaliated in April with 15-25% import tariffs on 128 US products ranging from aluminium waste and scrap to pork, fruits and nuts, and others. Following his original tariff roll out, Presi-dent Trump signed a memorandum on imposing addi-tional import tariffs on 1,300 Chinese goods, with a focus on high-tech items. China responded with a tariff hike on a similar value of US goods’ imports, including soybeans, aircraft, and autos.18 Other countries like Canada, Mexico and the EU received an extension from the White House.19 South Korea, under the KORUS trade agreement, negotiated an exemption from the 25% import tariffs on steel.20 As previously stated, WES experts in general agree that the trade restrictions imposed by the US will bring losses to their own coun-tries, as well as to the US (see Figure 5.1). Figure 5.10 shows that there are differences in responses across
18 Solomon, 2018. Focus Economics https://www.focus-economics.com/blog/impact-of-trade-war-between-us-and-china-on-their-economies19 The EU received an extension currently to the first of June 2018. http://trade.ec.europa.eu/doclib/press/index.cfm?id=183920 CNN, may 1st 2018 https://edition.cnn.com/2018/04/30/politics/ta-riff-deadline-delay/index.htm
54.05%
25.08%
10.36%
10.52%
Increase
No changeDecrease
Don’t know
Expected Development of Tax Competition in the Upcoming Years
© ifo InstituteSource: ifo World Economic Survey (WES) II/2018.
Figure 5.8
17ifo World Economic Survey II/ 2018 May Volume 17
regions. Experts from the United States are more nega-tive about the changes in trade policy than other regions, except for other advanced economies. In the US, 82% of experts believe that the recent tariff intro-ductions will have a negative impact on the US econ-omy. Experts from the EU15 and the newer member states of the EU are relatively less worried compared to the other advanced economies. Other countries that
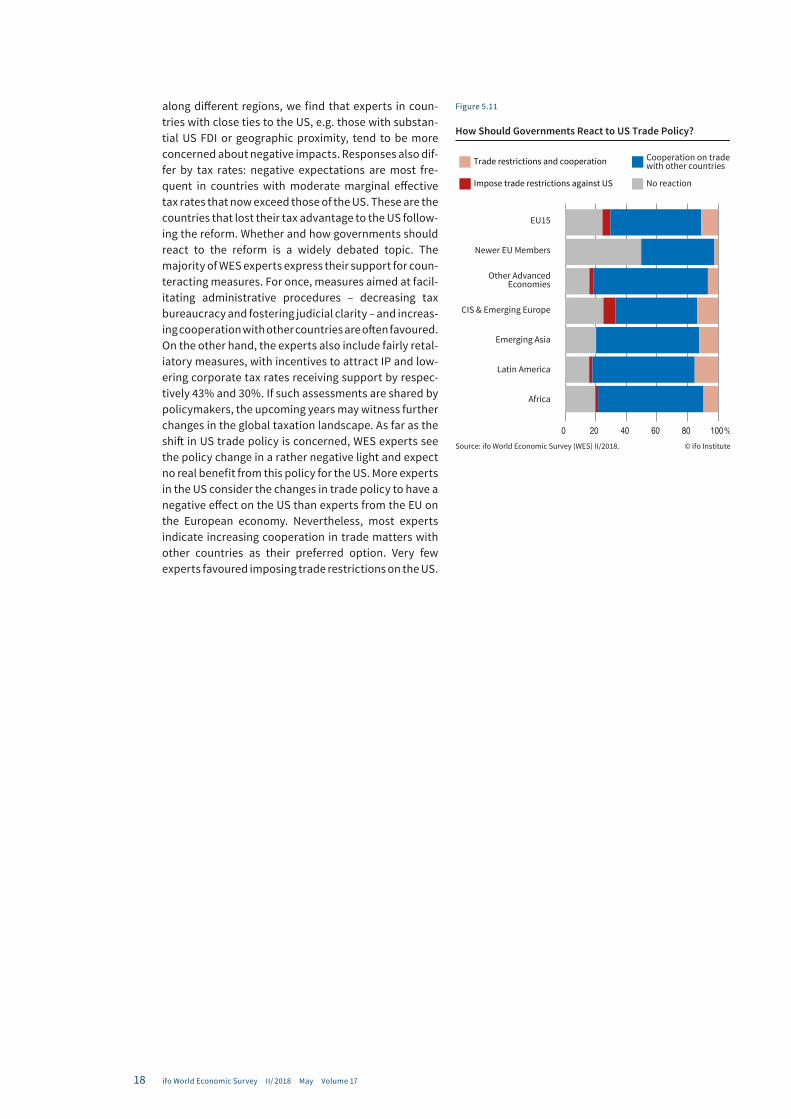
predominately report losses from the changes in US trade policy are Ireland, Republic of Korea, Mexico, Canada, Australia, Japan and China. To find out what preferred policy options are as a reaction to the changes in trade policy, we posed the question of how the gov-ernments should react to the US plans. Multiple answers were possible (see figure 5.11). The most pre-ferred option, stated by 68% of the experts in total, was to increase cooperation with other countries on trade matters. 21% of the experts preferred their government not to react. Very few favoured retaliating against the US by imposing their own trade restrictions against the US. When looking across different regions, not reacting is also a rather popular policy amongst experts in the EU15 and the newer EU member states.
CONCLUSION
The US tax reform and recent changes in its trade policy have sparked a lively debate on their impact and appro-priate policy responses across the globe. In this con-text, we asked the WES experts to assess the US tax and trade reforms, shedding more light on how these policy changes are perceived worldwide. The expert survey yields a rather strong consensus that changes to US trade policy exert a negative impact on their own coun-try, as well as on the US. Perceptions on taxation differ somewhat more: while about half of experts expect them to have a negative impact on their country, the majority expects the US to benefit from this reform. Assessments differ amongst country groups. Account-ing for many dimensions of high relevance to govern-ments and businesses, we analyse the reform’s expected impact on tax revenues, investments, profit shifting, the location of business headquarters and the repatriation of offshore profits. Evaluating responses
0
20
40
60
%
%
%
0
20
40
60
0
20
40
60
EU15
Newer EU Members Other Advanced Economies CIS & Emerging Europe
Emerging Asia Latin America Africa
Southern/ Eastern EU
Western EU Switzerland/Liechtenstein
USA Offshore havens Asian countries Other
Countries That Drive Tax Competition
© ifo InstituteSource: ifo World Economic Survey (WES) II/2018.
Figure 5.9
© ifo InstituteSource: ifo World Economic Survey (WES) II/2018.
Countries’ and Regions’ Benefits and Losses Due to US Trade Policy
United States
EU15
Newer EU Members
Other AdvancedEconomies
CIS & Emerging Europe
Emerging Asia
Latin America
Africa
0 20 40 60 80 100 %
Lose significantlyLose slightly No change
Benefit slightlyBenefit significantly
Figure 5.10
18 ifo World Economic Survey II/ 2018 May Volume 17
along different regions, we find that experts in coun-tries with close ties to the US, e.g. those with substan-tial US FDI or geographic proximity, tend to be more concerned about negative impacts. Responses also dif-fer by tax rates: negative expectations are most fre-quent in countries with moderate marginal effective tax rates that now exceed those of the US. These are the countries that lost their tax advantage to the US follow-ing the reform. Whether and how governments should react to the reform is a widely debated topic. The majority of WES experts express their support for coun-teracting measures. For once, measures aimed at facil-itating administrative procedures – decreasing tax bureaucracy and fostering judicial clarity – and increas-ing cooperation with other countries are often favoured. On the other hand, the experts also include fairly retal-iatory measures, with incentives to attract IP and low-ering corporate tax rates receiving support by respec-tively 43% and 30%. If such assessments are shared by policymakers, the upcoming years may witness further changes in the global taxation landscape. As far as the shift in US trade policy is concerned, WES experts see the policy change in a rather negative light and expect no real benefit from this policy for the US. More experts in the US consider the changes in trade policy to have a negative effect on the US than experts from the EU on the European economy. Nevertheless, most experts indicate increasing cooperation in trade matters with other countries as their preferred option. Very few experts favoured imposing trade restrictions on the US.
© ifo InstituteSource: ifo World Economic Survey (WES) II/2018.
How Should Governments React to US Trade Policy?
Impose trade restrictions against US
Trade restrictions and cooperation
No reaction
Cooperation on trade with other countries
EU15
Newer EU Members
Other AdvancedEconomies
CIS & Emerging Europe
Emerging Asia
Latin America
Africa
0 20 40 60 80 100 %
Figure 5.11
19ifo World Economic Survey II/ 2018 May Volume 17
© ifo InstituteSource: ifo World Economic Survey (WES) II/2018.
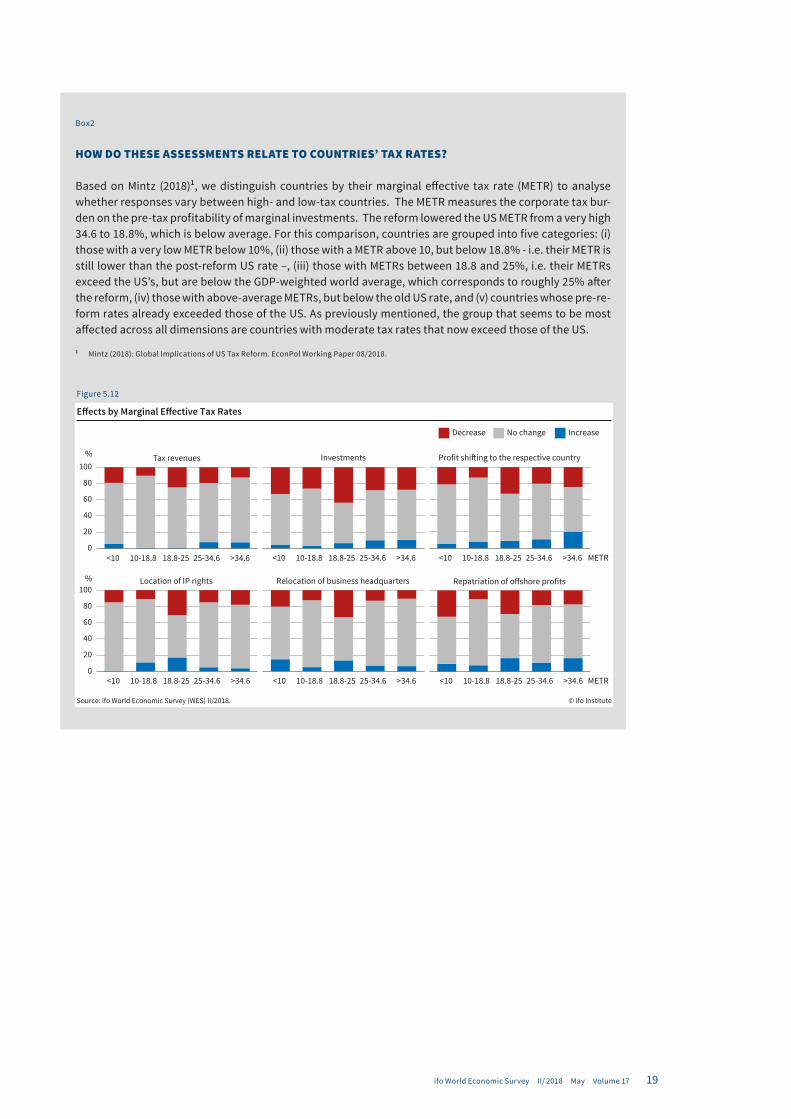
Effects by Marginal Effective Tax Rates
0
20
40
60
80
100
METR
%
%
METR0
20
40
60
80
100
<10 10-18.8 18.8-25 25-34.6 >34.6
Location of IP rights
<10 10-18.8 18.8-25 25-34.6 >34.6
Profit shifting to the respective country
<10 10-18.8 18.8-25 25-34.6 >34.6
Relocation of business headquarters
<10 10-18.8 18.8-25 25-34.6 >34.6
Repatriation of offshore profits
<10 10-18.8 18.8-25 25-34.6 >34.6
Tax revenues
<10 10-18.8 18.8-25 25-34.6 >34.6
Investments
IncreaseDecrease No change
Figure 5.12
Box2
HOW DO THESE ASSESSMENTS RELATE TO COUNTRIES’ TAX RATES?
Based on Mintz (2018)1, we distinguish countries by their marginal effective tax rate (METR) to analyse whether responses vary between high- and low-tax countries. The METR measures the corporate tax bur-den on the pre-tax profitability of marginal investments. The reform lowered the US METR from a very high 34.6 to 18.8%, which is below average. For this comparison, countries are grouped into five categories: (i) those with a very low METR below 10%, (ii) those with a METR above 10, but below 18.8% - i.e. their METR is still lower than the post-reform US rate –, (iii) those with METRs between 18.8 and 25%, i.e. their METRs exceed the US’s, but are below the GDP-weighted world average, which corresponds to roughly 25% after the reform, (iv) those with above-average METRs, but below the old US rate, and (v) countries whose pre-re-form rates already exceeded those of the US. As previously mentioned, the group that seems to be most affected across all dimensions are countries with moderate tax rates that now exceed those of the US.
1 Mintz (2018): Global Implications of US Tax Reform. EconPol Working Paper 08/2018.
20 ifo World Economic Survey II/ 2018 May Volume 17
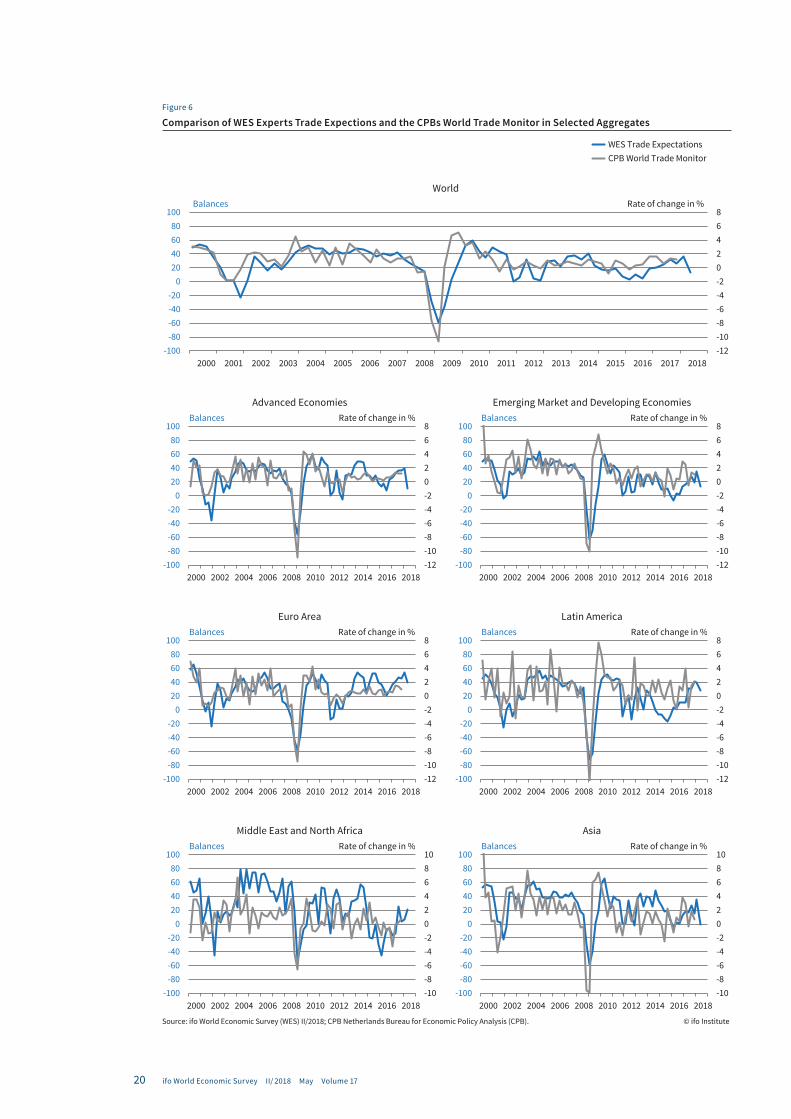
Figure 6
Comparison of WES Experts Trade Expections and the CPBs World Trade Monitor in Selected Aggregates
Source: ifo World Economic Survey (WES) II/2018; CPB Netherlands Bureau for Economic Policy Analysis (CPB). © ifo Institute
-12-10-8-6-4-202468
-100-80-60-40-20
020406080
100
2000 2002 2004 2006 2008 2010 2012 2014 2016 2018
Advanced EconomiesBalances Rate of change in %
-12-10-8-6-4-202468
-100-80-60-40-20
020406080
100
2000 2002 2004 2006 2008 2010 2012 2014 2016 2018
Emerging Market and Developing EconomiesBalances Rate of change in %
-12-10-8-6-4-202468
-100-80-60-40-20
020406080
100
2000 2002 2004 2006 2008 2010 2012 2014 2016 2018
Euro AreaBalances Rate of change in %
-12-10-8-6-4-202468
-100-80-60-40-20
020406080
100
2000 2002 2004 2006 2008 2010 2012 2014 2016 2018
Latin AmericaBalances Rate of change in %
-10-8-6-4-20246810
-100-80-60-40-20
020406080
100
2000 2002 2004 2006 2008 2010 2012 2014 2016 2018
Middle East and North AfricaBalances Rate of change in %
-10-8-6-4-20246810
-100-80-60-40-20
020406080
100
2000 2002 2004 2006 2008 2010 2012 2014 2016 2018
AsiaBalances Rate of change in %
-12-10-8-6-4-202468
-100-80-60-40-20
020406080
100
2000 2001 2002 2003 2004 2005 2006 2007 2008 2009 2010 2011 2012 2013 2014 2015 2016 2017 2018
WorldBalances Rate of change in %
WES Trade Expectations CPB World Trade Monitor
21ifo World Economic Survey II/ 2018 May Volume 17
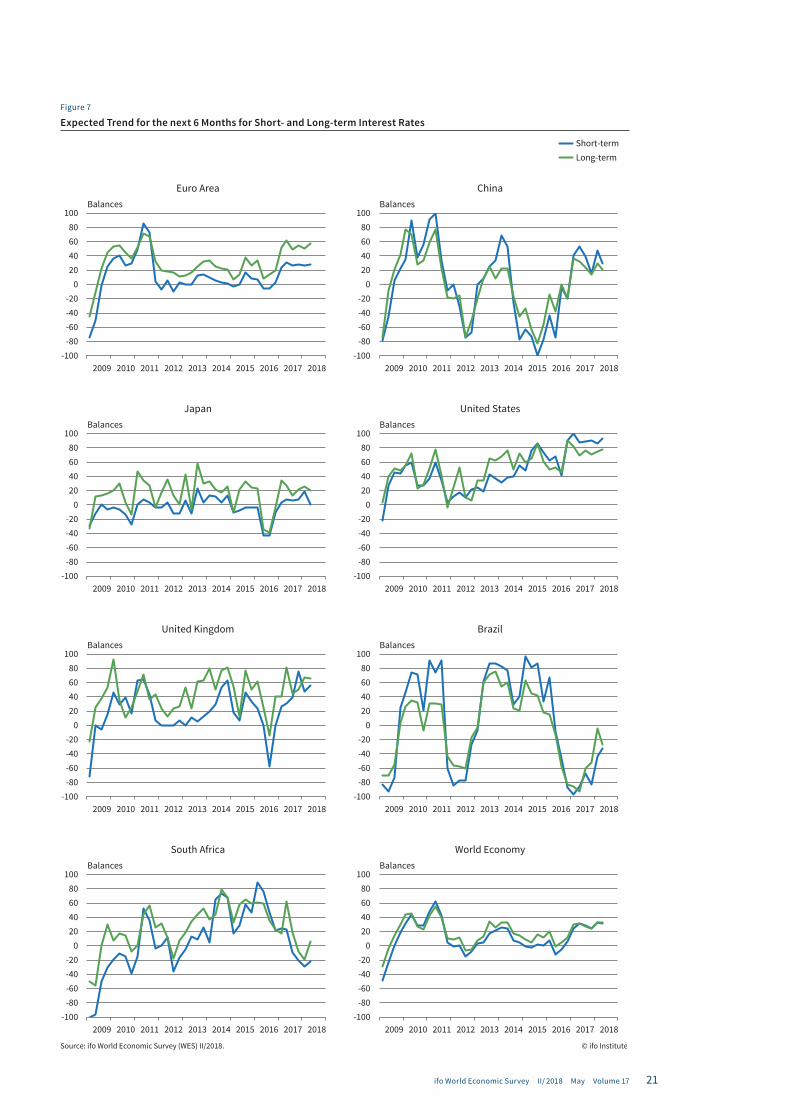
Figure 7
Expected Trend for the next 6 Months for Short- and Long-term Interest Rates
Source: ifo World Economic Survey (WES) II/2018. © ifo Institute
-100-80-60-40-20
020406080
100
2009 2010 2011 2012 2013 2014 2015 2016 2017 2018
JapanBalances
-100-80-60-40-20
020406080
100
2009 2010 2011 2012 2013 2014 2015 2016 2017 2018
United StatesBalances
-100-80-60-40-20
020406080
100
2009 2010 2011 2012 2013 2014 2015 2016 2017 2018
United KingdomBalances
-100-80-60-40-20
020406080
100
2009 2010 2011 2012 2013 2014 2015 2016 2017 2018
BrazilBalances
-100-80-60-40-20
020406080
100
2009 2010 2011 2012 2013 2014 2015 2016 2017 2018
South AfricaBalances
-100-80-60-40-20
020406080
100
2009 2010 2011 2012 2013 2014 2015 2016 2017 2018
World EconomyBalances
-100-80-60-40-20
020406080
100
2009 2010 2011 2012 2013 2014 2015 2016 2017 2018
Euro AreaBalances
-100-80-60-40-20
020406080
100
2009 2010 2011 2012 2013 2014 2015 2016 2017 2018
ChinaBalances
Short-term Long-term
22 ifo World Economic Survey II/ 2018 May Volume 17
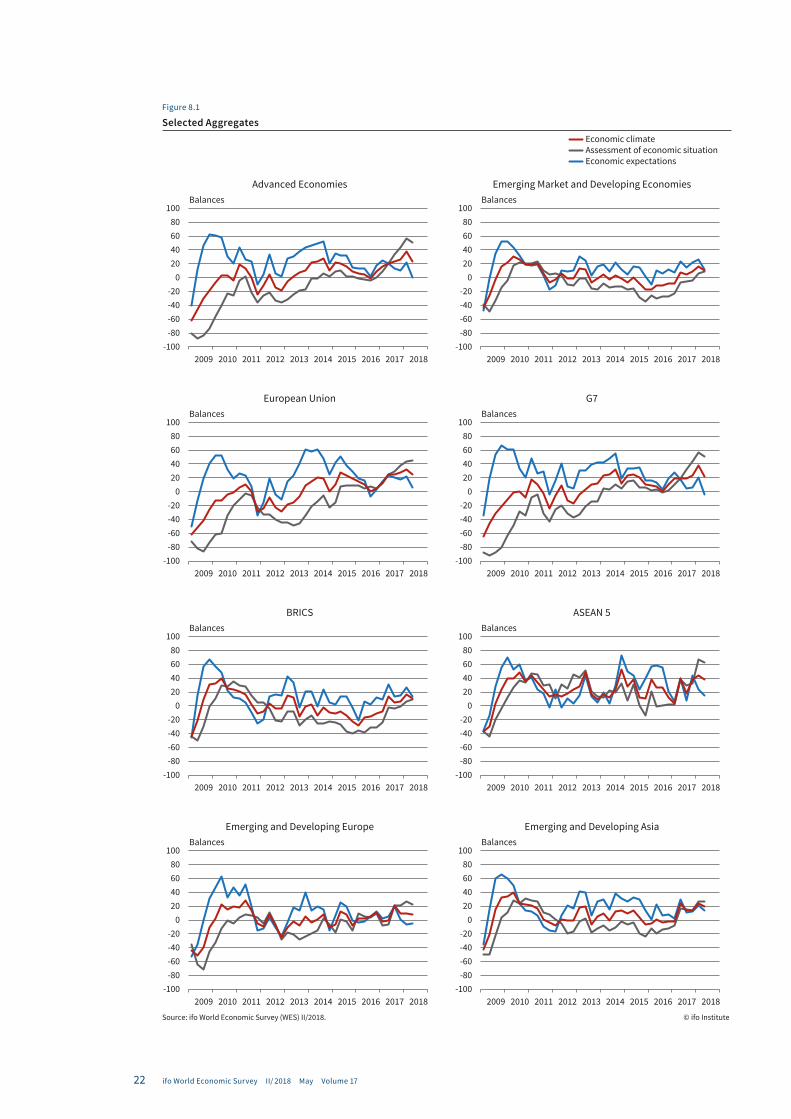
Figure 8.1
Selected Aggregates
Source: ifo World Economic Survey (WES) II/2018. © ifo Institute
-100-80-60-40-20
020406080
100
2009 2010 2011 2012 2013 2014 2015 2016 2017 2018
European UnionBalances
-100-80-60-40-20
020406080
100
2009 2010 2011 2012 2013 2014 2015 2016 2017 2018
G7Balances
-100-80-60-40-20
020406080
100
2009 2010 2011 2012 2013 2014 2015 2016 2017 2018
BRICSBalances
-100-80-60-40-20
020406080
100
2009 2010 2011 2012 2013 2014 2015 2016 2017 2018
ASEAN 5Balances
-100-80-60-40-20
020406080
100
2009 2010 2011 2012 2013 2014 2015 2016 2017 2018
Emerging and Developing EuropeBalances
-100-80-60-40-20
020406080
100
2009 2010 2011 2012 2013 2014 2015 2016 2017 2018
Emerging and Developing AsiaBalances
-100-80-60-40-20
020406080
100
2009 2010 2011 2012 2013 2014 2015 2016 2017 2018
Advanced EconomiesBalances
-100-80-60-40-20
020406080
100
2009 2010 2011 2012 2013 2014 2015 2016 2017 2018
Emerging Market and Developing EconomiesBalances
Economic climate Assessment of economic situation Economic expectations

23ifo World Economic Survey II/ 2018 May Volume 17
Figure 8.2
Selected Aggregates
Source: ifo World Economic Survey (WES) II/2018. © ifo Institute
-100-80-60-40-20
020406080
100
2009 2010 2011 2012 2013 2014 2015 2016 2017 2018
Middle East and North AfricaBalances
-100-80-60-40-20
020406080
100
2009 2010 2011 2012 2013 2014 2015 2016 2017 2018
Sub-Sahara AfricaBalances
-100-80-60-40-20
020406080
100
2009 2010 2011 2012 2013 2014 2015 2016 2017 2018
OPECBalances
-100-80-60-40-20
020406080
100
2009 2010 2011 2012 2013 2014 2015 2016 2017 2018
OECDBalances
-100-80-60-40-20
020406080
100
2009 2010 2011 2012 2013 2014 2015 2016 2017 2018
Asian TigersBalances
-100-80-60-40-20
020406080
100
2009 2010 2011 2012 2013 2014 2015 2016 2017 2018
Other Advanced EconomiesBalances
-100-80-60-40-20
020406080
100
2009 2010 2011 2012 2013 2014 2015 2016 2017 2018
Latin AmericaBalances
-100-80-60-40-20
020406080
100
2009 2010 2011 2012 2013 2014 2015 2016 2017 2018
Commonwealth of Independent StatesBalances
Economic climate Assessment of economic situation Economic expectations
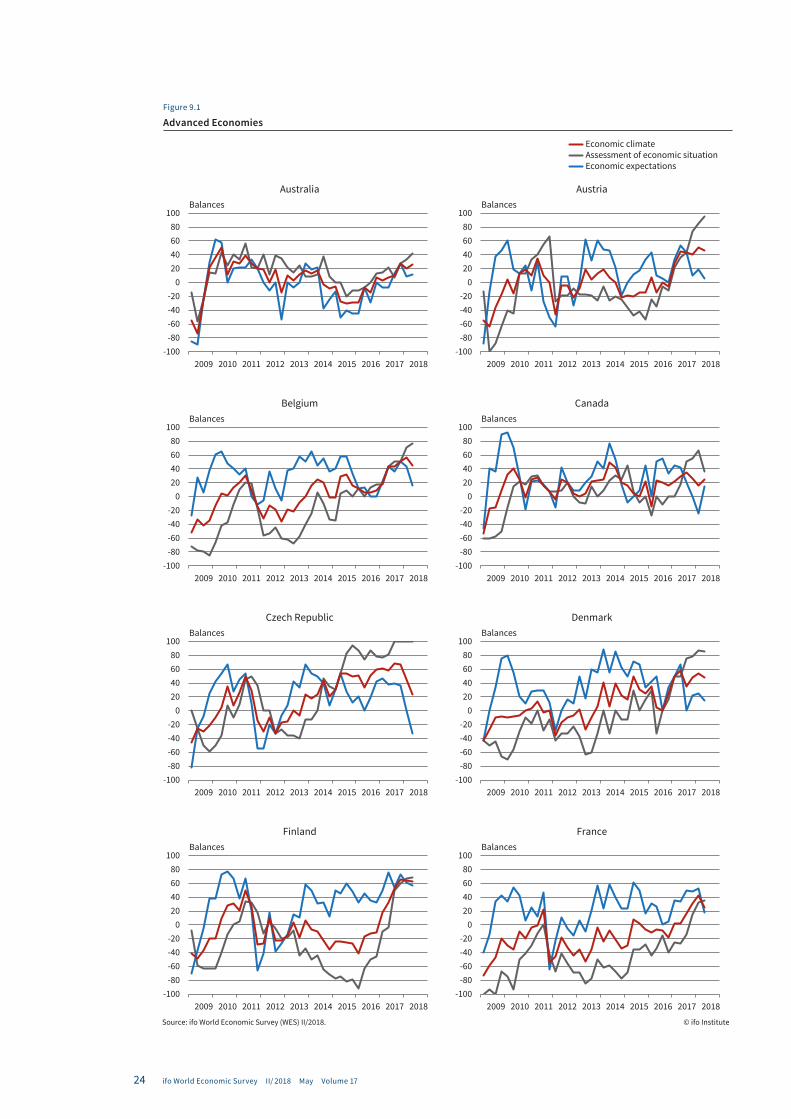
24 ifo World Economic Survey II/ 2018 May Volume 17
Figure 9.1
Advanced Economies
Source: ifo World Economic Survey (WES) II/2018. © ifo Institute
-100-80-60-40-20
020406080
100
2009 2010 2011 2012 2013 2014 2015 2016 2017 2018
BelgiumBalances
-100-80-60-40-20
020406080
100
2009 2010 2011 2012 2013 2014 2015 2016 2017 2018
CanadaBalances
-100-80-60-40-20
020406080
100
2009 2010 2011 2012 2013 2014 2015 2016 2017 2018
Czech RepublicBalances
-100-80-60-40-20
020406080
100
2009 2010 2011 2012 2013 2014 2015 2016 2017 2018
DenmarkBalances
-100-80-60-40-20
020406080
100
2009 2010 2011 2012 2013 2014 2015 2016 2017 2018
FinlandBalances
-100-80-60-40-20
020406080
100
2009 2010 2011 2012 2013 2014 2015 2016 2017 2018
FranceBalances
-100-80-60-40-20
020406080
100
2009 2010 2011 2012 2013 2014 2015 2016 2017 2018
AustraliaBalances
-100-80-60-40-20
020406080
100
2009 2010 2011 2012 2013 2014 2015 2016 2017 2018
AustriaBalances
Economic climate Assessment of economic situation Economic expectations
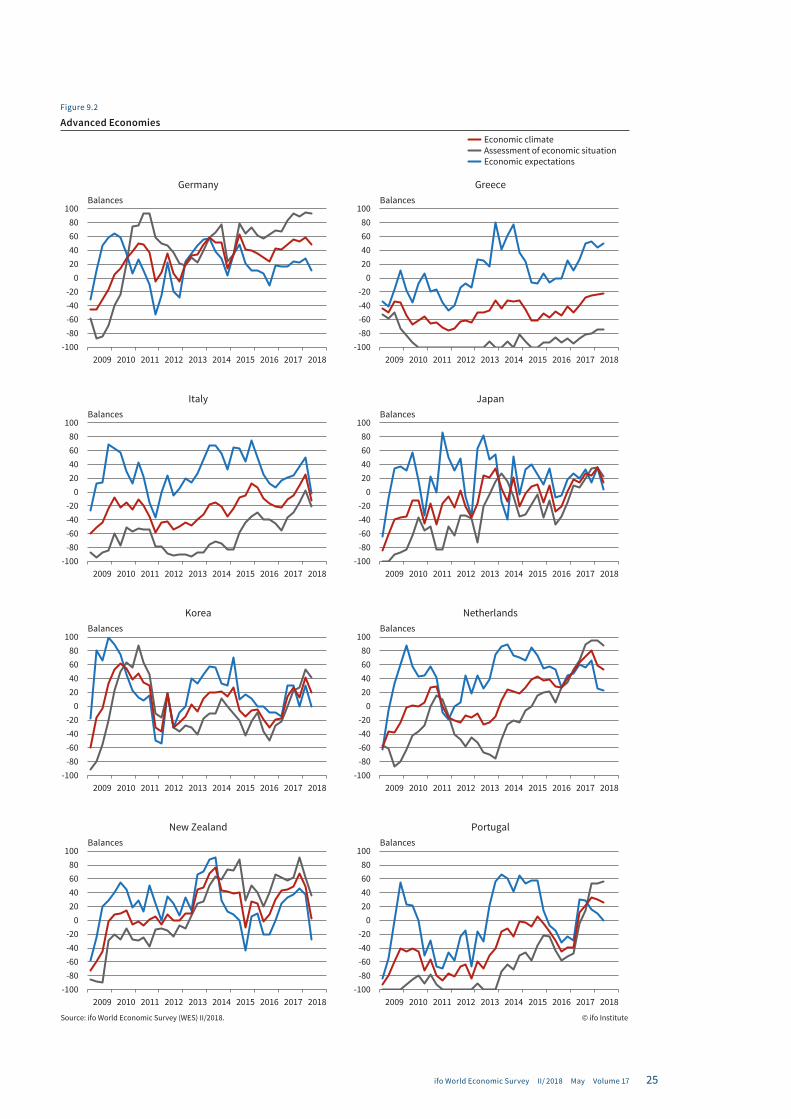
25ifo World Economic Survey II/ 2018 May Volume 17
Figure 9.2
Advanced Economies
Source: ifo World Economic Survey (WES) II/2018. © ifo Institute
-100-80-60-40-20
020406080
100
2009 2010 2011 2012 2013 2014 2015 2016 2017 2018
ItalyBalances
-100-80-60-40-20
020406080
100
2009 2010 2011 2012 2013 2014 2015 2016 2017 2018
JapanBalances
-100-80-60-40-20
020406080
100
2009 2010 2011 2012 2013 2014 2015 2016 2017 2018
KoreaBalances
-100-80-60-40-20
020406080
100
2009 2010 2011 2012 2013 2014 2015 2016 2017 2018
NetherlandsBalances
-100-80-60-40-20
020406080
100
2009 2010 2011 2012 2013 2014 2015 2016 2017 2018
New ZealandBalances
-100-80-60-40-20
020406080
100
2009 2010 2011 2012 2013 2014 2015 2016 2017 2018
PortugalBalances
-100-80-60-40-20
020406080
100
2009 2010 2011 2012 2013 2014 2015 2016 2017 2018
GermanyBalances
-100-80-60-40-20
020406080
100
2009 2010 2011 2012 2013 2014 2015 2016 2017 2018
GreeceBalances
Economic climate Assessment of economic situation Economic expectations
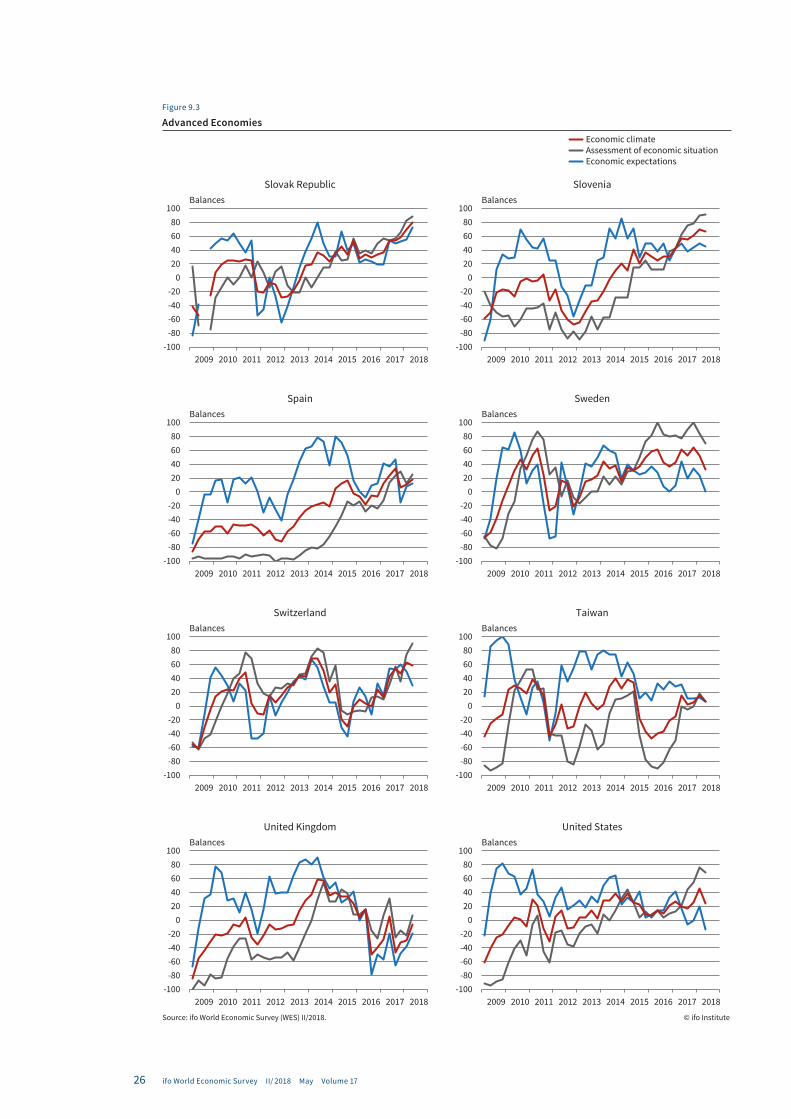
26 ifo World Economic Survey II/ 2018 May Volume 17
Figure 9.3
Advanced Economies
Source: ifo World Economic Survey (WES) II/2018. © ifo Institute
-100-80-60-40-20
020406080
100
2009 2010 2011 2012 2013 2014 2015 2016 2017 2018
SpainBalances
-100-80-60-40-20
020406080
100
2009 2010 2011 2012 2013 2014 2015 2016 2017 2018
SwedenBalances
-100-80-60-40-20
020406080
100
2009 2010 2011 2012 2013 2014 2015 2016 2017 2018
SwitzerlandBalances
-100-80-60-40-20
020406080
100
2009 2010 2011 2012 2013 2014 2015 2016 2017 2018
TaiwanBalances
-100-80-60-40-20
020406080
100
2009 2010 2011 2012 2013 2014 2015 2016 2017 2018
United KingdomBalances
-100-80-60-40-20
020406080
100
2009 2010 2011 2012 2013 2014 2015 2016 2017 2018
United StatesBalances
-100-80-60-40-20
020406080
100
2009 2010 2011 2012 2013 2014 2015 2016 2017 2018
Slovak RepublicBalances
-100-80-60-40-20
020406080
100
2009 2010 2011 2012 2013 2014 2015 2016 2017 2018
SloveniaBalances
Economic climate Assessment of economic situation Economic expectations
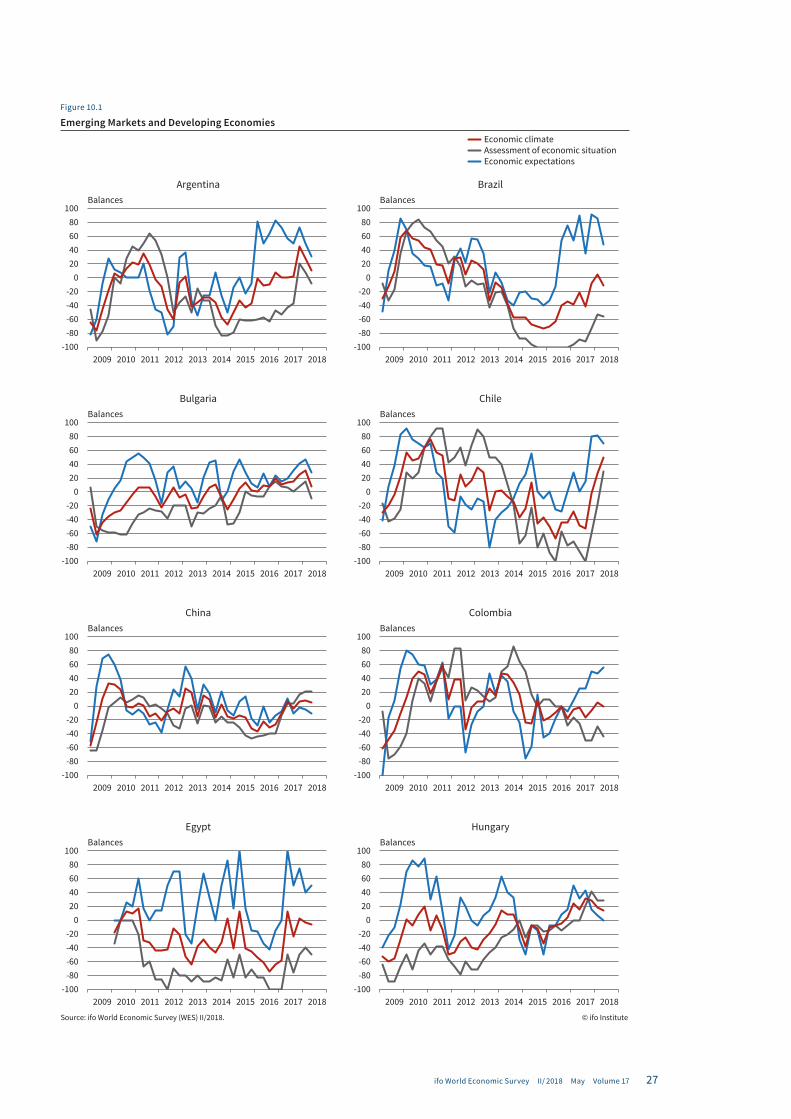
27ifo World Economic Survey II/ 2018 May Volume 17
Figure 10.1
Emerging Markets and Developing Economies
Source: ifo World Economic Survey (WES) II/2018. © ifo Institute
-100-80-60-40-20
020406080
100
2009 2010 2011 2012 2013 2014 2015 2016 2017 2018
BulgariaBalances
-100-80-60-40-20
020406080
100
2009 2010 2011 2012 2013 2014 2015 2016 2017 2018
ChileBalances
-100-80-60-40-20
020406080
100
2009 2010 2011 2012 2013 2014 2015 2016 2017 2018
ChinaBalances
-100-80-60-40-20
020406080
100
2009 2010 2011 2012 2013 2014 2015 2016 2017 2018
ColombiaBalances
-100-80-60-40-20
020406080
100
2009 2010 2011 2012 2013 2014 2015 2016 2017 2018
EgyptBalances
-100-80-60-40-20
020406080
100
2009 2010 2011 2012 2013 2014 2015 2016 2017 2018
HungaryBalances
-100-80-60-40-20
020406080
100
2009 2010 2011 2012 2013 2014 2015 2016 2017 2018
ArgentinaBalances
-100-80-60-40-20
020406080
100
2009 2010 2011 2012 2013 2014 2015 2016 2017 2018
BrazilBalances
Economic climate Assessment of economic situation Economic expectations
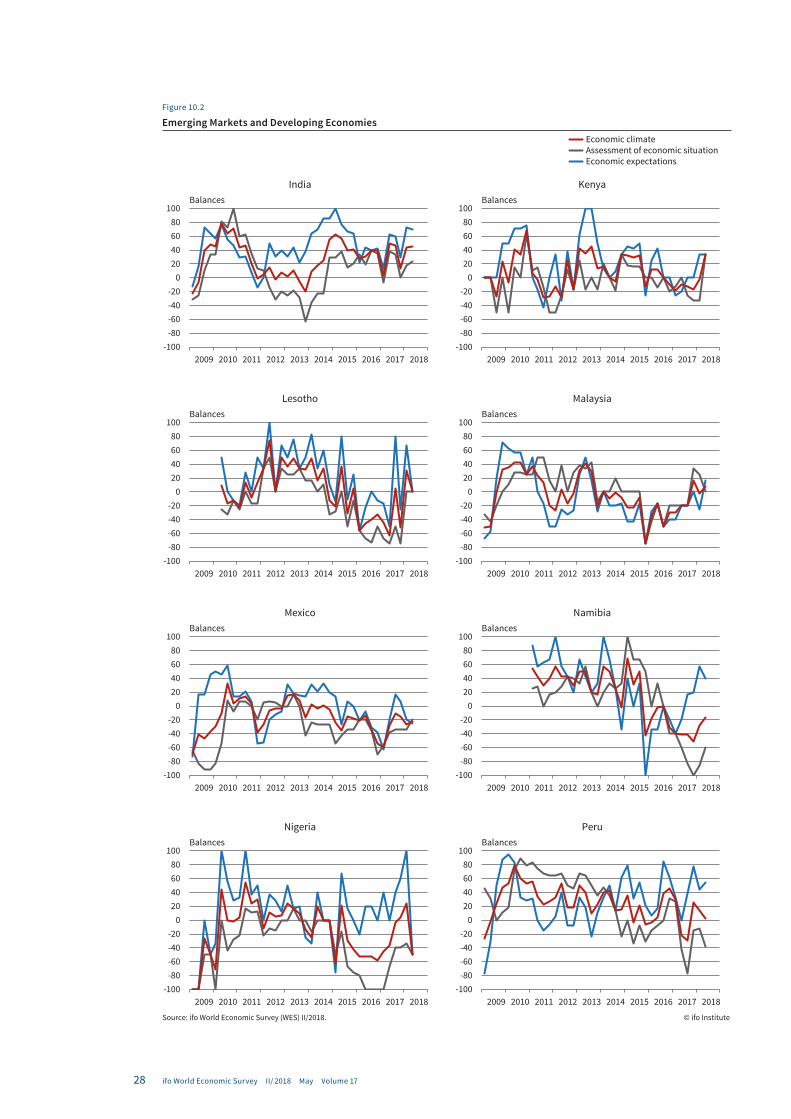
28 ifo World Economic Survey II/ 2018 May Volume 17
Figure 10.2
Emerging Markets and Developing Economies
Source: ifo World Economic Survey (WES) II/2018. © ifo Institute
-100-80-60-40-20
020406080
100
2009 2010 2011 2012 2013 2014 2015 2016 2017 2018
LesothoBalances
-100-80-60-40-20
020406080
100
2009 2010 2011 2012 2013 2014 2015 2016 2017 2018
MalaysiaBalances
-100-80-60-40-20
020406080
100
2009 2010 2011 2012 2013 2014 2015 2016 2017 2018
MexicoBalances
-100-80-60-40-20
020406080
100
2009 2010 2011 2012 2013 2014 2015 2016 2017 2018
NamibiaBalances
-100-80-60-40-20
020406080
100
2009 2010 2011 2012 2013 2014 2015 2016 2017 2018
NigeriaBalances
-100-80-60-40-20
020406080
100
2009 2010 2011 2012 2013 2014 2015 2016 2017 2018
PeruBalances
-100-80-60-40-20
020406080
100
2009 2010 2011 2012 2013 2014 2015 2016 2017 2018
IndiaBalances
-100-80-60-40-20
020406080
100
2009 2010 2011 2012 2013 2014 2015 2016 2017 2018
KenyaBalances
Economic climate Assessment of economic situation Economic expectations
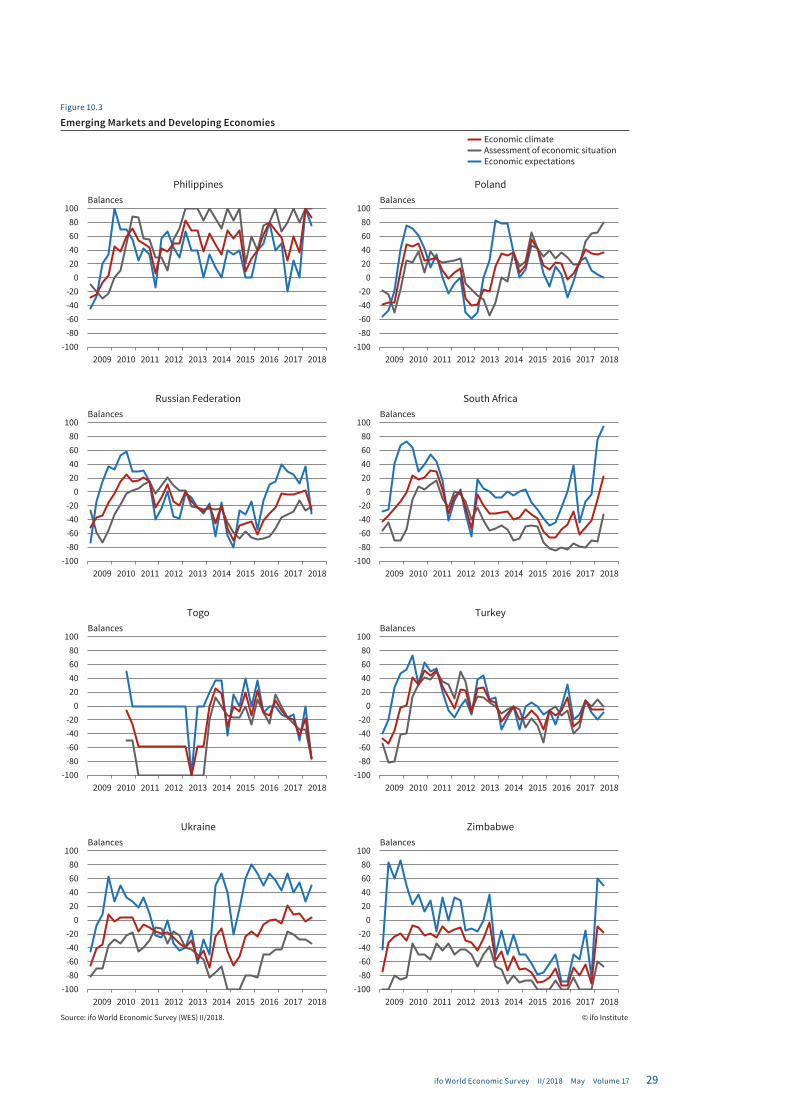
29ifo World Economic Survey II/ 2018 May Volume 17
Figure 10.3
Emerging Markets and Developing Economies
Source: ifo World Economic Survey (WES) II/2018. © ifo Institute
-100-80-60-40-20
020406080
100
2009 2010 2011 2012 2013 2014 2015 2016 2017 2018
Russian FederationBalances
-100-80-60-40-20
020406080
100
2009 2010 2011 2012 2013 2014 2015 2016 2017 2018
South AfricaBalances
-100-80-60-40-20
020406080
100
2009 2010 2011 2012 2013 2014 2015 2016 2017 2018
TogoBalances
-100-80-60-40-20
020406080
100
2009 2010 2011 2012 2013 2014 2015 2016 2017 2018
TurkeyBalances
-100-80-60-40-20
020406080
100
2009 2010 2011 2012 2013 2014 2015 2016 2017 2018
UkraineBalances
-100-80-60-40-20
020406080
100
2009 2010 2011 2012 2013 2014 2015 2016 2017 2018
ZimbabweBalances
-100-80-60-40-20
020406080
100
2009 2010 2011 2012 2013 2014 2015 2016 2017 2018
PhilippinesBalances
-100-80-60-40-20
020406080
100
2009 2010 2011 2012 2013 2014 2015 2016 2017 2018
PolandBalances
Economic climate Assessment of economic situation Economic expectations
Volume 38 / April 2018
ifo World Economic
Survey
Highlights
▪ ifo World Economic Climate Deteriorates
▪ Upturn in the Advanced Economies Loses its
Momentum
▪ Recovery in Emerging Market and Developing
Economies Cools Down
Confidential
Not for publication
WES 140 – II/2018
ifo Institute
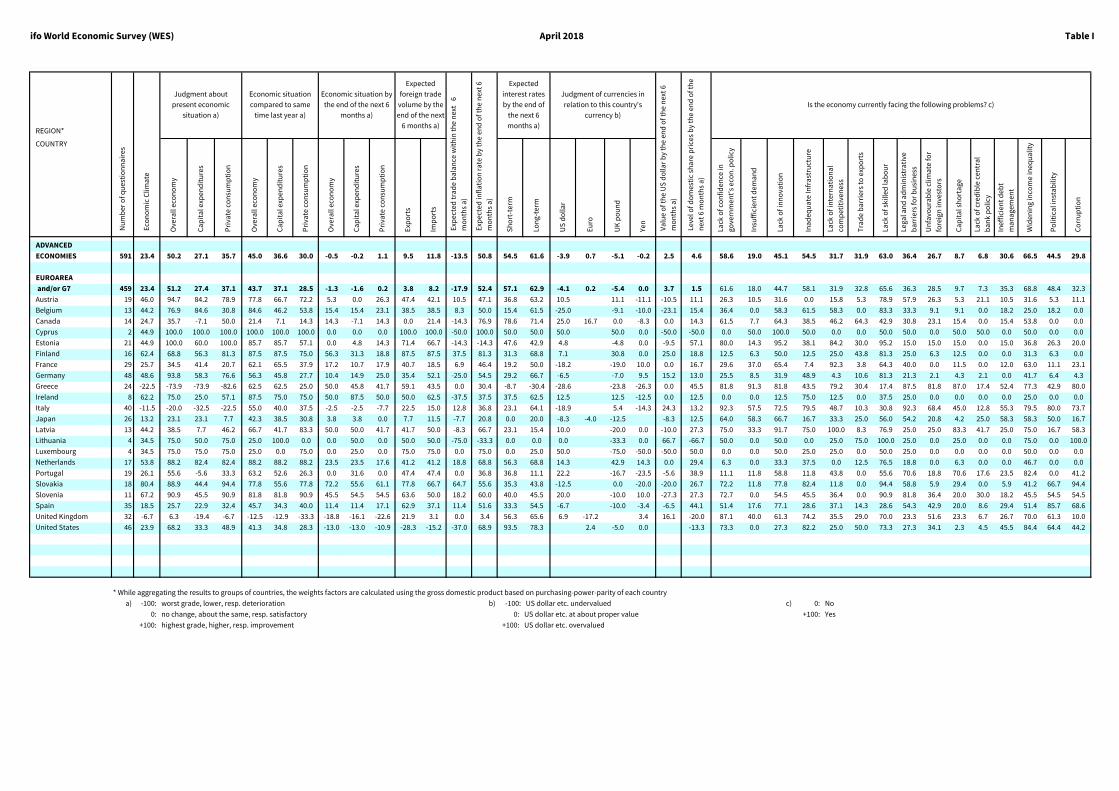
ifo World Economic Survey (WES) April 2018 Table I
REGION*
COUNTRY
Ove
rall
eco
no
my
Ca
pit
al e
xpen
dit
ure
s
Pri
vate
co
nsu
mp
tio
n
Ove
rall
eco
no
my
Ca
pit
al e
xpen
dit
ure
s
Pri
vate
co
nsu
mp
tio
n
Ove
rall
eco
no
my
Ca
pit
al e
xpen
dit
ure
s
Pri
vate
co
nsu
mp
tio
n
Exp
ort
s
Imp
ort
s
Sh
ort
-ter
m
Lon
g-te
rm
US
do
llar
Eu
ro
UK
po
un
d
Yen
Lack
of c
on
fid
ence
in
gove
rnm
ent'
s ec
on
. po
licy
Insu
ffic
ien
t d
ema
nd
Lack
of i
nn
ova
tio
n
Ina
deq
ua
te In
fra
stru
ctu
re
Lack
of i
nte
rna
tio
na
l
com
pet
itiv
enes
s
Tra
de
ba
rrie
rs t
o e
xpo
rts
Lack
of s
kille
d la
bo
ur
Lega
l an
d a
dm
inis
tra
tive
ba
rrie
rs fo
r b
usi
nes
s
Un
favo
ura
ble
cli
ma
te fo
r
fore
ign
inve
sto
rs
Ca
pit
al s
ho
rta
ge
Lack
of c
red
ible
ce
ntr
al
ba
nk
po
licy
Inef
fici
ent
deb
t
ma
na
gem
ent
Wid
enin
g in
com
e in
equ
alit
y
Po
litic
al i
nst
ab
ility
Co
rru
pti
on
ADVANCED
ECONOMIES 591 23.4 50.2 27.1 35.7 45.0 36.6 30.0 -0.5 -0.2 1.1 9.5 11.8 -13.5 50.8 54.5 61.6 -3.9 0.7 -5.1 -0.2 2.5 4.6 58.6 19.0 45.1 54.5 31.7 31.9 63.0 36.4 26.7 8.7 6.8 30.6 66.5 44.5 29.8
EUROAREA
and/or G7 459 23.4 51.2 27.4 37.1 43.7 37.1 28.5 -1.3 -1.6 0.2 3.8 8.2 -17.9 52.4 57.1 62.9 -4.1 0.2 -5.4 0.0 3.7 1.5 61.6 18.0 44.7 58.1 31.9 32.8 65.6 36.3 28.5 9.7 7.3 35.3 68.8 48.4 32.3
Austria 19 46.0 94.7 84.2 78.9 77.8 66.7 72.2 5.3 0.0 26.3 47.4 42.1 10.5 47.1 36.8 63.2 10.5 11.1 -11.1 -10.5 11.1 26.3 10.5 31.6 0.0 15.8 5.3 78.9 57.9 26.3 5.3 21.1 10.5 31.6 5.3 11.1
Belgium 13 44.2 76.9 84.6 30.8 84.6 46.2 53.8 15.4 15.4 23.1 38.5 38.5 8.3 50.0 15.4 61.5 -25.0 -9.1 -10.0 -23.1 15.4 36.4 0.0 58.3 61.5 58.3 0.0 83.3 33.3 9.1 9.1 0.0 18.2 25.0 18.2 0.0
Canada 14 24.7 35.7 -7.1 50.0 21.4 7.1 14.3 14.3 -7.1 14.3 0.0 21.4 -14.3 76.9 78.6 71.4 25.0 16.7 0.0 -8.3 0.0 14.3 61.5 7.7 64.3 38.5 46.2 64.3 42.9 30.8 23.1 15.4 0.0 15.4 53.8 0.0 0.0
Cyprus 2 44.9 100.0 100.0 100.0 100.0 100.0 100.0 0.0 0.0 0.0 100.0 100.0 -50.0 100.0 50.0 50.0 50.0 50.0 0.0 -50.0 -50.0 0.0 50.0 100.0 50.0 0.0 0.0 50.0 50.0 0.0 50.0 50.0 0.0 50.0 0.0 0.0
Estonia 21 44.9 100.0 60.0 100.0 85.7 85.7 57.1 0.0 4.8 14.3 71.4 66.7 -14.3 -14.3 47.6 42.9 4.8 -4.8 0.0 -9.5 57.1 80.0 14.3 95.2 38.1 84.2 30.0 95.2 15.0 15.0 15.0 0.0 15.0 36.8 26.3 20.0
Finland 16 62.4 68.8 56.3 81.3 87.5 87.5 75.0 56.3 31.3 18.8 87.5 87.5 37.5 81.3 31.3 68.8 7.1 30.8 0.0 25.0 18.8 12.5 6.3 50.0 12.5 25.0 43.8 81.3 25.0 6.3 12.5 0.0 0.0 31.3 6.3 0.0
France 29 25.7 34.5 41.4 20.7 62.1 65.5 37.9 17.2 10.7 17.9 40.7 18.5 6.9 46.4 19.2 50.0 -18.2 -19.0 10.0 0.0 16.7 29.6 37.0 65.4 7.4 92.3 3.8 64.3 40.0 0.0 11.5 0.0 12.0 63.0 11.1 23.1
Germany 48 48.6 93.8 58.3 76.6 56.3 45.8 27.7 10.4 14.9 25.0 35.4 52.1 -25.0 54.5 29.2 66.7 -6.5 -7.0 9.5 15.2 13.0 25.5 8.5 31.9 48.9 4.3 10.6 81.3 21.3 2.1 4.3 2.1 0.0 41.7 6.4 4.3
Greece 24 -22.5 -73.9 -73.9 -82.6 62.5 62.5 25.0 50.0 45.8 41.7 59.1 43.5 0.0 30.4 -8.7 -30.4 -28.6 -23.8 -26.3 0.0 45.5 81.8 91.3 81.8 43.5 79.2 30.4 17.4 87.5 81.8 87.0 17.4 52.4 77.3 42.9 80.0
Ireland 8 62.2 75.0 25.0 57.1 87.5 75.0 75.0 50.0 87.5 50.0 50.0 62.5 -37.5 37.5 37.5 62.5 12.5 12.5 -12.5 0.0 12.5 0.0 0.0 12.5 75.0 12.5 0.0 37.5 25.0 0.0 0.0 0.0 0.0 25.0 0.0 0.0
Italy 40 -11.5 -20.0 -32.5 -22.5 55.0 40.0 37.5 -2.5 -2.5 -7.7 22.5 15.0 12.8 36.8 23.1 64.1 -18.9 5.4 -14.3 24.3 13.2 92.3 57.5 72.5 79.5 48.7 10.3 30.8 92.3 68.4 45.0 12.8 55.3 79.5 80.0 73.7
Japan 26 13.2 23.1 23.1 7.7 42.3 38.5 30.8 3.8 3.8 0.0 7.7 11.5 -7.7 20.8 0.0 20.0 -8.3 -4.0 -12.5 -8.3 12.5 64.0 58.3 66.7 16.7 33.3 25.0 56.0 54.2 20.8 4.2 25.0 58.3 58.3 50.0 16.7
Latvia 13 44.2 38.5 7.7 46.2 66.7 41.7 83.3 50.0 50.0 41.7 41.7 50.0 -8.3 66.7 23.1 15.4 10.0 -20.0 0.0 -10.0 27.3 75.0 33.3 91.7 75.0 100.0 8.3 76.9 25.0 25.0 83.3 41.7 25.0 75.0 16.7 58.3
Lithuania 4 34.5 75.0 50.0 75.0 25.0 100.0 0.0 0.0 50.0 0.0 50.0 50.0 -75.0 -33.3 0.0 0.0 0.0 -33.3 0.0 66.7 -66.7 50.0 0.0 50.0 0.0 25.0 75.0 100.0 25.0 0.0 25.0 0.0 0.0 75.0 0.0 100.0
Luxembourg 4 34.5 75.0 75.0 75.0 25.0 0.0 75.0 0.0 25.0 0.0 75.0 75.0 0.0 75.0 0.0 25.0 50.0 -75.0 -50.0 -50.0 50.0 0.0 0.0 50.0 25.0 25.0 0.0 50.0 25.0 0.0 0.0 0.0 0.0 50.0 0.0 0.0
Netherlands 17 53.8 88.2 82.4 82.4 88.2 88.2 88.2 23.5 23.5 17.6 41.2 41.2 18.8 68.8 56.3 68.8 14.3 42.9 14.3 0.0 29.4 6.3 0.0 33.3 37.5 0.0 12.5 76.5 18.8 0.0 6.3 0.0 0.0 46.7 0.0 0.0
Portugal 19 26.1 55.6 -5.6 33.3 63.2 52.6 26.3 0.0 31.6 0.0 47.4 47.4 0.0 36.8 36.8 11.1 22.2 -16.7 -23.5 -5.6 38.9 11.1 11.8 58.8 11.8 43.8 0.0 55.6 70.6 18.8 70.6 17.6 23.5 82.4 0.0 41.2
Slovakia 18 80.4 88.9 44.4 94.4 77.8 55.6 77.8 72.2 55.6 61.1 77.8 66.7 64.7 55.6 35.3 43.8 -12.5 0.0 -20.0 -20.0 26.7 72.2 11.8 77.8 82.4 11.8 0.0 94.4 58.8 5.9 29.4 0.0 5.9 41.2 66.7 94.4
Slovenia 11 67.2 90.9 45.5 90.9 81.8 81.8 90.9 45.5 54.5 54.5 63.6 50.0 18.2 60.0 40.0 45.5 20.0 -10.0 10.0 -27.3 27.3 72.7 0.0 54.5 45.5 36.4 0.0 90.9 81.8 36.4 20.0 30.0 18.2 45.5 54.5 54.5
Spain 35 18.5 25.7 22.9 32.4 45.7 34.3 40.0 11.4 11.4 17.1 62.9 37.1 11.4 51.6 33.3 54.5 -6.7 -10.0 -3.4 -6.5 44.1 51.4 17.6 77.1 28.6 37.1 14.3 28.6 54.3 42.9 20.0 8.6 29.4 51.4 85.7 68.6
United Kingdom 32 -6.7 6.3 -19.4 -6.7 -12.5 -12.9 -33.3 -18.8 -16.1 -22.6 21.9 3.1 0.0 3.4 56.3 65.6 6.9 -17.2 3.4 16.1 -20.0 87.1 40.0 61.3 74.2 35.5 29.0 70.0 23.3 51.6 23.3 6.7 26.7 70.0 61.3 10.0
United States 46 23.9 68.2 33.3 48.9 41.3 34.8 28.3 -13.0 -13.0 -10.9 -28.3 -15.2 -37.0 68.9 93.5 78.3 2.4 -5.0 0.0 -13.3 73.3 0.0 27.3 82.2 25.0 50.0 73.3 27.3 34.1 2.3 4.5 45.5 84.4 64.4 44.2
* While aggregating the results to groups of countries, the weights factors are calculated using the gross domestic product based on purchasing-power-parity of each country
a) -100: worst grade, lower, resp. deterioration b) -100: US dollar etc. undervalued c) 0: No
0: no change, about the same, resp. satisfactory 0: US dollar etc. at about proper value +100: Yes
+100: highest grade, higher, resp. improvement +100: US dollar etc. overvalued
Va
lue
of t
he
US
do
lla
r b
y th
e en
d o
f th
e n
ext
6
mo
nth
s a
)
Leve
l of d
om
esti
c sh
are
pri
ces
by
the
end
of t
he
nex
t 6
mo
nth
s a
)
Eco
no
mic
Clim
ate
Is the economy currently facing the following problems? c)
Nu
mb
er o
f qu
esti
on
na
ires
Judgment about
present economic
situation a)
Economic situation
compared to same
time last year a)
Economic situation by
the end of the next 6
months a)
Expected
foreign trade
volume by the
end of the next
6 months a)
Exp
ecte
d t
rad
e b
ala
nce
wit
hin
th
e n
ext
6
mo
nth
s a
)
Exp
ecte
d in
fla
tio
n r
ate
by
the
end
of t
he
nex
t 6
mo
nth
s a
)
Expected
interest rates
by the end of
the next 6
months a)
Judgment of currencies in
relation to this country's
currency b)
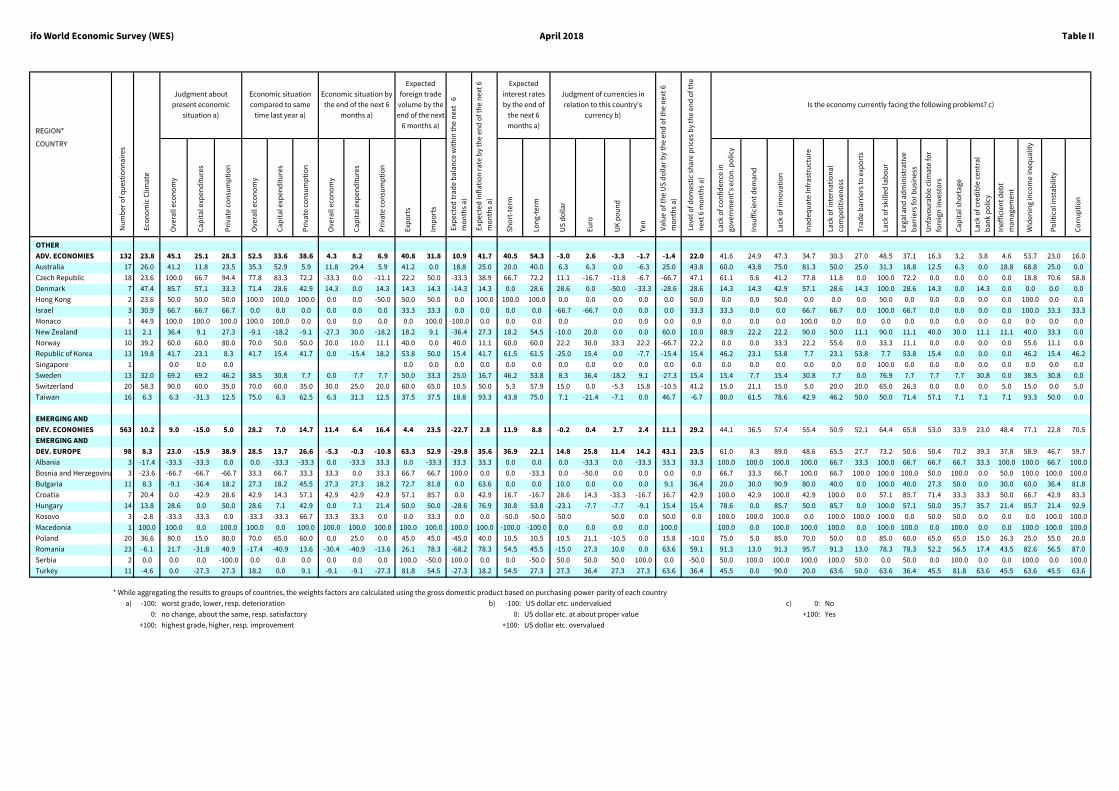
ifo World Economic Survey (WES) April 2018 Table II
REGION*
COUNTRY
Ove
rall
eco
no
my
Ca
pit
al e
xpen
dit
ure
s
Pri
vate
co
nsu
mp
tio
n
Ove
rall
eco
no
my
Ca
pit
al e
xpen
dit
ure
s
Pri
vate
co
nsu
mp
tio
n
Ove
rall
eco
no
my
Ca
pit
al e
xpen
dit
ure
s
Pri
vate
co
nsu
mp
tio
n
Exp
ort
s
Imp
ort
s
Sh
ort
-ter
m
Lon
g-te
rm
US
do
llar
Eu
ro
UK
po
un
d
Yen
Lack
of c
on
fid
ence
in
gove
rnm
ent'
s ec
on
. po
licy
Insu
ffic
ien
t d
ema
nd
Lack
of i
nn
ova
tio
n
Ina
deq
ua
te In
fra
stru
ctu
re
Lack
of i
nte
rna
tio
na
l
com
pet
itiv
enes
s
Tra
de
ba
rrie
rs t
o e
xpo
rts
Lack
of s
kille
d la
bo
ur
Lega
l an
d a
dm
inis
tra
tive
ba
rrie
rs fo
r b
usi
nes
s
Un
favo
ura
ble
cli
ma
te fo
r
fore
ign
inve
sto
rs
Ca
pit
al s
ho
rta
ge
Lack
of c
red
ible
ce
ntr
al
ba
nk
po
licy
Inef
fici
ent
deb
t
ma
na
gem
ent
Wid
enin
g in
com
e in
equ
alit
y
Po
litic
al i
nst
ab
ility
Co
rru
pti
on
OTHER
ADV. ECONOMIES 132 23.8 45.1 25.1 28.3 52.5 33.6 38.6 4.3 8.2 6.9 40.8 31.8 10.9 41.7 40.5 54.3 -3.0 2.6 -3.3 -1.7 -1.4 22.0 41.6 24.9 47.3 34.7 30.3 27.0 48.5 37.1 16.3 3.2 3.8 4.6 53.7 23.0 16.0
Australia 17 26.0 41.2 11.8 23.5 35.3 52.9 5.9 11.8 29.4 5.9 41.2 0.0 18.8 25.0 20.0 40.0 6.3 6.3 0.0 -6.3 25.0 43.8 60.0 43.8 75.0 81.3 50.0 25.0 31.3 18.8 12.5 6.3 0.0 18.8 68.8 25.0 0.0
Czech Republic 18 23.6 100.0 66.7 94.4 77.8 83.3 72.2 -33.3 0.0 -11.1 22.2 50.0 -33.3 38.9 66.7 72.2 11.1 -16.7 -11.8 -6.7 -66.7 47.1 61.1 5.6 41.2 77.8 11.8 0.0 100.0 72.2 0.0 0.0 0.0 0.0 18.8 70.6 58.8
Denmark 7 47.4 85.7 57.1 33.3 71.4 28.6 42.9 14.3 0.0 14.3 14.3 14.3 -14.3 14.3 0.0 28.6 28.6 0.0 -50.0 -33.3 -28.6 28.6 14.3 14.3 42.9 57.1 28.6 14.3 100.0 28.6 14.3 0.0 14.3 0.0 0.0 0.0 0.0
Hong Kong 2 23.6 50.0 50.0 50.0 100.0 100.0 100.0 0.0 0.0 -50.0 50.0 50.0 0.0 100.0 100.0 100.0 0.0 0.0 0.0 0.0 0.0 50.0 0.0 0.0 50.0 0.0 0.0 0.0 50.0 0.0 0.0 0.0 0.0 0.0 100.0 0.0 0.0
Israel 3 30.9 66.7 66.7 66.7 0.0 0.0 0.0 0.0 0.0 0.0 33.3 33.3 0.0 0.0 0.0 0.0 -66.7 -66.7 0.0 0.0 0.0 33.3 33.3 0.0 0.0 66.7 66.7 0.0 100.0 66.7 0.0 0.0 0.0 0.0 100.0 33.3 33.3
Monaco 1 44.9 100.0 100.0 100.0 100.0 100.0 0.0 0.0 0.0 0.0 0.0 100.0 -100.0 0.0 0.0 0.0 0.0 0.0 0.0 0.0 0.0 0.0 0.0 0.0 100.0 0.0 0.0 0.0 0.0 0.0 0.0 0.0 0.0 0.0 0.0 0.0
New Zealand 11 2.1 36.4 9.1 27.3 -9.1 -18.2 -9.1 -27.3 30.0 -18.2 18.2 9.1 -36.4 27.3 18.2 54.5 -10.0 20.0 0.0 0.0 60.0 10.0 88.9 22.2 22.2 90.0 50.0 11.1 90.0 11.1 40.0 30.0 11.1 11.1 40.0 33.3 0.0
Norway 10 39.2 60.0 60.0 80.0 70.0 50.0 50.0 20.0 10.0 11.1 40.0 0.0 40.0 11.1 60.0 60.0 22.2 30.0 33.3 22.2 -66.7 22.2 0.0 0.0 33.3 22.2 55.6 0.0 33.3 11.1 0.0 0.0 0.0 0.0 55.6 11.1 0.0
Republic of Korea 13 19.8 41.7 23.1 8.3 41.7 15.4 41.7 0.0 -15.4 18.2 53.8 50.0 15.4 41.7 61.5 61.5 -25.0 15.4 0.0 -7.7 -15.4 15.4 46.2 23.1 53.8 7.7 23.1 53.8 7.7 53.8 15.4 0.0 0.0 0.0 46.2 15.4 46.2
Singapore 1 0.0 0.0 0.0 0.0 0.0 0.0 0.0 0.0 0.0 0.0 0.0 0.0 0.0 0.0 0.0 0.0 0.0 0.0 0.0 0.0 0.0 100.0 0.0 0.0 0.0 0.0 0.0 0.0 0.0 0.0
Sweden 13 32.0 69.2 69.2 46.2 38.5 30.8 7.7 0.0 -7.7 7.7 50.0 33.3 25.0 16.7 46.2 53.8 8.3 36.4 -18.2 9.1 -27.3 15.4 15.4 7.7 15.4 30.8 7.7 0.0 76.9 7.7 7.7 7.7 30.8 0.0 38.5 30.8 0.0
Switzerland 20 58.3 90.0 60.0 35.0 70.0 60.0 35.0 30.0 25.0 20.0 60.0 65.0 10.5 50.0 5.3 57.9 15.0 0.0 -5.3 15.8 -10.5 41.2 15.0 21.1 15.0 5.0 20.0 20.0 65.0 26.3 0.0 0.0 0.0 5.0 15.0 0.0 5.0
Taiwan 16 6.3 6.3 -31.3 12.5 75.0 6.3 62.5 6.3 31.3 12.5 37.5 37.5 18.8 93.3 43.8 75.0 7.1 -21.4 -7.1 0.0 46.7 -6.7 80.0 61.5 78.6 42.9 46.2 50.0 50.0 71.4 57.1 7.1 7.1 7.1 93.3 50.0 0.0
EMERGING AND
DEV. ECONOMIES 563 10.2 9.0 -15.0 5.0 28.2 7.0 14.7 11.4 6.4 16.4 4.4 23.5 -22.7 2.8 11.9 8.8 -0.2 0.4 2.7 2.4 11.1 29.2 44.1 36.5 57.4 55.4 50.9 52.1 64.4 65.8 53.0 33.9 23.0 48.4 77.1 22.8 70.5
EMERGING AND
DEV. EUROPE 98 8.3 23.0 -15.9 38.9 28.5 13.7 26.6 -5.3 -0.3 -10.8 63.3 52.9 -29.8 35.6 36.9 22.1 14.8 25.8 11.4 14.2 43.1 23.5 61.0 8.3 89.0 48.6 65.5 27.7 73.2 50.6 50.4 70.2 39.3 37.8 58.9 46.7 59.7
Albania 3 -17.4 -33.3 -33.3 0.0 0.0 -33.3 -33.3 0.0 -33.3 33.3 0.0 -33.3 33.3 33.3 0.0 0.0 0.0 -33.3 0.0 -33.3 33.3 33.3 100.0 100.0 100.0 100.0 66.7 33.3 100.0 66.7 66.7 66.7 33.3 100.0 100.0 66.7 100.0
Bosnia and Herzegovina 3 -23.6 -66.7 -66.7 -66.7 33.3 66.7 33.3 33.3 0.0 33.3 66.7 66.7 100.0 0.0 0.0 -33.3 0.0 -50.0 0.0 0.0 0.0 0.0 66.7 33.3 66.7 100.0 66.7 100.0 100.0 100.0 50.0 100.0 0.0 50.0 100.0 100.0 100.0
Bulgaria 11 8.3 -9.1 -36.4 18.2 27.3 18.2 45.5 27.3 27.3 18.2 72.7 81.8 0.0 63.6 0.0 0.0 10.0 0.0 0.0 0.0 9.1 36.4 20.0 30.0 90.9 80.0 40.0 0.0 100.0 40.0 27.3 50.0 0.0 30.0 60.0 36.4 81.8
Croatia 7 20.4 0.0 -42.9 28.6 42.9 14.3 57.1 42.9 42.9 42.9 57.1 85.7 0.0 42.9 16.7 -16.7 28.6 14.3 -33.3 -16.7 16.7 42.9 100.0 42.9 100.0 42.9 100.0 0.0 57.1 85.7 71.4 33.3 33.3 50.0 66.7 42.9 83.3
Hungary 14 13.8 28.6 0.0 50.0 28.6 7.1 42.9 0.0 7.1 21.4 50.0 50.0 -28.6 76.9 30.8 53.8 -23.1 -7.7 -7.7 -9.1 15.4 15.4 78.6 0.0 85.7 50.0 85.7 0.0 100.0 57.1 50.0 35.7 35.7 21.4 85.7 21.4 92.9
Kosovo 3 -2.8 -33.3 -33.3 0.0 -33.3 -33.3 66.7 33.3 33.3 0.0 0.0 33.3 0.0 0.0 -50.0 -50.0 -50.0 50.0 0.0 50.0 0.0 100.0 100.0 100.0 0.0 100.0 100.0 100.0 0.0 50.0 50.0 0.0 0.0 0.0 100.0 100.0
Macedonia 1 100.0 100.0 0.0 100.0 100.0 0.0 100.0 100.0 100.0 100.0 100.0 100.0 100.0 100.0 -100.0 -100.0 0.0 0.0 0.0 0.0 100.0 100.0 0.0 100.0 100.0 100.0 0.0 100.0 100.0 0.0 100.0 0.0 0.0 100.0 100.0 100.0
Poland 20 36.6 80.0 15.0 80.0 70.0 65.0 60.0 0.0 25.0 0.0 45.0 45.0 -45.0 40.0 10.5 10.5 10.5 21.1 -10.5 0.0 15.8 -10.0 75.0 5.0 85.0 70.0 50.0 0.0 85.0 60.0 65.0 65.0 15.0 26.3 25.0 55.0 20.0
Romania 23 -6.1 21.7 -31.8 40.9 -17.4 -40.9 13.6 -30.4 -40.9 -13.6 26.1 78.3 -68.2 78.3 54.5 45.5 -15.0 27.3 10.0 0.0 63.6 59.1 91.3 13.0 91.3 95.7 91.3 13.0 78.3 78.3 52.2 56.5 17.4 43.5 82.6 56.5 87.0
Serbia 2 0.0 0.0 0.0 -100.0 0.0 0.0 0.0 0.0 0.0 0.0 100.0 -50.0 100.0 0.0 0.0 -50.0 50.0 50.0 50.0 100.0 0.0 -50.0 50.0 100.0 100.0 100.0 100.0 50.0 0.0 50.0 0.0 100.0 0.0 0.0 100.0 0.0 100.0
Turkey 11 -4.6 0.0 -27.3 27.3 18.2 0.0 9.1 -9.1 -9.1 -27.3 81.8 54.5 -27.3 18.2 54.5 27.3 27.3 36.4 27.3 27.3 63.6 36.4 45.5 0.0 90.0 20.0 63.6 50.0 63.6 36.4 45.5 81.8 63.6 45.5 63.6 45.5 63.6
* While aggregating the results to groups of countries, the weights factors are calculated using the gross domestic product based on purchasing-power-parity of each country
a) -100: worst grade, lower, resp. deterioration b) -100: US dollar etc. undervalued c) 0: No
0: no change, about the same, resp. satisfactory 0: US dollar etc. at about proper value +100: Yes
+100: highest grade, higher, resp. improvement +100: US dollar etc. overvalued
Expected
foreign trade
volume by the
end of the next
6 months a)N
um
ber
of q
ues
tio
nn
air
es
Eco
no
mic
Clim
ate
Judgment about
present economic
situation a)
Economic situation
compared to same
time last year a)
Economic situation by
the end of the next 6
months a)
Is the economy currently facing the following problems? c)
Exp
ecte
d t
rad
e b
ala
nce
wit
hin
th
e n
ext
6
mo
nth
s a
)
Exp
ecte
d in
fla
tio
n r
ate
by
the
end
of t
he
nex
t 6
mo
nth
s a
)
Expected
interest rates
by the end of
the next 6
months a)
Judgment of currencies in
relation to this country's
currency b)
Va
lue
of t
he
US
do
lla
r b
y th
e en
d o
f th
e n
ext
6
mo
nth
s a
)
Leve
l of d
om
esti
c sh
are
pri
ces
by
the
end
of t
he
nex
t 6
mo
nth
s a
)
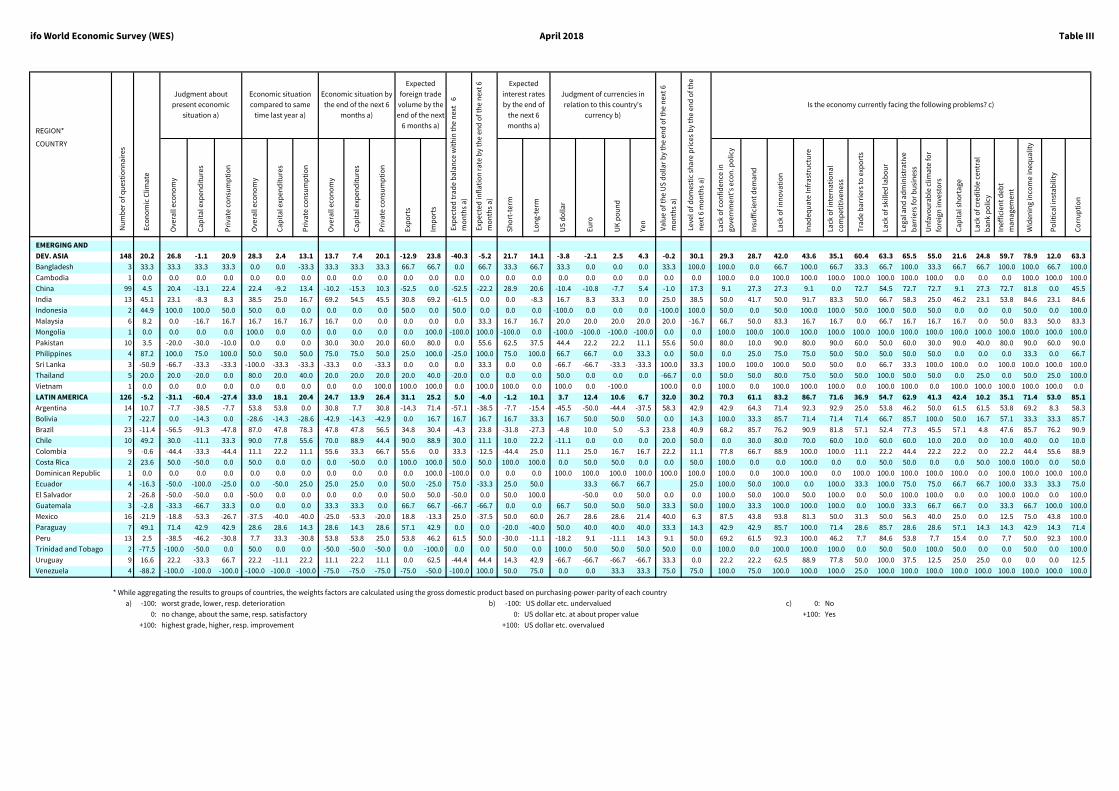
ifo World Economic Survey (WES) April 2018 Table III
REGION*
COUNTRY
Ove
rall
eco
no
my
Ca
pit
al e
xpen
dit
ure
s
Pri
vate
co
nsu
mp
tio
n
Ove
rall
eco
no
my
Ca
pit
al e
xpen
dit
ure
s
Pri
vate
co
nsu
mp
tio
n
Ove
rall
eco
no
my
Ca
pit
al e
xpen
dit
ure
s
Pri
vate
co
nsu
mp
tio
n
Exp
ort
s
Imp
ort
s
Sh
ort
-ter
m
Lon
g-te
rm
US
do
llar
Eu
ro
UK
po
un
d
Yen
Lack
of c
on
fid
ence
in
gove
rnm
ent'
s ec
on
. po
licy
Insu
ffic
ien
t d
ema
nd
Lack
of i
nn
ova
tio
n
Ina
deq
ua
te In
fra
stru
ctu
re
Lack
of i
nte
rna
tio
na
l
com
pet
itiv
enes
s
Tra
de
ba
rrie
rs t
o e
xpo
rts
Lack
of s
kille
d la
bo
ur
Lega
l an
d a
dm
inis
tra
tive
ba
rrie
rs fo
r b
usi
nes
s
Un
favo
ura
ble
cli
ma
te fo
r
fore
ign
inve
sto
rs
Ca
pit
al s
ho
rta
ge
Lack
of c
red
ible
ce
ntr
al
ba
nk
po
licy
Inef
fici
ent
deb
t
ma
na
gem
ent
Wid
enin
g in
com
e in
equ
alit
y
Po
litic
al i
nst
ab
ility
Co
rru
pti
on
EMERGING AND
DEV. ASIA 148 20.2 26.8 -1.1 20.9 28.3 2.4 13.1 13.7 7.4 20.1 -12.9 23.8 -40.3 -5.2 21.7 14.1 -3.8 -2.1 2.5 4.3 -0.2 30.1 29.3 28.7 42.0 43.6 35.1 60.4 63.3 65.5 55.0 21.6 24.8 59.7 78.9 12.0 63.3
Bangladesh 3 33.3 33.3 33.3 33.3 0.0 0.0 -33.3 33.3 33.3 33.3 66.7 66.7 0.0 66.7 33.3 66.7 33.3 0.0 0.0 0.0 33.3 100.0 100.0 0.0 66.7 100.0 66.7 33.3 66.7 100.0 33.3 66.7 66.7 100.0 100.0 66.7 100.0
Cambodia 1 0.0 0.0 0.0 0.0 0.0 0.0 0.0 0.0 0.0 0.0 0.0 0.0 0.0 0.0 0.0 0.0 0.0 0.0 0.0 0.0 0.0 0.0 100.0 0.0 100.0 100.0 100.0 100.0 100.0 100.0 100.0 0.0 0.0 0.0 100.0 100.0 100.0
China 99 4.5 20.4 -13.1 22.4 22.4 -9.2 13.4 -10.2 -15.3 10.3 -52.5 0.0 -52.5 -22.2 28.9 20.6 -10.4 -10.8 -7.7 5.4 -1.0 17.3 9.1 27.3 27.3 9.1 0.0 72.7 54.5 72.7 72.7 9.1 27.3 72.7 81.8 0.0 45.5
India 13 45.1 23.1 -8.3 8.3 38.5 25.0 16.7 69.2 54.5 45.5 30.8 69.2 -61.5 0.0 0.0 -8.3 16.7 8.3 33.3 0.0 25.0 38.5 50.0 41.7 50.0 91.7 83.3 50.0 66.7 58.3 25.0 46.2 23.1 53.8 84.6 23.1 84.6
Indonesia 2 44.9 100.0 100.0 50.0 50.0 0.0 0.0 0.0 0.0 0.0 50.0 0.0 50.0 0.0 0.0 0.0 -100.0 0.0 0.0 0.0 -100.0 100.0 50.0 0.0 50.0 100.0 100.0 50.0 100.0 50.0 50.0 0.0 0.0 0.0 50.0 0.0 100.0
Malaysia 6 8.2 0.0 -16.7 16.7 16.7 16.7 16.7 16.7 0.0 0.0 0.0 0.0 0.0 33.3 16.7 16.7 20.0 20.0 20.0 20.0 20.0 -16.7 66.7 50.0 83.3 16.7 16.7 0.0 66.7 16.7 16.7 16.7 0.0 50.0 83.3 50.0 83.3
Mongolia 1 0.0 0.0 0.0 0.0 100.0 0.0 0.0 0.0 0.0 0.0 0.0 100.0 -100.0 100.0 -100.0 0.0 -100.0 -100.0 -100.0 -100.0 0.0 0.0 100.0 100.0 100.0 100.0 100.0 100.0 100.0 100.0 100.0 100.0 100.0 100.0 100.0 100.0 100.0
Pakistan 10 3.5 -20.0 -30.0 -10.0 0.0 0.0 0.0 30.0 30.0 20.0 60.0 80.0 0.0 55.6 62.5 37.5 44.4 22.2 22.2 11.1 55.6 50.0 80.0 10.0 90.0 80.0 90.0 60.0 50.0 60.0 30.0 90.0 40.0 80.0 90.0 60.0 90.0
Philippines 4 87.2 100.0 75.0 100.0 50.0 50.0 50.0 75.0 75.0 50.0 25.0 100.0 -25.0 100.0 75.0 100.0 66.7 66.7 0.0 33.3 0.0 50.0 0.0 25.0 75.0 75.0 50.0 50.0 50.0 50.0 50.0 0.0 0.0 0.0 33.3 0.0 66.7
Sri Lanka 3 -50.9 -66.7 -33.3 -33.3 -100.0 -33.3 -33.3 -33.3 0.0 -33.3 0.0 0.0 0.0 33.3 0.0 0.0 -66.7 -66.7 -33.3 -33.3 100.0 33.3 100.0 100.0 100.0 50.0 50.0 0.0 66.7 33.3 100.0 100.0 0.0 100.0 100.0 100.0 100.0
Thailand 5 20.0 20.0 -20.0 0.0 80.0 20.0 40.0 20.0 20.0 20.0 20.0 40.0 -20.0 0.0 0.0 0.0 50.0 0.0 0.0 0.0 -66.7 0.0 50.0 50.0 80.0 75.0 50.0 50.0 100.0 50.0 50.0 0.0 25.0 0.0 50.0 25.0 100.0
Vietnam 1 0.0 0.0 0.0 0.0 0.0 0.0 0.0 0.0 0.0 100.0 100.0 100.0 0.0 100.0 100.0 0.0 100.0 0.0 -100.0 100.0 0.0 100.0 0.0 100.0 100.0 100.0 0.0 100.0 100.0 0.0 100.0 100.0 100.0 100.0 100.0 0.0
LATIN AMERICA 126 -5.2 -31.1 -60.4 -27.4 33.0 18.1 20.4 24.7 13.9 26.4 31.1 25.2 5.0 -4.0 -1.2 10.1 3.7 12.4 10.6 6.7 32.0 30.2 70.3 61.1 83.2 86.7 71.6 36.9 54.7 62.9 41.3 42.4 10.2 35.1 71.4 53.0 85.1
Argentina 14 10.7 -7.7 -38.5 -7.7 53.8 53.8 0.0 30.8 7.7 30.8 -14.3 71.4 -57.1 -38.5 -7.7 -15.4 -45.5 -50.0 -44.4 -37.5 58.3 42.9 42.9 64.3 71.4 92.3 92.9 25.0 53.8 46.2 50.0 61.5 61.5 53.8 69.2 8.3 58.3
Bolivia 7 -22.7 0.0 -14.3 0.0 -28.6 -14.3 -28.6 -42.9 -14.3 -42.9 0.0 16.7 16.7 16.7 16.7 33.3 16.7 50.0 50.0 50.0 0.0 14.3 100.0 33.3 85.7 71.4 71.4 71.4 66.7 85.7 100.0 50.0 16.7 57.1 33.3 33.3 85.7
Brazil 23 -11.4 -56.5 -91.3 -47.8 87.0 47.8 78.3 47.8 47.8 56.5 34.8 30.4 -4.3 23.8 -31.8 -27.3 -4.8 10.0 5.0 -5.3 23.8 40.9 68.2 85.7 76.2 90.9 81.8 57.1 52.4 77.3 45.5 57.1 4.8 47.6 85.7 76.2 90.9
Chile 10 49.2 30.0 -11.1 33.3 90.0 77.8 55.6 70.0 88.9 44.4 90.0 88.9 30.0 11.1 10.0 22.2 -11.1 0.0 0.0 0.0 20.0 50.0 0.0 30.0 80.0 70.0 60.0 10.0 60.0 60.0 10.0 20.0 0.0 10.0 40.0 0.0 10.0
Colombia 9 -0.6 -44.4 -33.3 -44.4 11.1 22.2 11.1 55.6 33.3 66.7 55.6 0.0 33.3 -12.5 -44.4 25.0 11.1 25.0 16.7 16.7 22.2 11.1 77.8 66.7 88.9 100.0 100.0 11.1 22.2 44.4 22.2 22.2 0.0 22.2 44.4 55.6 88.9
Costa Rica 2 23.6 50.0 -50.0 0.0 50.0 0.0 0.0 0.0 -50.0 0.0 100.0 100.0 50.0 50.0 100.0 100.0 0.0 50.0 50.0 0.0 0.0 50.0 100.0 0.0 0.0 100.0 0.0 0.0 50.0 50.0 0.0 0.0 50.0 100.0 100.0 0.0 50.0
Dominican Republic 1 0.0 0.0 0.0 0.0 0.0 0.0 0.0 0.0 0.0 0.0 0.0 100.0 -100.0 0.0 0.0 0.0 100.0 100.0 100.0 100.0 100.0 100.0 100.0 0.0 100.0 100.0 0.0 100.0 100.0 100.0 100.0 100.0 0.0 100.0 100.0 100.0 100.0
Ecuador 4 -16.3 -50.0 -100.0 -25.0 0.0 -50.0 25.0 25.0 25.0 0.0 50.0 -25.0 75.0 -33.3 25.0 50.0 33.3 66.7 66.7 25.0 100.0 50.0 100.0 0.0 100.0 33.3 100.0 75.0 75.0 66.7 66.7 100.0 33.3 33.3 75.0
El Salvador 2 -26.8 -50.0 -50.0 0.0 -50.0 0.0 0.0 0.0 0.0 0.0 50.0 50.0 -50.0 0.0 50.0 100.0 -50.0 0.0 50.0 0.0 0.0 100.0 50.0 100.0 50.0 100.0 0.0 50.0 100.0 100.0 0.0 0.0 100.0 100.0 0.0 100.0
Guatemala 3 -2.8 -33.3 -66.7 33.3 0.0 0.0 0.0 33.3 33.3 0.0 66.7 66.7 -66.7 -66.7 0.0 0.0 66.7 50.0 50.0 50.0 33.3 50.0 100.0 33.3 100.0 100.0 100.0 0.0 100.0 33.3 66.7 66.7 0.0 33.3 66.7 100.0 100.0
Mexico 16 -21.9 -18.8 -53.3 -26.7 -37.5 -40.0 -40.0 -25.0 -53.3 -20.0 18.8 -13.3 25.0 -37.5 50.0 60.0 26.7 28.6 28.6 21.4 40.0 6.3 87.5 43.8 93.8 81.3 50.0 31.3 50.0 56.3 40.0 25.0 0.0 12.5 75.0 43.8 100.0
Paraguay 7 49.1 71.4 42.9 42.9 28.6 28.6 14.3 28.6 14.3 28.6 57.1 42.9 0.0 0.0 -20.0 -40.0 50.0 40.0 40.0 40.0 33.3 14.3 42.9 42.9 85.7 100.0 71.4 28.6 85.7 28.6 28.6 57.1 14.3 14.3 42.9 14.3 71.4
Peru 13 2.5 -38.5 -46.2 -30.8 7.7 33.3 -30.8 53.8 53.8 25.0 53.8 46.2 61.5 50.0 -30.0 -11.1 -18.2 9.1 -11.1 14.3 9.1 50.0 69.2 61.5 92.3 100.0 46.2 7.7 84.6 53.8 7.7 15.4 0.0 7.7 50.0 92.3 100.0
Trinidad and Tobago 2 -77.5 -100.0 -50.0 0.0 50.0 0.0 0.0 -50.0 -50.0 -50.0 0.0 -100.0 0.0 0.0 50.0 0.0 100.0 50.0 50.0 50.0 50.0 0.0 100.0 0.0 100.0 100.0 100.0 0.0 50.0 50.0 100.0 50.0 0.0 0.0 50.0 0.0 100.0
Uruguay 9 16.6 22.2 -33.3 66.7 22.2 -11.1 22.2 11.1 22.2 11.1 0.0 62.5 -44.4 44.4 14.3 42.9 -66.7 -66.7 -66.7 -66.7 33.3 0.0 22.2 22.2 62.5 88.9 77.8 50.0 100.0 37.5 12.5 25.0 25.0 0.0 0.0 0.0 12.5
Venezuela 4 -88.2 -100.0 -100.0 -100.0 -100.0 -100.0 -100.0 -75.0 -75.0 -75.0 -75.0 -50.0 -100.0 100.0 50.0 75.0 0.0 0.0 33.3 33.3 75.0 75.0 100.0 75.0 100.0 100.0 100.0 25.0 100.0 100.0 100.0 100.0 100.0 100.0 100.0 100.0 100.0
* While aggregating the results to groups of countries, the weights factors are calculated using the gross domestic product based on purchasing-power-parity of each country
a) -100: worst grade, lower, resp. deterioration b) -100: US dollar etc. undervalued c) 0: No
0: no change, about the same, resp. satisfactory 0: US dollar etc. at about proper value +100: Yes
+100: highest grade, higher, resp. improvement +100: US dollar etc. overvalued
Expected
foreign trade
volume by the
end of the next
6 months a)N
um
ber
of q
ues
tio
nn
air
es
Eco
no
mic
Clim
ate
Judgment about
present economic
situation a)
Economic situation
compared to same
time last year a)
Economic situation by
the end of the next 6
months a)
Is the economy currently facing the following problems? c)
Exp
ecte
d t
rad
e b
ala
nce
wit
hin
th
e n
ext
6
mo
nth
s a
)
Exp
ecte
d in
fla
tio
n r
ate
by
the
end
of t
he
nex
t 6
mo
nth
s a
)
Expected
interest rates
by the end of
the next 6
months a)
Judgment of currencies in
relation to this country's
currency b)
Va
lue
of t
he
US
do
lla
r b
y th
e en
d o
f th
e n
ext
6
mo
nth
s a
)
Leve
l of d
om
esti
c sh
are
pri
ces
by
the
end
of t
he
nex
t 6
mo
nth
s a
)
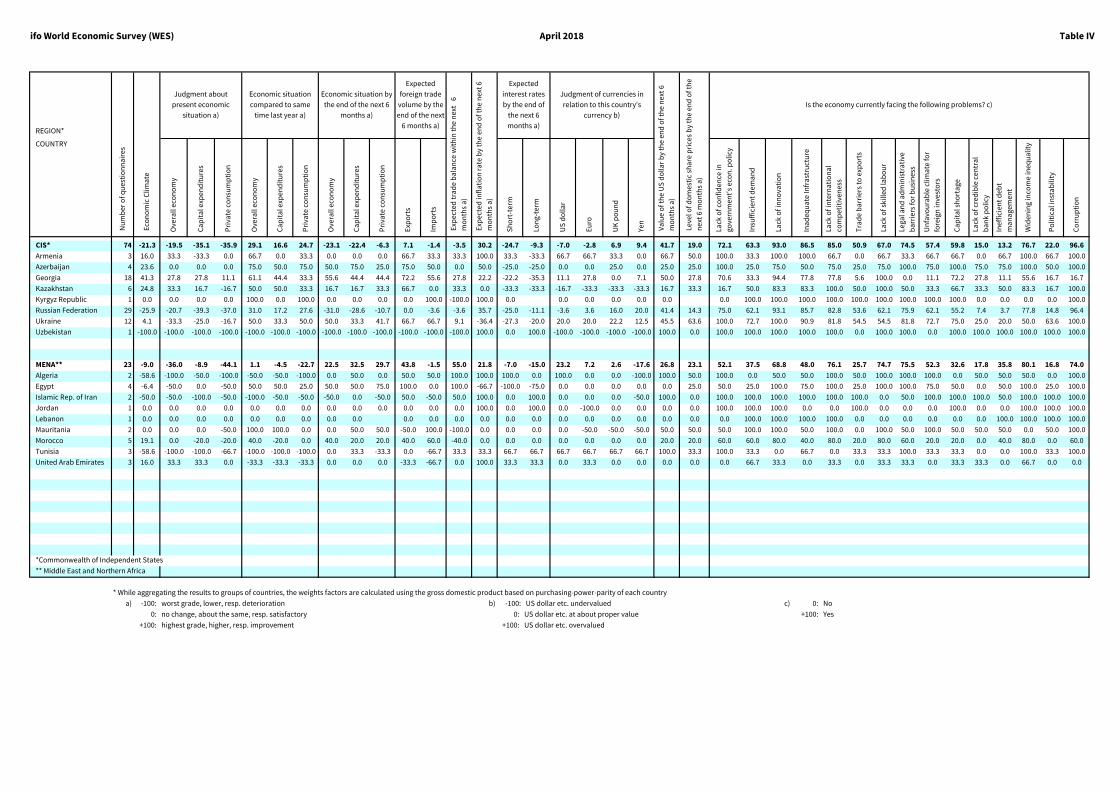
ifo World Economic Survey (WES) April 2018 Table IV
REGION*
COUNTRY
Ove
rall
eco
no
my
Ca
pit
al e
xpen
dit
ure
s
Pri
vate
co
nsu
mp
tio
n
Ove
rall
eco
no
my
Ca
pit
al e
xpen
dit
ure
s
Pri
vate
co
nsu
mp
tio
n
Ove
rall
eco
no
my
Ca
pit
al e
xpen
dit
ure
s
Pri
vate
co
nsu
mp
tio
n
Exp
ort
s
Imp
ort
s
Sh
ort
-ter
m
Lon
g-te
rm
US
do
llar
Eu
ro
UK
po
un
d
Yen
Lack
of c
on
fid
ence
in
gove
rnm
ent'
s ec
on
. po
licy
Insu
ffic
ien
t d
ema
nd
Lack
of i
nn
ova
tio
n
Ina
deq
ua
te In
fra
stru
ctu
re
Lack
of i
nte
rna
tio
na
l
com
pet
itiv
enes
s
Tra
de
ba
rrie
rs t
o e
xpo
rts
Lack
of s
kille
d la
bo
ur
Lega
l an
d a
dm
inis
tra
tive
ba
rrie
rs fo
r b
usi
nes
s
Un
favo
ura
ble
cli
ma
te fo
r
fore
ign
inve
sto
rs
Ca
pit
al s
ho
rta
ge
Lack
of c
red
ible
ce
ntr
al
ba
nk
po
licy
Inef
fici
ent
deb
t
ma
na
gem
ent
Wid
enin
g in
com
e in
equ
alit
y
Po
litic
al i
nst
ab
ility
Co
rru
pti
on
CIS* 74 -21.3 -19.5 -35.1 -35.9 29.1 16.6 24.7 -23.1 -22.4 -6.3 7.1 -1.4 -3.5 30.2 -24.7 -9.3 -7.0 -2.8 6.9 9.4 41.7 19.0 72.1 63.3 93.0 86.5 85.0 50.9 67.0 74.5 57.4 59.8 15.0 13.2 76.7 22.0 96.6
Armenia 3 16.0 33.3 -33.3 0.0 66.7 0.0 33.3 0.0 0.0 0.0 66.7 33.3 33.3 100.0 33.3 -33.3 66.7 66.7 33.3 0.0 66.7 50.0 100.0 33.3 100.0 100.0 66.7 0.0 66.7 33.3 66.7 66.7 0.0 66.7 100.0 66.7 100.0
Azerbaijan 4 23.6 0.0 0.0 0.0 75.0 50.0 75.0 50.0 75.0 25.0 75.0 50.0 0.0 50.0 -25.0 -25.0 0.0 0.0 25.0 0.0 25.0 25.0 100.0 25.0 75.0 50.0 75.0 25.0 75.0 100.0 75.0 100.0 75.0 75.0 100.0 50.0 100.0
Georgia 18 41.3 27.8 27.8 11.1 61.1 44.4 33.3 55.6 44.4 44.4 72.2 55.6 27.8 22.2 -22.2 -35.3 11.1 27.8 0.0 7.1 50.0 27.8 70.6 33.3 94.4 77.8 77.8 5.6 100.0 0.0 11.1 72.2 27.8 11.1 55.6 16.7 16.7
Kazakhstan 6 24.8 33.3 16.7 -16.7 50.0 50.0 33.3 16.7 16.7 33.3 66.7 0.0 33.3 0.0 -33.3 -33.3 -16.7 -33.3 -33.3 -33.3 16.7 33.3 16.7 50.0 83.3 83.3 100.0 50.0 100.0 50.0 33.3 66.7 33.3 50.0 83.3 16.7 100.0
Kyrgyz Republic 1 0.0 0.0 0.0 0.0 100.0 0.0 100.0 0.0 0.0 0.0 0.0 100.0 -100.0 100.0 0.0 0.0 0.0 0.0 0.0 0.0 0.0 100.0 100.0 100.0 100.0 100.0 100.0 100.0 100.0 100.0 0.0 0.0 0.0 0.0 100.0
Russian Federation 29 -25.9 -20.7 -39.3 -37.0 31.0 17.2 27.6 -31.0 -28.6 -10.7 0.0 -3.6 -3.6 35.7 -25.0 -11.1 -3.6 3.6 16.0 20.0 41.4 14.3 75.0 62.1 93.1 85.7 82.8 53.6 62.1 75.9 62.1 55.2 7.4 3.7 77.8 14.8 96.4
Ukraine 12 4.1 -33.3 -25.0 -16.7 50.0 33.3 50.0 50.0 33.3 41.7 66.7 66.7 9.1 -36.4 -27.3 -20.0 20.0 20.0 22.2 12.5 45.5 63.6 100.0 72.7 100.0 90.9 81.8 54.5 54.5 81.8 72.7 75.0 25.0 20.0 50.0 63.6 100.0
Uzbekistan 1 -100.0 -100.0 -100.0 -100.0 -100.0 -100.0 -100.0 -100.0 -100.0 -100.0 -100.0 -100.0 -100.0 100.0 0.0 100.0 -100.0 -100.0 -100.0 -100.0 100.0 0.0 100.0 100.0 100.0 100.0 100.0 0.0 100.0 100.0 0.0 100.0 100.0 100.0 100.0 100.0 100.0
MENA** 23 -9.0 -36.0 -8.9 -44.1 1.1 -4.5 -22.7 22.5 32.5 29.7 43.8 -1.5 55.0 21.8 -7.0 -15.0 23.2 7.2 2.6 -17.6 26.8 23.1 52.1 37.5 68.8 48.0 76.1 25.7 74.7 75.5 52.3 32.6 17.8 35.8 80.1 16.8 74.0
Algeria 2 -58.6 -100.0 -50.0 -100.0 -50.0 -50.0 -100.0 0.0 50.0 0.0 50.0 50.0 100.0 100.0 100.0 0.0 100.0 0.0 0.0 -100.0 100.0 50.0 100.0 0.0 50.0 50.0 100.0 50.0 100.0 100.0 100.0 0.0 50.0 50.0 50.0 0.0 100.0
Egypt 4 -6.4 -50.0 0.0 -50.0 50.0 50.0 25.0 50.0 50.0 75.0 100.0 0.0 100.0 -66.7 -100.0 -75.0 0.0 0.0 0.0 0.0 0.0 25.0 50.0 25.0 100.0 75.0 100.0 25.0 100.0 100.0 75.0 50.0 0.0 50.0 100.0 25.0 100.0
Islamic Rep. of Iran 2 -50.0 -50.0 -100.0 -50.0 -100.0 -50.0 -50.0 -50.0 0.0 -50.0 50.0 -50.0 50.0 100.0 0.0 100.0 0.0 0.0 0.0 -50.0 100.0 0.0 100.0 100.0 100.0 100.0 100.0 100.0 0.0 50.0 100.0 100.0 100.0 50.0 100.0 100.0 100.0
Jordan 1 0.0 0.0 0.0 0.0 0.0 0.0 0.0 0.0 0.0 0.0 0.0 0.0 0.0 100.0 0.0 100.0 0.0 -100.0 0.0 0.0 0.0 0.0 100.0 100.0 100.0 0.0 0.0 100.0 0.0 0.0 0.0 100.0 0.0 0.0 100.0 100.0 100.0
Lebanon 1 0.0 0.0 0.0 0.0 0.0 0.0 0.0 0.0 0.0 0.0 0.0 0.0 0.0 0.0 0.0 0.0 0.0 0.0 0.0 0.0 0.0 0.0 100.0 100.0 100.0 100.0 0.0 0.0 0.0 0.0 0.0 0.0 100.0 100.0 100.0 100.0
Mauritania 2 0.0 0.0 0.0 -50.0 100.0 100.0 0.0 0.0 50.0 50.0 -50.0 100.0 -100.0 0.0 0.0 0.0 0.0 -50.0 -50.0 -50.0 50.0 50.0 50.0 100.0 100.0 50.0 100.0 0.0 100.0 50.0 100.0 50.0 50.0 50.0 0.0 50.0 100.0
Morocco 5 19.1 0.0 -20.0 -20.0 40.0 -20.0 0.0 40.0 20.0 20.0 40.0 60.0 -40.0 0.0 0.0 0.0 0.0 0.0 0.0 0.0 20.0 20.0 60.0 60.0 80.0 40.0 80.0 20.0 80.0 60.0 20.0 20.0 0.0 40.0 80.0 0.0 60.0
Tunisia 3 -58.6 -100.0 -100.0 -66.7 -100.0 -100.0 -100.0 0.0 33.3 -33.3 0.0 -66.7 33.3 33.3 66.7 66.7 66.7 66.7 66.7 66.7 100.0 33.3 100.0 33.3 0.0 66.7 0.0 33.3 33.3 100.0 33.3 33.3 0.0 0.0 100.0 33.3 100.0
United Arab Emirates 3 16.0 33.3 33.3 0.0 -33.3 -33.3 -33.3 0.0 0.0 0.0 -33.3 -66.7 0.0 100.0 33.3 33.3 0.0 33.3 0.0 0.0 0.0 0.0 0.0 66.7 33.3 0.0 33.3 0.0 33.3 33.3 0.0 33.3 33.3 0.0 66.7 0.0 0.0
*Commonwealth of Independent States
** Middle East and Northern Africa
* While aggregating the results to groups of countries, the weights factors are calculated using the gross domestic product based on purchasing-power-parity of each country
a) -100: worst grade, lower, resp. deterioration b) -100: US dollar etc. undervalued c) 0: No
0: no change, about the same, resp. satisfactory 0: US dollar etc. at about proper value +100: Yes
+100: highest grade, higher, resp. improvement +100: US dollar etc. overvalued
Expected
foreign trade
volume by the
end of the next
6 months a)N
um
ber
of q
ues
tio
nn
air
es
Eco
no
mic
Clim
ate
Judgment about
present economic
situation a)
Economic situation
compared to same
time last year a)
Economic situation by
the end of the next 6
months a)
Is the economy currently facing the following problems? c)
Exp
ecte
d t
rad
e b
ala
nce
wit
hin
th
e n
ext
6
mo
nth
s a
)
Exp
ecte
d in
fla
tio
n r
ate
by
the
end
of t
he
nex
t 6
mo
nth
s a
)
Expected
interest rates
by the end of
the next 6
months a)
Judgment of currencies in
relation to this country's
currency b)
Va
lue
of t
he
US
do
lla
r b
y th
e en
d o
f th
e n
ext
6
mo
nth
s a
)
Leve
l of d
om
esti
c sh
are
pri
ces
by
the
end
of t
he
nex
t 6
mo
nth
s a
)
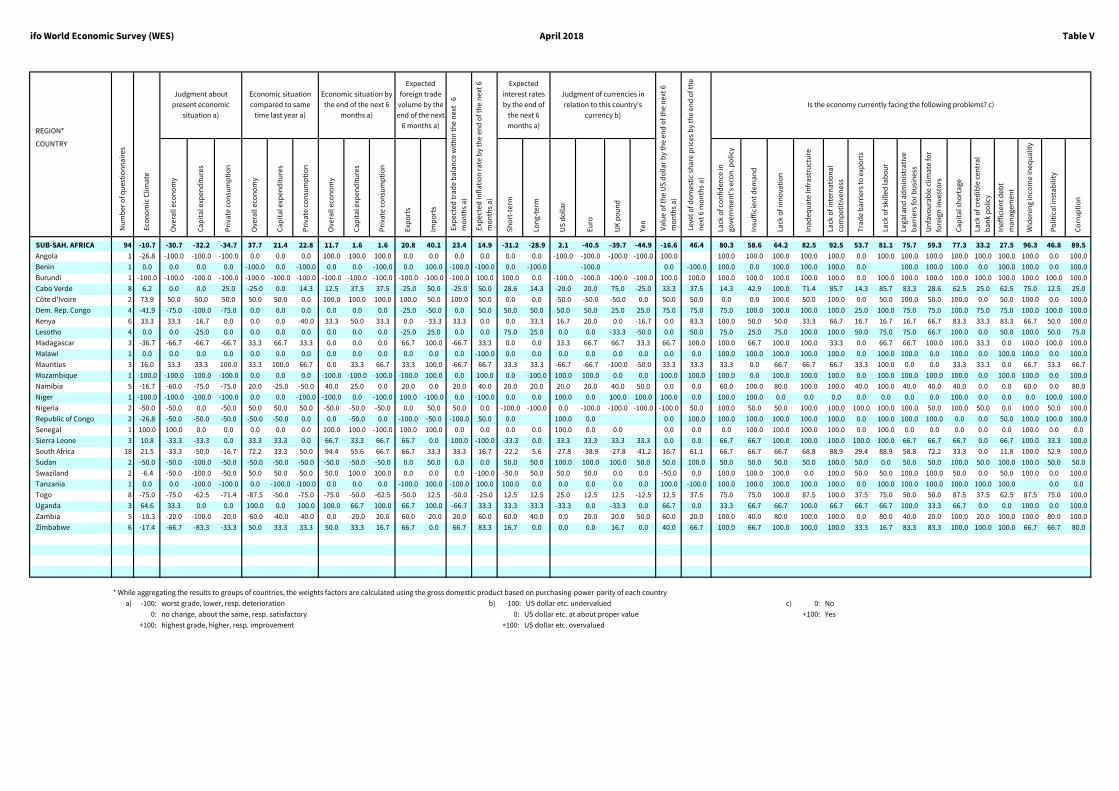
ifo World Economic Survey (WES) April 2018 Table V
REGION*
COUNTRY
Ove
rall
eco
no
my
Ca
pit
al e
xpen
dit
ure
s
Pri
vate
co
nsu
mp
tio
n
Ove
rall
eco
no
my
Ca
pit
al e
xpen
dit
ure
s
Pri
vate
co
nsu
mp
tio
n
Ove
rall
eco
no
my
Ca
pit
al e
xpen
dit
ure
s
Pri
vate
co
nsu
mp
tio
n
Exp
ort
s
Imp
ort
s
Sh
ort
-ter
m
Lon
g-te
rm
US
do
llar
Eu
ro
UK
po
un
d
Yen
Lack
of c
on
fid
ence
in
gove
rnm
ent'
s ec
on
. po
licy
Insu
ffic
ien
t d
ema
nd
Lack
of i
nn
ova
tio
n
Ina
deq
ua
te In
fra
stru
ctu
re
Lack
of i
nte
rna
tio
na
l
com
pet
itiv
enes
s
Tra
de
ba
rrie
rs t
o e
xpo
rts
Lack
of s
kille
d la
bo
ur
Lega
l an
d a
dm
inis
tra
tive
ba
rrie
rs fo
r b
usi
nes
s
Un
favo
ura
ble
cli
ma
te fo
r
fore
ign
inve
sto
rs
Ca
pit
al s
ho
rta
ge
Lack
of c
red
ible
ce
ntr
al
ba
nk
po
licy
Inef
fici
ent
deb
t
ma
na
gem
ent
Wid
enin
g in
com
e in
equ
alit
y
Po
litic
al i
nst
ab
ility
Co
rru
pti
on
SUB-SAH. AFRICA 94 -10.7 -30.7 -32.2 -34.7 37.7 21.4 22.8 11.7 1.6 1.6 20.8 40.1 23.4 14.9 -31.2 -28.9 2.1 -40.5 -39.7 -44.9 -16.6 46.4 80.3 58.6 64.2 82.5 92.5 53.7 81.1 75.7 59.3 77.3 33.2 27.5 96.3 46.8 89.5
Angola 1 -26.8 -100.0 -100.0 -100.0 0.0 0.0 0.0 100.0 100.0 100.0 0.0 0.0 0.0 0.0 0.0 0.0 -100.0 -100.0 -100.0 -100.0 100.0 100.0 100.0 100.0 100.0 100.0 0.0 100.0 100.0 100.0 100.0 100.0 100.0 100.0 0.0 100.0
Benin 1 0.0 0.0 0.0 0.0 -100.0 0.0 -100.0 0.0 0.0 -100.0 0.0 100.0 -100.0 -100.0 0.0 -100.0 -100.0 0.0 -100.0 100.0 0.0 100.0 100.0 100.0 0.0 100.0 100.0 100.0 0.0 100.0 100.0 0.0 100.0
Burundi 1 -100.0 -100.0 -100.0 -100.0 -100.0 -100.0 -100.0 -100.0 -100.0 -100.0 -100.0 -100.0 -100.0 100.0 100.0 0.0 -100.0 -100.0 -100.0 -100.0 100.0 100.0 100.0 100.0 100.0 100.0 100.0 0.0 100.0 100.0 100.0 100.0 100.0 100.0 100.0 100.0 100.0
Cabo Verde 8 6.2 0.0 0.0 25.0 -25.0 0.0 14.3 12.5 37.5 37.5 -25.0 50.0 -25.0 50.0 28.6 14.3 -20.0 20.0 75.0 -25.0 33.3 37.5 14.3 42.9 100.0 71.4 85.7 14.3 85.7 83.3 28.6 62.5 25.0 62.5 75.0 12.5 25.0
Côte d'Ivoire 2 73.9 50.0 50.0 50.0 50.0 50.0 0.0 100.0 100.0 100.0 100.0 50.0 100.0 50.0 0.0 0.0 -50.0 -50.0 -50.0 0.0 50.0 50.0 0.0 0.0 100.0 50.0 100.0 0.0 50.0 100.0 50.0 100.0 0.0 50.0 100.0 0.0 100.0
Dem. Rep. Congo 4 -41.9 -75.0 -100.0 -75.0 0.0 0.0 0.0 0.0 0.0 0.0 -25.0 -50.0 0.0 50.0 50.0 50.0 50.0 50.0 25.0 25.0 75.0 75.0 75.0 100.0 100.0 100.0 100.0 25.0 100.0 75.0 75.0 100.0 75.0 75.0 100.0 100.0 100.0
Kenya 6 33.3 33.3 -16.7 0.0 0.0 0.0 -40.0 33.3 50.0 33.3 0.0 -33.3 33.3 0.0 0.0 33.3 16.7 20.0 0.0 -16.7 0.0 83.3 100.0 50.0 50.0 33.3 66.7 16.7 16.7 16.7 66.7 83.3 33.3 83.3 66.7 50.0 100.0
Lesotho 4 0.0 0.0 -25.0 0.0 0.0 0.0 0.0 0.0 0.0 0.0 -25.0 25.0 0.0 0.0 75.0 25.0 0.0 0.0 -33.3 -50.0 0.0 50.0 75.0 25.0 75.0 100.0 100.0 50.0 75.0 75.0 66.7 100.0 0.0 50.0 100.0 50.0 75.0
Madagascar 3 -36.7 -66.7 -66.7 -66.7 33.3 66.7 33.3 0.0 0.0 0.0 66.7 100.0 -66.7 33.3 0.0 0.0 33.3 66.7 66.7 33.3 66.7 100.0 100.0 66.7 100.0 100.0 33.3 0.0 66.7 66.7 100.0 100.0 33.3 0.0 100.0 100.0 100.0
Malawi 1 0.0 0.0 0.0 0.0 0.0 0.0 0.0 0.0 0.0 0.0 0.0 0.0 0.0 -100.0 0.0 0.0 0.0 0.0 0.0 0.0 0.0 0.0 100.0 100.0 100.0 100.0 100.0 0.0 100.0 100.0 0.0 100.0 0.0 100.0 100.0 0.0 100.0
Mauritius 3 16.0 33.3 33.3 100.0 33.3 100.0 66.7 0.0 33.3 66.7 33.3 100.0 -66.7 66.7 33.3 33.3 -66.7 -66.7 -100.0 -50.0 33.3 33.3 33.3 0.0 66.7 66.7 66.7 33.3 100.0 0.0 0.0 33.3 33.3 0.0 66.7 33.3 66.7
Mozambique 1 -100.0 -100.0 -100.0 -100.0 0.0 0.0 0.0 -100.0 -100.0 -100.0 -100.0 100.0 0.0 100.0 0.0 -100.0 100.0 100.0 0.0 0.0 100.0 100.0 100.0 0.0 100.0 100.0 100.0 0.0 100.0 100.0 100.0 100.0 0.0 100.0 100.0 0.0 100.0
Namibia 5 -16.7 -60.0 -75.0 -75.0 20.0 -25.0 -50.0 40.0 25.0 0.0 20.0 0.0 20.0 40.0 20.0 20.0 20.0 20.0 40.0 50.0 0.0 0.0 60.0 100.0 80.0 100.0 100.0 40.0 100.0 40.0 40.0 40.0 0.0 0.0 60.0 0.0 80.0
Niger 1 -100.0 -100.0 -100.0 -100.0 0.0 0.0 -100.0 -100.0 0.0 -100.0 100.0 -100.0 0.0 -100.0 0.0 0.0 100.0 0.0 100.0 100.0 100.0 0.0 100.0 100.0 0.0 0.0 0.0 0.0 0.0 0.0 0.0 100.0 0.0 0.0 0.0 100.0 100.0
Nigeria 2 -50.0 -50.0 0.0 -50.0 50.0 50.0 50.0 -50.0 -50.0 -50.0 0.0 50.0 50.0 0.0 -100.0 -100.0 0.0 -100.0 -100.0 -100.0 -100.0 50.0 100.0 50.0 50.0 100.0 100.0 100.0 100.0 100.0 50.0 100.0 50.0 0.0 100.0 50.0 100.0
Republic of Congo 2 -26.8 -50.0 -50.0 -50.0 -50.0 -50.0 0.0 0.0 -50.0 0.0 -100.0 -50.0 -100.0 50.0 0.0 100.0 0.0 0.0 100.0 100.0 100.0 100.0 100.0 100.0 0.0 100.0 100.0 100.0 0.0 0.0 50.0 100.0 100.0 100.0
Senegal 1 100.0 100.0 0.0 0.0 0.0 0.0 0.0 100.0 100.0 -100.0 100.0 100.0 0.0 0.0 0.0 0.0 100.0 0.0 0.0 0.0 0.0 0.0 100.0 100.0 100.0 100.0 0.0 100.0 0.0 0.0 0.0 0.0 0.0 100.0 0.0 0.0
Sierra Leone 3 10.8 -33.3 -33.3 0.0 33.3 33.3 0.0 66.7 33.3 66.7 66.7 0.0 100.0 -100.0 -33.3 0.0 33.3 33.3 33.3 33.3 0.0 0.0 66.7 66.7 100.0 100.0 100.0 100.0 100.0 66.7 66.7 66.7 0.0 66.7 100.0 33.3 100.0
South Africa 18 21.5 -33.3 -50.0 -16.7 72.2 33.3 50.0 94.4 55.6 66.7 66.7 33.3 33.3 16.7 -22.2 5.6 -27.8 -38.9 -27.8 -41.2 16.7 61.1 66.7 66.7 66.7 68.8 88.9 29.4 88.9 58.8 72.2 33.3 0.0 11.8 100.0 52.9 100.0
Sudan 2 -50.0 -50.0 -100.0 -50.0 -50.0 -50.0 -50.0 -50.0 -50.0 -50.0 0.0 50.0 0.0 0.0 50.0 50.0 100.0 100.0 100.0 50.0 50.0 100.0 50.0 50.0 50.0 50.0 100.0 50.0 0.0 50.0 50.0 100.0 50.0 100.0 100.0 50.0 50.0
Swaziland 2 -6.4 -50.0 -100.0 -50.0 50.0 50.0 50.0 50.0 100.0 100.0 0.0 0.0 0.0 -100.0 -50.0 50.0 50.0 50.0 0.0 0.0 -50.0 0.0 100.0 100.0 100.0 0.0 100.0 50.0 50.0 100.0 100.0 50.0 0.0 50.0 100.0 0.0 100.0
Tanzania 1 0.0 0.0 -100.0 -100.0 0.0 -100.0 -100.0 0.0 0.0 0.0 -100.0 100.0 -100.0 100.0 100.0 0.0 0.0 0.0 0.0 0.0 100.0 -100.0 100.0 100.0 100.0 100.0 100.0 0.0 100.0 100.0 100.0 100.0 100.0 100.0 0.0 0.0
Togo 8 -75.0 -75.0 -62.5 -71.4 -87.5 -50.0 -75.0 -75.0 -50.0 -62.5 -50.0 12.5 -50.0 -25.0 12.5 12.5 25.0 12.5 12.5 -12.5 12.5 37.5 75.0 75.0 100.0 87.5 100.0 37.5 75.0 50.0 50.0 87.5 37.5 62.5 87.5 75.0 100.0
Uganda 3 64.6 33.3 0.0 0.0 100.0 0.0 100.0 100.0 66.7 100.0 66.7 100.0 -66.7 33.3 33.3 33.3 -33.3 0.0 -33.3 0.0 66.7 0.0 33.3 66.7 66.7 100.0 66.7 66.7 66.7 100.0 33.3 66.7 0.0 0.0 100.0 0.0 100.0
Zambia 5 -10.3 -20.0 -100.0 -20.0 -60.0 -40.0 -40.0 0.0 -20.0 20.0 60.0 -20.0 20.0 60.0 60.0 40.0 0.0 20.0 20.0 50.0 60.0 20.0 100.0 40.0 80.0 100.0 100.0 0.0 80.0 40.0 20.0 100.0 20.0 100.0 100.0 80.0 100.0
Zimbabwe 6 -17.4 -66.7 -83.3 -33.3 50.0 33.3 33.3 50.0 33.3 16.7 66.7 0.0 66.7 83.3 16.7 0.0 0.0 0.0 16.7 0.0 40.0 66.7 100.0 66.7 100.0 100.0 100.0 33.3 16.7 83.3 83.3 100.0 100.0 100.0 66.7 66.7 80.0
* While aggregating the results to groups of countries, the weights factors are calculated using the gross domestic product based on purchasing-power-parity of each country
a) -100: worst grade, lower, resp. deterioration b) -100: US dollar etc. undervalued c) 0: No
0: no change, about the same, resp. satisfactory 0: US dollar etc. at about proper value +100: Yes
+100: highest grade, higher, resp. improvement +100: US dollar etc. overvalued
Expected
foreign trade
volume by the
end of the next
6 months a)N
um
ber
of q
ues
tio
nn
air
es
Eco
no
mic
Clim
ate
Judgment about
present economic
situation a)
Economic situation
compared to same
time last year a)
Economic situation by
the end of the next 6
months a)
Is the economy currently facing the following problems? c)
Exp
ecte
d t
rad
e b
ala
nce
wit
hin
th
e n
ext
6
mo
nth
s a
)
Exp
ecte
d in
fla
tio
n r
ate
by
the
end
of t
he
nex
t 6
mo
nth
s a
)
Expected
interest rates
by the end of
the next 6
months a)
Judgment of currencies in
relation to this country's
currency b)
Va
lue
of t
he
US
do
lla
r b
y th
e en
d o
f th
e n
ext
6
mo
nth
s a
)
Leve
l of d
om
esti
c sh
are
pri
ces
by
the
end
of t
he
nex
t 6
mo
nth
s a
)
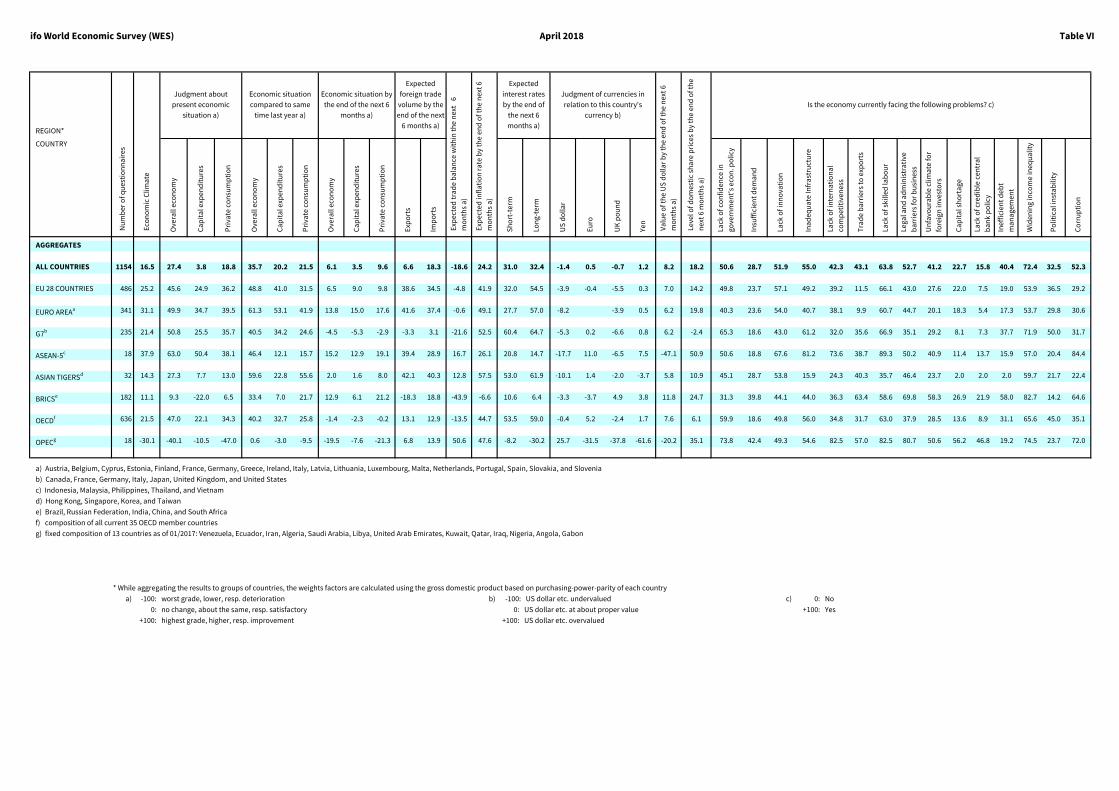
ifo World Economic Survey (WES) April 2018 Table VI
REGION*
COUNTRY
Ove
rall
eco
no
my
Ca
pit
al e
xpen
dit
ure
s
Pri
vate
co
nsu
mp
tio
n
Ove
rall
eco
no
my
Ca
pit
al e
xpen
dit
ure
s
Pri
vate
co
nsu
mp
tio
n
Ove
rall
eco
no
my
Ca
pit
al e
xpen
dit
ure
s
Pri
vate
co
nsu
mp
tio
n
Exp
ort
s
Imp
ort
s
Sh
ort
-ter
m
Lon
g-te
rm
US
do
llar
Eu
ro
UK
po
un
d
Yen
Lack
of c
on
fid
ence
in
gove
rnm
ent'
s ec
on
. po
licy
Insu
ffic
ien
t d
ema
nd
Lack
of i
nn
ova
tio
n
Ina
deq
ua
te In
fra
stru
ctu
re
Lack
of i
nte
rna
tio
na
l
com
pet
itiv
enes
s
Tra
de
ba
rrie
rs t
o e
xpo
rts
Lack
of s
kille
d la
bo
ur
Lega
l an
d a
dm
inis
tra
tive
ba
rrie
rs fo
r b
usi
nes
s
Un
favo
ura
ble
cli
ma
te fo
r
fore
ign
inve
sto
rs
Ca
pit
al s
ho
rta
ge
Lack
of c
red
ible
ce
ntr
al
ba
nk
po
licy
Inef
fici
ent
deb
t
ma
na
gem
ent
Wid
enin
g in
com
e in
equ
alit
y
Po
litic
al i
nst
ab
ility
Co
rru
pti
on
AGGREGATES
ALL COUNTRIES 1154 16.5 27.4 3.8 18.8 35.7 20.2 21.5 6.1 3.5 9.6 6.6 18.3 -18.6 24.2 31.0 32.4 -1.4 0.5 -0.7 1.2 8.2 18.2 50.6 28.7 51.9 55.0 42.3 43.1 63.8 52.7 41.2 22.7 15.8 40.4 72.4 32.5 52.3
EU 28 COUNTRIES 486 25.2 45.6 24.9 36.2 48.8 41.0 31.5 6.5 9.0 9.8 38.6 34.5 -4.8 41.9 32.0 54.5 -3.9 -0.4 -5.5 0.3 7.0 14.2 49.8 23.7 57.1 49.2 39.2 11.5 66.1 43.0 27.6 22.0 7.5 19.0 53.9 36.5 29.2
EURO AREAa 341 31.1 49.9 34.7 39.5 61.3 53.1 41.9 13.8 15.0 17.6 41.6 37.4 -0.6 49.1 27.7 57.0 -8.2 -3.9 0.5 6.2 19.8 40.3 23.6 54.0 40.7 38.1 9.9 60.7 44.7 20.1 18.3 5.4 17.3 53.7 29.8 30.6
G7b 235 21.4 50.8 25.5 35.7 40.5 34.2 24.6 -4.5 -5.3 -2.9 -3.3 3.1 -21.6 52.5 60.4 64.7 -5.3 0.2 -6.6 0.8 6.2 -2.4 65.3 18.6 43.0 61.2 32.0 35.6 66.9 35.1 29.2 8.1 7.3 37.7 71.9 50.0 31.7
ASEAN-5c 18 37.9 63.0 50.4 38.1 46.4 12.1 15.7 15.2 12.9 19.1 39.4 28.9 16.7 26.1 20.8 14.7 -17.7 11.0 -6.5 7.5 -47.1 50.9 50.6 18.8 67.6 81.2 73.6 38.7 89.3 50.2 40.9 11.4 13.7 15.9 57.0 20.4 84.4
ASIAN TIGERSd 32 14.3 27.3 7.7 13.0 59.6 22.8 55.6 2.0 1.6 8.0 42.1 40.3 12.8 57.5 53.0 61.9 -10.1 1.4 -2.0 -3.7 5.8 10.9 45.1 28.7 53.8 15.9 24.3 40.3 35.7 46.4 23.7 2.0 2.0 2.0 59.7 21.7 22.4
BRICSe 182 11.1 9.3 -22.0 6.5 33.4 7.0 21.7 12.9 6.1 21.2 -18.3 18.8 -43.9 -6.6 10.6 6.4 -3.3 -3.7 4.9 3.8 11.8 24.7 31.3 39.8 44.1 44.0 36.3 63.4 58.6 69.8 58.3 26.9 21.9 58.0 82.7 14.2 64.6
OECDf 636 21.5 47.0 22.1 34.3 40.2 32.7 25.8 -1.4 -2.3 -0.2 13.1 12.9 -13.5 44.7 53.5 59.0 -0.4 5.2 -2.4 1.7 7.6 6.1 59.9 18.6 49.8 56.0 34.8 31.7 63.0 37.9 28.5 13.6 8.9 31.1 65.6 45.0 35.1
OPECg 18 -30.1 -40.1 -10.5 -47.0 0.6 -3.0 -9.5 -19.5 -7.6 -21.3 6.8 13.9 50.6 47.6 -8.2 -30.2 25.7 -31.5 -37.8 -61.6 -20.2 35.1 73.8 42.4 49.3 54.6 82.5 57.0 82.5 80.7 50.6 56.2 46.8 19.2 74.5 23.7 72.0
a) Austria, Belgium, Cyprus, Estonia, Finland, France, Germany, Greece, Ireland, Italy, Latvia, Lithuania, Luxembourg, Malta, Netherlands, Portugal, Spain, Slovakia, and Slovenia
b) Canada, France, Germany, Italy, Japan, United Kingdom, and United States
c) Indonesia, Malaysia, Philippines, Thailand, and Vietnam
d) Hong Kong, Singapore, Korea, and Taiwan
e) Brazil, Russian Federation, India, China, and South Africa
f) composition of all current 35 OECD member countries
g) fixed composition of 13 countries as of 01/2017: Venezuela, Ecuador, Iran, Algeria, Saudi Arabia, Libya, United Arab Emirates, Kuwait, Qatar, Iraq, Nigeria, Angola, Gabon
* While aggregating the results to groups of countries, the weights factors are calculated using the gross domestic product based on purchasing-power-parity of each country
a) -100: worst grade, lower, resp. deterioration b) -100: US dollar etc. undervalued c) 0: No
0: no change, about the same, resp. satisfactory 0: US dollar etc. at about proper value +100: Yes
+100: highest grade, higher, resp. improvement +100: US dollar etc. overvalued
Expected
foreign trade
volume by the
end of the next
6 months a)N
um
ber
of q
ues
tio
nn
air
es
Eco
no
mic
Clim
ate
Judgment about
present economic
situation a)
Economic situation
compared to same
time last year a)
Economic situation by
the end of the next 6
months a)
Is the economy currently facing the following problems? c)
Exp
ecte
d t
rad
e b
ala
nce
wit
hin
th
e n
ext
6
mo
nth
s a
)
Exp
ecte
d in
fla
tio
n r
ate
by
the
end
of t
he
nex
t 6
mo
nth
s a
)
Expected
interest rates
by the end of
the next 6
months a)
Judgment of currencies in
relation to this country's
currency b)
Va
lue
of t
he
US
do
lla
r b
y th
e en
d o
f th
e n
ext
6
mo
nth
s a
)
Leve
l of d
om
esti
c sh
are
pri
ces
by
the
end
of t
he
nex
t 6
mo
nth
s a
)

www.ifo.de/w/djTqSeDG