Embed Size (px)
Citation preview

IEEE TRANSACTIONS ON BIOMEDICAL ENGINEERING, VOL. 64, NO. 9, SEPTEMBER 2017 2075
Unobtrusive and Wearable Systems forAutomatic Dietary Monitoring
Temiloluwa Prioleau∗, Elliot Moore II, Senior Member, IEEE,and Maysam Ghovanloo, Senior Member, IEEE
(Review Paper)
Abstract—The threat of obesity, diabetes, anorexia, andbulimia in our society today has motivated extensive re-search on dietary monitoring. Standard self-report meth-ods such as 24-h recall and food frequency questionnairesare expensive, burdensome, and unreliable to handle thegrowing health crisis. Long-term activity monitoring in dailyliving is a promising approach to provide individuals withquantitative feedback that can encourage healthier habits.Although several studies have attempted automating di-etary monitoring using wearable, handheld, smart-object,and environmental systems, it remains an open researchproblem. This paper aims to provide a comprehensive re-view of wearable and hand-held approaches from 2004 to2016. Emphasis is placed on sensor types used, signal anal-ysis and machine learning methods, as well as a benchmarkof state-of-the art work in this field. Key issues, challenges,and gaps are highlighted to motivate future work towarddevelopment of effective, reliable, and robust dietary moni-toring systems.
Index Terms—Body sensor network, dietary monitor-ing, machine learning, obesity, signal processing, wearablesystems.
I. INTRODUCTION
UNHEALTHY dietary habits affect all ages, genders, anddemographics, and is associated with chronic diseases
such as obesity, and mental illnesses such as eating disorders.Obesity alone is a risk factor for diabetes, heart disease, highblood pressure, stroke, and some types of cancer [1]. Mean-while, eating disorders, including anorexia, bulimia, and bingeeating contribute to the highest mortality rate amongst mentalillnesses [2]. In the United States, statistics show that one in threeadults are affected by obesity [1], and up to 24 million peoplesuffer from eating disorders [3]. The ability to monitor dietary
Manuscript received July 10, 2016; revised October 3, 2016; acceptedNovember 12, 2016. Date of publication January 16, 2017; date of currentversion August 18, 2017. This work was supported by NSF GraduateResearch Fellowship and Achievement Rewards for College ScientistsFoundation. Asterisk indicates corresponding author.
∗T. O. Prioleau is with the GT-Bionics Lab, School of Electrical andComputer Engineering, Georgia Institute of Technology, Atlanta, GA30332 USA (e-mail: [email protected]).
M. Ghovanloo is with the GT-Bionics Lab, School of Electrical andComputer Engineering, Georgia Institute of Technology.
E. Moore II is with the Center for Signal and Information Process-ing, School of Electrical and Computer Engineering, Georgia Institute ofTechnology.
Digital Object Identifier 10.1109/TBME.2016.2631246
Fig. 1. Breakdown of dietary monitoring approaches.
behavior in daily living can contribute significantly to improvedmanagement and treatment of these conditions amongst others.
Fig. 1 shows a summary of dietary monitoring approachesin the literature and in practice. Self-report manual approaches,which are the current gold standard for dietary monitoring, areexpensive, burdensome and can be up to 50% inaccurate com-pared to actual food intake [4]. Therefore, several automated,sensor-based methods have been explored in research to providea more accurate and reliable alternative. Automated methods canbe divided into fully-automated and semi-automated, which canbe further divided into: environmental/smart-object, hand-held,and wearable systems. Environmental or smart-object sensingsystems such as weighing tables [5], [6], radio-frequency iden-tification (RFID) equipped devices [7] and surveillance video-recording [8]–[10] provide the option of being fully automated,but constrain the user’ s eating habits and locations. In addition,these methods can be affected by the user-identification prob-lem whereby the system cannot differentiate between users andmay not know what portion of the interactions to assign to eachparticipating user. Hand-held systems, primarily smartphonesand mobile devices, have also been used toward dietary moni-toring [11], [12]. In most cases, these systems allow for semi-automated monitoring because they rely on the user to trigger orinitiate the recording process. On the other hand, wearable (oron-body systems) allow for ubiquitous sensing and do not con-fine the user to fixed locations for proper functionality. For thisreason, wearable systems are the preferred means for activityrecognition in daily living [13]. Wearable activity monitoring
0018-9294 © 2016 IEEE. Personal use is permitted, but republication/redistribution requires IEEE permission.See http://www.ieee.org/publications standards/publications/rights/index.html for more information.

2076 IEEE TRANSACTIONS ON BIOMEDICAL ENGINEERING, VOL. 64, NO. 9, SEPTEMBER 2017
Fig. 2. Measurable parameters for dietary monitoring.
systems should be portable and lightweight, unobtrusive, ro-bust, privacy-preserving, flexible to support new users, energy-efficient, inexpensive, and aesthetically appealing [13], [14].
Fig. 2 outlines several measurable parameters useful for un-derstanding and quantifying food intake, which is indicative ofenergy intake. High-level dietary parameters describe more ofthe eating behavior than meal-specific information. Examples ofthese are: intake period, schedule, duration, and rate. However,low-level dietary parameters describe meal-specific details suchas quantity, meal composition, nutritional value, and caloriecontent. Low-level dietary parameters are deemed harder toobtain because they often rely on details from higher levelparameters. For example, identifying intake moments is a nec-essary first step for a fully automated system aimed at obtainingmeal composition. Studies toward automatic dietary monitoring(ADM) have focused on high-level parameters [15]–[18] whileonly a select few have attempted low-level parameters [19], [20].This paper aims to present a comprehensive review of wearableand hand-held automated systems and approaches for dietarymonitoring. Various sensors such as acoustic [21]–[23], image[16], [24], piezoelectric [25], gyroscope [17], electromyography[26], and electroglottography [27] have been used.
The rest of this paper is organized as follows: Section II detailsdietary sensing methods, modalities, as well as pros and consfor different wearable locations. Section III summarizes signalprocessing and machine learning methods useful for extract-ing relevant information from sensor data. Section IV presentsmethods for performance evaluation and benchmarks state-of-the-art results for sensor-based dietary monitoring. A discussionof the gaps in this research and topics for future considerationare presented in Section V followed by the concluding remarksin Section VI.
II. DIETARY MONITORING SENSING METHODS
Several factors can affect the quality of a recorded signal froman ADM system’s perspective including: sensor type(s) and de-sign, on-body sensing location, recording channels, and record-ing environment. In the previous literature, ADM systems havebeen developed using single- and multi-sensor approaches forsingle- and multi-location on-body utility (see Fig. 1). Single-location systems include one sensor as in [17], [21]–[23] or
TABLE IPROS AND CONS: ADM SENSING LOCATIONS IN PREVIOUS LITERATURE
On-bodyLocations
Pros Cons
In the mouth i) Proximal to oralactivities ii) Directlycaptures mouth motion
i) Least user-friendlylocation ii) Invasive andrequires implant surgeryiii) Risk of swallowingsensor unit if detached
In-ear i) Provides access tohighest chewing soundsii) Familiar location forhearing aids andearphones
i) Sensing instrument canocclude hearing
Near-the-ear/jaw i) Directly capturesjaw-motion for chewsensing
ii) Sensor attachmentsmay require adhesion toskin
Neck/Throat i) Chew and swallowacoustics are accessiblefrom this locationii) Location can bemultipurposed formonitoring otherphysiological events
i) Often requires closesensor contact with user’sneck. This can lead to atight-fitting systemaround the user’s neck
Wrist i) Provides access to HtMgesturesii) Least obtrusivelocationiii) Familiar wearablelocation for watches andphysical activitymonitoring systems
i) Does not capture bodyemitted food intakesounds
multiple sensors as in [28]–[30], while multi-location systemsoften include multiple sensors as in [18], [31], and [32].
Table I presents the pros and cons for various on-body ADMsensing locations. Of all the locations proposed in previouswork, the wrist [17], [33] is the least obtrusive primarily becauseit is a familiar wearable location for watches. On the other hand,a sensor embedded in the mouth, particularly inside-the-teeth asin [34], is invasive, and therefore, the least user-friendly loca-tion. On-body locations such as in-the-ear and on-the-neck arefamiliar wearable locations for headphones/hearing aid systemsand necklaces, respectively. Potential drawbacks of an in-eardevice for continuous monitoring is that it can occlude hearingwhile a neckwear system may be tight and uncomfortable for theuser. For continuous monitoring, below-the-ear/behind-the-jawis not a familiar wearable location and may require sensors tobe adhered to the skin which is not comfortable or sustainablefor daily use.
The most commonly monitored dietary events/items arechews, swallows, meal-images, jaw-motion, and hand-to-mouth(HtM) gestures. These events have been recorded in previousliterature using acoustic-based, image-based, motion-based, andmultimodal sensing methods.
A. Acoustic-Based Methods
Acoustic processing has proven valuable for other health-focused applications such as monitoring stress [37], apnea [38],[39], and cough detection [40]. This established success moti-vates acoustic-based methods for dietary monitoring. Acousticrecordings are contextually rich, and therefore, useful to gaininsight on when food is being consumed as well as the type(primarily texture) of consumed food as in [28], [30], and [23].However, a primary drawback of acoustic sensing for ADM

PRIOLEAU∗ et al.: UNOBTRUSIVE AND WEARABLE SYSTEMS FOR AUTOMATIC DIETARY MONITORING 2077
Fig. 3. Examples of acoustic-based dietary monitoring systems. Sens-ing from the ear are (a) [30] and (b) [28]. Sensing from the throat/neckregion are (c) [31], (d) [35], (e) [23], and (f) [36].
is interference of environmental and background noise. Fig. 3shows some prototypes of acoustic-based ADM systems devel-oped by different research groups and Table II shows a summaryof sensing locations, microphone types, and number of channelsused in the literature.
1) Sensing Locations: Acoustic-based ADM systemshave been positioned primarily in the ear, on the neck, and onthe wrist (see Table II). Pros and cons of each sensing locationis highlighted in Table I. Amft et al. [45] compared the signalintensity of chewing sounds recorded from six microphone po-sitions: inner ear, 2 cm in front of mouth, at cheek, 5 cm infront of ear canal opening, collar/neck, and behind the outer ear.They found that the highest signal intensity for chewing soundswas accessible from the inner ear followed by in front of themouth, and then, the collar/neck position. Of these positions,only the inner ear and collar/neck allow for wearable sensingof dietary behavior. Likewise, Rahman et al. [35] compared therecorded signal power of five activities (eating, drinking, breath-ing, coughing, and speaking) from three microphone positions(jaw, skull, and neck). They found the neck to be the best ofthe three locations for all activities tested except chewing. Thehighest recorded signal during drinking, which is a form of di-etary intake, was obtained from the neck region. Meanwhile,the highest recorded signal for chewing was recorded from the“skull,” which in their paper refers to a position behind the ear-lobe, right around the mastoid bone. The findings from [45]and [35] both support that the highest signal power for chewing(which is representative of solid food intake) can be recordedby capturing sounds propagated through bone conduction to theear and around the mastoid bone. Whereas, the highest signalpower for drinking (which is representative of liquid intake) canbe recorded by capturing swallowing sounds from the throat re-gion. It is important to note that the maximum power for vocaland other nonvocal (breathing and coughing) activities was alsorecorded from the throat region [35]. Therefore, this sensinglocation may be appropriate for a wearable multimodal healthmonitoring system useful for dietary, pulmonary, and maybeeven cardiac monitoring.
2) Microphone Types: Common microphone typesused in acoustic-based ADM systems are: condenser andpiezoelectric microphones. In [31], Sazonov et al. comparedthe sound quality of four commercially available microphones:
1) piezoelectric bone-conduction (EM-L from Temco Inc.);2) piezoelectric noise canceling (N4530 from Challenge
Electronics);
3) a modified throat microphone (XTM70V from iXradio);and
4) throat microphone (iASUS NT from iASUS ConceptsLtd.).
The microphone tests included subjective listening, objectivevisualization, and signal-to-noise ratio (SNR) computation ofrecordings for several consecutive swallows. It was not reportedwhether the test swallows were spontaneous, liquid-intake, orsolid-intake swallows. The authors concluded that throat micro-phones showed less sensitivity to ambient noise.
In [35], Rahman et al. compared seven microphone designconfigurations including brass and film piezoelectric sensor-based designs with latex and silicone diaphragm materials, acondenser microphone with plastic diaphragm, and two off-the-shelf bone conduction microphones. Each microphone designwas evaluated with respect to sensitivity in 20 Hz–16 kHz fre-quency range and susceptibility to external (white, babble, traf-fic, and conversational) noise. They found that for a contactthroat microphone, the piezoelectric design was less suscepti-ble to external noise than the condenser and bone-conductiondesigns. Additionally, of two piezoelectric designs, the micro-phone with latex diaphragm was slightly better to minimizeexternal noise but the microphone with silicone diaphragm wasnotably better for transferring in-body vibrations below 2 kHz.Therefore, the overall microphone comparison experiment re-sults in [35] suggest a piezoelectric-based microphone with sili-cone diaphragm to be optimum for recording tracheally accessi-ble, nonspeech body sounds (including dietary sounds). Resultsfrom [31] and [35] do not show consistent results that supportuse of a specific microphone type for optimum acoustic signalquality in ADM systems.
3) Recording Channels: Most acoustic ADM systemsin the literature use single-channel recording [21]–[23], [35],[36], [41]. A few papers suggest and implement multichannelrecording for the purpose of noise reduction [28], [30], [46].Noise handling is an important step for a robust acoustic-basedADM system capable of good functionality in various recordingenvironments. Effective hardware design can be used to min-imize external noise interference prior to the signal reachingthe microphone as seen in [35]. Yet, noise reduction or targetenhancement remains a necessary preprocessing step for the ac-quired signal which is still likely to contain some backgroundnoise. Liutkus et al. [47] proposed a single-channel target en-hancement approach that learns spectral patterns of food intakeacoustics from a clean signal and uses learned patterns to isolatethe signal of interest from a noisy/mixed signal.
Unlike the single-channel approach in [47] which may affordlower power consumption, Paßler et al. presented a two micro-phone channel ADM system in [28]. The system includes anin-ear microphone primarily for recording sounds emitted fromthe skull bone (chewing sounds) and a reference microphoneplaced behind the ear primarily for recording environmentalsounds. Using these two synchronous microphone channels, aratio of the sum of absolute signal amplitude from the in-earsignal and the reference signal was computed in consecutiveframes and compared to an adaptive threshold for food intakedetection. This method was used to distinguish between soundsgenerated inside the user’s body versus environmental sounds.However, it is not clear from this paper, how effective theirproposed method is for detecting food intake activity in a noisysignal. The data collection systems implemented in [31] and

2078 IEEE TRANSACTIONS ON BIOMEDICAL ENGINEERING, VOL. 64, NO. 9, SEPTEMBER 2017
TABLE IISUMMARY OF ACOUSTIC-BASED ADM SYSTEMS IN PREVIOUS LITERATURE
Ref. Food Intake Event ofInterest
Sensing Location Microphone Type Acoustic Channels Microphone Model
Nishimura and Kuroda,2008 [41]
Chews Ear unknown 1 unknown
Amft, 2010 [21] Chews Ear Electret, omnidirectional 1 Knowles FG23329Shuzo et al., 2010 [30] Chews Ear i) Bone conduction 2 i) Vibraudio EM20,
Temcoii) Condenser ii) WM-E13U, Panasonic
Paßler et al., 2012 [28] Chews Ear Electret, omnidirectional 2 Knowles FG23329-CO5Liu et al., 2012 [29] Chews, swallows Ear unknown 1 Sony ECM TL3Sazonov et al., 2008 [31] Swallows Ear, throat unknown 3 iASUS NT3, iXradio
XEM98DYatani and Truong, 2012[36]
Chews, swallows Throat Condenser, unidirectional 1 Custom-made
Rahman et al., 2014 [35] Chews, swallows Throat Piezoelectric,unidirectional
1 Custom-made
Olubanjo and Ghovanloo,2014 [42]
Swallows Throat unknown 1 iASUS NT3
Kandori et al., 2012 [43] Swallows Throat Piezoelectric 1 unknownWalker and Bhatia, 2014[22]
Swallows Throat unknown 1 iASUS NT3
Olubanjo and Ghovanloo,2014 [44]
Swallows Throat unknown 1 iASUS NT3
Bi et al., 2015 [23] Chews, swallows Throat unknown 1 unknownThomaz et al., 2015 [33] Ambient sounds Wrist Smartphone microphone 1 unknown
[48] use multichannel acoustic recordings and highlight theimportance of using one microphone primarily for recordingambient noise but none of these papers presented a sourceseparation method capable of food intake detection in a noisesaturated signal (SNR < 1 dB) as shown in [47].
There is often a tradeoff between the number of recordingchannels, form factor, and power consumption. More recordingchannels can increase the power consumption and form factorof a wearable ADM system which is generally undesirable.Meanwhile, more recording channels provide additional sourcesfrom which the signal can be analyzed.
B. Image-Based Methods
Fig. 4 shows prototypes of image-based dietary monitoringsystems. These systems rely on visual cues to supplementtraditional self-report methods or to achieve fully automatedmonitoring using a single-sensor or multimodal approach.In previous research, two primary platforms are used forimage-based dietary sensing: 1) hand-held devices such aspersonal digital assistants (PDA), smartphones or tablets [12],[49], [50], 2) on-body wearable systems that include a camera[29], [32]. ADM systems on smartphone platforms can benefitfrom various in-built sensors and capabilities such as camera,global positioning system, inertial tracking, high-speed pro-cessing, and wireless connectivity. However, there is a potentialdrawback of inconsistent image quality from different smart-phones/mobile devices for image-based methods. Sharp andAllman-Farinelli [51] highlight four dietary recording methodsthat use mobile phone platforms, namely: electronic food diary,food photograph-assisted self-administered 24-h recall, foodphotograph analysis by a trained dietitian and automated foodphotograph analysis. Considering the scope of this paper, wefocus only on systems that implement food photograph analysisby a trained dietitian and automated food photograph analysis.
Fig. 4. Examples of image-based dietary monitoring systems. Sensingwith mobile devices are (a) [52], (b) [50], (c) [53]. Sensing with a wearablecamera is (d) [54].
In [55], Gemming et al. categorize dietary image-based sys-tems as either active or passive. In the active sensing case, auser is required to initiate the meal-image recording process by,for example, taking a picture of the food per a specified proto-col. Three common requirements were observed from previousliterature as part of the protocol for meal-image capture in ac-tive sensing methods. First, meal images should be capturedat a specified angle, most commonly 45◦ as in [50] and [56].Second, for quantifying of food intake, images of food selec-tion before eating and leftovers after eating are necessary as in[57]. Third, a visual reference object such as a PDA stylus [50],reference ruler [56], or printed pattern [53], [58] is required tobe included in meal-image pictures to facilitate estimation ofparameters such as size, area, and color. The system in [32] was

PRIOLEAU∗ et al.: UNOBTRUSIVE AND WEARABLE SYSTEMS FOR AUTOMATIC DIETARY MONITORING 2079
Fig. 5. Examples of motion-based dietary monitoring systems. Sensingteeth-motion is (a) [34], throat-motion is (b) [25], jaw-motion is (c) [60],and wrist-motion is (d) [61].
capable of projecting a light pattern on the meal plate for use asa dimensional referent to calculate food portion size.
In the passive sensing case, a camera can be embedded ina wearable system or positioned to capture images (or videos)from a fixed location in an environment of interest such as a din-ing room. In these cases, the camera is automatically activatedon a fixed time basis such as in [54] or by detection of other activ-ities like chewing as in [29]. Although passive sensing systemsdo not have the added burden of requiring users to capture mealimages, these systems have a higher probability of automaticallycapturing images or videos of other things/people in the sceneand can therefore violate privacy. In [54], first-person imageswere captured every 30 s from a phone camera worn around theneck like a pendant. Due to the fixed timing for automatic imagecapture, such a system will require large memory capacity andhigh power consumption. In addition, due to possible privacyconcerns of image-based passive sensing methods, the study in[54] allowed an intermediary step for users to review the entireimage set and delete compromising or private images they didnot want to share. In [32], identification of eating episodes fromambient sound data was used to segment meal times in continu-ous video recording. Then, the video dataset was automaticallyscanned to identify and blur-out human faces captured duringrecording. Such privacy measures are particularly necessary forpassive image-based methods.
C. Motion-Based Methods
In this paper, we define motion-based ADM systems asdevices that use a sensor to record and monitor a body-motion re-lated to dietary intake. Fig. 5 shows some prototypes of motion-based dietary monitoring systems. Whereas, Table III providesa summary of sensor types, location, and events of interest fromprevious work on motion-based ADM systems. Sensor typesused include accelerometers for sensing teeth-motion [34] andwrist-motion [17], gyroscopes for sensing wrist-motion [61],and piezoelectric sensors for monitoring jaw-motion [18], [60].
1) Sensing Location: Motion-based ADM systems havebeen used on different body locations including, inside themouth, below the ear, on the wrist, and neck. Based onthese locations, different body-motions are sensed to inferfood intake. To the author’s knowledge, no work has explored thebest/optimum location for motion-based ADM systems. Unlike
on-body sensing methods, Li et al. [34] proposed embedding atri-axial accelerometer in the mouth, specifically in the teeth, totake advantage of this location’s close/direct proximity to oralactivities. An obvious drawback of a sensor embedded insidethe teeth is that it is invasive, can be affected by saliva in themouth, and presents a risk of the user swallowing the sensor unitif it becomes detached during use. In [64] and [65], the authorsuse three proximity sensors (side, bottom, and inner) in the earto detect ear canal deformation during chewing. Other studiespresent motion-based on-body ADM systems that use a piezo-electric sensor attached below the ear (behind the mandible) tosense jaw-motion for monitoring chewing [18], [31], [60] andinfant sucking [63]. An advantage of the below-ear sensing lo-cation is that it provides direct access to the lower jaw, which isinvolved in sucking and chewing. On the other hand, a drawbackis that the piezoelectric sensor in [18], [31], [60], and [63] isadhered to the skin which may not be comfortable, can causeskin-irritation, and may lose adhesive strength.
In [62] and [25], Kalatanrian et al. also used a piezoelec-tric sensor but they proposed placement against the throat tosense muscular contraction that occurs with swallow events.A potential drawback of this sensing method and location isthat extraneous motion artifacts associated with normal headand body movements can drown out the low-energy swallowsignal. Also, men have more prominent hyoid and laryngeal el-evation during swallowing than women [66], this may lead to alower quality signal recorded for female users and a potentiallygender-biased performance. Additionally, overweight/obese in-dividuals have more neck adipose which may decrease the qual-ity of recorded signal from a surface motion sensor. This in turnmay lead to poorer performance for this population. Anotheron-body motion-based ADM approach positions accelerome-ters and/or gyroscopes on the wrist to sense a unique linear androtational motion associated with biting or transferring food intothe mouth with the hand [17], [61]. A benefit of the wrist as asensing location is that it is unobtrusive because it is a familiarwearable location for watches and physical activity monitoringsystems. On the other hand, the wrist does not provide access tocapture equally useful body generated food intake sounds.
D. Other ADM Methods
Table IV presents a summary of other noninvasive and un-obtrusive dietary sensing methods. Some of these systems arenot wearables such as the diet-aware dining table [6] and smart-cup [67] while others use embedded sensors in wearable sys-tems such as the magnetic coil [43], piezoelectric respiratorybelt [68], electroglottograph device [27], and proximity sen-sors [64], [65]. In [6], Chang et al. augmented a dining tablewith weighing and RFID sensors to monitor food movementpath between tabletop containers and individuals. This sens-ing approach divides the tabletop into multiple cells/units withunique weighing sensors and assumed that each RFID taggedfood item is correctly placed in a unique tabletop cell. A similarwork that augments objects in a user’s environment for dietarymonitoring is presented in [67]. Lester et al. [67] focus on sens-ing and classifying liquid in a smart-cup using optical spectrom-etry and pH/conductivity probes. In their optical setup, liquidin a container is illuminated with a controlled light source andparts of the light spectrum are absorbed based on chemical com-position of the liquid.

2080 IEEE TRANSACTIONS ON BIOMEDICAL ENGINEERING, VOL. 64, NO. 9, SEPTEMBER 2017
TABLE IIISUMMARY OF MOTION-BASED ADM SENSING METHODS IN PREVIOUS LITERATURE
Ref. Body-motion Food Intake Event Sensor Type Sensing Location Sensor ModelSensed of Interest
Amft and Troster, 2008 [59] i) Throat-motion i) Swallows i) Electromyogram i) Neck i) Nexus-10, MindMediaii) Hand-motion ii) HtM ii) Accelerometer,
gyroscope, compassii) Arm and wrist ii) MTi, XSens
Sazonov et al., 2008, 2012 [31],[60]
Jaw-motion Chews Piezoelectric film sensor Below outer ear unknown
Dong et al., 2012 [61] Wrist-motion Hand gesture MEMs gyroscope Wrist LPR530al,STMicroelectronics
Li et al., 2013 [34] Teeth-motion Chews, Drinking Tri-axial accelerometer Embedded-in-teeth unknownDong et al., 2014 [17] Wrist-motion Hand gesture Accelerometer, gyroscope Wrist iPhone 4Fontana et al., 2014 [18] i) Jaw-motion i) Chews i) Piezoelectric sensor i) Below outer ear i) LDT0-028K
ii) Wrist-motion ii) HtM ii) RF transmitter ii) Wrist ii) unknownKalantarian et al., 2014, 2015[25], [62]
Throat-motion Swallows Piezoelectric sensor Neck LDT0-028K
Farooq et al., 2015 [63] Jaw-motion Sucking (breast- Piezoelectric film sensor Below the ear DT2-028K, Measurementand bottle-feeding) Specialties Inc.
Bedri et al., 2015 [64], [65] Ear canaldeformation
Chews Proximity sensor Outer ear unknown
TABLE IVSUMMARY OF OTHER UNOBTRUSIVE ADM SYSTEMS IN PREVIOUS LITERATURE
Ref. Event of Interest Food Intake Event Sensor Type Wearable Location Sensor Model
Chang et al., 2006 [6] Meal weight and n/a Weighing andRFID-embedded
n/a Custom-made
container RFID tag dining tableLester et al., 2010 [67] Liquid intake n/a Smart-cup (optical
spectrometern/a Custom-made
and pH/conductivitysensor)
Kandori et al., 2012 [43] Thyroid movement Swallow Magnetic and acousticsensor
Neck/throat Custom-made
Dong and Biswass, 2014[68]
Apnea Swallow Piezoelectric respiratorybelt
Chest unknown
Farooq et al., 2014 [27] Laryngeal elevation Swallow Electroglottograph sensor Neck EGG-D200,Laryngograph Ltd.
Unlike the smart-object/environmental approaches presentedin [6] and [67], Farooq et al. [27] measure laryngeal elevationfor swallowing detection using a neckworn electroglottographdevice. Dong and Biswass [68] base their proposed system onthe observation that during swallowing there exists a short ap-nea which interrupts continuous breathing. The proposed systemuses a piezoelectric respiratory chest belt for swallowing detec-tion. Toward dietary monitoring, it is not known whether/howthe proposed systems in [27] and [68] can differentiate betweenspontaneous swallows and food or liquid intake swallows.
E. Multimodal ADM Methods
Although single-sensor prototypes have been built and usedtoward dietary monitoring, another approach taken by a fewresearch groups is to combine different sensor types into amultimodal system. A multisensor approach should combinesensors in a way that it can benefit from the strength of eachunique sensor included in the system. Prototypes have beenbuilt in a single-unit wearable system such as [29], [32], [43]or multiunit wearable systems such as [27], [69]. Fig. 6 showssome examples of multimodal dietary monitoring systems fromthe literature. From a usability and acceptability perspective, a
Fig. 6. Example of multimodal dietary monitoring systems. Sensingwith image + acoustic sensors is (a) - [32] and (c) - [29], with a magnetic+ acoustic sensors is (b) - [43], and with a piezoelectric + RF transmitter+ accelerometer is (d) - [18].
single-unit (single-location) wearable system is preferred overa multiunit (multilocation) wearable system.
Examples of single-unit multimodal ADM systems arepresented in [29], [32], and [43]. In [29] and [32], an image-sensor/camera with an in-ear microphone is combined. The
PRIOLEAU∗ et al.: UNOBTRUSIVE AND WEARABLE SYSTEMS FOR AUTOMATIC DIETARY MONITORING 2081
al
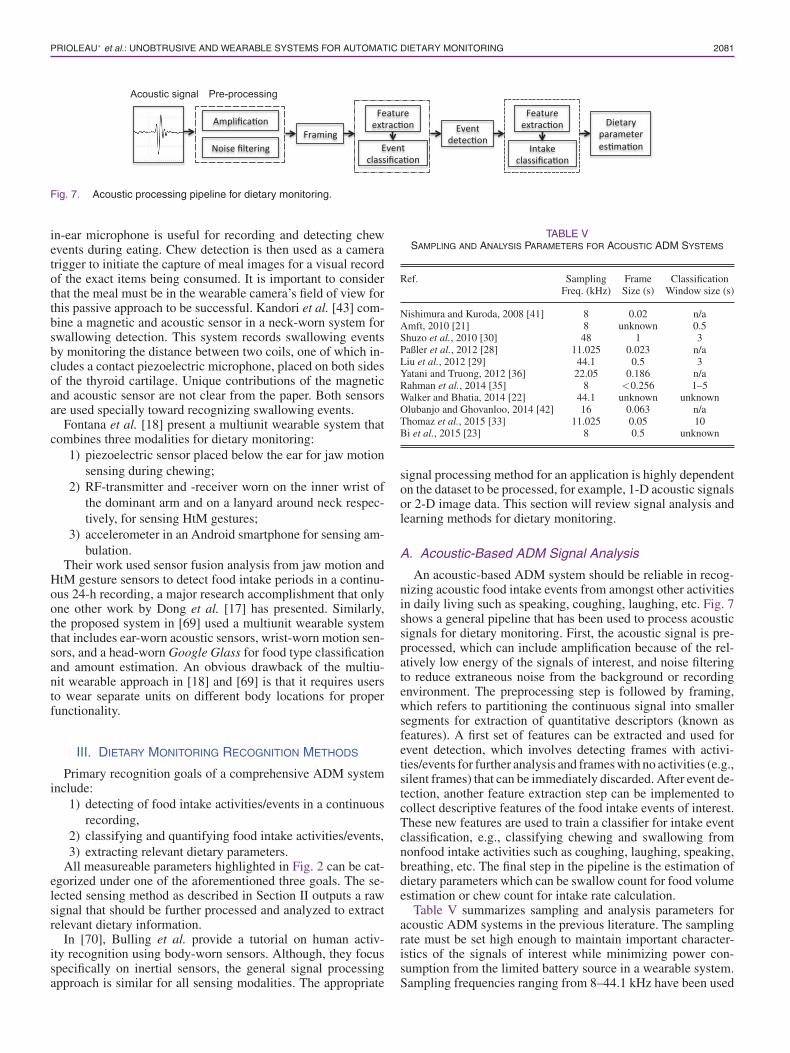
Fig. 7. Acoustic processing pipeline for dietary monitoring.
in-ear microphone is useful for recording and detecting chewevents during eating. Chew detection is then used as a cameratrigger to initiate the capture of meal images for a visual recordof the exact items being consumed. It is important to considerthat the meal must be in the wearable camera’s field of view forthis passive approach to be successful. Kandori et al. [43] com-bine a magnetic and acoustic sensor in a neck-worn system forswallowing detection. This system records swallowing eventsby monitoring the distance between two coils, one of which in-cludes a contact piezoelectric microphone, placed on both sidesof the thyroid cartilage. Unique contributions of the magneticand acoustic sensor are not clear from the paper. Both sensorsare used specially toward recognizing swallowing events.
Fontana et al. [18] present a multiunit wearable system thatcombines three modalities for dietary monitoring:
1) piezoelectric sensor placed below the ear for jaw motionsensing during chewing;
2) RF-transmitter and -receiver worn on the inner wrist ofthe dominant arm and on a lanyard around neck respec-tively, for sensing HtM gestures;
3) accelerometer in an Android smartphone for sensing am-bulation.
Their work used sensor fusion analysis from jaw motion andHtM gesture sensors to detect food intake periods in a continu-ous 24-h recording, a major research accomplishment that onlyone other work by Dong et al. [17] has presented. Similarly,the proposed system in [69] used a multiunit wearable systemthat includes ear-worn acoustic sensors, wrist-worn motion sen-sors, and a head-worn Google Glass for food type classificationand amount estimation. An obvious drawback of the multiu-nit wearable approach in [18] and [69] is that it requires usersto wear separate units on different body locations for properfunctionality.
III. DIETARY MONITORING RECOGNITION METHODS
Primary recognition goals of a comprehensive ADM systeminclude:
1) detecting of food intake activities/events in a continuousrecording,
2) classifying and quantifying food intake activities/events,3) extracting relevant dietary parameters.
All measureable parameters highlighted in Fig. 2 can be cat-egorized under one of the aforementioned three goals. The se-lected sensing method as described in Section II outputs a rawsignal that should be further processed and analyzed to extractrelevant dietary information.
In [70], Bulling et al. provide a tutorial on human activ-ity recognition using body-worn sensors. Although, they focusspecifically on inertial sensors, the general signal processingapproach is similar for all sensing modalities. The appropriate
TABLE VSAMPLING AND ANALYSIS PARAMETERS FOR ACOUSTIC ADM SYSTEMS
Ref. Sampling Frame ClassificationFreq. (kHz) Size (s) Window size (s)
Nishimura and Kuroda, 2008 [41] 8 0.02 n/aAmft, 2010 [21] 8 unknown 0.5Shuzo et al., 2010 [30] 48 1 3Paßler et al., 2012 [28] 11.025 0.023 n/aLiu et al., 2012 [29] 44.1 0.5 3Yatani and Truong, 2012 [36] 22.05 0.186 n/aRahman et al., 2014 [35] 8 <0.256 1–5Walker and Bhatia, 2014 [22] 44.1 unknown unknownOlubanjo and Ghovanloo, 2014 [42] 16 0.063 n/aThomaz et al., 2015 [33] 11.025 0.05 10Bi et al., 2015 [23] 8 0.5 unknown
signal processing method for an application is highly dependenton the dataset to be processed, for example, 1-D acoustic signalsor 2-D image data. This section will review signal analysis andlearning methods for dietary monitoring.
A. Acoustic-Based ADM Signal Analysis
An acoustic-based ADM system should be reliable in recog-nizing acoustic food intake events from amongst other activitiesin daily living such as speaking, coughing, laughing, etc. Fig. 7shows a general pipeline that has been used to process acousticsignals for dietary monitoring. First, the acoustic signal is pre-processed, which can include amplification because of the rel-atively low energy of the signals of interest, and noise filteringto reduce extraneous noise from the background or recordingenvironment. The preprocessing step is followed by framing,which refers to partitioning the continuous signal into smallersegments for extraction of quantitative descriptors (known asfeatures). A first set of features can be extracted and used forevent detection, which involves detecting frames with activi-ties/events for further analysis and frames with no activities (e.g.,silent frames) that can be immediately discarded. After event de-tection, another feature extraction step can be implemented tocollect descriptive features of the food intake events of interest.These new features are used to train a classifier for intake eventclassification, e.g., classifying chewing and swallowing fromnonfood intake activities such as coughing, laughing, speaking,breathing, etc. The final step in the pipeline is the estimation ofdietary parameters which can be swallow count for food volumeestimation or chew count for intake rate calculation.
Table V summarizes sampling and analysis parameters foracoustic ADM systems in the previous literature. The samplingrate must be set high enough to maintain important character-istics of the signals of interest while minimizing power con-sumption from the limited battery source in a wearable system.Sampling frequencies ranging from 8–44.1 kHz have been used

2082 IEEE TRANSACTIONS ON BIOMEDICAL ENGINEERING, VOL. 64, NO. 9, SEPTEMBER 2017
in previous work. Paßler et al. [28] successfully used acousticsignals recorded at a sampling frequency of 11.025 kHz fromthe ear to classify eight food types from chewing sounds, whileOlubanjo and Ghovanloo [42] showed that 16 kHz is a sufficientsampling rate to discriminate nonfood intake events (coughing,clearing throat, and speaking) from food intake events (chewingand swallowing). Rahman et al. [35] used acoustic signals sam-pled at 8 kHz for discriminating food intake from nonfood intakeactivities. Meanwhile, Amft [21] and Bi et al. [23] classified var-ious food types based on the chewing sounds also sampled at8 kHz. These studies suggest that an acoustic sampling rate of8 kHz could be sufficient and >8 kHz is not an effective useof power from a limited battery source for a wearable ADMsystem.
Chews and swallows are relatively low energy signals, there-fore a preprocessing step that includes amplification can be ben-eficial as in [15], [23], and [31]. As discussed in Sections II-A1and II-A2, it is important to note that the amplitude of foodintake signals recorded with a wearable system depends on thesensing location chosen and the microphone type used. Anotherpreprocessing step necessary for realistic ADM systems is noisefiltering, as in [23], [28], and [41]. Although acoustic recordingsystems can and should be uniquely designed to minimize envi-ronmental noise interference, as in [35], dietary monitoring ina loud restaurant environment, for example, would still includeinterfering background noise. In [41], Nishimura and Kurodause a fourth-order Butterworth filter with a cutoff frequency of2 Hz applied to the log energy signal for filtering. Paßler et al.[28] employed a method similar to spectral subtraction for noisehandling using concurrently recorded signals from a referencemicrophone and an in-ear microphone. Liutkus et al. [47] useda semisupervised non-negative matrix factorization to separateclean chewing sound from real-life restaurant background noisemixed at varying SNRs in the range of [−20, 10] dB. Resultsin [47] show up to 20 dB improvement in separation quality invery low SNR conditions of [−20, 5] dB and ∼60% increasein chew event detection when comparing the performance onthe estimated clean signal versus the raw noisy signal. Alter-natively, Olubanjo et al. [71] did not focus on extracting thetarget (clean) signal but on detecting chew events in the noisysignal using template-matching and sliding window correlation.Results in [71] show detection performance with an F1 scoreof 71.4% in very low SNR ratio signals of −10 dB comparedto the 19.2% when using the maximum sound energy algorithmproposed in [48].
Another important step for ADM signal analysis is framingwhich refers to selection of an appropriate window size forfeature extraction. The size of this feature extraction windowdepends on the activity of interest for recognition or classifica-tion. Unlike in speech recognition where 25 ms is the standardframe size, no standard frame size has been widely acceptedfor acoustic detection of food intake events. Table V shows thatvarious frame lengths have been used in the previous literatureranging from 16 ms to 1 s. Based on the average duration ofchew, ∼0.3 s [41], [59], and average duration of swallow, ∼0.5s [72], [73], a frame size of > 0.3 s is not ideal because it maynot describe the events of interest with small enough granularity.It is common to implement overlapping windows/frames (e.g.,50% overlap) to minimize edge effect.
Descriptive features in time, frequency, cepstral, and otherdomains can then be extracted for each frame. Table VI shows
TABLE VISUMMARY: FEATURES EXTRACTED FOR ACOUSTIC ADM SYSTEMS
Type Method
Time domain Peak value*, mean, variance, standard deviation,zero-crossing rate*, energy (short-time*, entropy*, log,gap between local neighbored maximas), total variation,envelop shape statistics, skewness, kurtosis, interquartilerange [23], [29], [30], [33], [35], [36], [41], [42]
Frequency domain Maximum peak frequency, power (maximum*, mean*),ratio of band power to total power, sub-band power*,spectral centroid, spectral flux*, spectral variance,spectral skewness, spectral kurtosis, spectral slope,spectral roll-off, spectral auto-correlation, spectralautocovariance, barycentric frequency [22], [23], [29],[30], [33], [35], [36], [42]
Other Mel-frequency cepstral coefficients, autoregressioncoefficients, linear predictive coefficients, waveletdecomposition (delta coefficients), slope of detrendedfluctuation analysis, approximate entropy, fractaldimension, hurst exponent, correlation dimension[21]–[23], [33], [35], [36], [41], [42]
TABLE VIISUMMARY: CLASSIFICATION METHODS FOR ACOUSTIC ADM SYSTEMS
Classification/ Threshold-based [41], Naıve Bayes [21], NearestLearning Methods Neighbor [30], [42], Hidden-Markov Model [28],
Neural Networks [29], SVM [22], [36], LinearDiscriminant Analysis [22], [35], Random Forest [33],Decision Tree [23]
a summary of feature extraction methods from previous workfor acoustic-based ADM systems. According to [23], [29], and[35], particularly relevant features for acoustic recognition andclassification in dietary monitoring systems (marked with an * inTable VI) are time-domain features: peak-value, zero-crossingrate, short-time energy, and energy entropy, and frequency do-main features: maximum and mean power, sub-band power,and spectral flux. After feature extraction, statistical descriptors(e.g., mean, maximum) can be used to further describe featurevectors in defined classification windows. Table V also showsvarying classification window sizes used in previous literaturerange from 1 to 10 s. A feature selection step can be imple-mented to discover relevant and nonredundant features from theentire feature set. Paßler et al. [28] used a principal compo-nent analysis (PCA) and Rahman et al. [35] used a correlationfeature selection algorithm and the sequential forward featureselection algorithm. Meanwhile, Liu et al. [29] compared theperformance of three feature selection algorithms namely Relief,Simba [74], and maximum relevance and minimum redundancycriterion [75].
Training and testing of a robust classification model is the fi-nal step for activity recognition. Table VII shows a summary ofclassification methods for acoustic ADM systems. More com-mon classifiers include nearest neighbor, support vector machine(SVM) and linear discriminant analysis. In [42], Olubanjo andGhovanloo compared the performance of k-nearest neighbor (K-NN) classifiers with Naıve Bayes and found 1-NN and 3-NNto perform better for tracheal activity classification. Whereas,in [36], Yatani and Truong compared the performance of Naıve

PRIOLEAU∗ et al.: UNOBTRUSIVE AND WEARABLE SYSTEMS FOR AUTOMATIC DIETARY MONITORING 2083
Fig. 8. Image processing pipeline for dietary monitoring.
Bayes, 5-NN, and SVM classifiers and found SVM to be thepreferred classifier also for tracheal activity classification. Thisis not surprising because SVM classifiers have shown to be ro-bust and highly generalizable for a wide variety of datasets [76].Dietary parameters inferred from acoustic-based ADM systemsinclude detection of intake moments in daily recording [33],solid versus liquid intake classification [22], [29], [77], foodtype classification [21], [23], [28], chew count [30], [41], [48],and meal composition [20].
B. Image-Based ADM Signal Analysis
Fig. 8 shows a general signal analysis pipeline for image-based ADM systems. As mentioned in Section II-B, image ac-quisition is often achieved by passive or active sensing, usinga wearable or hand-held device, respectively. For passive sens-ing, images are automatically captured on a fixed time basisduring the day or with a wearable camera triggered by detec-tion of other activities such as chewing. In this case, all imagescaptured are not relevant to food intake. Therefore, a meal im-age identification step is needed. The goal of this is to identifyspecific images that include the meal of interest. Thomaz et al.[54] implemented a coding step using Amazon’s MechanicalTurk to recognize eating moments from first-person point-of-view images. Liu et al. [29] implemented a plate search al-gorithm according to [78] for the meal image identification ina video sequence. Following selection of images that containfoods/meals of interest, an image segmentation step is impera-tive to identify specific food regions and segment food items ona plate. In [58], Zhu et al. implemented connected componentanalysis, active contours, and normalized cuts to achieve imagesegmentation.
The next important step is feature extraction from image re-gions of interest. Table VIII shows a summary of image-basedADM features from previous work (most relevant features aremarked with an *). Studies in [79]–[81] support the relevanceand effectiveness of bag-of-features (BoF) for image-based foodclassification. A BoF method, similar to bag-of-words used intextual information retrieval, is based on orderless collectionsof quantized local image descriptors independent of spatial in-formation [82]. Primary steps necessary for BoF implemen-tation are: key point extraction, local feature extraction, visualdictionary learning, and descriptor quantization. In [82], O’Haraand Draper point out that determining the best techniques forsampling images and local image features are amongst keychallenges for successfully implementing a BoF model. An-thimopoulos et al. [79] identified dense sampling as the best
TABLE VIIISUMMARY: FEATURES EXTRACTED FOR IMAGE-BASED ADM SYSTEMS
Feature ExtractionMethod
Descriptors
BOF [79]–[81] SIFT (hsvSIFT*, rgSIFT, rgbSIFT, hueSIFT,opponentSIFT*, cSIFT)
Histogram [12], [79],[80], [83]
Opponent color histogram, hue histogram, gradienthistogram, RGB color histogram*
Pairwise features [84] Distance, orientation, midpoint category,between-pair-category, distance-orientation,orientation-midpoint*
Neural networks [85] L2 normalized deep convolutional neural networks(DCNN) layer 7*
Others Bag-of-SURF* [12], color moments [79], [83], colormoment invariants [79], [83], gabor texture features[58], [81], CIELAB [58], RootHoG [85], mean andvariance of RGB pixels [85]
method for key point extraction, while Hoashi et al. [80] iden-tified random sampling for key point extraction. Studies [79],[80], [83] support the use of scale invariant feature transform(SIFT) as visual descriptors, more specifically hsvSIFT and op-ponent SIFT were shown to be highly relevant. Other highly rel-evant features from previous work for food image classificationare pairwise features—particularly the joint pair of orientation-midpoint [84], RGB color histogram and speeded up robustfeatures (SURF) [12] as well as the L2 normalized deep convo-lutional neural network layer 7 outputs [85].
After feature extraction, final steps for image-based ADMsystems are food classification and meal parameter estimation.In [83], Bettadapura et al. showed the benefit of leveragingcontext to support automated food recognition, such as usinglocation through geo-tags to narrow down the categories for im-proved food classification. All image-based ADM papers sur-veyed in this paper used a variation of SVM classifiers (e.g.,linear kernel SVM, multiple kernel SVM) in their studies. Di-etary parameters inferred from image-based ADM systems in-clude detecting intake moments during daily recording [54],food type classification [12], [58], [79], [80], [83], [84], esti-mating food portion size [58], and some nascent attempts atestimating calorie contents [10], [19].
C. Motion-Based ADM Signal Analysis
Fig. 9 shows the general pipeline for signal analysis frommotion-based ADM systems. Different motion sensors havebeen used in the previous literature including:

2084 IEEE TRANSACTIONS ON BIOMEDICAL ENGINEERING, VOL. 64, NO. 9, SEPTEMBER 2017
Fig. 9. Motion-sensor processing pipeline for dietary monitoring.
1) Accelerometer: sensing teeth-motion [34], HtM gesture[59], wrist-motion [17], and body-motion [18];
2) Gyroscope: sensing wrist-motion and -rotation [17], [59];3) RF transmitter and receiver: sensing HtM gesture [18];4) Piezoelectric sensor: sensing jaw-motion [18], [60], [63],
throat-motion [25], [62], and chest-motion [68].Based on the sensor type and sensing objectivity, different
sampling frequencies, frame sizes, and features have been usedas can be seen in Table IX. The more common sampling ratefor accelerometers in previous work is 100 Hz [18], [34], [59]while a few studies have used lower sampling rates of 15 [17]and 20 Hz [25]. Sampling rates for 15 [17] and 100 Hz [59] havebeen used for gyroscopes, while sampling rates for piezoelectricsensors range from 20 to 1000 Hz [18], [25], [60], [63], [68].
Following raw data collection from the respective motionsensor, denoising is a necessary step to remove signal varia-tions from pertubations/spikes due to short vigorous motionsor noise on the power lines. In [17], accelerometer and gy-roscope data for detecting HtM gesture was smoothed usinga Gaussian-weighted window while in [25], piezoelectric datafor detecting swallowing from the throat region was smoothedusing a sliding-window average of the original data. In [60],Sazonov and Fontana filtered the piezoelectric signal for de-tecting jaw-motion from chewing using a bandpass filter withcutoff frequencies of 1.25 and 2.5 Hz. This frequency band wasset based on earlier studies that determined chewing frequencyto be in the range of 0.7–2 Hz [86]. On the other hand, Farooqet al. [63] used a biorthogonal wavelet transform with four van-ishing moments to denoise piezoelectric data used for detectingjaw-motion from sucking actions of babies feeding. After the de-noising step, a similar framing step is necessary as described inSection III-A. The appropriate frame size highly depends on thelength of activity of interest. Table IX highlights different framesizes that have been used for motion-based ADM systems rang-ing from 0.45–60 s. In [25], Kalantarian et al. were interestedin detecting swallow events which have an average duration of∼0.5 s [72], [73] and they used a sliding window length of 0.45 swith maximum overlap. Whereas in [18], Fontana et al. wereinterested in detecting eating moments during a 24-h period andused a frame size of 30 s.
A wide range of features have also been extracted from thedifferent sensors used for motion-based ADM systems. Detailson feature extraction methods used is summarized in Table IX.Statistical features are most common such as mean, maximum,minimum, standard deviation, mean absolute value, root meansquare, zero crossing rate, and entropy [18], [25], [34], [60].Feature selection is an optional yet recommended next step tominimize redundant features; forward selection procedure [87]was used in [60] while PCA [88] was used in [34].
The final step before dietary parameter estimation is intakeclassification. Similar classifiers used in acoustic-based ADMsystems (see Table VII) are applicable and have been usedwith motion-based ADM systems including SVM, decisiontree, Naıve Bayes, and artificial neural networks. In [34], Liet al. compared the performance of C4.5 decision tree, multi-variate logistic regression, and SVM for 4-class activity classi-fication (coughing, drinking, chewing, and speaking) using anaccelerometer embedded in the teeth and found SVM to producethe best results. Amft and Troster [59] classified four intake ges-tures (eating with fork and knife, drinking from a glass, eatingwith a spoon, and eating with one hand) using inertial sensors,accelerometer and gyroscope, positioned on the upper and lowerarm. They found the sensors on the lower arm to be more usefuland informative for intake gesture classification. Other classi-fication problems undertaken in motion-based ADM literatureinclude chewing versus nonchewing using a piezoelectric sen-sor attached to the jaw area directly underneath the earlobe [60],infant sucking count and sucking rate also using a piezoelectricsensor placed on the jaw [63] and swallowing detection usinga piezoelectric belt worn around the chest [68]. Example ofdietary parameters inferred from motion-based ADM systemsinclude detecting intake moments during daily recordings [17],[18], solid versus liquid intake classification [25], and attemptsat calorie estimation from bite counts [61].
D. Multimodal Signal Analysis
As mentioned earlier, multimodal ADM systems aim to ben-efit from advantages of various sensor types in a combined, pos-sibly more robust system.Potential advantages of multimodalsystems over unimodal systems include improved detection,confidence, reliability, as well as extended spatial and tempo-ral coverage [89]. Whereas some challenges, especially for awearable ubiquitous system, include how to optimally combineheterogenous data streams and minimize power consumption.Other issues related to multisensor data fusion are handlingconflicting data, data correlation, and data alignment [89].
Fusion approaches can be categorized into three groupsnamely, 1) statistical approach, 2) probabilistic approach, and3) artificial intelligence [14]. Most multimodal ADM systemsin the previous literature utilize the statistical approach whichrefers to using weighed combinations. Fontana et al. [18] imple-mented an equal weighing, two-step sensor fusion approach ofjaw-motion, hand-gesture, and accelerometer signals. Their firstfusion step created a new signal from the product of absolutevalues for jaw-motion and hand-gesture signals in nonoverlap-ping 30 s window frames. Whereas their second fusion stepcreated a new signal from the average of x-, y-, and z-axis fromthe accelerometer signal. A new vector, created by grouping

PRIOLEAU∗ et al.: UNOBTRUSIVE AND WEARABLE SYSTEMS FOR AUTOMATIC DIETARY MONITORING 2085
TABLE IXSAMPLING AND ANALYSIS PARAMETERS FOR MOTION-BASED ADM SYSTEMS
Ref. Motion Sensors SamplingFreq. (Hz)
Frame Size (s) Features
Amft and Troster, 2008 [59] Accelerometer,gyroscope
100 0.5 Mean, variance, signal sum
Sazonov and Fontana, 2012 [60] Piezoelectric 100 30 Root mean square (RMS), entropy of filtered signal, base 2 log, mean,max., median, max. to RMS ratio, RMS to mean ratio, number of zerocrossings, mean time between crossings, max. time between crossings,min. time between crossings, std. dev. of time between crossings, entropyof zero crossings, number of peaks, entropy of peaks, mean time betweenpeaks, std. dev. of time between peaks, peaks to zero crossing numberratio, zero crossing to peak number ratio, entropy of spectrum, std. dev. ofspectrum, peak frequency, fractal dimension
Li et al., 2013 [34] Accelerometer 100 2.5 Mean, absolute value mean, max., min., max-min, zero crossing rate,RMS, std. dev., median, 75% percentile, inter-quartile range, inter-axiscorrelation, spectral entropy, energy, FFT coefficients
Dong et al., 2014 [17] i) Accelerometerii) Gyroscope
15 60 i) Energy peaks, manipulation (rotational versus linear motion ratio), linearacceleration, wrist-roll motion, regularity of wrist roll motion
Dong and Biswass, 2014 [68] Piezoelectric 30 - Spectral power at 3 Hz frequency bandsFontana et al., 2014 [18] i) RF transmitter and
receiverii) Accelerometeriii) Piezoelectric
i) 10ii) 100
iii) 1000
30 i) HtM gestures (count in fixed time, duration, mean absolute value, std.dev., max. value) wavelength, feature ratiosii) Mean absolute value, std. dev, median, number of zero-crossings, meantime between zero crossings, entropyiii) Mean absolute value, RMS, max., median, entropy, number of zerocrossings, mean time between zero crossings, number of peaks, averagerange, mean time between peaks, wavelength, sub-band energy, fractaldimension, peak frequency in sub-bands
Farooq et al., 2015 [63] Piezoelectric 1000 10 Number of zero crossings > thresholdKalantarian et al., 2015 [25] i) Piezoelectric
ii) Accelerometeri) 20ii) 20
0.45 ii) Harmonic mean, geometric mean, standard deviation, kurtosis,skewness, mean-absolute deviation
results from fusion step 1 and 2, was then used to discriminatefood intake and nonfood intake windows.
IV. PERFORMANCE EVALUATION
Standard metrics from information retrieval are used to eval-uate event detection and classification performance of ADMsystems. Classification results can be organized in a confusionmatrix for visual representation. Columns of a confusion ma-trix represent the predicted class while rows represent the actualclass, see [90], for examples. Hence, the diagonal representscorrectly classified events—true positives (TP) and true nega-tives (TN) while the nondiagonal values represent the wronglyclassified events—false positives (FP) and false negatives (FN).Quantitative evaluation terms are:
F1 score =2 × Precision × Recall
Precision+Recall(1)
Accuracy =TP+FN
TP+TN+FP+FN. (2)
The best result for the aforementioned evaluation metrics is1 (or 100%). When recall, also known as TP rate or sensitivity,is equal to 1, it means that all prominent events were correctlydetected. Whereas, when precision, also known as positive pre-dictive value or confidence, is equal to 1, it means there wereno FPs.
Cross-validation is an important tool for evaluating futureprediction accuracy of a classifier. A good and robust classifiershould have low variance and be well suited for biases andtrends in real-world datasets [91]. There are different methodsof validation that can be implemented including: hold-out,k-fold, and leave-one-out (leave-one-sample-out, leave-one-
participant-out). See [92] for more detailed explanations ofeach of the aforementioned cross validation methods.
A. Benchmarking State-of-the-Art ADM Systems
To enable a comprehensive summary of state-of-the-art ADMsystems, results in the literature were categorized into eventdetection and classification. The classification summary tableincludes papers with >2 (binary) group discrimination such asrelevant-activity classification (e.g., breathing, speaking, chew-ing, swallowing, coughing), food type classification (e.g., bread,cheese, vegetables, meat, pasta), texture-based food classifica-tion (e.g., dry-crispy, wet-crispy, crunchy, soft), etc.
Evaluation parameters used for comparison of event detectionand classification performance for ADM systems are:
1) Objective (event detection or classification goal).2) Sensor(s) type (acoustic, image, motion, multimodal).3) Number of subjects used for performance evaluation.4) Data source (e.g., in-laboratory, real-world, online
dataset).5) Cross-validation (hold-out, k-fold, LOSO, LOPO).6) Overall results (accuracy, F1 score, TPR, FPR).1) ADM Event Detection: Event detection tasks com-
monly approach the high-level problem of identifying eatingmoments in a continuous recording. This can include meal con-sumption or sporadic snacking events. Systems capable of robusteating detection can supplement standard self-report methodsthat rely on the user’s memory for food tracking or to moni-tor eating regularity of patients/older adults. Table X presents asummary of event detection (binary classification) performancefor ADM systems. Eating detection performance in literatureranges from ∼80% to 95% for controlled in-laboratory studies.

2086 IEEE TRANSACTIONS ON BIOMEDICAL ENGINEERING, VOL. 64, NO. 9, SEPTEMBER 2017
TABLE XSUMMARY OF EVENT DETECTION (BINARY CLASSIFICATION) PERFORMANCE FOR ADM SYSTEMS
Ref. Objective Sensor(s) # of Subj. Data Source Cross-validation Result (Acc, F1 , TPR, FPR)
Paßler et al., [28] Eating detection Acoustic 40 Lab LOPO Acc: 83.3%Sazonov and Fontana [60] Chewing detection Piezoelectric 20 Lab 20-fold Acc: 80.9%Dong et al., [61] Bite detection Gyroscope 47 Lab unknown F1 : 83.4%Dong et al., [17] Eating detection Accelerometer, gyroscope 43 Real-world LOOCV Acc: 81%Dong and Biswass [68] Swallowing detection Piezoelectric 7 Lab Tenfold TPR: 96.6%, FPR: 0.8%Paßler and Fischer [48] Chewing detection Acoustic 51 Lab unknown F1 : 84.4%Fontana et al., [18] Eating detection RF transmitter and receiver, 12 Real-world LOOCV Acc: 89.8%
accelerometer, piezoelectricThomaz et al., [33] Eating detection Acoustic 21 Real-world Tenfold, LOPO F1 : 79.8% (SD), 28.7% (SI)Bi et al., [23] i) Eating detection Acoustic 12 Lab fourfold Acc: i) 86.6%
ii) Solid versus liquid ii) 98.7%Kalantarian et al., [25] Swallowing detection Piezoelectric 30 Lab LOOCV TPR: 83.7%Bedri et al., [65] Eating detection Proximity 20 Lab LOPO Acc: 92.9% (SI)Bedri et al., [65] Eating detection Proximity 6 Real-world LOPO F1 : 76.2% (SI)
Whereas, detection performance ranges from ∼28.7% to 90%for less controlled, in-the-wild (real-world) studies. As ex-pected, subject independent performance is often significantlyless than subject dependent performance.
2) ADM Activity Classification: Table XI shows a sum-mary of ADM systems that have a goal of > 2-class clas-sification. This includes tasks such as activity and food typeclassification using acoustic, image, and inertial sensors. TheAutoDietary system [23] achieved amongst the best perfor-mance of 86.6% F1 score (subject-dependent) and 63.4%F1 score (subject-independent) for 7-class food classification.Whereas, Rahman et al. [35] showed a subject-dependent accu-racy of 87.1% and subject-independent accuracy of 84.9% for12-class activity classification that included eating and drinkingclasses. Equally common are image-based systems for whichAnthimopoulos [79] achieved one of the best performances of77.6% accuracy for 11-class food image classification. On amuch larger online dataset, Kawano and Yanai [12] achieved57.5% performance for 50-class food image classification.
V. DISCUSSION AND FUTURE CONSIDERATIONS
Current ADM systems, many of which are still in the researchphase, suffer from gross inaccuracies and poor functionality inreal-world settings primarily because they have been designedand tested under very specific controlled conditions. Therefore,these systems are not robust enough for the complexity as-sociated with practical dietary monitoring (i.e., diverse mealoptions, eating environments, and eating styles across varyinglifestyles, cultures, age groups, and socioeconomic status). Suchvarying user demographics certainly impacts acceptability andpracticality of any potentially successful ADM system. In ad-dition, most technology based research solutions for dietarymonitoring have focused on detecting chewing, swallowing,hand-gestures/HtM motion and food images, all of which arebeneficial but possibly do not provide information on the effecta chosen meal on the body. Future research can consider detect-ing meal composition such as sodium or carbohydrate contentbased on the effect of these on heart-rate, blood pressure, andbody weight. Especially for salt-sensitive individuals, there is arelationship between dietary sodium intake and blood pressure[94]. Other research considerations for ADM systems based onthe direction of current research include:
A. Single-Unit, Multimodal System
Single sensors used toward dietary monitoring have obviousadvantages and drawbacks, therefore it is envisioned that a mul-timodal system is needed to fully tackle the problem of contin-uous monitoring. To enable a portable form factor, a single-unitmultimodal system is preferred and recommended over a multiu-nit multimodal system. Recognition of a broader set of activitiesand estimation of more dietary parameters in diverse environ-mental conditions is feasible when multimodal sensors are care-fully selected. Low-power sensors can be used for gating or trig-gering higher power, detail-capturing sensors during eating mo-ments. For example, inertial sensors use less power than acous-tic and image sensors. In addition, inertial sensors are privacy-preserving because a user cannot be identified strictly from theinertial dataset. Such a sensor is the preferred sensing modalityfor continuous recording and detection to activate other sensors.
B. Recognition and Evaluation Dataset
To enable development of robust ADM systems with repeat-able signal analysis methods, it is important to have a large,open-access, comprehensive, naturalistic, and multiday datasetfor building and testing recognition models. Quantitative com-parison of developed ADM algorithms is currently limited bythe fact that each system works with a different dataset that issometimes biased to the dietary activity of interest. A few pub-lic datasets relevant for dietary monitoring include kitchen andfood preparation datasets [95]–[97], the Pittsburgh Fast-foodImage Dataset [93], iEatSet [98], and iHEARu-EAT [99]. Mostof these datasets focus primarily on image, video, and/or inertialsensing of particular events of interest for development of clas-sification algorithms. It is envisioned that a multimodal datasetthat includes acoustic data in addition to the aforementionedsensing data in a long-term, naturalistic recording environmentwill facilitate further research work.
C. Hierarchical Structure
Energy efficiency of wearable ADM systems is crucial tomaximize the limited battery life before need for a recharge.Hierarchical structures can reduce computational overhead andimprove privacy-preservation by triggering the detail-capturingsensors (e.g., image and acoustic) and low-level classification

PRIOLEAU∗ et al.: UNOBTRUSIVE AND WEARABLE SYSTEMS FOR AUTOMATIC DIETARY MONITORING 2087
TABLE XISUMMARY OF CLASSIFICATION PERFORMANCE FOR ADM SYSTEMS
Ref. Objective Sensor(s) # of Subj Data Source Cross-validation Result (Acc, F1 ,TPR, FPR)
Joutou and Yanai, [81] 50-class food image classification Image n/a i) Onlineii) First-person
fivefold TPR: i) 61.3%ii) 37.35
Yang et al., [84] 7-class food image classification Image n/a Online [93] threefold Acc: 78%Hoashi et al., [80] 85-class food image classification Image n/a i) Online
ii) First-personfivefold TPR: i) 62.5%
ii) 45.3%Zhu et al., [58] 19-class food image classification Image n/a First-person tenfold 95.8%Paßler et al., [28] 8-class food classification (drink, eat pudding,
chocolate, walnut, carrot etc.)Acoustic 51 Lab LOPO Acc: 79% (SD),
66% (SI)Liu et al., [29] 4-class classification (eat, drink speak, others) Acoustic 6 i) Lab
ii) Real worldHold-out TPR: i) 80.4%
ii) 71.6%Yatani and Truong [36] 12-class classification (eat, drink, speak, clear throat,
cough etc.)Acoustic 10 Lab LOSO, LOPO F1 : 79.5% (SD),
49.6% (SI)Kawano and Yanai [12] 50-class food image classification Image n/a First-person fivefold 57.5%Li et al., [34] 4-class classification (drink, chew, cough, speak) Accelerometer 8 Lab tenfold Acc: 80.98%Rahman et al., [35] 12-class classification (eat, drink, speak, clear throat,
cough etc.)Acoustic 14 Lab LOSO, LOPO F1 : 86.6% (SD),
67.6 (SI)Olubanjo andGhovanloo [42]
5-class classification (swallow, chew, speech cough,clear throat)
Acoustic 5 Lab Hold-out F1 : 87.4% (SD)
Anthimopoulos et al.,[79]
11-class food image classification Image n/a Online fivefold Acc: 77.6%
Bi et al., [23] 7-class food classification (apple, carrot, chips, cookie,peanut, walnut, water)
Acoustic 12 Lab fourfold Acc: 87.1% (SD),84.9% (SI)
Bettadapura et al., [83] 5-class food image classification Image n/a First-person threefold Acc: 63.3%
algorithm less often. High-level food intake detection infree living conditions can be implemented as a first step byprivacy-preserving sensors (e.g., inertial) and used to limitfurther processing to only detected eating periods. Dong et al.[17] observed 22.4 h of eating in 449 h of free-living recording;a ratio of 1:20 for eating versus noneating class. Therefore, ahierarchical approach that facilitates low-level processing onrelevant data segments can lead to significant power saving andimproved privacy.
D. Semisupervised Annotation and Learning Methods
Ground truth annotation is a very expensive and tedious taskespecially for long-term activity recognition. Therefore, it isimportant to consider future implementation of semiautomaticannotation methods such as [100], and semisupervised learn-ing methods such as cotraining [101], and weakly supervisedlearning [102]. These methods use a small labeled dataset to fa-cilitate further labeling of a larger dataset, which is then used forrecognition. Semisupervised methods are particularly importantfor a free-living dataset which presents the added challenge ofcollecting reliable ground-truth annotation.
E. Context-Aware Design
Previous activity recognition literature [103], [104] hasshown the benefit of including prior probabilities for a givenactivity based on contextual information. Intelligent ontologymodels that define relationships and constraints among activ-ities, artifacts, persons, communication routes, and symboliclocations can enhance performance of solely statistical methodsfor activity recognition [104]. Work by Bettadapura et al.in [83], is amongst the few that have leveraged contextfor automatic food recognition and showed a performanceimprovement of ∼47% when location prior was included forrestaurant food classification.
F. Concurrent Activity Evaluation
Much of the research toward ADM have been conducted ondatasets with discrete activities happening in time. Whereas inreal-world settings, people tend to eat while doing other activi-ties such as talking, watching television, working, commuting,etc. Therefore, concurrent (or composite) activity evaluation isan important area for future work in this field. The recently pub-lished iHEARu-EAT dataset [99], which focuses on acousticdata from eating while speaking, is amongst the few publiclyavailable datasets that presents concurrent data for eating recog-nition. Potentially relevant is the Markov logic for recognizinginterleaved and concurrent activities [105].
VI. CONCLUSION
In this paper, an overview of state-of-the-art research to-ward ADM is presented. Although significant progress has beenmade, development of a robust system capable of continuousdietary monitoring in daily living is still an open problem. Ad-vantages, drawbacks, and challenges associated with commonsensor types as well as signal analysis methods relevant for ex-tracting useful information from sensing modalities is presented.A comparison of dietary detection and classification results isincluded to highlight the current status and identify areas forfuture research.
REFERENCES
[1] “Overweight and obesity statistics,” U.S. Dept. of Health Human Ser-vices, Nat. Inst. of Diabetes Digestive Kidney Diseases, Washington,DC, USA, pp. 1–5, 2010.
[2] P. Sullivan, “Mortality in anorexia nervosa,” Amer. J. Psyciatry, vol. 152,no. 7, pp. 1073–1074, 1995.
[3] “Eating disorders 101 guide: A summary of issues, statistics, andresources,” Alliance Eating Disorders Awareness, 2002. [Online]:http://www.allianceforeatingdisorders.com

2088 IEEE TRANSACTIONS ON BIOMEDICAL ENGINEERING, VOL. 64, NO. 9, SEPTEMBER 2017
[4] L. E. Burke et al., “Self-monitoring in weight loss: A systematic reviewof the literature,” J. Amer. Dietetic Assoc., vol. 111, no. 1, pp. 92–102,2011.
[5] H. Kissileff et al., “Universal eating monitor for continuous recording ofsolid or liquid consumption in man,” Amer. J. Physiol., vol. 238, no. 1,pp. R14–R22, 1980.
[6] K. H. Chang et al., “The diet-aware dining table: Observing dietary be-haviors over a tabletop surface,” Pervasive Comput., vol. 3968, pp. 366–382, 2006.
[7] K. T. Ofei et al., “The dietary intake monitoring system (DIMS)—Aninnovative device for capturing patient’s food choice, food intake andplate waste in a hospital setting,” in Proc. Measuring Behavior, 2014.
[8] J. Gao et al., “Dining activity analysis using a hidden Markov model,”in Proc. Int. Conf. Pattern Recog., 2004, vol. 2, pp. 915–918.
[9] S. Cadavid et al., “Exploiting visual quasi-periodicity for real-time chew-ing event detection using active appearance models and support vectormachines,” Personal Ubiquitous Comput., vol. 16, no. 6, pp. 729–39,2012.
[10] W. Wu and J. Yang, “Fast food recognition from videos of eating forcalorie estimation,” in Proc. Int. Conf. Multimedia Expo., 2009, pp. 1210–1213.
[11] F. Zhu et al., “Technology-assisted dietary assessment,” Proc. SPIE,vol. 6814, pp. 1–10, 2008.
[12] Y. Kawano and K. Yanai, “Real-time mobile food recognition system,”in Proc. Comput. Vision Pattern Recog., 2013, pp. 589–593.
[13] O. Lara and M. Labrador “A survey on human activity recognition usingwearable sensors,” IEEE Commun. Surveys Tuts., vol. 15, no. 3, pp. 1192–1209, Third Quarter 2013.
[14] Y. L. Zheng et al., “Unobtrusive sensing and wearable devices for healthinformatics,” IEEE Trans. Biomed. Eng., vol. 61, no. 5, pp. 1538–1554,May 2014.
[15] O. Amft et al., “Bite weight prediction from acoustic recognition ofchewing,” IEEE Trans. Biomed. Eng., vol. 56, no. 6, pp. 1663–1672,Jun. 2009.
[16] C. Xu et al., “Image-based food volume estimation,” in Proc. Int. Work-shop Multimedia Cooking Eating Activities, 2013, pp. 75–80.
[17] Y. Dong et al., “Detecting periods of eating during free-living by trackingwrist motion,” IEEE J. Biomed. Health Informat., vol. 18, no. 4, pp. 1253–1260, Jul. 2014.
[18] J. Fontana et al., “Automatic ingestion monitor: A novel wearable devicefor monitoring of ingestive behavior,” IEEE Trans. Biomed. Eng., vol. 61,no. 6, pp. 1772–1779, Jun. 2014.
[19] T. Miyazaki et al., “Image-based calorie content estimation for dietaryassessment,” in Proc. IEEE Int. Symp. Multimedia, 2011, pp. 363–368.
[20] P. Lopez-Meyer et al., “Automatic identification of the number of fooditems in a meal using clustering techniques based on the monitoring ofswallowing and chewing,” Biomed. Signal Process. Control, vol. 7, no. 5,pp. 474–80, 2012.
[21] O. Amft, “A wearable earpad sensor for chewing monitoring,” in Proc.IEEE Sensors Conf., 2010, pp. 222–227.
[22] W. Walker and D. Bhatia, “Automatic ingestion detection for a healthmonitoring system,” IEEE J. Biomed. Health Informat., vol. 18, no. 2,pp. 682–692, Mar. 2014.
[23] Y. Bi et al., “AutoDietary: A wearable acoustic sensor system for foodintake recognition in daily life,” IEEE Sensors J., vol. 16, no. 3, pp. 806–816, Feb. 2015.
[24] P. Pouladzadeh et al., “Measuring calorie and nutrition from food image,”IEEE Trans. Instrum. Meas., vol. 63, no. 8, pp. 1947–1956, Aug. 2014.
[25] H. Kalantarian et al., “Monitoring eating habits using a piezoelectricsensor-based necklace,” Comput. Bio. Med., vol. 58, pp. 46–55, 2015.
[26] O. Amft and G. Troster, “Methods for detection and classification ofnormal swallowing from muscle activation and sound,” in Proc. PervasiveHealth Conf. Workshops, 2006, pp. 1–10.
[27] M. Farooq et al., “A novel approach for food intake detection us-ing electroglottography,” Physiol. Meas., vol. 35, no. 5, pp. 739–51,2014.
[28] S. Paßler et al., “Food intake monitoring: An acoustical approach toautomated food intake activity detection and classification of consumedfood,” Physiol. Meas., vol. 33, pp. 1073–93, 2012.
[29] J. Liu et al., “An intelligent food-intake monitoring system using wear-able sensors,” in Proc. 9th Int. Conf. Wearable Implantable Body SensorNetw., 2012, pp. 154–160.
[30] M. Shuzo et al., “Wearable eating habit sensing system using internalbody sound,” J. Adv. Mech. Design, Syst. Manuf., vol. 4, no. 1, pp. 158–166, 2010.
[31] E. Sazonov et al., “Non-invasive monitoring of chewing and swallowingfor objective quantification of ingestive behavior,” Physiological Meas.,vol. 29, no. 5, pp. 525–541, 2008.
[32] M. Sun et al., “A wearable electronic system for objective dietaryassessment,” J. Amer. Dietetic Assoc., vol. 110, no. 1, pp. 45–47,2010.
[33] E. Thomaz et al., “Inferring meal eating activities in real world settingsfrom ambient sounds: A feasibility study,” in Proc. Int. Conf. Intell. UserInterfaces, 2015, pp. 427–431.
[34] C. Li et al., “Sensor-embedded teeth for oral activity recognition,” inProc. Int. Symp. Wearable Comput., 2013, pp. 41–44.
[35] T. Rahman et al., “BodyBeat: A mobile system for sensing non-speechbody sounds,” in Proc. 12th Annu. Int. Conf. Mobile Syst., Appl., Services,2014, pp. 2–13.
[36] K. Yatani and K. Truong, “BodyScope: A wearable acoustic sensor foractivity recognition,” in Proc. 2012 ACM Conf. Ubiquitous Comput.,2012, pp. 341–350.
[37] H. Lu et al., “StressSense: Detecting stress in unconstrained acousticenvironments using smartphones,” in Proc. 2012 ACM Conf. UbiquitousComput., 2012, pp. 351–360.
[38] A. Yadollahi and Z. Moussavi, “Acoustic obstructive sleep apnea de-tection,” in Proc. Annu. Int. Conf. IEEE Eng. Med. Bio. Soc., 2009,pp. 7110–7113.
[39] M. Rofouei et al., “A non-invasive wearable neck-cuff system for real-time sleep monitoring,” in Proc. 2011 Int. Conf. Body Sensor Netw.,2011, pp. 156–161.
[40] E. C. Larson et al., “Accurate and privacy preserving cough sensing usinga low-cost microphone,” Proc. 13th Int. Conf. Ubiquitous Comput., 2011,pp. 375–384.
[41] J. Nishimura and T. Kuroda, “Eating habits monitoring using wirelesswearable in-ear microphone,” in Proc. Wireless Pervasive Comput., 2008,pp. 130–132.
[42] T. Olubanjo and M. Ghovanloo, “Tracheal activity recognition based onacoustic signals,” in Proc. IEEE Eng. Med. Bio. Conf., 2014, pp. 1436–1439.
[43] A. Kandori et al., “Simple magnetic swallowing detection system,” IEEESensors J., vol. 12, no. 4, pp. 805–811, Apr. 2012.
[44] T. Olubanjo and M. Ghovanloo, “Real-time swallowing detection basedon tracheal acoustics,” in Proc. IEEE Int. Conf. Acoust., Speech SignalProcess., 2014, pp. 4384–4388.
[45] O. Amft et al., “Analysis of chewing sounds for dietary monitoring,” inProc. 7th Int. Conf. Ubiquitous Comput., 2005, pp. 56–72.
[46] S. Paßler and W.-J. Fischer, “Food intake activity detection using a wear-able microphone system,” in Proc. 2011 7th Int. Conf. Intell. Environ.,2011, pp. 298–301.
[47] A. Liutkus et al., “Source separation for target enhancement of foodintake acoustics from noisy recordings,” in Proc. IEEE Workshop Appl.Signal Process. Audio Acoust., 2015, pp. 1–5.
[48] S. Paßler and W. Fischer, “Food intake monitoring: Automated chewevent detection in chewing sounds,” IEEE J. Biomed. Health Informat.,vol. 18, no. 1, pp. 278–89, Jan. 2014.
[49] G. Shroff et al., “Wearable context-aware food recognition for caloriemonitoring,” in Proc. Int. Symp. Wearable Comput., 2008, pp. 119–120.
[50] D. H. Wang et al., “Development of a new instrument for evaluatingindividuals’ dietary intakes,” J. Amer. Dietetic Assoc., vol. 106, no. 10,pp. 1588–1593, 2006.
[51] D. B. Sharp and M. Allman-Farinelli, “Feasibility and validity of mobilephones to assess dietary intake,” Nutrition, vol. 30, nos. 11/12, pp. 1257–1266, 2014.
[52] M. E. Rollo et al., “Trial of a mobile phone method for recording dietaryintake in adults with type 2 diabetes: Evaluation and implications forfuture applications,” J. Telemed. Telecare, vol. 17, no. 6, pp. 318–23,2011.
[53] C. K. Martin et al., “Validity of the Remote Food Photography Method(RFPM) for estimating energy and nutrient intake in near real-time,”Obesity, vol. 20, no. 4, pp. 891–899, 2012.
[54] E. Thomaz et al., “Feasibility of identifying eating moments from first-person images leveraging human computation,” in Proc. 4th Int. Sense-Cam & Pervasive Imaging Conf., 2013, pp. 26–33.
[55] L. Gemming et al., “Image-assisted dietary assessment: a systematicreview of the evidence,” J. Acad. Nutr. Diet., vol. 115, no. 1, pp. 64–77,2015.
[56] A. D. Lassen et al., “Evaluation of a digital method to assess evening mealintake in a free-living adult population,” Food Nutrition Res., vol. 54,no. 7, pp. 1–9, 2010.

PRIOLEAU∗ et al.: UNOBTRUSIVE AND WEARABLE SYSTEMS FOR AUTOMATIC DIETARY MONITORING 2089
[57] C. K. Martin et al., “A novel method to remotely measure food intakeof free-living people in real-time,” Brit. J. Nutrition, vol. 101, no. 3,pp. 446–456, 2009.
[58] F. Zhu et al., “The use of mobile devices in aiding dietary assessment andevaluation,” IEEE J. Sel. Topics Signal Process., vol. 4, no. 4, pp. 756–766, Aug. 2010.
[59] O. Amft and G. Troster, “Recognition of dietary activity events usingon-body sensors,” Artif. Intell. Med., vol. 42, no. 2, pp. 121–136, 2008.
[60] E. Sazonov and J. Fontana, “A sensor system for automatic detection offood intake through non-invasive monitoring of chewing,” IEEE SensorsJ., vol. 12, no. 5, pp. 1340–1348, May 2012.
[61] Y. Dong et al., “A new method for measuring meal intake in humans viaautomated wrist motion tracking,” Appl. Psychophysiol. Biofeedback,vol. 37, pp. 205–215, 2012.
[62] H. Kalantarian et al., “A wearable nutrition monitoring system,” in Proc.2014 11th Int. Conf. Wearable Implantable Body Sensor Netw., 2014,pp. 75–80.
[63] M. Farooq et al., “Monitoring of infant feeding behavior using a jawmotion sensor,” J. Healthcare Eng., vol. 6, no. 1, pp. 23–40, 2015.
[64] A. Bedri et al., “A wearable system for detecting eating activities withproximity sensors in the outer ear,” in Proc. 2015 ACM Int. Symp. Wear-able Comput., 2015, pp. 91–92.
[65] A. Bedri et al., “Detecting mastication: A wearable approach,” in Proc.Int. Conf. Multimodal Interaction, 2015, pp. 247–250.
[66] K. Corbin-Lewis and J. Liss, Clinical Anatomy & Physiology of theSwallow Mechanism. Boston, MA, USA: Cengage Learning, 2014.
[67] J. Lester et al., “Automatic classification of daily fluid intake,” in Proc.2010 4th Int. Conf. Pervasive Comput. Technol. Healthcare PervasiveHealth, 2010, pp. 1–8.
[68] B. Dong and S. Biswass, “Wearable sensing for liquid intake monitoringvia apnea detection in breathing signals,” Biomed. Eng. Lett., vol. 4, no. 4,pp. 378–387, 2014.
[69] M. Mirtchouk et al., “Automated estimation of food type and amountconsumed from body-worn audio and motion sensors,” in Proc. Int. JointConf. Pervasive Ubiquitous Comput., 2016, pp. 451–462.
[70] A. Bulling et al., “A tutorial on human activity recognition using body-worn inertial sensors,” ACM Comput. Surveys, vol. 46, no. 3, 2014, Art.no. 33.
[71] T. Olubanjo et al., “Detecting food intake acoustic events in noisy record-ings using template matching,” in Proc. IEEE Int. Conf. Biomed. HealthInformat., 2016, pp. 388–391.
[72] S. Youmans and J. Stierwalt, “An acoustic profile of normal swallowing,”Dysphagia, vol. 20, no. 3, pp. 195–209, 2005.
[73] J. Cichero and B. Murdoch, “Acoustic signature of the normal swallow:Characterization by age, gender and bolus volume,” Ann Otol RhinolLaryngol, vol. 111, no. 7, pp. 623–632, 2002.
[74] R. Gilad-Bachrach et al., “Margin based feature selection—Theory andalgorithms,” in Proc. Int. Conf. Mach. Learning, 2004, p. 43.
[75] H. C. Peng et al., “Feature selection based on mutual information: Criteriaof max-dependency, max-relevance, and min-redundancy,” IEEE Trans.Pattern Anal. Mach. Intell., vol. 27, no. 8, pp. 1226–38, Aug. 2005.
[76] D. Meyer et al., “The support vector machine under test,” Neurocomput-ing, vol. 55, nos. 1/2, pp. 169–186, 2003.
[77] P. Lopez-Meyer et al., “Detection of food intake from swallowing se-quences by supervised and unsupervised methods,” Ann. Biomed. Eng.,vol. 38, no. 8, pp. 2766–2774, 2010.
[78] T. M. Nguyen et al., “A real-time ellipse detection based on edge group-ing,” in Proc. IEEE Syst., Man, Cybern., 2009, pp. 3280–3286.
[79] M. M. Anthimopoulos et al., “A food recognition system for diabeticpatients based on an optimized bag-of-features model,” IEEE J. Biomed.Health Informat., vol. 18, no. 4, pp. 1261–1271, Jul. 2014.
[80] H. Hoashi et al., “Image recognition of 85 food categories by featurefusion,” in Proc. IEEE Int. Symp. Multimedia, 2010, pp. 296–301.
[81] T. Joutou and K. Yanai, “A food image recognition system with multiplekernel learning,” in Proc. IEEE Int. Conf. Image Process., 2009, pp. 285–288.
[82] S. O’Hara and B. A. Draper, “Introduction to the bag of features paradigmfor image classification and retrieval,” arXiv: 1101.3354, 2011.
[83] V. Bettadapura et al., “Leveraging context to support automated foodrecognition in restaurants,” in Proc. IEEE Winter Conf. Appl. Comput.Vis., 2015, pp. 580–587.
[84] S. Yang et al., “Food recognition using statistics of pairwise local fea-tures,” in Proc. IEEE Conf. Comput. Vis. Pattern Recog., 2010, pp. 2249–56.
[85] Y. Kawano and K. Yanai, “Food image recognition with deep convolu-tional features pre-trained with food-related categories,” in Proc. IEEEInt. Conf. Multimedia Expo. Workshops, 2015, pp. 1–6.
[86] A. Woda et al., “The regulation of masticatory function and food bolusformation,” J. Oral Rehab., vol. 33, no. 11, pp. 840–849, 2006.
[87] R. Kohavi and G. H. John, “Wrappers for feature subset selection,”Artificial Intell., vol. 97, nos. 1/2, pp. 273–324, 1997.
[88] L. I. Smith, “A tutorial on principal components analysis,” Cornell Univ.,vol. 51, no. 52, 2002.
[89] B. Khaleghi et al., “Multisensor data fusion: A review of the state-of-the-art,” Inf. Fusion, vol. 14, no. 1, pp. 28–44, 2013.
[90] D. Powers, “Evaluation: From precision, recall and f-measure to roc.,informedness, markedness & correlation,” J. Mach. Learning Technol.,vol. 2, no. 1, pp. 37–63, 2011.
[91] R. Kohavi, “A study of cross-validation and bootshrap for accuracyestimation and model selection,” in Proc. Int. Joint Conf. Artif. Intell.,1995, vol. 2, pp. 1137–1145.
[92] A. Moore, “Cross-validation for detecting and preventing overfitting,”School Comput. Sci., Carneigie Mellon Univ., Pittsburgh, PA, USA,pp. 1–27, 2001.
[93] M. Chen et al., “PFID: Pittsburgh fast-food image dataset,” in Proc. IEEEInt. Conf. Image Process., 2009, pp. 289–292.
[94] M. H. Weinberger, “Salt Sensitivity of Blood Pressure in Humans,” Hy-pertension, vol. 27, no. 3, pp. 481–490, 1996.
[95] M. Tenorth et al., “The TUM kitchen data set of everyday manipulationactivities for motion tracking and action recognition,” in Proc. IEEEComput. Vision Workshops, 2009, pp. 1089–1096.
[96] M. Rohrbach et al., “A database for fine grained activity detection ofcooking activities,” in Proc. IEEE Conf. Comput. Vis. Pattern Recog.,2012, pp. 1194–1201.
[97] S. Stein and S. McKenna, “Combining embedded accelerometers withcomputer vision for recognizing food preparation activities,” in Proc.2013 ACM Int. Joint Conf. Pervasive Ubiquitous Comput., 2013,pp. 729–738.
[98] V. D. Kakra et al., “A multimodal benchmark tool for automated eatingbehaviour recognition,” in Proc. Measuring Behavior, 2014.
[99] S. Hantke et al., “I hear you eat and speak: Automatic recognition ofeating condition and food type, use-cases, and impact on ASR Perfor-mance,” PLoS One, vol. 11, no. 5, pp. 1–24, 2016.
[100] D. Ramanan and D. A. Forsyth, “Automatic annotation of everydaymovements,” in Proc. Adv. Neural Inf. Proc. Sys., 2003, vol. 16.
[101] D. Guan et al., “Activity recognition based on semi-supervised learning,”in Proc. 13th IEEE Int. Conf. Embedded Real-Time Comp. Syst. Apps.,2007, pp. 469–475.
[102] M. Stikic et al., “Weakly supervised recognition of daily life activitieswith wearable sensors,” IEEE Trans. Pattern Anal. Mach. Intell., vol. 33,no. 12, pp. 2521–37, Dec. 2011.
[103] G. Abowd et al., “Context-awareness in wearable and ubiquitous com-puting,” Virtual Reality, vol. 3, no. 3, pp. 200–211, 1998.
[104] D. Riboni and C. Bettini, “COSAR: Hybrid reasoning for context-Aware activity recognition,” Personal Ubiquitous Comput., vol. 15, no. 3,pp. 271–289, 2011.
[105] R. Helaoui et al., “Recognizing interleaved and concurrent activities:A statistical-relational approach,” in Proc. IEEE Int. Conf. PervasiveComput. Commun., 2011, pp. 1–9.
Authors’ photographs and biographies not available at the time of pub-lication.