Embed Size (px)
Citation preview
DO SHORT-TERM RENTAL PLATFORMS AFFECT HOUSING MARKETS?
EVIDENCE FROM AIRBNB IN BARCELONA
Miquel-Àngel Garcia-López, Jordi Jofre-Monseny, Rodrigo Martínez Mazza, Mariona Segú
IEB Working Paper 2019/05
Cities
IEB Working Paper 2019/05
DO SHORT-TERM RENTAL PLATFORMS AFFECT HOUSING
MARKETS? EVIDENCE FROM AIRBNB IN BARCELONA
Miquel-Àngel Garcia-López, Jordi Jofre-Monseny, Rodrigo
Martínez Mazza, Mariona Segú
The Barcelona Institute of Economics (IEB) is a research centre at the University of
Barcelona (UB) which specializes in the field of applied economics. The IEB is a
foundation funded by the following institutions: Applus, Abertis, Ajuntament de
Barcelona, Diputació de Barcelona, Gas Natural, La Caixa and Universitat de
Barcelona.
The Cities Research Program has as its primary goal the study of the role of cities as
engines of prosperity. The different lines of research currently being developed address
such critical questions as the determinants of city growth and the social relations
established in them, agglomeration economies as a key element for explaining the
productivity of cities and their expectations of growth, the functioning of local labour
markets and the design of public policies to give appropriate responses to the current
problems cities face. The Research Program has been made possible thanks to support
from the IEB Foundation and the UB Chair in Smart Cities (established in 2015 by
the University of Barcelona).
Postal Address:
Institut d’Economia de Barcelona
Facultat d’Economia i Empresa
Universitat de Barcelona
C/ John M. Keynes, 1-11
(08034) Barcelona, Spain
Tel.: + 34 93 403 46 46
http://www.ieb.ub.edu
The IEB working papers represent ongoing research that is circulated to encourage
discussion and has not undergone a peer review process. Any opinions expressed here
are those of the author(s) and not those of IEB.
IEB Working Paper 2019/05
DO SHORT-TERM RENTAL PLATFORMS AFFECT HOUSING
MARKETS? EVIDENCE FROM AIRBNB IN BARCELONA *
Miquel-Àngel Garcia-López, Jordi Jofre-Monseny, Rodrigo
Martínez Mazza, Mariona Segú
ABSTRACT: In this paper, we assess the impact of the arrival and expansion of Airbnb on
housing rents and prices in the city of Barcelona. Examining highly detailed data on rents
and both transaction and posted prices, we use several econometric approaches that exploit
the exact timing and geography of Airbnb activity in the city. These include i) panel fixed-
effects models with neighborhood-specific time trends, ii) an instrumental variable shift-
share approach in which tourist amenities predict where Airbnb listings will locate and
Google searches predict when listings appear, and iii) event-study designs. For the average
neighborhood in terms of Airbnb activity, our preferred results imply that rents have
increased by 1.9%, while transaction (posted) prices have increased by 5.3% (3.7%). The
estimated impact in neighborhoods with high Airbnb activity is substantial. For
neighborhoods in the top decile of Airbnb activity distribution, rents are estimated to have
increased by 7%, while increases in transaction (posted) prices are estimated at 19% (14%).
JEL Codes: R10, R20, R31, Z30
Keywords: Housing markets, short-term rentals, Airbnb
* We are grateful to Gabrielle Fack, Apostolos Filippas, Laurent Gobillon, Hans Koster, Miren
Lafourcade, Florian Oswald, Henry Overman, Elisabet Viladecans-Marsal and participants of UEA
(Dusseldorf and New York) and RUES 2019 (Paris) for their valuable comments. We gratefully
acknowledge funding from Ajuntament de Barcelona (18S02330-001), Generalitat de Catalunya
(2017SGR-796 and 2017SGR-1301), Ministerio de Economía (ECO2016-75941R) y Ministerio de
Ciencia, Innovación y Universidades (RTI2018-097401-B-I00). Daniel del Pozo and David Rey
(Idealista) were very helpful and collaborative with their data.
Miquel-Àngel Garcia-López
Universitat Autònoma de Barcelona and IEB
Jordi Jofre-Monseny
Universitat de Barcelona and IEB
Rodrigo Martínez Mazza
Universitat de Barcelona and IEB
Mariona Segú
RITM, Université Paris Sud, Paris Saclay
1 Introduction
Tourism has grown enormously in recent decades. Between 1990 and 2017, theworldwide number of international tourist arrivals increased from about 400 million to1300 million (WTO, 2018). This pattern is particularly true for urban tourism; in fact, thenumber of visitors to the 132 most popular world cities increased by 45% between 2009 and2015.1 Peer-to-peer platforms such as Airbnb have recently entered the market throughpartly accommodating the increased demand for tourism in cities. As a consequence,they have contributed to increasing the overlap between tourism and housing markets byallowing owners of residential properties to enter the hospitality sector.
Proponents of peer-to-peer platforms argue that short-term rentals provide residentswith an additional source of income while allowing for tourism decentralization withincities. From an economic point of view, home-sharing platforms can be seen as an ef-ficiency improvement in markets where goods are not fully used (Barron et al., 2018).One could argue that empty apartments during holiday periods are efficiency losses thatcan be reduced by means of short-term rentals. However, if home-sharing platforms areused by owners to permanently shift from long- to short-term rentals for tourists, thesupply of units in the long-term market will be reduced, increasing housing prices andrents. Those that oppose peer-to-peer platforms also emphasize that short-term rentalunits in residential areas might constitute a negative externality for residents in terms ofnoise or uncivil behavior and that they cause gentrification and displacement of long-termresidents.2 Complaints about the gentrification effects and nuisances of short-term rentalshave resulted in the implementation of local policies that limit the expansion of platformssuch as Airbnb. Examples of such policy responses include the requirement to have a spe-cific permit (Barcelona, Berlin, Paris, San Francisco, and Los Angeles), limiting the rentalperiod (Amsterdam, New York, Paris, and San Francisco), paying a rental tax (Amsterdamand San Francisco), or outlawing short-term rentals in some conditions (Berlin and NewYork).
Despite all these local policy responses, we still have limited evidence on the effectof peer-to-peer platforms on housing markets. In this paper, we analyze the effects of thearrival and expansion of Airbnb in Barcelona. Barcelona constitutes an ideal city to studythe effects of Airbnb on local housing markets for several reasons. First, Barcelona hasexperienced a tourism boom, with the number of passengers in the city’s airport increasingfrom 20 to 47 million between 2000 and 2017. In fact, Barcelona is currently the 7th mostvisited destination in Europe (and the 17th worldwide). Second, Airbnb accounts for thelion’s share of peer-to-peer platforms activity in the city, far ahead of its competitors3.Third, Airbnb penetration in Barcelona is high, with Barcelona being Airbnb’s 6th topdestination worldwide.4
Table 1 compares the size of the stock of Airbnb listings in Barcelona, New York,Los Angeles and Paris in 2015. Despite (substantial) legal uncertainties regarding the useof peer-to-peer platforms such as Airbnb in Barcelona, about 2.06% of all units are listed
1Mastercard Global Destination Cities Index.2Similarly, the hotel industry opposes home-sharing platforms, as they are viewed as a threat to fair
competition. Zervas et al. (2017) empirically studies the effect of Airbnb on hotels revenues.3For Barcelona, the market share of Airbnb is around 70% according to the datahippo project
(https://datahippo.org/es/) which collects data for several peer-to-peer platforms since 2017. We donot use these data as they do not cover the period we study.
4‘You’ll never guess which city has the most Airbnb listings’. Forbes. J Bishop 2017.
2
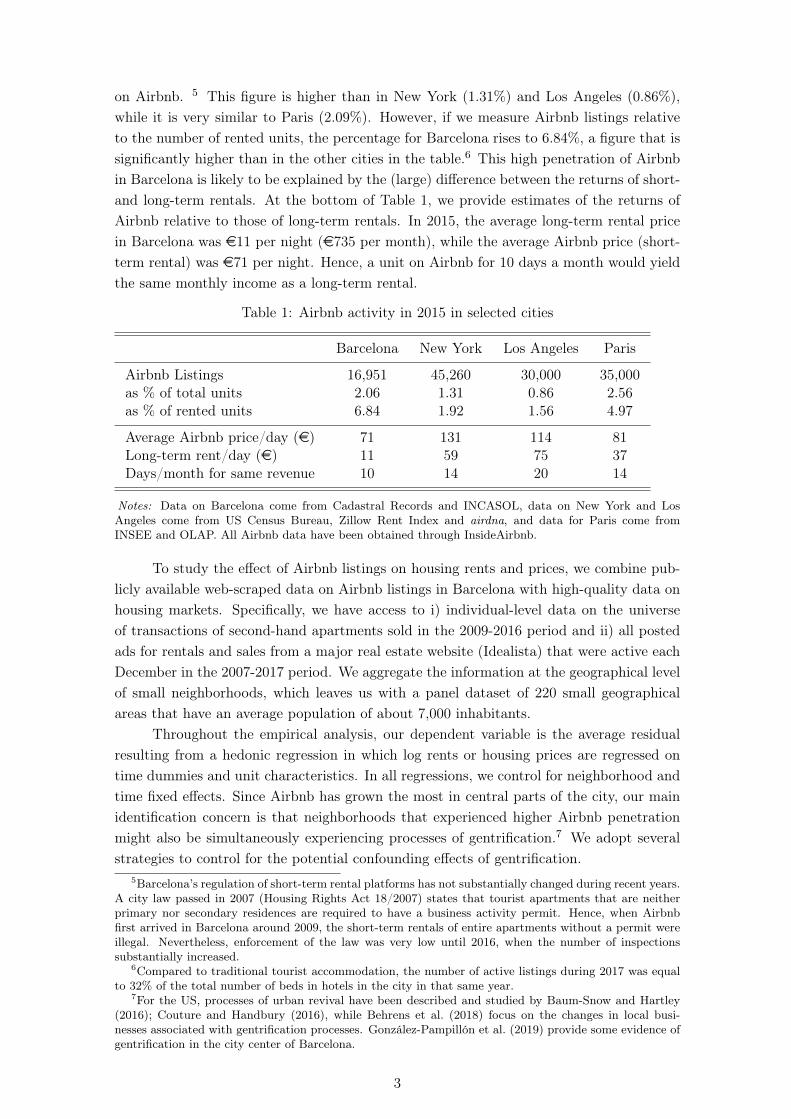
on Airbnb. 5 This figure is higher than in New York (1.31%) and Los Angeles (0.86%),while it is very similar to Paris (2.09%). However, if we measure Airbnb listings relativeto the number of rented units, the percentage for Barcelona rises to 6.84%, a figure that issignificantly higher than in the other cities in the table.6 This high penetration of Airbnbin Barcelona is likely to be explained by the (large) difference between the returns of short-and long-term rentals. At the bottom of Table 1, we provide estimates of the returns ofAirbnb relative to those of long-term rentals. In 2015, the average long-term rental pricein Barcelona was e11 per night (e735 per month), while the average Airbnb price (short-term rental) was e71 per night. Hence, a unit on Airbnb for 10 days a month would yieldthe same monthly income as a long-term rental.
Table 1: Airbnb activity in 2015 in selected cities
Barcelona New York Los Angeles Paris
Airbnb Listings 16,951 45,260 30,000 35,000as % of total units 2.06 1.31 0.86 2.56as % of rented units 6.84 1.92 1.56 4.97
Average Airbnb price/day (e) 71 131 114 81Long-term rent/day (e) 11 59 75 37Days/month for same revenue 10 14 20 14
Notes: Data on Barcelona come from Cadastral Records and INCASOL, data on New York and LosAngeles come from US Census Bureau, Zillow Rent Index and airdna, and data for Paris come fromINSEE and OLAP. All Airbnb data have been obtained through InsideAirbnb.
To study the effect of Airbnb listings on housing rents and prices, we combine pub-licly available web-scraped data on Airbnb listings in Barcelona with high-quality data onhousing markets. Specifically, we have access to i) individual-level data on the universeof transactions of second-hand apartments sold in the 2009-2016 period and ii) all postedads for rentals and sales from a major real estate website (Idealista) that were active eachDecember in the 2007-2017 period. We aggregate the information at the geographical levelof small neighborhoods, which leaves us with a panel dataset of 220 small geographicalareas that have an average population of about 7,000 inhabitants.
Throughout the empirical analysis, our dependent variable is the average residualresulting from a hedonic regression in which log rents or housing prices are regressed ontime dummies and unit characteristics. In all regressions, we control for neighborhood andtime fixed effects. Since Airbnb has grown the most in central parts of the city, our mainidentification concern is that neighborhoods that experienced higher Airbnb penetrationmight also be simultaneously experiencing processes of gentrification.7 We adopt severalstrategies to control for the potential confounding effects of gentrification.
5Barcelona’s regulation of short-term rental platforms has not substantially changed during recent years.A city law passed in 2007 (Housing Rights Act 18/2007) states that tourist apartments that are neitherprimary nor secondary residences are required to have a business activity permit. Hence, when Airbnbfirst arrived in Barcelona around 2009, the short-term rentals of entire apartments without a permit wereillegal. Nevertheless, enforcement of the law was very low until 2016, when the number of inspectionssubstantially increased.
6Compared to traditional tourist accommodation, the number of active listings during 2017 was equalto 32% of the total number of beds in hotels in the city in that same year.
7For the US, processes of urban revival have been described and studied by Baum-Snow and Hartley(2016); Couture and Handbury (2016), while Behrens et al. (2018) focus on the changes in local busi-nesses associated with gentrification processes. González-Pampillón et al. (2019) provide some evidence ofgentrification in the city center of Barcelona.
3
First, we control for the time-varying neighborhood demographic characteristics thatare associated with gentrification processes. Second, we allow for each small neighborhoodto have a specific linear time trend. Third, we apply an IV strategy, where the instrumentis the interaction between i) a measure of proximity to the city’s tourist amenities atthe neighborhood level and ii) a Google Trends measure that tracks changes in Airbnbactivity over time. The proximity to tourist amenities predicts where Airbnb will locate,while Airbnb searches in Google predict when listings appear. We indirectly verify theexclusion restriction by showing that proximity to tourist amenities does not predict rentand price growth in the pre-Airbnb period (i.e., before 2013). Finally, we also estimateevent-study regressions. We dummify Airbnb activity (beyond the 90th percentile) andestimate interaction terms between year dummies and the Airbnb intensity indicator thatidentifies those areas with more Airbnb listings. This approach allows us to check if priorto the expansion of Airbnb, housing markets were evolving similarly in neighborhoods thatafter 2012 would experience high Airbnb penetration compared to others.
Our findings indicate that Airbnb has increased both rents and prices. For rents, ourpreferred specification result suggests that 54 more active listings in a small neighborhood(about the average level in 2016) increase rents by 1.9%, while transaction and postedprices increase by 5.3% and 3.67%, respectively. However, our estimates imply that localimpacts can be substantial in the most tourist parts of the city. In particular, our resultsimply that 200 listings (the average number of listings in the top decile of the Airbnbactivity distribution in 2016) increase rents by 7% and transaction and posted prices by19% and 14%, respectively. We develop a stylized model of the housing market, whereowners can decide to rent long term to residents or short term to tourists. Consistent withour findings, the model predicts that Airbnb will increase housing prices and rents, withthe former effect being larger than the latter. In terms of mechanisms, the model predictsthat Airbnb reduces the supply of residential housing units. In line with this prediction,our analysis shows that Airbnb listings reduce the number of resident households in theneighborhood.
Despite Airbnb being a recent phenomenon, there are already some research papersthat estimate the effect of Airbnb on housing markets in the US. Barron et al. (2018)perform an analysis similar to ours. They look at the impact of Airbnb on rents andhouse prices for all cities in the US.8 Their main strategy consists of using a ‘shift-share’instrument, where the time variation comes from Google Trends of ‘Airbnb’ searches, whilethe cross-sectional variation is a neighborhood ‘touristiness’ index based on the locationof restaurants. They find that a 1% increase in Airbnb listings increases rents by 0.018%and housing prices by 0.026%. Finally, Koster et al. (2018) study the effects of Airbnbbans implemented by several, but not all, governments in the Los Angeles area. Exploitingchanges in prices at the administrative border, they find that banning Airbnb decreasesprices by about 5%.
We contribute to the literature in several ways. First, as explained above, in Barcelona,the difference in returns between Airbnb and long-term rentals is large, resulting in highlevels of Airbnb activity. Second, we have access to multiple high-quality datasets to trackgranular changes in both housing rents and prices. These individual-level data allow usto measure changes in rents and housing prices while controlling for composition changes
8An earlier contribution is Sheppard et al. (2016) that focuses on New York City. Their results suggestthat doubling Airbnb in a 300-meter circle around a property translates to an increase in its value by 6%to 9%
4
in rented or sold units. Third, this is the first study to estimate the effects of Airbnbin the context of a large European city. This is relevant given the underlying differencesbetween European and US cities. For instance, there might be less excess capacity inEuropean cities, where guest houses or basement apartments (below a main house) arevirtually nonexistent. For the case of Barcelona, our analysis below shows that only asmall proportion of housing units active on Airbnb are primary residences. Despite thesedifferences, the results that we find are remarkably close to those found in Barron et al.(2018). Compared to Koster et al. (2018), our paper focuses on a different channel throughwhich Airbnb affects housing markets. The spatial RD design, which constitutes the mainanalysis in Koster et al. (2018), compares changes in prices across municipality bordersfollowing Airbnb bans. This neatly identifies the price increase of a property due to thepossibility of using Airbnb. However, properties located across a border might be part ofthe same housing market, and thus, their spatial RD estimates do not capture changes inrents and prices that are caused by supply reductions. Our last contribution is preciselyto provide direct evidence on the supply mechanism by showing that Airbnb reduces thenumber of households living in the neighborhood.
The paper is organized as follows. In Section 2, we develop a stylized model tounderstand the channels through which short-term rentals might affect the residentialmarkets of neighborhoods. Section 3 describes the Airbnb, rents and housing prices dataand describes the most relevant variables. A description of the empirical strategies wefollow is provided in Section 4. The main results are presented and discussed in Section 5,while Section 6 contains the instrumental variables and event-study results. Finally, someconcluding remarks are provided in Section 7.
2 Theoretical framework
In this section, we develop a theoretical framework to study the effects of short-termrentals to tourists on the market for long-term rentals. The model is a partial equilibriummodel and focuses on the rental market of a central neighborhood n. In this neighborhood,there is a housing stock of size C that is owned by absentee landlords.
Each resident in the city consumes one unit of housing. Owners can rent theirapartments through a long-term rental to a resident and obtain an annual market rent Q or,alternatively, rent short-term to tourists and obtain an annual rent of T , where T > Q. Treflects the (exogenous) tourists’ willingness to pay to stay in the neighborhood. We assumethat there is an individual-specific cost bj to rent short-term to tourists, which reflects thelegal uncertainties or the costs of running an Airbnb business. bj is heterogeneous acrossowners since they can differ in their risk aversion towards legal uncertainties or their accessto legal services, as well as their valuation of privacy. If T − bj > Q, the owner rents shortterm to tourists, while if T − bj ≤ Q, the owner rents long term to a resident. This allowsT and Q to differ in equilibrium, which is a salient feature of the data for the case ofBarcelona. In equilibrium, there is a marginal owner who is indifferent between renting toresidents or to tourists, T − b∗j = Q, which implies that owners with bj < b∗j rent shortterm, while those with bj ≥ b∗j rent long term.
The utility that a resident obtains in neighborhood n is Uni = Yi−Q−αFb(b
∗j )+ ai,
where Yi is income and αFb(b∗j ) is a term reflecting the negative externality that tourism
5
can impose on residents due to noise or uncivil behavior.9 Finally, ai is an idiosyncraticterm reflecting the preference of resident i to live in neighborhood n. If we normalize theutility level that resident i can obtain elsewhere in the city to Yi, the willingness to pay tolive in neighborhood n of the marginal resident is Q(a∗i ) = −αFb(b
∗j ) + a∗i , with everyone
with ai > a∗i living in n and everyone with ai ≤ a∗i living somewhere else.In equilibrium, the long-term rental market in neighborhood n must clear, which
implies C(1 − Fb(b∗j )) = 1 − Fa(a
∗i ). Without loss of generality, we assume that bj and
ai are U ∼ (0, 1) which simplifies the market clearing condition to C(1 − b∗j ) = 1 − a∗i .Combining the market clearing condition, the willingness to pay of the marginal resident,Q = a∗i − αb∗j , and the definition of the marginal owner, T − b∗j = Q, we obtain the shareof owners that rent short term to tourists:
(1) b∗j =C − 1 + T
1 + C − α
Equation 1 indicates that the penetration of Airbnb is determined by T , which reflectstourists’ willingness to pay to stay in the neighborhood. In Appendix A, we show that thenumber of Airbnb listings in a neighborhood is closely related to the average price of itslistings, as equation 1 predicts. T reflects how attractive a neighborhood is to tourists. InSection 4.2, we also document that the proximity to relevant tourist attractions is a strongpredictor of Airbnb activity at the neighborhood level. Hence, the predictions of the modelin terms of where Airbnb activity should be higher are supported by the data.
When the neighborhood is of little interest to tourists, i.e., T ≤ 1−C, residents outbidtourists, and there are no short-term apartments in the neighborhood. For T ≥ 1 − C,b∗j > 0, and the equilibrium price of long-term rentals is obtained by inserting the marketclearing condition in the residents’ willingness to pay function:10
(2) Q = 1− C + (C − α)b∗j
Equation 2 indicates that more units in the short-term rental market affect long-term rents through two different mechanisms that work in opposite directions. First, oneadditional unit in the short-term market reduces the number of long-term residents, whichmechanically increases a∗i , as the market clearing condition reveals. To put it differently,reducing the supply of long-term units increases their price. Second, a marginal increasein b∗j means higher negative externalities, which contribute to lower long-term rents.
We follow the approach of Barron et al. (2018) to relate rents and housing prices.The market is assumed to be in a steady state, and the price of a housing unit (P ) is givenby the present value of discounted cash flows to the landlord:
(3) P =∞∑t=1
δt
[(1− b∗j )Q+
∫ b∗j
0(T − b)db
]=
1
1− δ
[Q+ (T −Q)b∗j −
(b∗j )2
2
]9Tourism as a negative externality is in line with the local population’s perception of tourism as a
negative phenomena in Barcelona. This fact has been documented by the biannual opinion poll made bythe local authorities since 2011, which surveys citizens’ perceptions of Barcelona’s largest problems since2011. In this poll, tourism was mentioned, on average, as the fourth major problem of the city during theentire period, reaching the top of the ranking in 2017.
10If 2−α ≥ T , b∗j becomes zero, as the negative externalities drive all residents out of the neighborhood.
6
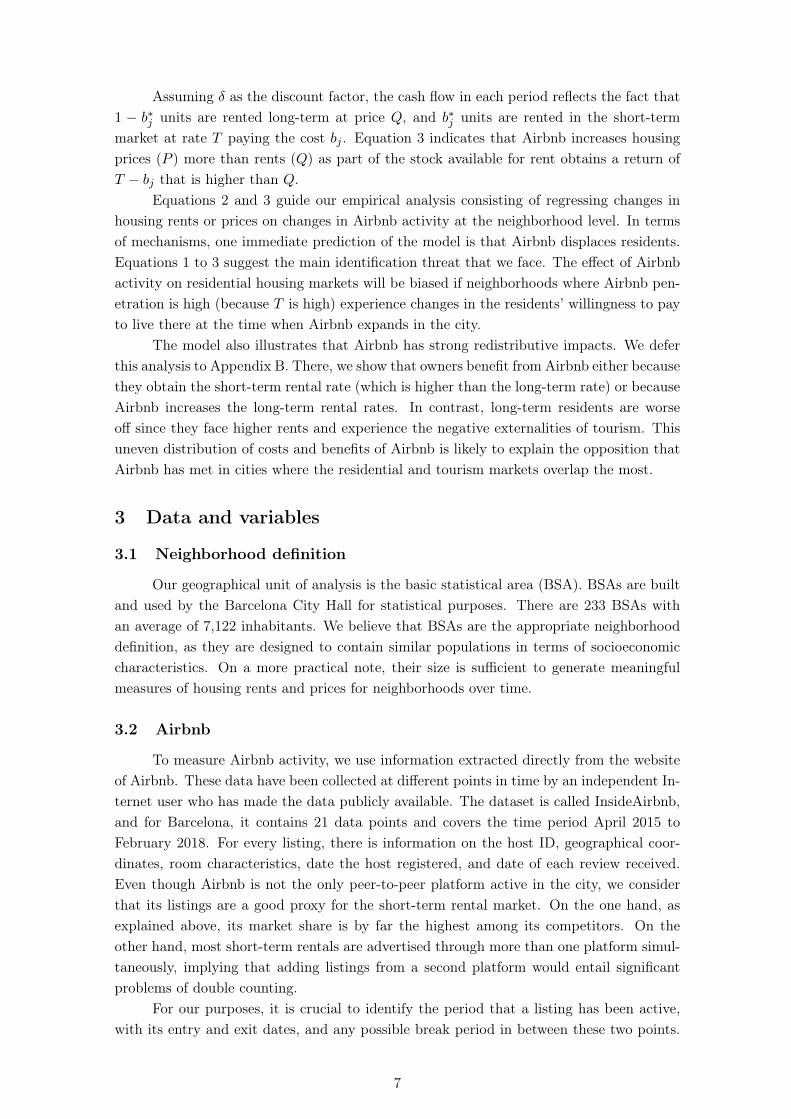
Assuming δ as the discount factor, the cash flow in each period reflects the fact that1 − b∗j units are rented long-term at price Q, and b∗j units are rented in the short-termmarket at rate T paying the cost bj . Equation 3 indicates that Airbnb increases housingprices (P ) more than rents (Q) as part of the stock available for rent obtains a return ofT − bj that is higher than Q.
Equations 2 and 3 guide our empirical analysis consisting of regressing changes inhousing rents or prices on changes in Airbnb activity at the neighborhood level. In termsof mechanisms, one immediate prediction of the model is that Airbnb displaces residents.Equations 1 to 3 suggest the main identification threat that we face. The effect of Airbnbactivity on residential housing markets will be biased if neighborhoods where Airbnb pen-etration is high (because T is high) experience changes in the residents’ willingness to payto live there at the time when Airbnb expands in the city.
The model also illustrates that Airbnb has strong redistributive impacts. We deferthis analysis to Appendix B. There, we show that owners benefit from Airbnb either becausethey obtain the short-term rental rate (which is higher than the long-term rate) or becauseAirbnb increases the long-term rental rates. In contrast, long-term residents are worseoff since they face higher rents and experience the negative externalities of tourism. Thisuneven distribution of costs and benefits of Airbnb is likely to explain the opposition thatAirbnb has met in cities where the residential and tourism markets overlap the most.
3 Data and variables
3.1 Neighborhood definition
Our geographical unit of analysis is the basic statistical area (BSA). BSAs are builtand used by the Barcelona City Hall for statistical purposes. There are 233 BSAs withan average of 7,122 inhabitants. We believe that BSAs are the appropriate neighborhooddefinition, as they are designed to contain similar populations in terms of socioeconomiccharacteristics. On a more practical note, their size is sufficient to generate meaningfulmeasures of housing rents and prices for neighborhoods over time.
3.2 Airbnb
To measure Airbnb activity, we use information extracted directly from the websiteof Airbnb. These data have been collected at different points in time by an independent In-ternet user who has made the data publicly available. The dataset is called InsideAirbnb,and for Barcelona, it contains 21 data points and covers the time period April 2015 toFebruary 2018. For every listing, there is information on the host ID, geographical coor-dinates, room characteristics, date the host registered, and date of each review received.Even though Airbnb is not the only peer-to-peer platform active in the city, we considerthat its listings are a good proxy for the short-term rental market. On the one hand, asexplained above, its market share is by far the highest among its competitors. On theother hand, most short-term rentals are advertised through more than one platform simul-taneously, implying that adding listings from a second platform would entail significantproblems of double counting.
For our purposes, it is crucial to identify the period that a listing has been active,with its entry and exit dates, and any possible break period in between these two points.
7
The main complication we face is that the scraped information starts only in 2015, andhence, a listing count does not provide information for the period prior to April 2015. Tobuild a measure of Airbnb listings for the period of analysis, we use a method similar tothat proposed by Zervas et al. (2017). We consider that a listing is active in a given quarterif it has received at least one review during that quarter. According to Airbnb, 72% ofguests leave a review, which supports proxying stays with platform reviews.11
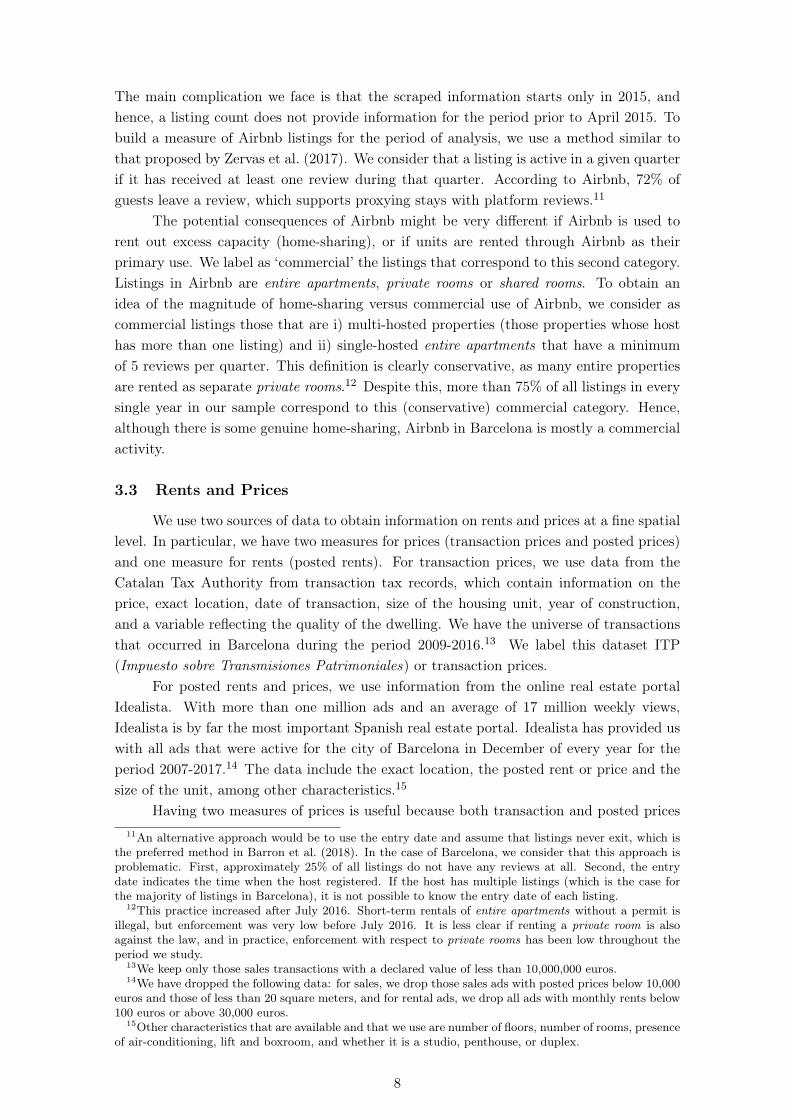
The potential consequences of Airbnb might be very different if Airbnb is used torent out excess capacity (home-sharing), or if units are rented through Airbnb as theirprimary use. We label as ‘commercial’ the listings that correspond to this second category.Listings in Airbnb are entire apartments, private rooms or shared rooms. To obtain anidea of the magnitude of home-sharing versus commercial use of Airbnb, we consider ascommercial listings those that are i) multi-hosted properties (those properties whose hosthas more than one listing) and ii) single-hosted entire apartments that have a minimumof 5 reviews per quarter. This definition is clearly conservative, as many entire propertiesare rented as separate private rooms.12 Despite this, more than 75% of all listings in everysingle year in our sample correspond to this (conservative) commercial category. Hence,although there is some genuine home-sharing, Airbnb in Barcelona is mostly a commercialactivity.
3.3 Rents and Prices
We use two sources of data to obtain information on rents and prices at a fine spatiallevel. In particular, we have two measures for prices (transaction prices and posted prices)and one measure for rents (posted rents). For transaction prices, we use data from theCatalan Tax Authority from transaction tax records, which contain information on theprice, exact location, date of transaction, size of the housing unit, year of construction,and a variable reflecting the quality of the dwelling. We have the universe of transactionsthat occurred in Barcelona during the period 2009-2016.13 We label this dataset ITP(Impuesto sobre Transmisiones Patrimoniales) or transaction prices.
For posted rents and prices, we use information from the online real estate portalIdealista. With more than one million ads and an average of 17 million weekly views,Idealista is by far the most important Spanish real estate portal. Idealista has provided uswith all ads that were active for the city of Barcelona in December of every year for theperiod 2007-2017.14 The data include the exact location, the posted rent or price and thesize of the unit, among other characteristics.15
Having two measures of prices is useful because both transaction and posted prices11An alternative approach would be to use the entry date and assume that listings never exit, which is
the preferred method in Barron et al. (2018). In the case of Barcelona, we consider that this approach isproblematic. First, approximately 25% of all listings do not have any reviews at all. Second, the entrydate indicates the time when the host registered. If the host has multiple listings (which is the case forthe majority of listings in Barcelona), it is not possible to know the entry date of each listing.
12This practice increased after July 2016. Short-term rentals of entire apartments without a permit isillegal, but enforcement was very low before July 2016. It is less clear if renting a private room is alsoagainst the law, and in practice, enforcement with respect to private rooms has been low throughout theperiod we study.
13We keep only those sales transactions with a declared value of less than 10,000,000 euros.14We have dropped the following data: for sales, we drop those sales ads with posted prices below 10,000
euros and those of less than 20 square meters, and for rental ads, we drop all ads with monthly rents below100 euros or above 30,000 euros.
15Other characteristics that are available and that we use are number of floors, number of rooms, presenceof air-conditioning, lift and boxroom, and whether it is a studio, penthouse, or duplex.
8
have advantages and disadvantages. Posted prices might differ from agreed upon pricessince there is often some bargaining in the process. Official transaction prices should, inprinciple, measure prices more precisely. However, in practice, the transaction (ITP) datahave two limitations. First, there might be a nonnegligible time lapse between the dateat which parties agree on a price and the date when the ITP tax is paid. Second, thereis some fraud in the ITP tax that consists of underreporting the ITP price and thus thetax base. For rents, we cannot compare posted to actual rents. However, Chapelle andEymeoud (2018) show that bargaining is less of an issue for rents and that online postedprices are a good measure of actual rents.
3.4 Descriptive Statistics
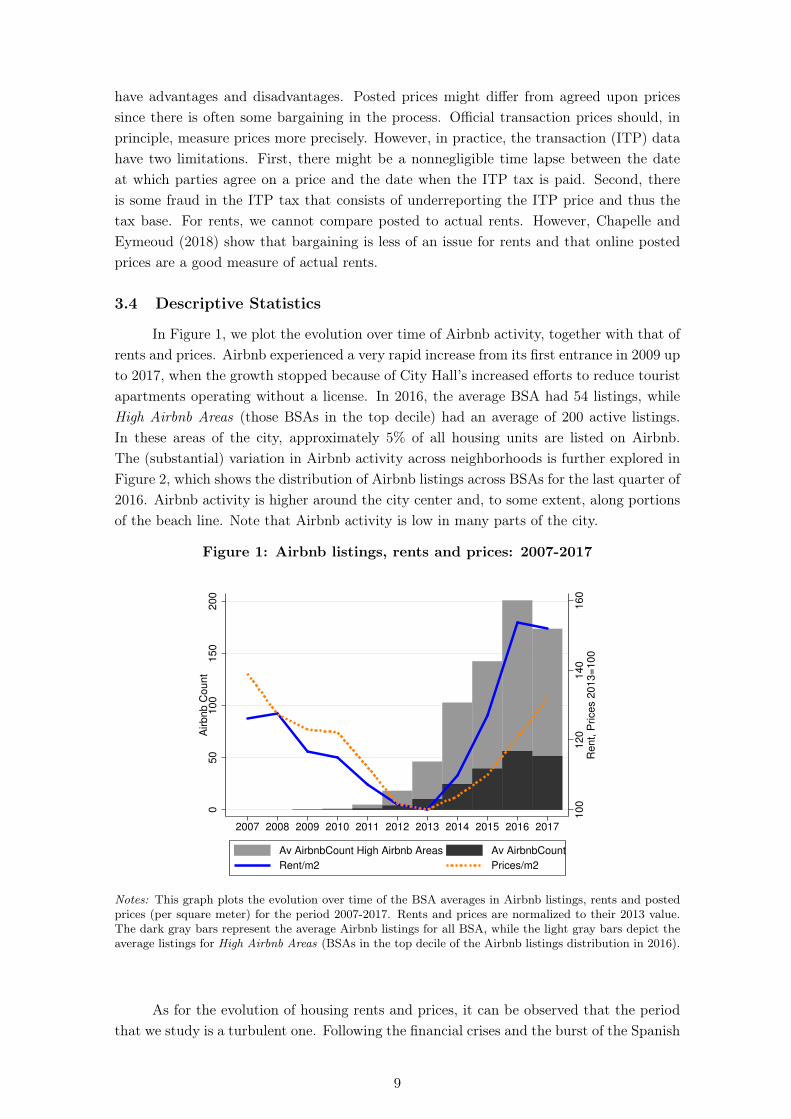
In Figure 1, we plot the evolution over time of Airbnb activity, together with that ofrents and prices. Airbnb experienced a very rapid increase from its first entrance in 2009 upto 2017, when the growth stopped because of City Hall’s increased efforts to reduce touristapartments operating without a license. In 2016, the average BSA had 54 listings, whileHigh Airbnb Areas (those BSAs in the top decile) had an average of 200 active listings.In these areas of the city, approximately 5% of all housing units are listed on Airbnb.The (substantial) variation in Airbnb activity across neighborhoods is further explored inFigure 2, which shows the distribution of Airbnb listings across BSAs for the last quarter of2016. Airbnb activity is higher around the city center and, to some extent, along portionsof the beach line. Note that Airbnb activity is low in many parts of the city.
Figure 1: Airbnb listings, rents and prices: 2007-2017
100
120
140
160
Rent, P
rices 2
013=
100
050
100
150
200
Airbnb C
ount
2007 2008 2009 2010 2011 2012 2013 2014 2015 2016 2017
Av AirbnbCount High Airbnb Areas Av AirbnbCount
Rent/m2 Prices/m2
Notes: This graph plots the evolution over time of the BSA averages in Airbnb listings, rents and postedprices (per square meter) for the period 2007-2017. Rents and prices are normalized to their 2013 value.The dark gray bars represent the average Airbnb listings for all BSA, while the light gray bars depict theaverage listings for High Airbnb Areas (BSAs in the top decile of the Airbnb listings distribution in 2016).
As for the evolution of housing rents and prices, it can be observed that the periodthat we study is a turbulent one. Following the financial crises and the burst of the Spanish
9
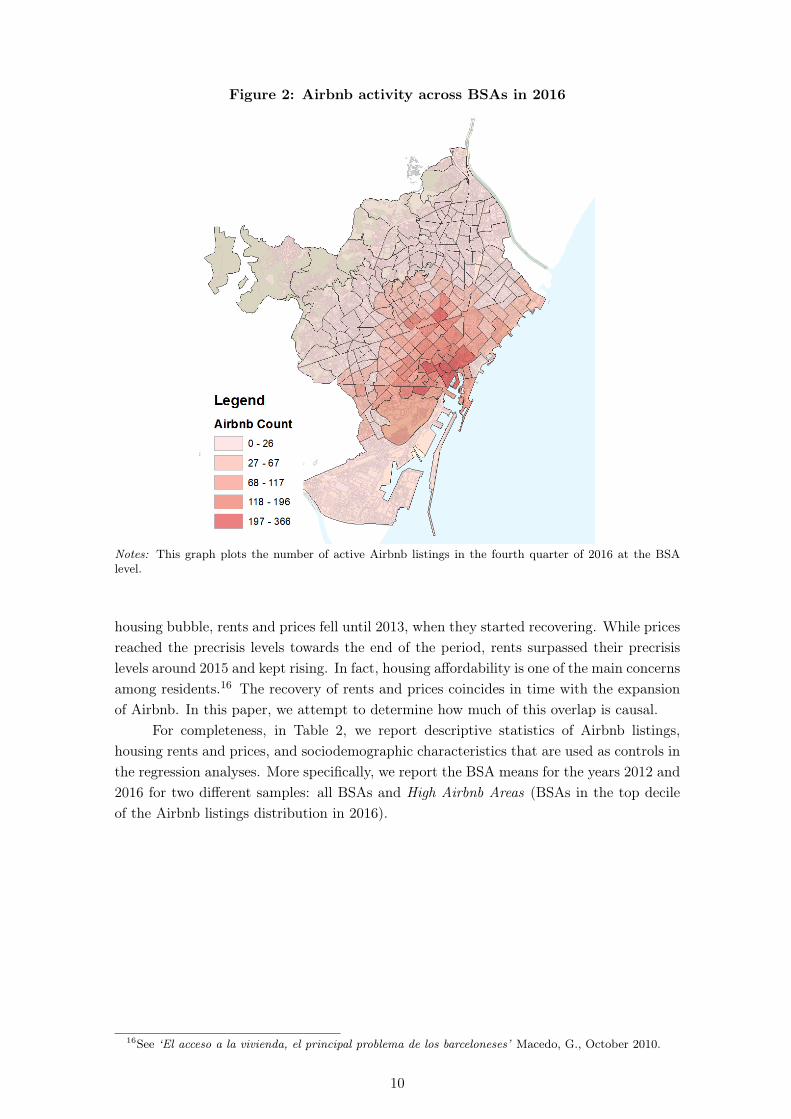
Figure 2: Airbnb activity across BSAs in 2016
Notes: This graph plots the number of active Airbnb listings in the fourth quarter of 2016 at the BSAlevel.
housing bubble, rents and prices fell until 2013, when they started recovering. While pricesreached the precrisis levels towards the end of the period, rents surpassed their precrisislevels around 2015 and kept rising. In fact, housing affordability is one of the main concernsamong residents.16 The recovery of rents and prices coincides in time with the expansionof Airbnb. In this paper, we attempt to determine how much of this overlap is causal.
For completeness, in Table 2, we report descriptive statistics of Airbnb listings,housing rents and prices, and sociodemographic characteristics that are used as controls inthe regression analyses. More specifically, we report the BSA means for the years 2012 and2016 for two different samples: all BSAs and High Airbnb Areas (BSAs in the top decileof the Airbnb listings distribution in 2016).
16See ‘El acceso a la vivienda, el principal problema de los barceloneses’ Macedo, G., October 2010.
10

Table 2: Descriptive statistics: Variables’ means across BSA for 2012 and 2016.
2012 2016
All High All HighBSAs Airbnb Areas BSAs Airbnb Areas
Airbnb Count 2.79 13.35 47.84 178.58
Rent (e/m2) 11.83 12.93 16.39 20.19Posted Price (e/m2) 3250 3338 3753 4282Transaction Price (e/m2) 2269 2356 2619 3027
Population 6978 7750 6973 7514Population Density 0.03 0.04 0.03 0.04Mean Age 43.36 42.10 43.69 42.08% of Foreign Population 0.18 0.32 0.17 0.33House Average Occupancy 2.47 2.41 2.48 2.41Unemployment Rate 10.48 10.81 7.80 7.83Income Index 98.37 96.48 102.78 104.58
Notes: Columns 1 and 3 report the mean for all BSAs in 2012 and 2016. Columns 2 and 4 report themeans of High Airbnb Areas (BSAs in the top decile of the Airbnb activity distribution in 2016).
4 Empirical Strategies
4.1 Baseline Specification
Our main analysis consists of estimating the variants of the following fixed-effectsspecification:
(4) log(Yn,t) = βAirbnb countn,t + γXn,t + µn + τt + εn,t
where Yn,t is our measure of housing rents or prices at the BSA level, Airbnb countn,tis the number of active listings in quarter t, τt are time fixed effects, and µn are BSAfixed effects that account for time-invariant neighborhood characteristics. Our dependentvariable log(Yn,t) is the average residual at the BSA-time period level of a (micro-level)regression in which log rents (or log housing prices) are regressed on time dummies andunit characteristics.17 This controls for price changes across neighborhoods that could beexplained by changes in the composition of units rented or sold across BSAs and overtime. For example, it allows us to control for the fact that some BSAs might have agrowing proportion of high-end apartments being sold or rented over time. Throughoutthe regression analyses, we weight BSA-year cells by the relevant number of ads or sales.Standard errors are clustered at the BSA level to account for serial correlation within panelunits (Bertrand et al., 2004).
Our main concern regarding identification is that neighborhoods in which Airbnbactivity grew the most during our period of study might be experiencing processes ofsociodemographic change, which might have a direct impact on housing rents and prices.Specifically, Airbnb has grown the most in central parts of the city that have also beenexperiencing processes of urban revival in the last two decades. We adopt several strategiesto control for the potential confounding effects of gentrification.
First, we introduce in equation 4 a set of time-varying demographic controls at the17We construct a panel on the BSA-year (data from Idealista) and BSA-quarter (transaction prices)
11

BSA level (Xn,t), namely, average age, log of population density, average household occu-pancy rate, unemployment rate, relative income, and percentage of foreign residents. Thisallows us to control for yearly changes in variables associated with processes of gentrifica-tion. In some specifications, we allow for neighborhoods with different characteristics tohave different linear time trends by introducing interactions between a linear time trendand the control variables measured in 2012, i.e., Xn,2012 × t.
Second, a more demanding approach in terms of data is presented in equation 5:
(5) log(Yn,t) = βAirbnb countn,t + γXn,t + µn + τt + ρn × t+ εn,t
which includes the term ρn×t that fits a BSA-specific linear time trend by estimatinginteraction terms between a BSA-specific coefficient (ρn) and a time variable t. This is avery flexible specification since it allows for each BSA to have its own linear time trajectoryin housing rents and prices. Here, the variations that we exploit are deviations from eachBSA’s own specific linear time trend. However, if Airbnb affects not only (rent or price)levels but also trends in these variables, including BSA-specific linear time trends, it willconfound the effect of Airbnb with the BSA-specific time trend (Wolfers, 2006). Thus,we will resort to a procedure previously applied in the taxation (Kleven et al., 2014) andminimum wage (Monras, 2015) literature and estimate linear time trends using data priorto 2013 only (i.e., the pre-Airbnb period). Specifically, the method involves the estimationof the following two equations at a neighborhood-time level:
(6) log(Yn,t) = µn + τt + ρn × t+ εn,t, for t ≤ 2012
(7) ˜log(Yn,t) = βAirbnb countn,t + γXn,t + τt + εn,t, for all t
The first equation predicts the outcome based on BSA dummies, time dummies, andBSA-specific linear time trends. Based on these coefficient estimates, we predict log(Yn,t)for the entire sample years and compute the residuals, ˜log(Yn,t). In the second stage(equation 7), we regress these residuals against Airbnb listings, time dummies and thetime-varying demographic controls (Xn,t).
4.2 Instrumental Variables Fixed-Effects Models
We also estimate equation 4 through two-stage least squares regression using as aninstrument a shift-share variable that combines i) cross-sectional variation across BSAs intourist amenities and ii) aggregate time variation in Airbnb activity.
Starting with the cross-sectional ‘share’ component of the instrument, we build anindex that measures proximity to tourist amenities. To that end, we use TripAdvisor toproduce a complete list of the city’s tourist amenities.18 We then proceed by geolocatingthe tourist amenities and by obtaining the number of reviews in Google to weight theirrelative importance.19 Our measure of tourist amenities is built as follows:
18TripAdvisor is a website that offers tourism-related content. According to the site, it currently hasover 390 million monthly unique visitors. We exclude the more endogenous and less historical amenitiessuch as areas known for restaurants, bars or clubs.
19Although TripAdvisor also provides reviews, these are fewer in number than on Google.
12
(8) TouristAmenitiesn =∑k
1
distn,k∗Reviewsk
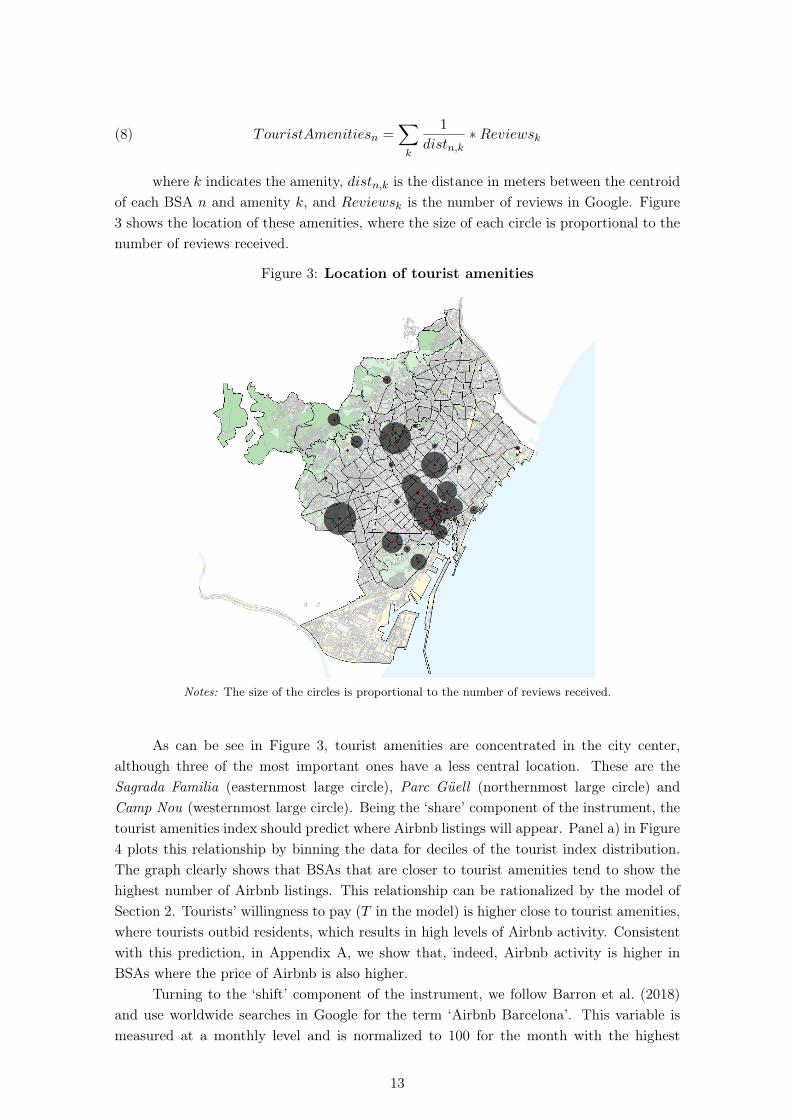
where k indicates the amenity, distn,k is the distance in meters between the centroidof each BSA n and amenity k, and Reviewsk is the number of reviews in Google. Figure3 shows the location of these amenities, where the size of each circle is proportional to thenumber of reviews received.
Figure 3: Location of tourist amenities
Notes: The size of the circles is proportional to the number of reviews received.
As can be see in Figure 3, tourist amenities are concentrated in the city center,although three of the most important ones have a less central location. These are theSagrada Familia (easternmost large circle), Parc Güell (northernmost large circle) andCamp Nou (westernmost large circle). Being the ‘share’ component of the instrument, thetourist amenities index should predict where Airbnb listings will appear. Panel a) in Figure4 plots this relationship by binning the data for deciles of the tourist index distribution.The graph clearly shows that BSAs that are closer to tourist amenities tend to show thehighest number of Airbnb listings. This relationship can be rationalized by the model ofSection 2. Tourists’ willingness to pay (T in the model) is higher close to tourist amenities,where tourists outbid residents, which results in high levels of Airbnb activity. Consistentwith this prediction, in Appendix A, we show that, indeed, Airbnb activity is higher inBSAs where the price of Airbnb is also higher.
Turning to the ‘shift’ component of the instrument, we follow Barron et al. (2018)and use worldwide searches in Google for the term ‘Airbnb Barcelona’. This variable ismeasured at a monthly level and is normalized to 100 for the month with the highest
13

number of searches. Panel b) of Figure 4 shows that the number of Google Trends searchesfor ‘Airbnb Barcelona’ tracks the time variation in Airbnb activity very well.
Figure 4: Airbnb activity, tourist amenities and Google Trends searches.0
50
100
150
200
Airbnb C
ount
4.5 5 5.5 6 6.5 7log TripAdvisor index
(a) Airbnb activity and tourist amenities
0.0
020.0
040.0
060.0
080.0
0
Tre
nd A
irbnb (
dashed lin
e)
05000
10000
15000
Airbnb C
ount (f
ull
line)
2009q1 2011q1 2013q1 2015q1 2017q1quarter
(b) Airbnb activity and Google Trends searches
Notes: Graph (a) shows BSA Airbnb listings as a function of the tourist amenities index (bins are decilesof the tourist amenities distribution). Graph (b) shows the time profile of Airbnb listings (solid line, leftaxis) and Google Trends searches for ‘Airbnb Barcelona’ (dashed line, right axis).
The rationale behind the instrument works as follows. The proximity to touristamenities predicts where Airbnb will locate, while searches in Google Trends for the term‘Airbnb Barcelona’ predict when listings will appear. The relevance of the instrument istestable, and we return to it below. As for instrument validity, recent research on shift-share instruments indicates that the main identification threats are related to the ‘share’component of the instrument (Goldsmith-Pinkham et al., 2018). Since our specificationscontain a BSA fixed effect, instrument validity hinges on the assumption that the cross-sectional ‘share’ component, proximity to tourist amenities, is only correlated with changesin housing rents and prices through Airbnb listings. For example, our instrument wouldbe invalid if residents’ valuation of proximity to tourist amenities (or any other BSA char-acteristic that correlates with it) has changed over the period we study. If the instrumentis valid, proximity to tourist amenities should not explain changes in housing rents andprices prior to the arrival of Airbnb. We address this issue at length below.
4.3 Event study plots
Finally, we also conduct event study exercises by focusing on the High Airbnb Areas(BSAs in the top decile of the Airbnb listings distribution in the last quarter of 2016).20
Then, we perform regressions of the following type:
(9) log(Yn,t) =∑
t6=2012
δt × 1{HighAirbnbArea2016}+ γXn,t + µn + τt + εn,t
where HighAirbnbArea2016 indicates if the BSA belongs to the top decile in the 2016Airbnb listings distribution. As in previous regressions, we include time and BSA fixed ef-fects and time-varying demographic characteristics (Xn,t). We estimateHighAirbnbArea2016
20In robustness tests, we alternatively use the top 5% and the top quartile.
14
× year interactions, leaving 2012 as the base year. Each of these coefficients quantifies theprice difference between the High Airbnb Areas and the control group relative to the 2012difference. Again, we choose 2012 as the last pre-Airbnb year, as starting in 2013, Airbnb’sactivity became more significant. This exercise allows us to check if, prior to the arrival ofAirbnb, High Airbnb Areas showed parallel trends in housing rents and prices comparedto other neighborhoods.
5 Main Results
5.1 Graphical evidence
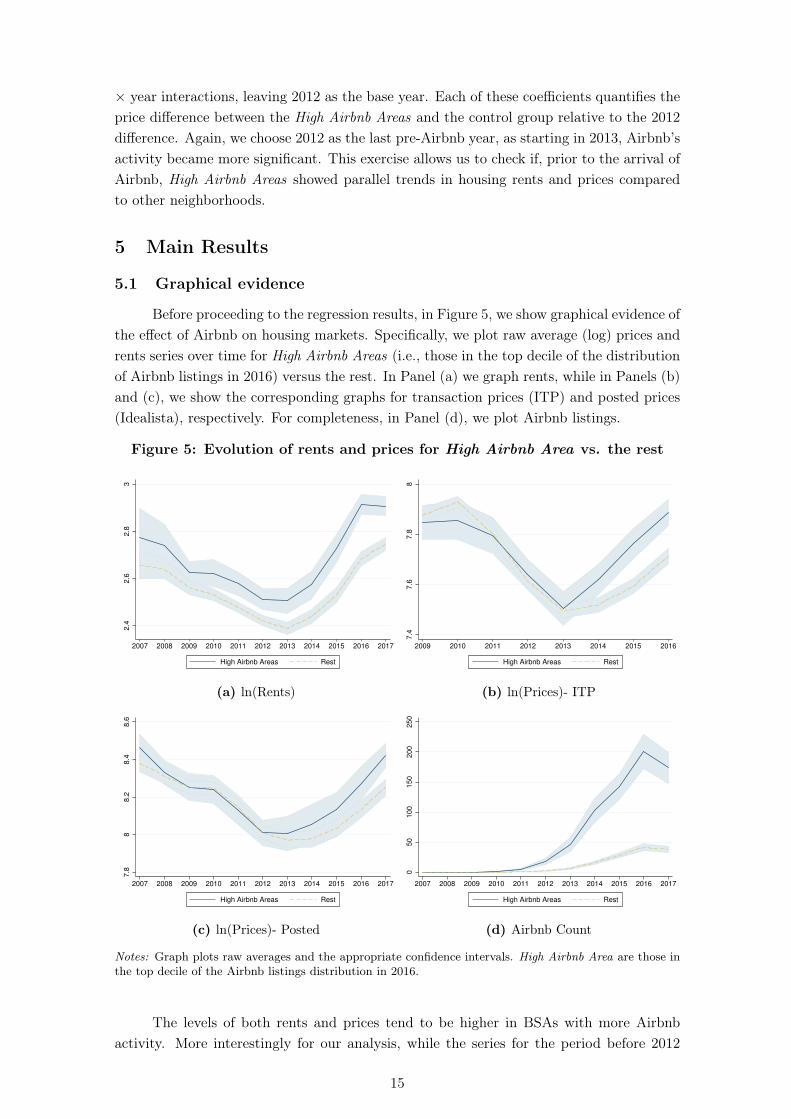
Before proceeding to the regression results, in Figure 5, we show graphical evidence ofthe effect of Airbnb on housing markets. Specifically, we plot raw average (log) prices andrents series over time for High Airbnb Areas (i.e., those in the top decile of the distributionof Airbnb listings in 2016) versus the rest. In Panel (a) we graph rents, while in Panels (b)and (c), we show the corresponding graphs for transaction prices (ITP) and posted prices(Idealista), respectively. For completeness, in Panel (d), we plot Airbnb listings.
Figure 5: Evolution of rents and prices for High Airbnb Area vs. the rest
2.4
2.6
2.8
3
2007 2008 2009 2010 2011 2012 2013 2014 2015 2016 2017
High Airbnb Areas Rest
(a) ln(Rents)
7.4
7.6
7.8
8
2009 2010 2011 2012 2013 2014 2015 2016
High Airbnb Areas Rest
(b) ln(Prices)- ITP
7.8
88.2
8.4
8.6
2007 2008 2009 2010 2011 2012 2013 2014 2015 2016 2017
High Airbnb Areas Rest
(c) ln(Prices)- Posted
050
100
150
200
250
2007 2008 2009 2010 2011 2012 2013 2014 2015 2016 2017
High Airbnb Areas Rest
(d) Airbnb Count
Notes: Graph plots raw averages and the appropriate confidence intervals. High Airbnb Area are those inthe top decile of the Airbnb listings distribution in 2016.
The levels of both rents and prices tend to be higher in BSAs with more Airbnbactivity. More interestingly for our analysis, while the series for the period before 2012
15
appear fairly parallel, the gaps in rents and prices seem to widen, coinciding with theexpansion of Airbnb in 2013 and onwards, especially for rents and transaction prices,where the divergence is more noticeable. In the first three figures, the difference betweenthe two groups is statistically significant at the end of the period, while this is not the casefor the first years. Finally, in Panel (d), we report the evolution of the count of Airbnblistings by group. It can be seen that while the number of listings increased drasticallyfor the High Airbnb Areas, the increase was very modest for the other BSAs, reflecting thefact that Airbnb is highly concentrated in particular areas of the city.
These graphs are suggestive evidence that neighborhoods experiencing higher Airbnbpenetration experienced higher rents and prices growth with the arrival and expansion ofAirbnb. Nevertheless, since these series might be affected by other confounding factorsthat could be biasing the results, we move to our main empirical strategies described inSection 4.
5.2 Results for baseline specifications
In Table 3, we report our baseline results for the impact of Airbnb on rents (PanelA) and prices (Panels B and C). As explained above, throughout the table, the dependentvariable is the average BSA-time period residual of a micro regression in which log rents(or log prices) are regressed on housing characteristics and time dummies.
In column 1, we regress the outcome of interest against the number of Airbnb listingswhile controlling only for time and BSA-fixed effects. Then, in column 2, we add BSAtime-varying demographic controls. Coefficients are positive and significant for both rentsand prices, which implies that an increase in the number of listings translates into anincrease in rents and prices. The effects on prices are larger than on rents, especially fortransaction prices (ITP). It is interesting to observe that the presence of contemporaneousdemographic controls has no large impact on the estimates for rents, while it slightlydecreases coefficients for prices, although not in a statistically significant way. Nevertheless,we keep the demographic controls in subsequent specifications for the sake of completeness.
In column 3, we include differential demographic linear time trends by introducinginteractions between a linear time trend and the control variables measured in 2012, i.e.,Xn,2012 × t. The coefficients for prices are somewhat reduced, while they remain fairlyconstant for rents. In column 4, we report the results of specifications that fit BSA-specifictime trends as described in equation 5. These allow for both observable and unobservablecharacteristics to impact neighborhood trends. Doing so increases the coefficient for rents(though not significantly) and reduces the coefficients for prices, especially for posted priceswhere the coefficient becomes nonsignificant. However, as mentioned before, one caveat ofthis approach is that if Airbnb impacts rent and price trends rather than levels, the BSAfixed effects will absorb part of the Airbnb effect on the outcomes.
In column 5, we repeat the analysis after detrending the data following the proceduredescribed in equations 6 and 7. In a first step, the pre-Airbnb data are used to estimateBSA-specific time trends, which are then used to detrend all data points. Here, the coeffi-cient for rents slightly decreases and gets closer to the specifications reported in columns 1and 2. For prices, they both increase with respect to columns 3 and 4, and their magnitudebecomes more similar to each other.
Across the different specifications, the results indicate that higher Airbnb penetrationleads to increases in both rents and prices, with the effects on prices being larger than for
16
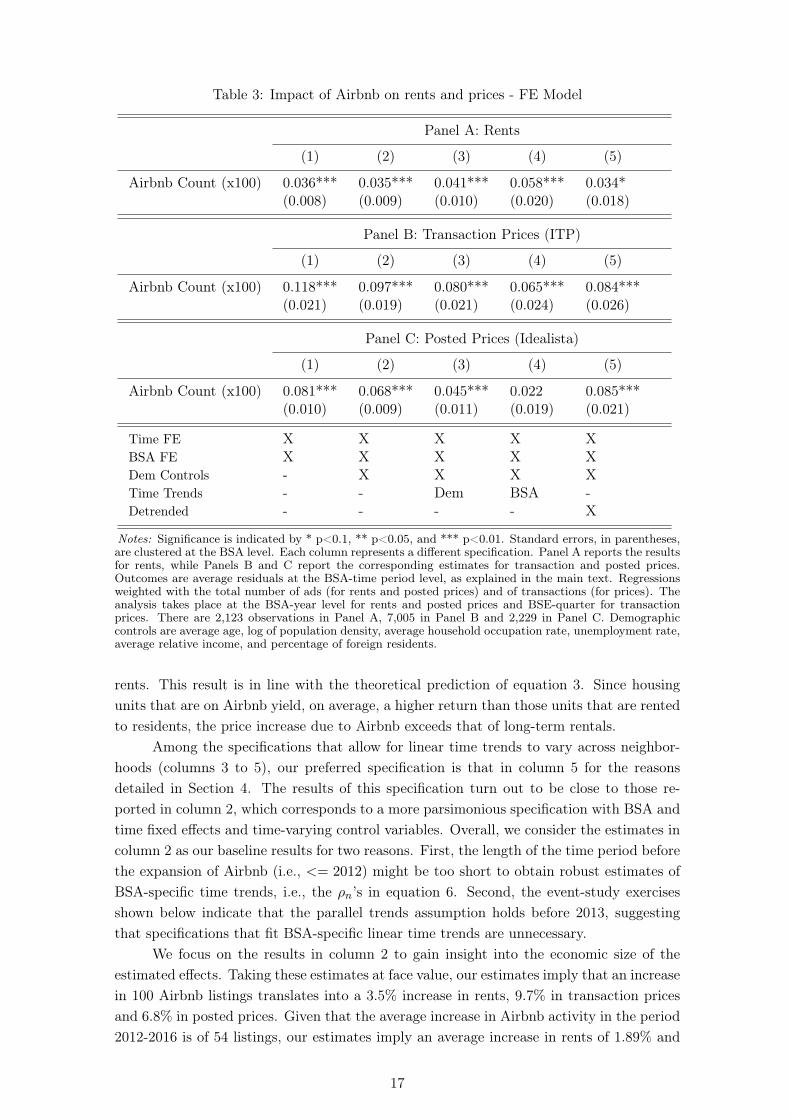
Table 3: Impact of Airbnb on rents and prices - FE Model
Panel A: Rents
(1) (2) (3) (4) (5)
Airbnb Count (x100) 0.036*** 0.035*** 0.041*** 0.058*** 0.034*(0.008) (0.009) (0.010) (0.020) (0.018)
Panel B: Transaction Prices (ITP)
(1) (2) (3) (4) (5)
Airbnb Count (x100) 0.118*** 0.097*** 0.080*** 0.065*** 0.084***(0.021) (0.019) (0.021) (0.024) (0.026)
Panel C: Posted Prices (Idealista)
(1) (2) (3) (4) (5)
Airbnb Count (x100) 0.081*** 0.068*** 0.045*** 0.022 0.085***(0.010) (0.009) (0.011) (0.019) (0.021)
Time FE X X X X XBSA FE X X X X XDem Controls - X X X XTime Trends - - Dem BSA -Detrended - - - - X
Notes: Significance is indicated by * p<0.1, ** p<0.05, and *** p<0.01. Standard errors, in parentheses,are clustered at the BSA level. Each column represents a different specification. Panel A reports the resultsfor rents, while Panels B and C report the corresponding estimates for transaction and posted prices.Outcomes are average residuals at the BSA-time period level, as explained in the main text. Regressionsweighted with the total number of ads (for rents and posted prices) and of transactions (for prices). Theanalysis takes place at the BSA-year level for rents and posted prices and BSE-quarter for transactionprices. There are 2,123 observations in Panel A, 7,005 in Panel B and 2,229 in Panel C. Demographiccontrols are average age, log of population density, average household occupation rate, unemployment rate,average relative income, and percentage of foreign residents.
rents. This result is in line with the theoretical prediction of equation 3. Since housingunits that are on Airbnb yield, on average, a higher return than those units that are rentedto residents, the price increase due to Airbnb exceeds that of long-term rentals.
Among the specifications that allow for linear time trends to vary across neighbor-hoods (columns 3 to 5), our preferred specification is that in column 5 for the reasonsdetailed in Section 4. The results of this specification turn out to be close to those re-ported in column 2, which corresponds to a more parsimonious specification with BSA andtime fixed effects and time-varying control variables. Overall, we consider the estimates incolumn 2 as our baseline results for two reasons. First, the length of the time period beforethe expansion of Airbnb (i.e., <= 2012) might be too short to obtain robust estimates ofBSA-specific time trends, i.e., the ρn’s in equation 6. Second, the event-study exercisesshown below indicate that the parallel trends assumption holds before 2013, suggestingthat specifications that fit BSA-specific linear time trends are unnecessary.
We focus on the results in column 2 to gain insight into the economic size of theestimated effects. Taking these estimates at face value, our estimates imply that an increasein 100 Airbnb listings translates into a 3.5% increase in rents, 9.7% in transaction pricesand 6.8% in posted prices. Given that the average increase in Airbnb activity in the period2012-2016 is of 54 listings, our estimates imply an average increase in rents of 1.89% and
17
increases in transaction and posted prices of about 5.24% and 3.67%, respectively.The large degree of heterogeneity in Airbnb activity across BSAs implies that Airbnb
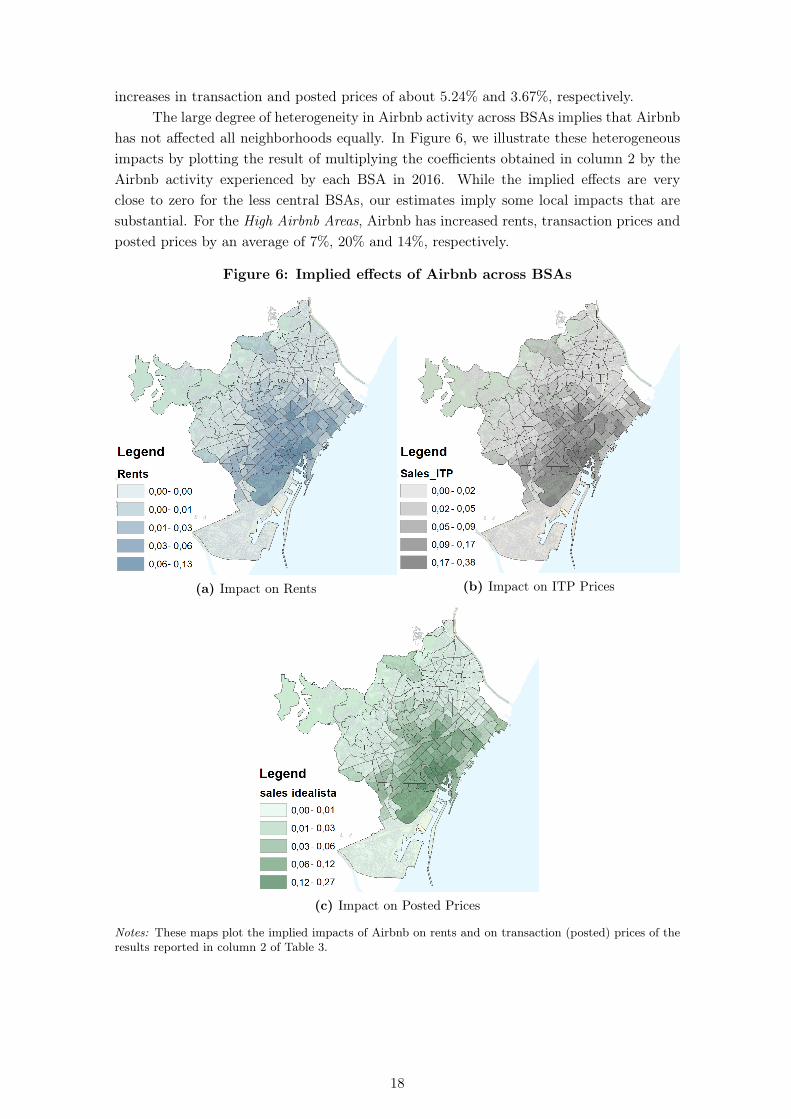
has not affected all neighborhoods equally. In Figure 6, we illustrate these heterogeneousimpacts by plotting the result of multiplying the coefficients obtained in column 2 by theAirbnb activity experienced by each BSA in 2016. While the implied effects are veryclose to zero for the less central BSAs, our estimates imply some local impacts that aresubstantial. For the High Airbnb Areas, Airbnb has increased rents, transaction prices andposted prices by an average of 7%, 20% and 14%, respectively.
Figure 6: Implied effects of Airbnb across BSAs
(a) Impact on Rents (b) Impact on ITP Prices
(c) Impact on Posted Prices
Notes: These maps plot the implied impacts of Airbnb on rents and on transaction (posted) prices of theresults reported in column 2 of Table 3.
18
5.3 Robustness checks
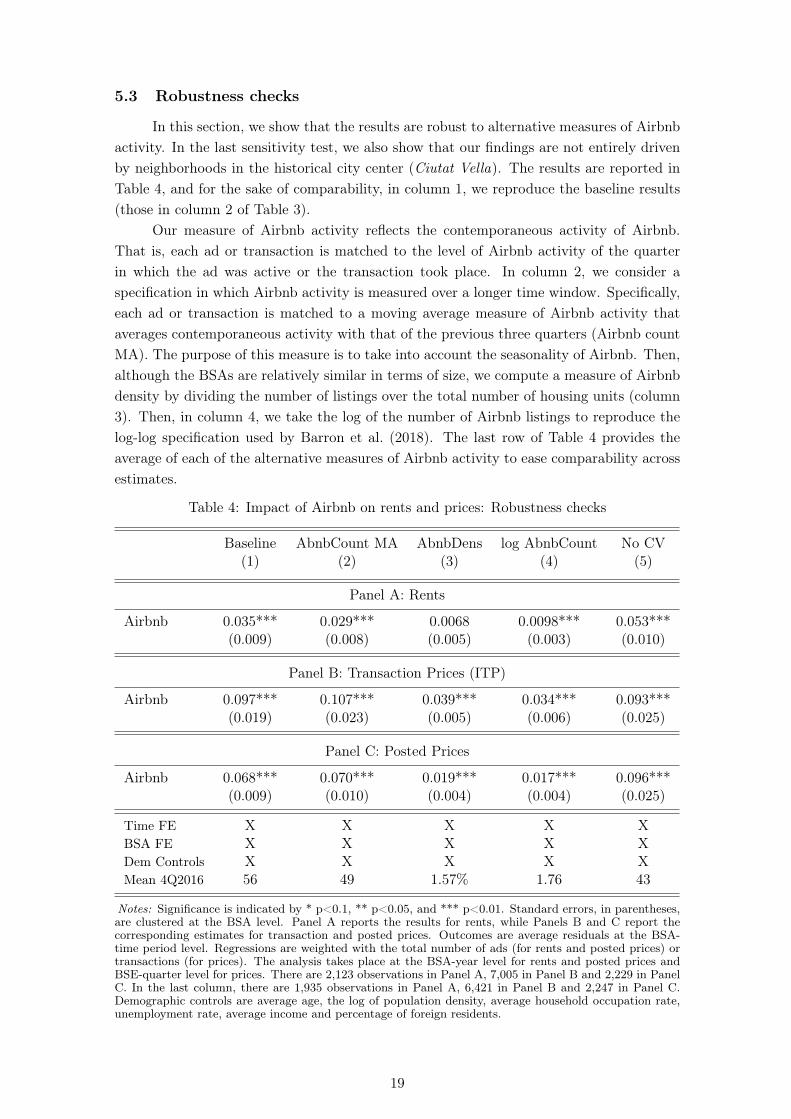
In this section, we show that the results are robust to alternative measures of Airbnbactivity. In the last sensitivity test, we also show that our findings are not entirely drivenby neighborhoods in the historical city center (Ciutat Vella). The results are reported inTable 4, and for the sake of comparability, in column 1, we reproduce the baseline results(those in column 2 of Table 3).
Our measure of Airbnb activity reflects the contemporaneous activity of Airbnb.That is, each ad or transaction is matched to the level of Airbnb activity of the quarterin which the ad was active or the transaction took place. In column 2, we consider aspecification in which Airbnb activity is measured over a longer time window. Specifically,each ad or transaction is matched to a moving average measure of Airbnb activity thataverages contemporaneous activity with that of the previous three quarters (Airbnb countMA). The purpose of this measure is to take into account the seasonality of Airbnb. Then,although the BSAs are relatively similar in terms of size, we compute a measure of Airbnbdensity by dividing the number of listings over the total number of housing units (column3). Then, in column 4, we take the log of the number of Airbnb listings to reproduce thelog-log specification used by Barron et al. (2018). The last row of Table 4 provides theaverage of each of the alternative measures of Airbnb activity to ease comparability acrossestimates.
Table 4: Impact of Airbnb on rents and prices: Robustness checks
Baseline AbnbCount MA AbnbDens log AbnbCount No CV(1) (2) (3) (4) (5)
Panel A: Rents
Airbnb 0.035*** 0.029*** 0.0068 0.0098*** 0.053***(0.009) (0.008) (0.005) (0.003) (0.010)
Panel B: Transaction Prices (ITP)
Airbnb 0.097*** 0.107*** 0.039*** 0.034*** 0.093***(0.019) (0.023) (0.005) (0.006) (0.025)
Panel C: Posted Prices
Airbnb 0.068*** 0.070*** 0.019*** 0.017*** 0.096***(0.009) (0.010) (0.004) (0.004) (0.025)
Time FE X X X X XBSA FE X X X X XDem Controls X X X X XMean 4Q2016 56 49 1.57% 1.76 43
Notes: Significance is indicated by * p<0.1, ** p<0.05, and *** p<0.01. Standard errors, in parentheses,are clustered at the BSA level. Panel A reports the results for rents, while Panels B and C report thecorresponding estimates for transaction and posted prices. Outcomes are average residuals at the BSA-time period level. Regressions are weighted with the total number of ads (for rents and posted prices) ortransactions (for prices). The analysis takes place at the BSA-year level for rents and posted prices andBSE-quarter level for prices. There are 2,123 observations in Panel A, 7,005 in Panel B and 2,229 in PanelC. In the last column, there are 1,935 observations in Panel A, 6,421 in Panel B and 2,247 in Panel C.Demographic controls are average age, the log of population density, average household occupation rate,unemployment rate, average income and percentage of foreign residents.
19
Overall, our findings are robust to using alternative measures of Airbnb activity.Interestingly, and despite the underlying differences between the two studies, our results(reported in column 4) are similar in magnitude to those found by Barron et al. (2018) forthe US. They find that a 1% increase in Airbnb listings increases housing rents and pricesby 0.018% and 0.026%, respectively. Our estimates are a bit lower for rents (0.0098), whileBarron et al. (2018)’s estimate for housing prices is in between our estimates for postedprices (0.017) and transaction prices (0.034). Finally, in column 5, we drop all BSAs fromCiutat Vella. The results indicate that our findings are not driven by some specific BSAsin the city center with very extreme levels of Airbnb activity.
5.4 Mechanisms
As we have shown above, Airbnb in Barcelona is mostly a commercial activity. Hence,as the model in Section 2 clarifies, the main mechanism behind the increase in rents andhousing prices is most likely a reduction in the supply of long-term rentals. To providedirect evidence of this mechanism, one would ideally look at the number of units rented toresidents. Since these data are not available, we examine instead the number of households,which includes both owner and renter households.21
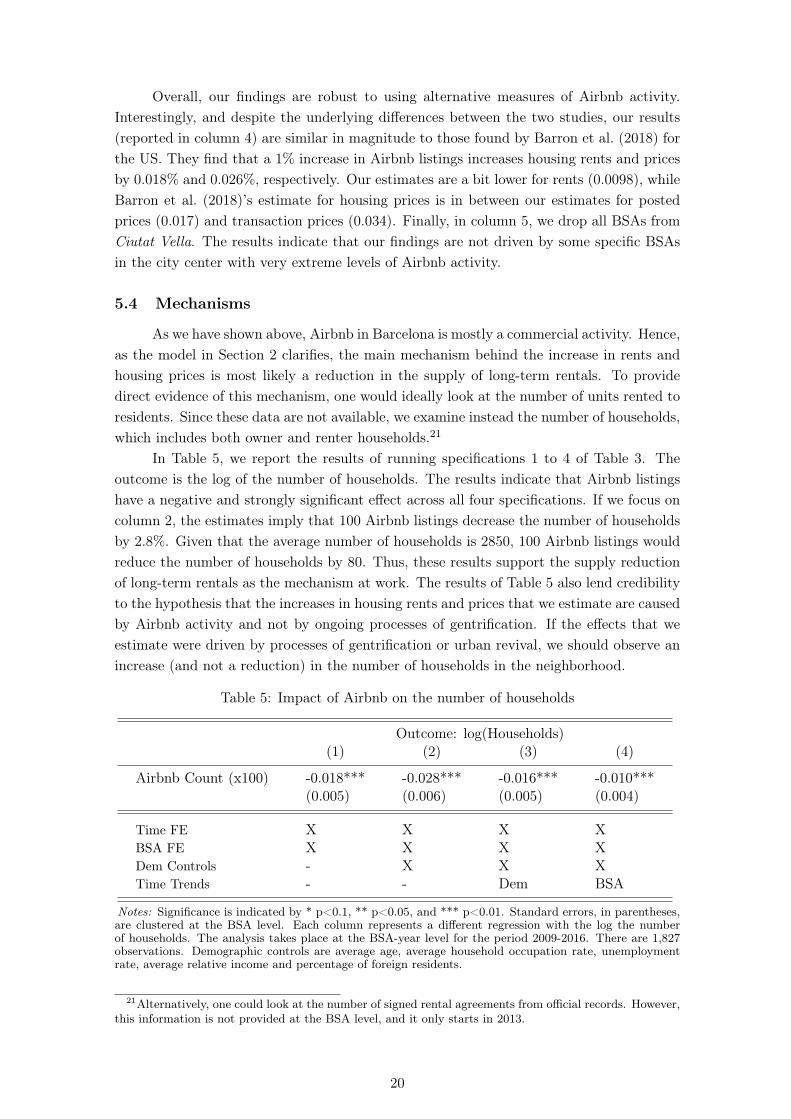
In Table 5, we report the results of running specifications 1 to 4 of Table 3. Theoutcome is the log of the number of households. The results indicate that Airbnb listingshave a negative and strongly significant effect across all four specifications. If we focus oncolumn 2, the estimates imply that 100 Airbnb listings decrease the number of householdsby 2.8%. Given that the average number of households is 2850, 100 Airbnb listings wouldreduce the number of households by 80. Thus, these results support the supply reductionof long-term rentals as the mechanism at work. The results of Table 5 also lend credibilityto the hypothesis that the increases in housing rents and prices that we estimate are causedby Airbnb activity and not by ongoing processes of gentrification. If the effects that weestimate were driven by processes of gentrification or urban revival, we should observe anincrease (and not a reduction) in the number of households in the neighborhood.
Table 5: Impact of Airbnb on the number of households
Outcome: log(Households)(1) (2) (3) (4)
Airbnb Count (x100) -0.018*** -0.028*** -0.016*** -0.010***(0.005) (0.006) (0.005) (0.004)
Time FE X X X XBSA FE X X X XDem Controls - X X XTime Trends - - Dem BSA
Notes: Significance is indicated by * p<0.1, ** p<0.05, and *** p<0.01. Standard errors, in parentheses,are clustered at the BSA level. Each column represents a different regression with the log the numberof households. The analysis takes place at the BSA-year level for the period 2009-2016. There are 1,827observations. Demographic controls are average age, average household occupation rate, unemploymentrate, average relative income and percentage of foreign residents.
21Alternatively, one could look at the number of signed rental agreements from official records. However,this information is not provided at the BSA level, and it only starts in 2013.
20
6 Results for alternative empirical strategies
6.1 Instrumental Variable results
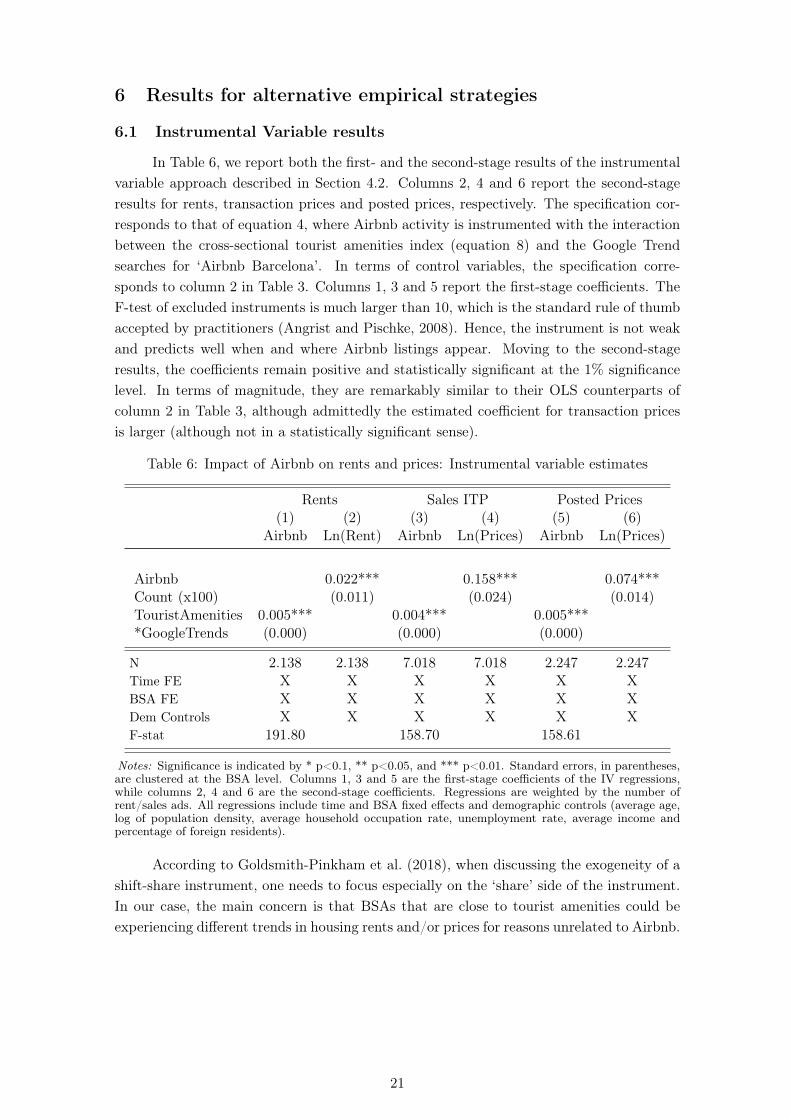
In Table 6, we report both the first- and the second-stage results of the instrumentalvariable approach described in Section 4.2. Columns 2, 4 and 6 report the second-stageresults for rents, transaction prices and posted prices, respectively. The specification cor-responds to that of equation 4, where Airbnb activity is instrumented with the interactionbetween the cross-sectional tourist amenities index (equation 8) and the Google Trendsearches for ‘Airbnb Barcelona’. In terms of control variables, the specification corre-sponds to column 2 in Table 3. Columns 1, 3 and 5 report the first-stage coefficients. TheF-test of excluded instruments is much larger than 10, which is the standard rule of thumbaccepted by practitioners (Angrist and Pischke, 2008). Hence, the instrument is not weakand predicts well when and where Airbnb listings appear. Moving to the second-stageresults, the coefficients remain positive and statistically significant at the 1% significancelevel. In terms of magnitude, they are remarkably similar to their OLS counterparts ofcolumn 2 in Table 3, although admittedly the estimated coefficient for transaction pricesis larger (although not in a statistically significant sense).
Table 6: Impact of Airbnb on rents and prices: Instrumental variable estimates
Rents Sales ITP Posted Prices(1) (2) (3) (4) (5) (6)
Airbnb Ln(Rent) Airbnb Ln(Prices) Airbnb Ln(Prices)
AirbnbCount (x100)
0.022*** 0.158*** 0.074***(0.011) (0.024) (0.014)
TouristAmenities*GoogleTrends
0.005*** 0.004*** 0.005***(0.000) (0.000) (0.000)
N 2.138 2.138 7.018 7.018 2.247 2.247Time FE X X X X X XBSA FE X X X X X XDem Controls X X X X X XF-stat 191.80 158.70 158.61
Notes: Significance is indicated by * p<0.1, ** p<0.05, and *** p<0.01. Standard errors, in parentheses,are clustered at the BSA level. Columns 1, 3 and 5 are the first-stage coefficients of the IV regressions,while columns 2, 4 and 6 are the second-stage coefficients. Regressions are weighted by the number ofrent/sales ads. All regressions include time and BSA fixed effects and demographic controls (average age,log of population density, average household occupation rate, unemployment rate, average income andpercentage of foreign residents).
According to Goldsmith-Pinkham et al. (2018), when discussing the exogeneity of ashift-share instrument, one needs to focus especially on the ‘share’ side of the instrument.In our case, the main concern is that BSAs that are close to tourist amenities could beexperiencing different trends in housing rents and/or prices for reasons unrelated to Airbnb.
21
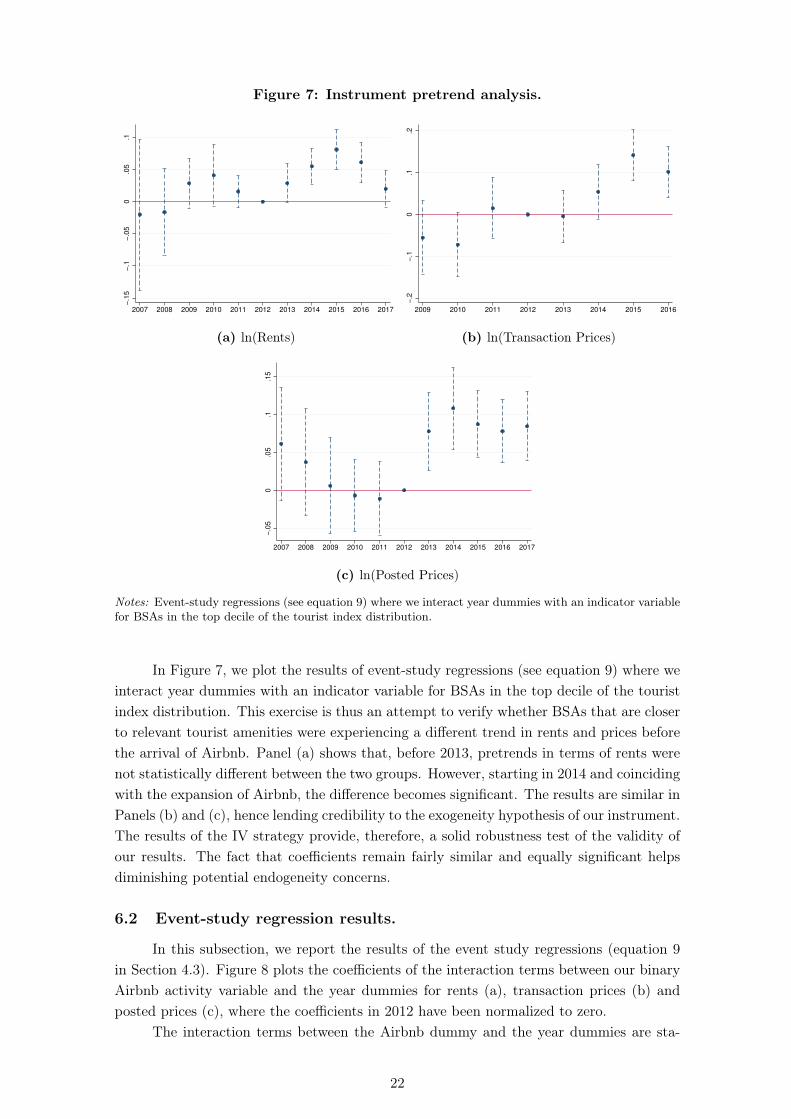
Figure 7: Instrument pretrend analysis.
−.1
5−
.1−
.05
0.0
5.1
2007 2008 2009 2010 2011 2012 2013 2014 2015 2016 2017
(a) ln(Rents)
−.2
−.1
0.1
.2
2009 2010 2011 2012 2013 2014 2015 2016
(b) ln(Transaction Prices)
−.0
50
.05
.1.1
5
2007 2008 2009 2010 2011 2012 2013 2014 2015 2016 2017
(c) ln(Posted Prices)
Notes: Event-study regressions (see equation 9) where we interact year dummies with an indicator variablefor BSAs in the top decile of the tourist index distribution.
In Figure 7, we plot the results of event-study regressions (see equation 9) where weinteract year dummies with an indicator variable for BSAs in the top decile of the touristindex distribution. This exercise is thus an attempt to verify whether BSAs that are closerto relevant tourist amenities were experiencing a different trend in rents and prices beforethe arrival of Airbnb. Panel (a) shows that, before 2013, pretrends in terms of rents werenot statistically different between the two groups. However, starting in 2014 and coincidingwith the expansion of Airbnb, the difference becomes significant. The results are similar inPanels (b) and (c), hence lending credibility to the exogeneity hypothesis of our instrument.The results of the IV strategy provide, therefore, a solid robustness test of the validity ofour results. The fact that coefficients remain fairly similar and equally significant helpsdiminishing potential endogeneity concerns.
6.2 Event-study regression results.
In this subsection, we report the results of the event study regressions (equation 9in Section 4.3). Figure 8 plots the coefficients of the interaction terms between our binaryAirbnb activity variable and the year dummies for rents (a), transaction prices (b) andposted prices (c), where the coefficients in 2012 have been normalized to zero.
The interaction terms between the Airbnb dummy and the year dummies are sta-
22
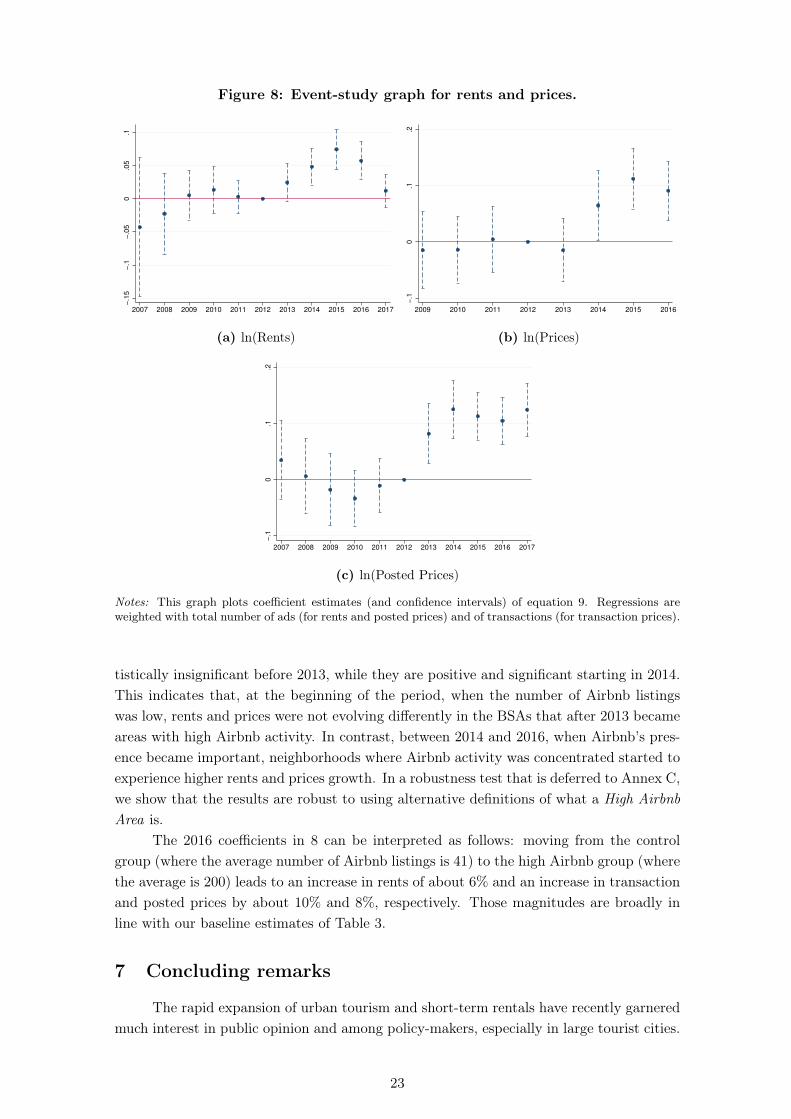
Figure 8: Event-study graph for rents and prices.
−.1
5−
.1−
.05
0.0
5.1
2007 2008 2009 2010 2011 2012 2013 2014 2015 2016 2017
(a) ln(Rents)
−.1
0.1
.2
2009 2010 2011 2012 2013 2014 2015 2016
(b) ln(Prices)
−.1
0.1
.2
2007 2008 2009 2010 2011 2012 2013 2014 2015 2016 2017
(c) ln(Posted Prices)
Notes: This graph plots coefficient estimates (and confidence intervals) of equation 9. Regressions areweighted with total number of ads (for rents and posted prices) and of transactions (for transaction prices).
tistically insignificant before 2013, while they are positive and significant starting in 2014.This indicates that, at the beginning of the period, when the number of Airbnb listingswas low, rents and prices were not evolving differently in the BSAs that after 2013 becameareas with high Airbnb activity. In contrast, between 2014 and 2016, when Airbnb’s pres-ence became important, neighborhoods where Airbnb activity was concentrated started toexperience higher rents and prices growth. In a robustness test that is deferred to Annex C,we show that the results are robust to using alternative definitions of what a High AirbnbArea is.
The 2016 coefficients in 8 can be interpreted as follows: moving from the controlgroup (where the average number of Airbnb listings is 41) to the high Airbnb group (wherethe average is 200) leads to an increase in rents of about 6% and an increase in transactionand posted prices by about 10% and 8%, respectively. Those magnitudes are broadly inline with our baseline estimates of Table 3.
7 Concluding remarks
The rapid expansion of urban tourism and short-term rentals have recently garneredmuch interest in public opinion and among policy-makers, especially in large tourist cities.
23
In fact, concerns about the potential negative consequences of these phenomena have ledlocal administrations to apply a wide range of regulatory measures.
To study how Airbnb affects the city’s housing markets, we examine high-qualitymicrodata on both rents and prices and combine these data with information on the locationof Airbnb activity within the city. We apply several regression-based approaches thatexploit the timing and geography of the entry of Airbnb in the city to estimate the effectsof this platform on the city’s housing markets. The results show that Airbnb activity inBarcelona has led to an increase both in rents and housing prices, with the effects for pricesbeing larger than those for rents. Our preferred results indicate that, for a neighborhoodwith the average Airbnb activity in the city, rents have increased by 1.9%, while transaction(posted) prices have increased by 5.3% (3.7%).
Although the effects on rents are not small, they cannot explain the bulk of the highaggregate increases in rents that the city has experienced between 2012 and 2016. However,in the most tourist parts of the city, the effects of Airbnb are substantial. In High AirbnbAreas (BSAs in the top decile of the Airbnb activity distribution), rents are estimated tohave increased by as much as 7%, while increases in transaction and posted prices are ashigh as 19% and 14%, respectively.
Short-term rental platforms such as Airbnb might worsen the housing affordabilityproblem in cities such as Barcelona, where tourism is large in magnitude and the differencein profitability between renting long-term to residents or short-term to tourists is high.Our findings can contribute to a more informed debate about the consequences of Airbnband the desirability and design of policies that aim to limit the size of the short-term rentalmarket.
24
References
Angrist, J. D. and J.-S. Pischke (2008): Mostly Harmless Econometrics: An Empiri-cist’s Companion, Princeton University Press.
Barron, K., E. Kung, and D. Proserpio (2018): “The Effect of Home-Sharing onHouse Prices and Rents: Evidence from Airbnb,” SSRN Electronic Journal.
Baum-Snow, N. and D. A. Hartley (2016): “Accounting for Central NeighborhoodChange, 1980-2010,” FRB of Chicago Working Paper No. WP-2016-9.
Behrens, C., B. Boualam, J. Martin, and F. Mayneris (2018): “Gentrification andpioneer businesses,” CEPR Discussion Papers.
Bertrand, M., E. Duflo, and S. Mullainathan (2004): “How Much Should WeTrust Differences-In-Differences Estimates?*,” The Quarterly Journal of Economics, 119,249–275.
Chapelle, G. and J. Eymeoud (2018): “Can Big Data increases our knowledge of therental market?” Sciences Po Mimeo.
Couture, V. and J. Handbury (2016): “Urban revival in America, 2000 to 2010,”University of Pennsylvania. Memo.
Goldsmith-Pinkham, P., I. Sorkin, and H. Swift (2018): “Bartik instruments:What, when, why, and how,” Tech. rep., National Bureau of Economic Research.
González-Pampillón, N., J. Jofre-Monseny, and E. Viladecans-Marsal (2019):“Can Urban Renewal Policies Reverse Neighborhood Ethnic Dynamics?” Journal ofEconomic Geography, forthcoming.
Kleven, H. J., C. Landais, and E. Schultz (2014): “Migration and Wage Effectsof Taxing Top Earners: Evidence from the Foreigners’ Tax Scheme in Denmark,” TheQuarterly Journal of Economics, 129, 333–378.
Koster, H., J. van Ommeren, and N. Volkhausen (2018): “Short-term rentals andthe housing market: Quasi-experimental evidence from Airbnb in Los Angeles,” CEPRDiscussion Paper 13094.
Monras, J. (2015): “Minimum wages and spatial equilibrium: Theory and evidence,” IZAWorking Paper No. 9460.
Sheppard, S., A. Udell, et al. (2016): “Do Airbnb properties affect house prices,”Williams College Department of Economics Working Papers, 3.
Wolfers, J. (2006): “Did unilateral divorce laws raise divorce rates? A reconciliationand new results,” American Economic Review, 96, 1802–1820.
WTO (2018): “UNWTO Tourism Highlights. 2018 Edition,” Tech. rep., United NationsWorld Tourism Organization.
Zervas, G., D. Proserpio, and J. W. Byers (2017): “The rise of the sharing economy:Estimating the impact of Airbnb on the hotel industry,” Journal of Marketing Research,54, 687–705.
25
Appendix
A Airbnb activity and Airbnb prices
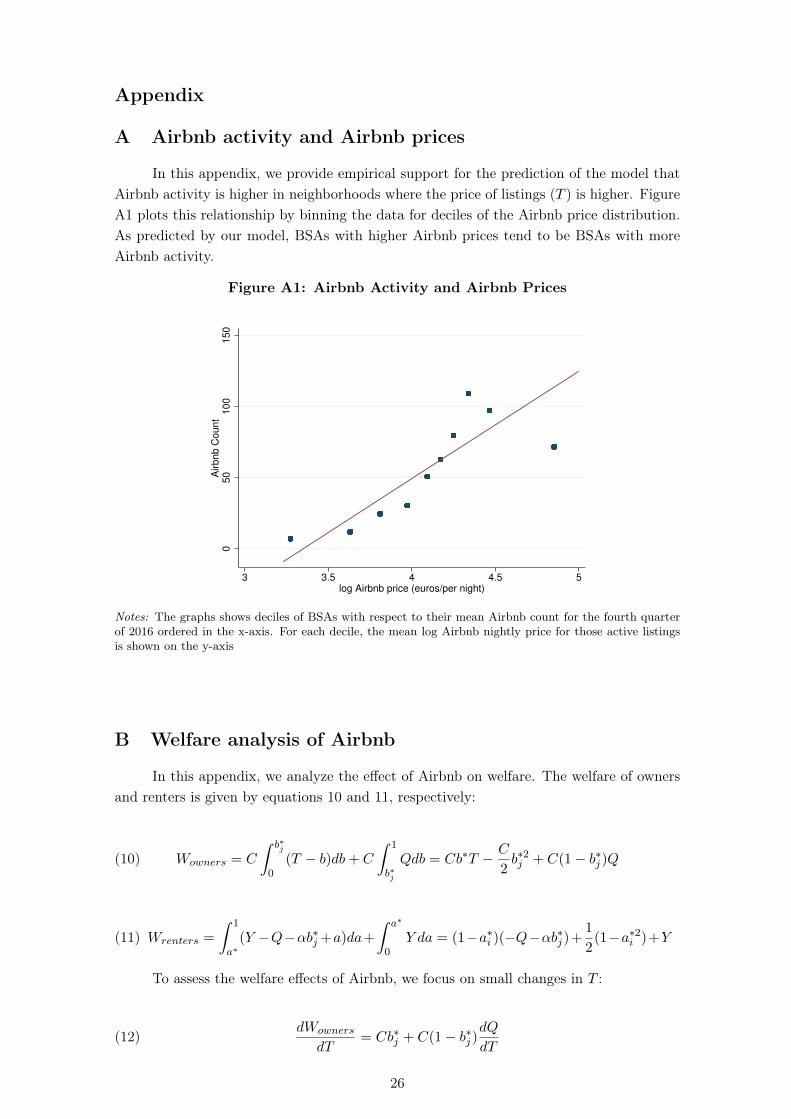
In this appendix, we provide empirical support for the prediction of the model thatAirbnb activity is higher in neighborhoods where the price of listings (T ) is higher. FigureA1 plots this relationship by binning the data for deciles of the Airbnb price distribution.As predicted by our model, BSAs with higher Airbnb prices tend to be BSAs with moreAirbnb activity.
Figure A1: Airbnb Activity and Airbnb Prices
050
100
150
Airbnb C
ount
3 3.5 4 4.5 5log Airbnb price (euros/per night)
Notes: The graphs shows deciles of BSAs with respect to their mean Airbnb count for the fourth quarterof 2016 ordered in the x-axis. For each decile, the mean log Airbnb nightly price for those active listingsis shown on the y-axis
B Welfare analysis of Airbnb
In this appendix, we analyze the effect of Airbnb on welfare. The welfare of ownersand renters is given by equations 10 and 11, respectively:
(10) Wowners = C
∫ b∗j
0(T − b)db+ C
∫ 1
b∗j
Qdb = Cb∗T − C
2b∗2j + C(1− b∗j )Q
(11) Wrenters =
∫ 1
a∗(Y −Q−αb∗j +a)da+
∫ a∗
0Y da = (1−a∗i )(−Q−αb∗j )+
1
2(1−a∗2i )+Y
To assess the welfare effects of Airbnb, we focus on small changes in T :
(12)dWowners
dT= Cb∗j + C(1− b∗j )
dQ
dT
26
(13)dWrenters
dT= −(1− a∗i )
(dQ
dT− α
db∗jdT
)where we have used the fact that T − b∗j = Q and Q = a∗i − αb∗j . Owners’ wel-
fare increases because both short-term and long-term rental rates increase. In contrast,renters’ welfare decreases because of the higher long-term rents and because the negativeexternalities of tourism also increase.
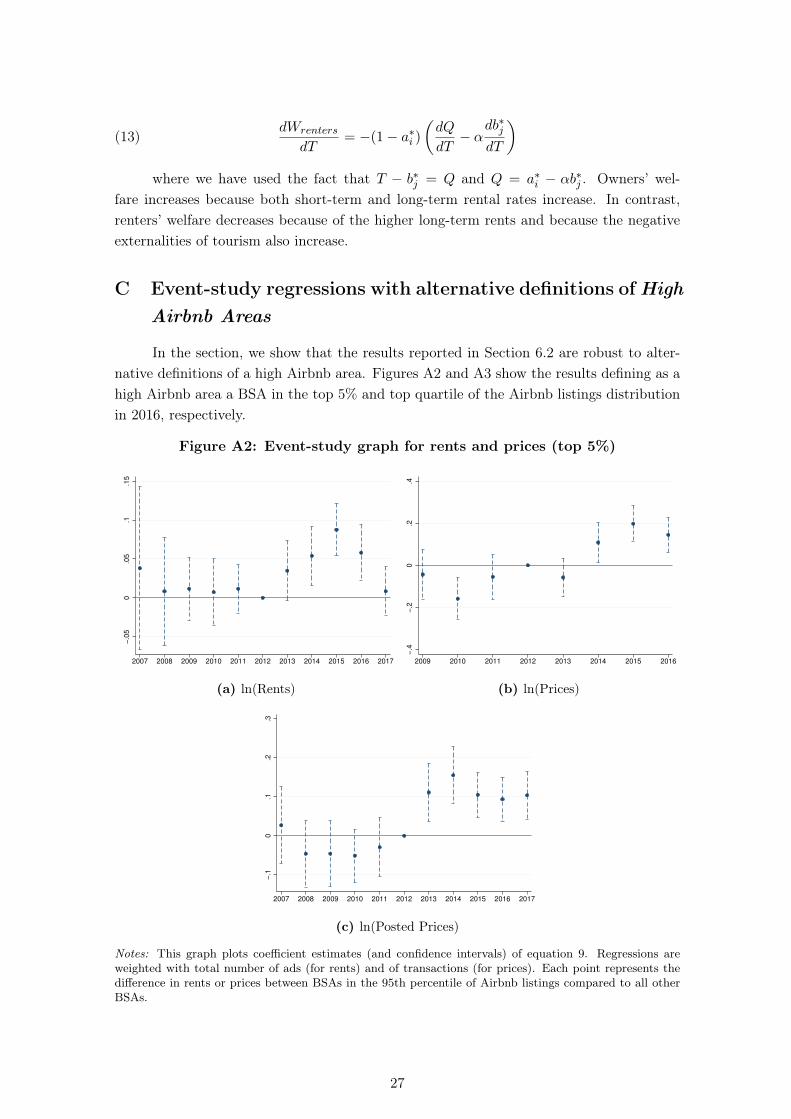
C Event-study regressions with alternative definitions of HighAirbnb Areas
In the section, we show that the results reported in Section 6.2 are robust to alter-native definitions of a high Airbnb area. Figures A2 and A3 show the results defining as ahigh Airbnb area a BSA in the top 5% and top quartile of the Airbnb listings distributionin 2016, respectively.
Figure A2: Event-study graph for rents and prices (top 5%)
−.0
50
.05
.1.1
5
2007 2008 2009 2010 2011 2012 2013 2014 2015 2016 2017
(a) ln(Rents)
−.4
−.2
0.2
.4
2009 2010 2011 2012 2013 2014 2015 2016
(b) ln(Prices)
−.1
0.1
.2.3
2007 2008 2009 2010 2011 2012 2013 2014 2015 2016 2017
(c) ln(Posted Prices)
Notes: This graph plots coefficient estimates (and confidence intervals) of equation 9. Regressions areweighted with total number of ads (for rents) and of transactions (for prices). Each point represents thedifference in rents or prices between BSAs in the 95th percentile of Airbnb listings compared to all otherBSAs.
27
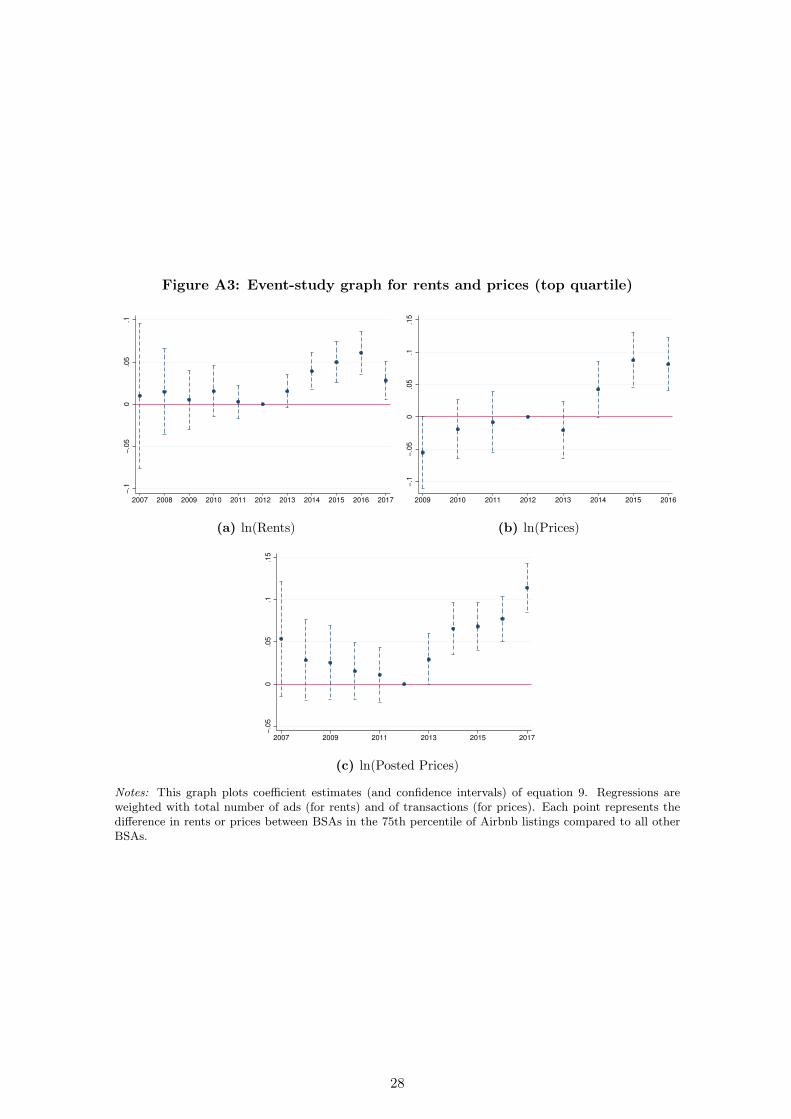
Figure A3: Event-study graph for rents and prices (top quartile)
−.1
−.0
50
.05
.1
2007 2008 2009 2010 2011 2012 2013 2014 2015 2016 2017
(a) ln(Rents)
−.1
−.0
50
.05
.1.1
5
2009 2010 2011 2012 2013 2014 2015 2016
(b) ln(Prices)
−.0
50
.05
.1.1
5
2007 2009 2011 2013 2015 2017
(c) ln(Posted Prices)
Notes: This graph plots coefficient estimates (and confidence intervals) of equation 9. Regressions areweighted with total number of ads (for rents) and of transactions (for prices). Each point represents thedifference in rents or prices between BSAs in the 75th percentile of Airbnb listings compared to all otherBSAs.
28
IEB Working Papers
2013
2013/1, Sánchez-Vidal, M.; González-Val, R.; Viladecans-Marsal, E.: "Sequential city growth in the US: does age
matter?"
2013/2, Hortas Rico, M.: "Sprawl, blight and the role of urban containment policies. Evidence from US cities"
2013/3, Lampón, J.F.; Cabanelas-Lorenzo, P-; Lago-Peñas, S.: "Why firms relocate their production overseas?
The answer lies inside: corporate, logistic and technological determinants"
2013/4, Montolio, D.; Planells, S.: "Does tourism boost criminal activity? Evidence from a top touristic country"
2013/5, Garcia-López, M.A.; Holl, A.; Viladecans-Marsal, E.: "Suburbanization and highways: when the Romans,
the Bourbons and the first cars still shape Spanish cities"
2013/6, Bosch, N.; Espasa, M.; Montolio, D.: "Should large Spanish municipalities be financially compensated?
Costs and benefits of being a capital/central municipality"
2013/7, Escardíbul, J.O.; Mora, T.: "Teacher gender and student performance in mathematics. Evidence from
Catalonia"
2013/8, Arqué-Castells, P.; Viladecans-Marsal, E.: "Banking towards development: evidence from the Spanish
banking expansion plan"
2013/9, Asensio, J.; Gómez-Lobo, A.; Matas, A.: "How effective are policies to reduce gasoline consumption?
Evaluating a quasi-natural experiment in Spain"
2013/10, Jofre-Monseny, J.: "The effects of unemployment benefits on migration in lagging regions"
2013/11, Segarra, A.; García-Quevedo, J.; Teruel, M.: "Financial constraints and the failure of innovation
projects"
2013/12, Jerrim, J.; Choi, A.: "The mathematics skills of school children: How does England compare to the high
performing East Asian jurisdictions?"
2013/13, González-Val, R.; Tirado-Fabregat, D.A.; Viladecans-Marsal, E.: "Market potential and city growth:
Spain 1860-1960"
2013/14, Lundqvist, H.: "Is it worth it? On the returns to holding political office"
2013/15, Ahlfeldt, G.M.; Maennig, W.: "Homevoters vs. leasevoters: a spatial analysis of airport effects"
2013/16, Lampón, J.F.; Lago-Peñas, S.: "Factors behind international relocation and changes in production
geography in the European automobile components industry"
2013/17, Guío, J.M.; Choi, A.: "Evolution of the school failure risk during the 2000 decade in Spain: analysis of
Pisa results with a two-level logistic mode"
2013/18, Dahlby, B.; Rodden, J.: "A political economy model of the vertical fiscal gap and vertical fiscal
imbalances in a federation"
2013/19, Acacia, F.; Cubel, M.: "Strategic voting and happiness"
2013/20, Hellerstein, J.K.; Kutzbach, M.J.; Neumark, D.: "Do labor market networks have an important spatial
dimension?"
2013/21, Pellegrino, G.; Savona, M.: "Is money all? Financing versus knowledge and demand constraints to
innovation"
2013/22, Lin, J.: "Regional resilience"
2013/23, Costa-Campi, M.T.; Duch-Brown, N.; García-Quevedo, J.: "R&D drivers and obstacles to innovation in
the energy industry"
2013/24, Huisman, R.; Stradnic, V.; Westgaard, S.: "Renewable energy and electricity prices: indirect empirical
evidence from hydro power"
2013/25, Dargaud, E.; Mantovani, A.; Reggiani, C.: "The fight against cartels: a transatlantic perspective"
2013/26, Lambertini, L.; Mantovani, A.: "Feedback equilibria in a dynamic renewable resource oligopoly: pre-
emption, voracity and exhaustion"
2013/27, Feld, L.P.; Kalb, A.; Moessinger, M.D.; Osterloh, S.: "Sovereign bond market reactions to fiscal rules
and no-bailout clauses – the Swiss experience"
2013/28, Hilber, C.A.L.; Vermeulen, W.: "The impact of supply constraints on house prices in England"
2013/29, Revelli, F.: "Tax limits and local democracy"
2013/30, Wang, R.; Wang, W.: "Dress-up contest: a dark side of fiscal decentralization"
2013/31, Dargaud, E.; Mantovani, A.; Reggiani, C.: "The fight against cartels: a transatlantic perspective"
2013/32, Saarimaa, T.; Tukiainen, J.: "Local representation and strategic voting: evidence from electoral boundary
reforms"
2013/33, Agasisti, T.; Murtinu, S.: "Are we wasting public money? No! The effects of grants on Italian university
students’ performances"
2013/34, Flacher, D.; Harari-Kermadec, H.; Moulin, L.: "Financing higher education: a contributory scheme"
2013/35, Carozzi, F.; Repetto, L.: "Sending the pork home: birth town bias in transfers to Italian municipalities"
2013/36, Coad, A.; Frankish, J.S.; Roberts, R.G.; Storey, D.J.: "New venture survival and growth: Does the fog
lift?"
2013/37, Giulietti, M.; Grossi, L.; Waterson, M.: "Revenues from storage in a competitive electricity market:
Empirical evidence from Great Britain"
IEB Working Papers
2014
2014/1, Montolio, D.; Planells-Struse, S.: "When police patrols matter. The effect of police proximity on citizens’
crime risk perception"
2014/2, Garcia-López, M.A.; Solé-Ollé, A.; Viladecans-Marsal, E.: "Do land use policies follow road
construction?"
2014/3, Piolatto, A.; Rablen, M.D.: "Prospect theory and tax evasion: a reconsideration of the Yitzhaki puzzle"
2014/4, Cuberes, D.; González-Val, R.: "The effect of the Spanish Reconquest on Iberian Cities"
2014/5, Durán-Cabré, J.M.; Esteller-Moré, E.: "Tax professionals' view of the Spanish tax system: efficiency,
equity and tax planning"
2014/6, Cubel, M.; Sanchez-Pages, S.: "Difference-form group contests"
2014/7, Del Rey, E.; Racionero, M.: "Choosing the type of income-contingent loan: risk-sharing versus risk-
pooling"
2014/8, Torregrosa Hetland, S.: "A fiscal revolution? Progressivity in the Spanish tax system, 1960-1990"
2014/9, Piolatto, A.: "Itemised deductions: a device to reduce tax evasion"
2014/10, Costa, M.T.; García-Quevedo, J.; Segarra, A.: "Energy efficiency determinants: an empirical analysis of
Spanish innovative firms"
2014/11, García-Quevedo, J.; Pellegrino, G.; Savona, M.: "Reviving demand-pull perspectives: the effect of
demand uncertainty and stagnancy on R&D strategy"
2014/12, Calero, J.; Escardíbul, J.O.: "Barriers to non-formal professional training in Spain in periods of economic
growth and crisis. An analysis with special attention to the effect of the previous human capital of workers"
2014/13, Cubel, M.; Sanchez-Pages, S.: "Gender differences and stereotypes in the beauty"
2014/14, Piolatto, A.; Schuett, F.: "Media competition and electoral politics"
2014/15, Montolio, D.; Trillas, F.; Trujillo-Baute, E.: "Regulatory environment and firm performance in EU
telecommunications services"
2014/16, Lopez-Rodriguez, J.; Martinez, D.: "Beyond the R&D effects on innovation: the contribution of non-
R&D activities to TFP growth in the EU"
2014/17, González-Val, R.: "Cross-sectional growth in US cities from 1990 to 2000"
2014/18, Vona, F.; Nicolli, F.: "Energy market liberalization and renewable energy policies in OECD countries"
2014/19, Curto-Grau, M.: "Voters’ responsiveness to public employment policies"
2014/20, Duro, J.A.; Teixidó-Figueras, J.; Padilla, E.: "The causal factors of international inequality in co2
emissions per capita: a regression-based inequality decomposition analysis"
2014/21, Fleten, S.E.; Huisman, R.; Kilic, M.; Pennings, E.; Westgaard, S.: "Electricity futures prices: time
varying sensitivity to fundamentals"
2014/22, Afcha, S.; García-Quevedo, J,: "The impact of R&D subsidies on R&D employment composition"
2014/23, Mir-Artigues, P.; del Río, P.: "Combining tariffs, investment subsidies and soft loans in a renewable
electricity deployment policy"
2014/24, Romero-Jordán, D.; del Río, P.; Peñasco, C.: "Household electricity demand in Spanish regions. Public
policy implications"
2014/25, Salinas, P.: "The effect of decentralization on educational outcomes: real autonomy matters!"
2014/26, Solé-Ollé, A.; Sorribas-Navarro, P.: "Does corruption erode trust in government? Evidence from a recent
surge of local scandals in Spain"
2014/27, Costas-Pérez, E.: "Political corruption and voter turnout: mobilization or disaffection?"
2014/28, Cubel, M.; Nuevo-Chiquero, A.; Sanchez-Pages, S.; Vidal-Fernandez, M.: "Do personality traits affect
productivity? Evidence from the LAB"
2014/29, Teresa Costa, M.T.; Trujillo-Baute, E.: "Retail price effects of feed-in tariff regulation"
2014/30, Kilic, M.; Trujillo-Baute, E.: "The stabilizing effect of hydro reservoir levels on intraday power prices
under wind forecast errors"
2014/31, Costa-Campi, M.T.; Duch-Brown, N.: "The diffusion of patented oil and gas technology with
environmental uses: a forward patent citation analysis"
2014/32, Ramos, R.; Sanromá, E.; Simón, H.: "Public-private sector wage differentials by type of contract:
evidence from Spain"
2014/33, Backus, P.; Esteller-Moré, A.: "Is income redistribution a form of insurance, a public good or both?"
2014/34, Huisman, R.; Trujillo-Baute, E.: "Costs of power supply flexibility: the indirect impact of a Spanish
policy change"
2014/35, Jerrim, J.; Choi, A.; Simancas Rodríguez, R.: "Two-sample two-stage least squares (TSTSLS) estimates
of earnings mobility: how consistent are they?"
2014/36, Mantovani, A.; Tarola, O.; Vergari, C.: "Hedonic quality, social norms, and environmental campaigns"
2014/37, Ferraresi, M.; Galmarini, U.; Rizzo, L.: "Local infrastructures and externalities: Does the size matter?"
2014/38, Ferraresi, M.; Rizzo, L.; Zanardi, A.: "Policy outcomes of single and double-ballot elections"

IEB Working Papers
2015
2015/1, Foremny, D.; Freier, R.; Moessinger, M-D.; Yeter, M.: "Overlapping political budget cycles in the
legislative and the executive"
2015/2, Colombo, L.; Galmarini, U.: "Optimality and distortionary lobbying: regulating tobacco consumption"
2015/3, Pellegrino, G.: "Barriers to innovation: Can firm age help lower them?"
2015/4, Hémet, C.: "Diversity and employment prospects: neighbors matter!"
2015/5, Cubel, M.; Sanchez-Pages, S.: "An axiomatization of difference-form contest success functions"
2015/6, Choi, A.; Jerrim, J.: "The use (and misuse) of Pisa in guiding policy reform: the case of Spain"
2015/7, Durán-Cabré, J.M.; Esteller-Moré, A.; Salvadori, L.: "Empirical evidence on tax cooperation between
sub-central administrations"
2015/8, Batalla-Bejerano, J.; Trujillo-Baute, E.: "Analysing the sensitivity of electricity system operational costs
to deviations in supply and demand"
2015/9, Salvadori, L.: "Does tax enforcement counteract the negative effects of terrorism? A case study of the
Basque Country"
2015/10, Montolio, D.; Planells-Struse, S.: "How time shapes crime: the temporal impacts of football matches on
crime"
2015/11, Piolatto, A.: "Online booking and information: competition and welfare consequences of review
aggregators"
2015/12, Boffa, F.; Pingali, V.; Sala, F.: "Strategic investment in merchant transmission: the impact of capacity
utilization rules"
2015/13, Slemrod, J.: "Tax administration and tax systems"
2015/14, Arqué-Castells, P.; Cartaxo, R.M.; García-Quevedo, J.; Mira Godinho, M.: "How inventor royalty
shares affect patenting and income in Portugal and Spain"
2015/15, Montolio, D.; Planells-Struse, S.: "Measuring the negative externalities of a private leisure activity:
hooligans and pickpockets around the stadium"
2015/16, Batalla-Bejerano, J.; Costa-Campi, M.T.; Trujillo-Baute, E.: "Unexpected consequences of
liberalisation: metering, losses, load profiles and cost settlement in Spain’s electricity system"
2015/17, Batalla-Bejerano, J.; Trujillo-Baute, E.: "Impacts of intermittent renewable generation on electricity
system costs"
2015/18, Costa-Campi, M.T.; Paniagua, J.; Trujillo-Baute, E.: "Are energy market integrations a green light for
FDI?"
2015/19, Jofre-Monseny, J.; Sánchez-Vidal, M.; Viladecans-Marsal, E.: "Big plant closures and agglomeration
economies"
2015/20, Garcia-López, M.A.; Hémet, C.; Viladecans-Marsal, E.: "How does transportation shape
intrametropolitan growth? An answer from the regional express rail"
2015/21, Esteller-Moré, A.; Galmarini, U.; Rizzo, L.: "Fiscal equalization under political pressures"
2015/22, Escardíbul, J.O.; Afcha, S.: "Determinants of doctorate holders’ job satisfaction. An analysis by
employment sector and type of satisfaction in Spain"
2015/23, Aidt, T.; Asatryan, Z.; Badalyan, L.; Heinemann, F.: "Vote buying or (political) business (cycles) as
usual?"
2015/24, Albæk, K.: "A test of the ‘lose it or use it’ hypothesis in labour markets around the world"
2015/25, Angelucci, C.; Russo, A.: "Petty corruption and citizen feedback"
2015/26, Moriconi, S.; Picard, P.M.; Zanaj, S.: "Commodity taxation and regulatory competition"
2015/27, Brekke, K.R.; Garcia Pires, A.J.; Schindler, D.; Schjelderup, G.: "Capital taxation and imperfect
competition: ACE vs. CBIT"
2015/28, Redonda, A.: "Market structure, the functional form of demand and the sensitivity of the vertical reaction
function"
2015/29, Ramos, R.; Sanromá, E.; Simón, H.: "An analysis of wage differentials between full-and part-time
workers in Spain"
2015/30, Garcia-López, M.A.; Pasidis, I.; Viladecans-Marsal, E.: "Express delivery to the suburbs the effects of
transportation in Europe’s heterogeneous cities"
2015/31, Torregrosa, S.: "Bypassing progressive taxation: fraud and base erosion in the Spanish income tax (1970-
2001)"
2015/32, Choi, H.; Choi, A.: "When one door closes: the impact of the hagwon curfew on the consumption of
private tutoring in the republic of Korea"
2015/33, Escardíbul, J.O.; Helmy, N.: "Decentralisation and school autonomy impact on the quality of education:
the case of two MENA countries"
2015/34, González-Val, R.; Marcén, M.: "Divorce and the business cycle: a cross-country analysis"
IEB Working Papers
2015/35, Calero, J.; Choi, A.: "The distribution of skills among the European adult population and unemployment: a
comparative approach"
2015/36, Mediavilla, M.; Zancajo, A.: "Is there real freedom of school choice? An analysis from Chile"
2015/37, Daniele, G.: "Strike one to educate one hundred: organized crime, political selection and politicians’
ability"
2015/38, González-Val, R.; Marcén, M.: "Regional unemployment, marriage, and divorce"
2015/39, Foremny, D.; Jofre-Monseny, J.; Solé-Ollé, A.: "‘Hold that ghost’: using notches to identify manipulation
of population-based grants"
2015/40, Mancebón, M.J.; Ximénez-de-Embún, D.P.; Mediavilla, M.; Gómez-Sancho, J.M.: "Does educational
management model matter? New evidence for Spain by a quasiexperimental approach"
2015/41, Daniele, G.; Geys, B.: "Exposing politicians’ ties to criminal organizations: the effects of local government
dissolutions on electoral outcomes in Southern Italian municipalities"
2015/42, Ooghe, E.: "Wage policies, employment, and redistributive efficiency"
2016
2016/1, Galletta, S.: "Law enforcement, municipal budgets and spillover effects: evidence from a quasi-experiment
in Italy"
2016/2, Flatley, L.; Giulietti, M.; Grossi, L.; Trujillo-Baute, E.; Waterson, M.: "Analysing the potential
economic value of energy storage"
2016/3, Calero, J.; Murillo Huertas, I.P.; Raymond Bara, J.L.: "Education, age and skills: an analysis using the
PIAAC survey"
2016/4, Costa-Campi, M.T.; Daví-Arderius, D.; Trujillo-Baute, E.: "The economic impact of electricity losses"
2016/5, Falck, O.; Heimisch, A.; Wiederhold, S.: "Returns to ICT skills"
2016/6, Halmenschlager, C.; Mantovani, A.: "On the private and social desirability of mixed bundling in
complementary markets with cost savings"
2016/7, Choi, A.; Gil, M.; Mediavilla, M.; Valbuena, J.: "Double toil and trouble: grade retention and academic
performance"
2016/8, González-Val, R.: "Historical urban growth in Europe (1300–1800)"
2016/9, Guio, J.; Choi, A.; Escardíbul, J.O.: "Labor markets, academic performance and the risk of school dropout:
evidence for Spain"
2016/10, Bianchini, S.; Pellegrino, G.; Tamagni, F.: "Innovation strategies and firm growth"
2016/11, Jofre-Monseny, J.; Silva, J.I.; Vázquez-Grenno, J.: "Local labor market effects of public employment"
2016/12, Sanchez-Vidal, M.: "Small shops for sale! The effects of big-box openings on grocery stores"
2016/13, Costa-Campi, M.T.; García-Quevedo, J.; Martínez-Ros, E.: "What are the determinants of investment
in environmental R&D?"
2016/14, García-López, M.A; Hémet, C.; Viladecans-Marsal, E.: "Next train to the polycentric city: The effect of
railroads on subcenter formation"
2016/15, Matas, A.; Raymond, J.L.; Dominguez, A.: "Changes in fuel economy: An analysis of the Spanish car
market"
2016/16, Leme, A.; Escardíbul, J.O.: "The effect of a specialized versus a general upper secondary school
curriculum on students’ performance and inequality. A difference-in-differences cross country comparison"
2016/17, Scandurra, R.I.; Calero, J.: “Modelling adult skills in OECD countries”
2016/18, Fernández-Gutiérrez, M.; Calero, J.: “Leisure and education: insights from a time-use analysis”
2016/19, Del Rio, P.; Mir-Artigues, P.; Trujillo-Baute, E.: “Analysing the impact of renewable energy regulation
on retail electricity prices”
2016/20, Taltavull de la Paz, P.; Juárez, F.; Monllor, P.: “Fuel Poverty: Evidence from housing perspective”
2016/21, Ferraresi, M.; Galmarini, U.; Rizzo, L.; Zanardi, A.: “Switch towards tax centralization in Italy: A wake
up for the local political budget cycle”
2016/22, Ferraresi, M.; Migali, G.; Nordi, F.; Rizzo, L.: “Spatial interaction in local expenditures among Italian
municipalities: evidence from Italy 2001-2011”
2016/23, Daví-Arderius, D.; Sanin, M.E.; Trujillo-Baute, E.: “CO2 content of electricity losses”
2016/24, Arqué-Castells, P.; Viladecans-Marsal, E.: “Banking the unbanked: Evidence from the Spanish banking
expansion plan“
2016/25 Choi, Á.; Gil, M.; Mediavilla, M.; Valbuena, J.: “The evolution of educational inequalities in Spain:
Dynamic evidence from repeated cross-sections”
2016/26, Brutti, Z.: “Cities drifting apart: Heterogeneous outcomes of decentralizing public education”
2016/27, Backus, P.; Cubel, M.; Guid, M.; Sánchez-Pages, S.; Lopez Manas, E.: “Gender, competition and
performance: evidence from real tournaments”
2016/28, Costa-Campi, M.T.; Duch-Brown, N.; García-Quevedo, J.: “Innovation strategies of energy firms”
2016/29, Daniele, G.; Dipoppa, G.: “Mafia, elections and violence against politicians”

IEB Working Papers
2016/30, Di Cosmo, V.; Malaguzzi Valeri, L.: “Wind, storage, interconnection and the cost of electricity”
2017
2017/1, González Pampillón, N.; Jofre-Monseny, J.; Viladecans-Marsal, E.: “Can urban renewal policies reverse
neighborhood ethnic dynamics?”
2017/2, Gómez San Román, T.: “Integration of DERs on power systems: challenges and opportunities”
2017/3, Bianchini, S.; Pellegrino, G.: “Innovation persistence and employment dynamics”
2017/4, Curto‐Grau, M.; Solé‐Ollé, A.; Sorribas‐Navarro, P.: “Does electoral competition curb party favoritism?”
2017/5, Solé‐Ollé, A.; Viladecans-Marsal, E.: “Housing booms and busts and local fiscal policy”
2017/6, Esteller, A.; Piolatto, A.; Rablen, M.D.: “Taxing high-income earners: Tax avoidance and mobility”
2017/7, Combes, P.P.; Duranton, G.; Gobillon, L.: “The production function for housing: Evidence from France”
2017/8, Nepal, R.; Cram, L.; Jamasb, T.; Sen, A.: “Small systems, big targets: power sector reforms and renewable
energy development in small electricity systems”
2017/9, Carozzi, F.; Repetto, L.: “Distributive politics inside the city? The political economy of Spain’s plan E”
2017/10, Neisser, C.: “The elasticity of taxable income: A meta-regression analysis”
2017/11, Baker, E.; Bosetti, V.; Salo, A.: “Finding common ground when experts disagree: robust portfolio decision
analysis”
2017/12, Murillo, I.P; Raymond, J.L; Calero, J.: “Efficiency in the transformation of schooling into competences:
A cross-country analysis using PIAAC data”
2017/13, Ferrer-Esteban, G.; Mediavilla, M.: “The more educated, the more engaged? An analysis of social capital
and education”
2017/14, Sanchis-Guarner, R.: “Decomposing the impact of immigration on house prices”
2017/15, Schwab, T.; Todtenhaupt, M.: “Spillover from the haven: Cross-border externalities of patent box regimes
within multinational firms”
2017/16, Chacón, M.; Jensen, J.: “The institutional determinants of Southern secession”
2017/17, Gancia, G.; Ponzetto, G.A.M.; Ventura, J.: “Globalization and political structure”
2017/18, González-Val, R.: “City size distribution and space”
2017/19, García-Quevedo, J.; Mas-Verdú, F.; Pellegrino, G.: “What firms don’t know can hurt them: Overcoming
a lack of information on technology”
2017/20, Costa-Campi, M.T.; García-Quevedo, J.: “Why do manufacturing industries invest in energy R&D?”
2017/21, Costa-Campi, M.T.; García-Quevedo, J.; Trujillo-Baute, E.: “Electricity regulation and economic
growth”
2018
2018/1, Boadway, R.; Pestieau, P.: “The tenuous case for an annual wealth tax”
2018/2, Garcia-López, M.À.: “All roads lead to Rome ... and to sprawl? Evidence from European cities”
2018/3, Daniele, G.; Galletta, S.; Geys, B.: “Abandon ship? Party brands and politicians’ responses to a political
scandal”
2018/4, Cavalcanti, F.; Daniele, G.; Galletta, S.: “Popularity shocks and political selection”
2018/5, Naval, J.; Silva, J. I.; Vázquez-Grenno, J.: “Employment effects of on-the-job human capital acquisition”
2018/6, Agrawal, D. R.; Foremny, D.: “Relocation of the rich: migration in response to top tax rate changes from
spanish reforms”
2018/7, García-Quevedo, J.; Kesidou, E.; Martínez-Ros, E.: “Inter-industry differences in organisational eco-
innovation: a panel data study”
2018/8, Aastveit, K. A.; Anundsen, A. K.: “Asymmetric effects of monetary policy in regional housing markets”
2018/9, Curci, F.; Masera, F.: “Flight from urban blight: lead poisoning, crime and suburbanization”
2018/10, Grossi, L.; Nan, F.: “The influence of renewables on electricity price forecasting: a robust approach”
2018/11, Fleckinger, P.; Glachant, M.; Tamokoué Kamga, P.-H.: “Energy performance certificates and
investments in building energy efficiency: a theoretical analysis”
2018/12, van den Bergh, J. C.J.M.; Angelsen, A.; Baranzini, A.; Botzen, W.J. W.; Carattini, S.; Drews, S.;
Dunlop, T.; Galbraith, E.; Gsottbauer, E.; Howarth, R. B.; Padilla, E.; Roca, J.; Schmidt, R.: “Parallel tracks
towards a global treaty on carbon pricing”
2018/13, Ayllón, S.; Nollenberger, N.: “The unequal opportunity for skills acquisition during the Great Recession in
Europe”
2018/14, Firmino, J.: “Class composition effects and school welfare: evidence from Portugal using panel data”
2018/15, Durán-Cabré, J. M.; Esteller-Moré, A.; Mas-Montserrat, M.; Salvadori, L.: “La brecha fiscal: estudio
y aplicación a los impuestos sobre la riqueza”
IEB Working Papers
2018/16, Montolio, D.; Tur-Prats, A.: “Long-lasting social capital and its impact on economic development: the
legacy of the commons”
2018/17, Garcia-López, M. À.; Moreno-Monroy, A. I.: “Income segregation in monocentric and polycentric cities:
does urban form really matter?”
2018/18, Di Cosmo, V.; Trujillo-Baute, E.: “From forward to spot prices: producers, retailers and loss averse
consumers in electricity markets”
2018/19, Brachowicz Quintanilla, N.; Vall Castelló, J.: “Is changing the minimum legal drinking age an effective
policy tool?”
2018/20, Nerea Gómez-Fernández, Mauro Mediavilla: “Do information and communication technologies (ICT)
improve educational outcomes? Evidence for Spain in PISA 2015”
2018/21, Montolio, D.; Taberner, P. A.: “Gender differences under test pressure and their impact on academic
performance: a quasi-experimental design”
2018/22, Rice, C.; Vall Castelló, J.: “Hit where it hurts – healthcare access and intimate partner violence”
2018/23, Ramos, R.; Sanromá, E.; Simón, H.: “Wage differentials by bargaining regime in Spain (2002-2014). An
analysis using matched employer-employee data”
2019
2019/1, Mediavilla, M.; Mancebón, M. J.; Gómez-Sancho, J. M.; Pires Jiménez, L.: “Bilingual education and
school choice: a case study of public secondary schools in the Spanish region of Madrid”
2019/2, Brutti, Z.; Montolio, D.: “Preventing criminal minds: early education access and adult offending behavior”
2019/3, Montalvo, J. G.; Piolatto, A.; Raya, J.: “Transaction-tax evasion in the housing market”
2019/4, Durán-Cabré, J.M.; Esteller-Moré, A.; Mas-Montserrat, M.: “Behavioural responses to the
re)introduction of wealth taxes. Evidence from Spain”