Embed Size (px)
Citation preview

Portland State UniversityPDXScholar
Dissertations and Theses Dissertations and Theses
1992
Identifying Quality Function Deployment's Variables, Outcomes,Their Relationships, and Guidelines for Practitioners in theAmerican Automotive IndustryGeoffrey Paul GilmorePortland State University
Let us know how access to this document benefits you.Follow this and additional works at: http://pdxscholar.library.pdx.edu/open_access_etds
This Dissertation is brought to you for free and open access. It has been accepted for inclusion in Dissertations and Theses by an authorizedadministrator of PDXScholar. For more information, please contact [email protected].
Recommended CitationGilmore, Geoffrey Paul, "Identifying Quality Function Deployment's Variables, Outcomes, Their Relationships, and Guidelines forPractitioners in the American Automotive Industry" (1992). Dissertations and Theses. Paper 1157.
10.15760/etd.1156
IDENTIFYING QUALITY FUNCTION DEPLOYMENT'S VARIABLES,
OUTCOMES, THEIR RELATIONSHIPS, AND GUIDELINES
FOR PRACTITIONERS IN THE AMERICAN
AUTOMOTIVE INDUSTRY
by
GEOFFREY PAUL GILMORE
A dissertation submitted in partial fulfillmentof the requirements for the degree of
DOCTOR OF PHILOSOPHYl.n
SYSTEMS SCIENCE:BUSINESS ADMINISTRATION
Portland State University@ 1992
TO THE OFFICE OF GRADUATE STUDIES:
The members of the Committee approve the dissertation
of Geoffrey Paul Gilmore presented April 22, 1992.
David Gerbing
APPROVED:
Roy W. ,Koch, Director, Systems Science Ph.D. Program
C. Wllllam Savery, Vlce Pr cst for Graduate Studles
AN ABSTRACT OF THE DISSERTATION OF Geoffrey Paul Gilmore for
the Doctor of Philosophy in Systems Science: Business
Administration presented April 22, 1992.
Title: Identifying Quality Function Deployment's Variables,
Outcomes, Their Relationships, and Guidelines for
Practitioners in the American Automotive Industry
APPROVED BY THE MEMBERS OF THE DISSERTATION COMMITTEE:
David Ge-rbing
Tom R. Gillpatrick '. .~
Harold A. Linstone
Ba rry F. Anderson
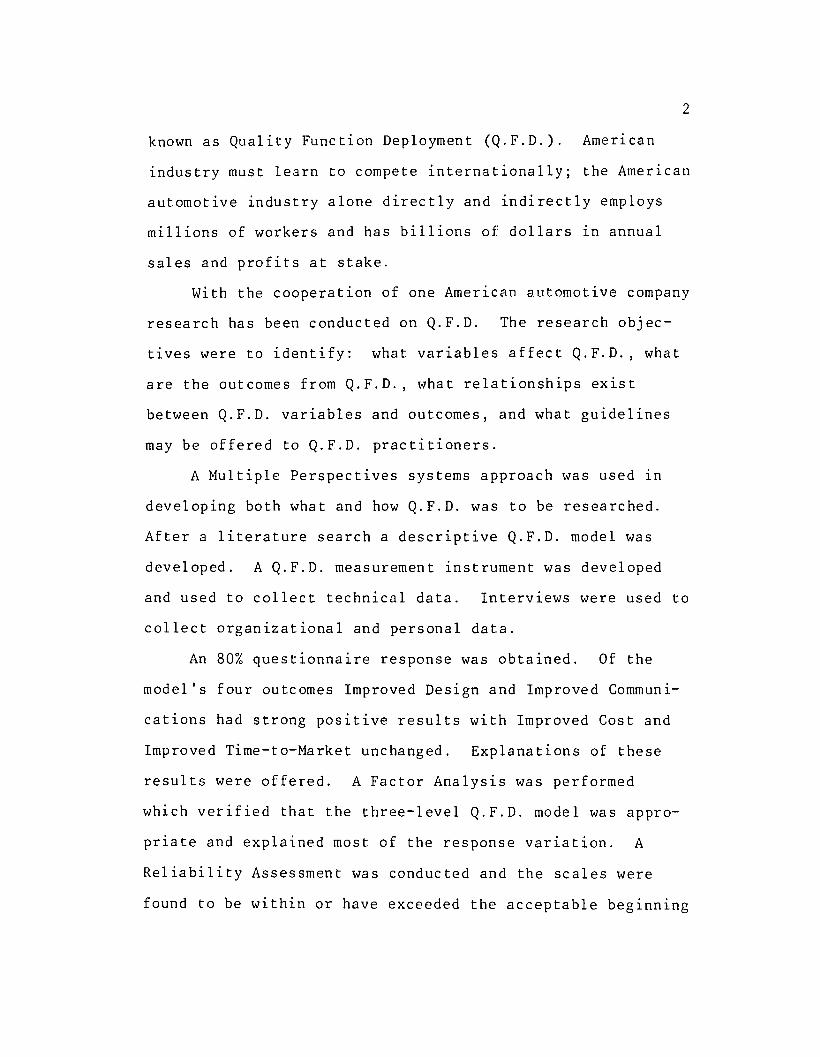
American industry is about nlne to 12 years behind in
utilizing a new product development and introduction process
2
known as Quality Function Deployment (Q.F.D.). American
industry must learn to compete internationally; the American
automotive industry alone directly and indirectly employs
millions of workers and has billions of dollars in annual
sales and profits at stake.
With the cooperation of one American automotive company
research has been conducted on Q.F.D. The research objec
tives were to identify: what variables affect Q.F.D., what
are the outcomes from Q.F.D., what relationships exist
between Q.F.D. variables and outcomes, and what guidelines
may be offered to Q.F.D. practitioners.
A Multiple Perspectives systems approach was used in
developing both what and how Q.F.D. was to be researched.
After a literature search a descriptive Q.F.D. model was
developed. A Q.F.D. measurement instrument was developed
and used to collect technical data. Interviews were used to
collect organizational and personal data.
An 80% questionnaire response was obtained. Of the
model's four outcomes Improved Design and Improved Communi
cations had strong positive results with Improved Cost and
Improved Time-to-Market unchanged. Explanations of these
results were offered. A Factor Analysis was performed
which verified that the three-level Q.F.D. model was appro
priate and explained most of the response variation. A
Reliability Assessment was conducted and the scales were
found to be within or have exceeded the acceptable beginning

3
research coefficient alpha range. A MANOVA Analysis was
conducted, and five of the 17 Q.F.D. model's variables were
identified as candidates for deletion for this company's
present Q.F.D. system. A Ratio Data Assessment was con
ducted and used to develop five guidelines for this
company's practitioners.
Organizational and Personal Data Assessments were
conducted and their similarities with the Technical Data
Assessment were noted. Top Management Commitment, Customer
Information Availability, Team Composition and Dynamics and
Project Completion Time were identified as important similar
Q.F.D. variable findings. Improved Design and Improved
Communications were identified as important similar Q.F.D.
outcomes. No major discontinuities between the three
assessments were found.
Research conclusions, contributions and future research
work were identified.

ACKNOWLEDGEMENTS
First and foremost I would like to extend my special
appreciation and gratitude to my wife, Sue, and my son,
Alex, for their patience and understanding during my
doctoral course work and dissertation; their support was
crucial to completing both.
Second I would like to extend my thanks to: Dr. Alan
Raedels for his project coordination and guidance and his
proofreading of my multiple dissertation drafts, Dr. Hal
Linstone for his Multiple Perspectives Approach and guidance
in its use, Dr. Dave Gerbing for his statistical assistance
and Dr. Tom Gillpatrick for his research design methodology
assistance.
Third I would like to extend my appreciation to Dr. W.
Edwards Deming for his special mentoring and professional
review of this dissertation work.
Finally I would like to recognize the American auto
motive company which allowed me access to their information;
Oregon Cutting Systems for their questionnaire pretrial
help; and Reynolds Metal, Tektronix and Warn Industries for
their financial support.

TABLE OF CONTENTS
FACE
ACKNOWLEDGEMENTS
LIST OF TABLES .
LIST OF FIGURES
CHAPTER
111 .
V111
x.
I INTRODUCTION TO THE RESEARCH PROBLEM
Introduction
1
1
Quality Function Deployment 1
Research Objective and Questions 11
Boundaries of the Dissertation 12
Significance of the Dissertation 13
Summary and Dissertation Organization 16 I
II REVIEW OF THE LITERATURE AND THERESEARCH MODEL . . 19
In troduc t ion 19
Model Framework 19
Model Elements 21
Technical Variables (Tl-T5) . . . 24Organizational Variables (06-013) 27 I
Personal Variables (P14-P17) 30Outcomes (OUTl-OUT4) 31
Contribution to the Literature 37
Summary . . . . 37

III
IV
DESIGN OF THE RESEARCH
Introduction
Research Hypotheses
Research Methodology
Technical AssessmentOrganizational AssessmentPersonal Assessmen t . . .Integration of Assessments
Summary . . . .
FINDINGS OF THE RESEARCH
v
39
39
40
43
43555758
59
61
Introduction 61
Model Review 61
Technical Assessment Findings 62
Questionnaire Response.. 62Q.F.D. Variables' Descriptive
Statistics and Histograms . 62Discussion on Design Findings 64Discussion on Cost Findings 66Discussion on Time Findings 68Discussion on Communication
Findings 69Discussion on Integration
of Findings . . . . . . . 70Q.F.D. Outcomes' Descriptive
Statistics and Histograms 71Design Findings. . . . 71Cost Findings . . . . . 72Time Findings . . . . . 72Communication Findings . 73Discussion on Integration
of Finding s . . . . . 73Q.F.D. Variables Factor Analyses. 74Reliability Assessment 80MANOVA Analyses . . . . 81Discussion . . . . . . 83Ratio Data Assessment. . . . 84Discussion on Chart Size (T2) . . 85Discussion on Customer Information
Availability (T3) . . . . 86Discussion on Competitive
Information Availability (T4) 87

Discussion onDiscussion on
Leve 1 (011)Discussion on
Time (012)
Team Size (09)Implementation
Project Completion
Vl
87
88
88
Organizational Assessment Findings 89
Ideal Q.F.D. Project Scenario 90Outstanding/Successful Q.F.D.
Proj ec t . . . . . . . . . . 91Typical Q.F.D. Project 95Difficult/Unusual Q.F.D. Project 97
Personal Assessment Findings 100
Outstanding/Successful Q.F.D.Project: Key Individuals'Descriptions . . . . . . . 100
Typical Q.F.D. Proje~t: KeyIndividuals' Descriptions . .. 102
Difficult/Unusual Q.F.D. Project:Key Individuals' Descriptions 103
V
Integration of Assessments
Q.F.D. Variables' Assessments'Similarities . . . . . . . .
Q.F.D. Outcomes' Assessments'Similarities .
Q.F.D. Variables' Assessments'Discontinuities .
Q.F.D. Outcomes' Assessments'Discontinuities
Summary . . . . . . . . . . .
CONCLUSIONS, CONTRIBUTIONS, FUTURERESEARCH RECOMMENDATIONS ANDSUMMARY OF THE RESEARCH
Introduction
Conclusions of the Research
Contributions of the Research
Future Research Recommendations
105
105
106
107
107
107
111
111
111
113
114

REFERENCES
Summary of the Research
Summary
VII
116
122
123
APPENDICES
A THE SUBJECTIVE AND OBJECTIVE QUALITYCONCEPTS. . . . . . . . . . . . 129
B A MULTIPLE PERSPECTIVES OVERVIEW 133
C Q.F.D. QUESTIONNAIRE. . . . . . 138
D ASSOCIATED Q.F.D. QUESTIONNAIRE DOCUMENTS:ONE-WEEK POST CARD FOLLOW-UP, THREE-WEEKCOVER LETTER FOLLOW-UP AND SEVEN-WEEKCOVER LETTER FOLLOW-UP . . . . . . . . . 150
E POTENTIAL QUESTIONS FOR Q.F.D. INTERVIEWS 154
F QUESTIONNAIRE Q.F.D. VARIABLE/OUTCOMEHISTOGRAMS . . . . . . . . . . . 156
G Q.F.D. VARIABLES FACTOR ANALYSES 170
H RELIABILITY MATRICES AND TABLES 207
I MANOVA ANALYSES 220
J RATIO DATA GRAPHS 278
K DR. W. EDWARDS DEMING'S REVIEW COMMENTS 285

TABLE
I
II
III
IV
V
VI
VII
VIII
IX
X
LIST OF TABLES
Empty Illustration of Po~ential Q.F.D.
Variables' Descriptive Statistics
Empty Illustration of Po~ential Q.F.D.
Outcomes' Descriptive Statistics
Empty Illustration of Reliability
Assessment Summary
Empty Illustration of Q.F.D. Variables'
and Outcomes' MANOVA Summary
Potential Q.F.D. Variabl~s'
Descriptive Statistics
Potential Q.F.D. Outcome~'
Descriptive Statistics .....
Factor Analyses Multi-Level Comparisons
Model and Factor Analysis Three-Level
Comparisons ....
Reliability Assessment S~mmar~
Q.F.D. Variables' and Outcomes'
MANOVA Summary . . . . . . . . . . . . .
PAGE
51
52
53
54
63
72
75
77
81
82
XI
XII
XIII
XIV
Summary of Ideal Q.F.D. Project's
Organizations, Goals, and
Postures and Procedures .
Summary of Outstanding/Successful Q.F.D.
Project's Organizations, Goals, and
Postures and Procedures . . . .
Summary of Typical Q.F.D. Project's
Organizations, Goals, and
Postures and Procedures
Summary of Difficult/Unusual Q.P.D.
Project's Organizations, Goals,
and Postures and Procedures . .
lX
92
94
96
99
FIGURE
l.
2.
3.
4.
5.
6.
7.
8.
9.
10.
11.
12.
13.
LIST OF FIGURES
Three Types of Quality Features
Typical Q.F.D. Chart ....
Primary Q.F.D. Chart Summary
The Four Basic Q.F.D. Charts/Phases
Annual Number of Japanese Q.F.D.
Case Presentations .
Evolution/Synthesis of Multiple
Perspectives. .... . ...
Q.F.D. Implementation Model's Framework
Potential Q.F.D. Variables and
Their Sources
Potential Q.F.D. Outcomes and
Their Sources
Typical Design Change Process-
Aisen Warner . . . . . . .
Q.F.D. Startup Problem Reduction-
Toyota . . . . . . . . . . . .
Q.F.D. Startup Costs Reduction--Toyota
Questionnaire's Development Process ..
PAGE
3
6
8
9
15
22
23
25
26
32

14.
15.
16.
17.
18.
19.
Q.F.D. Practitioner's Guidelines
Graph Example ....
Model and Factor Analysis Three-Level
Visual Summaries .
Ideal Q.F.D. Project's Organizations
and Relationships ....
Outstanding/Successful Q.F.D. Project's
Organizations and Relationships
Typical Q.F.D. Project's Organizations
and Relationships .
Difficult/Unusual Q.F.D. Project's
Organizations and Relationships ....
Xl
54
78
90
93
95
97
CHAPTER I
INTRODUCTION TO TRE.RESEARCH PROBLEM
INTRODUCTION
This dissertation provides information about Quality
Function Deployment by identifying its variables, outcomes,
their relationships, and some guidelines for practitioners.
A brief description of Quality Function Deployment is
presented in order to aid the reader in understanding the
research problem. Next, the research objective, research
questions and the boundaries of the dissertation are
presented. With the research problem defined, the signifi
cance of the dissertation is discussed and the chapter 1S
summarized. The dissertation's organization is then
presented.
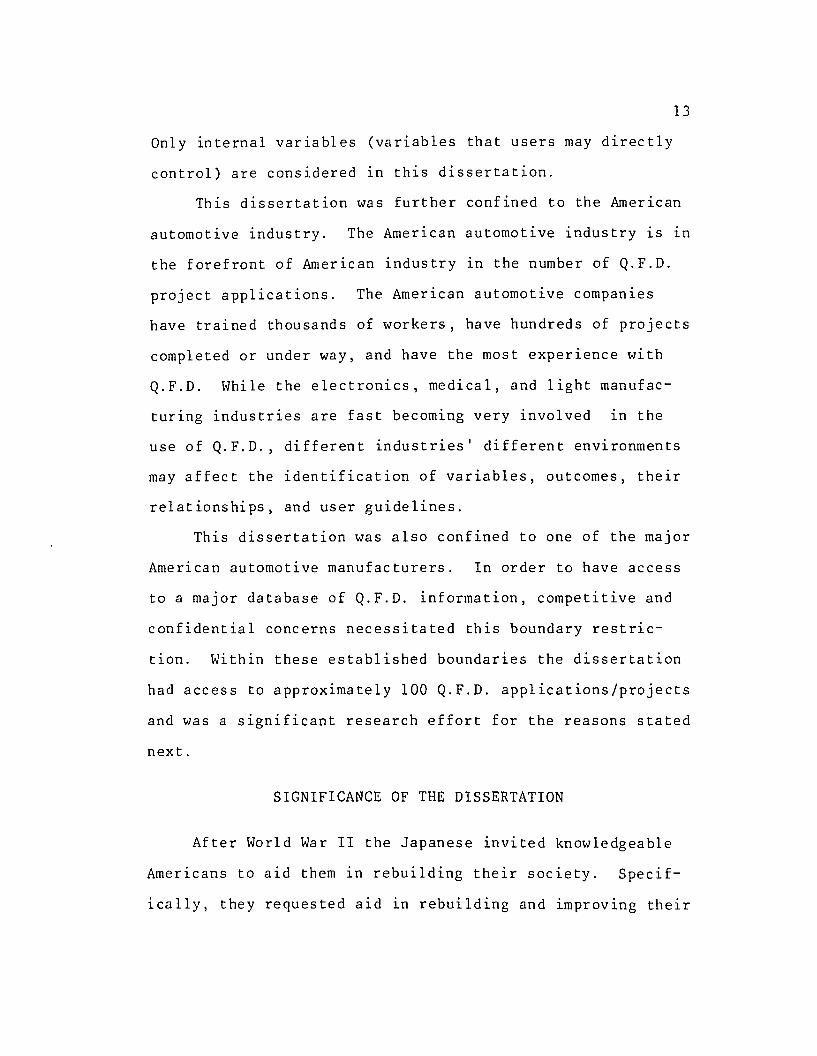
QUALITY FUNCTION DEPLOYMENT
Quality Function Deployment (Q.F.D.) is a product plan
n1ng method for standardizing, connecting, and documenting
each quality assurance step. Q.F.D. aids in understanding
what the customer wants (subjective quality). These wants
are then prioritized and translated into measurable design
and process requirements (objective quality). If the reader

2
1S unfamiliar with the important distinction between
subjective and objective quality concepts, a discussion
1S presented 1n Appendix A.
Q.F.D. may be used to plan the product, design the
product, plan the manufacturing process, and plan the
production controls utilizing prioritized customer needs and
wants. Q.F.D. is cross-functional in nature and assists the
communication of these customer needs and wants to the
company's various departments and employees. Q.F.D. 's
impact is to strengthen a producer's employees' knowledge of
the customer's needs and wants and directly ties this knowl
edge to the employees' work. Therefore, customer satisfac
tion including subjective and objective quality is improved.
The mechanics of the Q.F.D. process help demonstrate how
this occurs.
Q.F.D. first starts out with obtaining the customer
n8eds and wants. Q.F.D. generally considers three types of
customer needs and wants (quality features) (see Figure 1)
(28). First, there are the spoken (expressible) quality
features that the customer can and will tell the producers
about. An example would be: I want an automobile that
seats six people. The second type of customer wants is the
unspoken (expected) quality features that the customer can,
but generally does not, tell the producers about. An
example would be: I want a safe automobile. The customer
expects these items, but seldom voices it. Sometimes

3
Customer Satisfaction
THINGSGONERIGHT
THINGSGONEWRONG
EXPRESSIBLE I• One Dimensional• Most Market
Research FullyAchieved
~e'{\\)'{\s\lO
IEXPECTED ICl Expected or Assumedo Typical of
"Invisible" Products• Functions of the
Product
Very Satisfied'-EX-c-r-T-rN-G--
• PleasantSurprises orCustomerDelights
oUnexpected
Very Dissatisfied
UnspokenDid Not
Doat All (
DegreeofAchievement
Adapted From the Kana Model
Fi~ure 1. Three types of quality features.(2 , 21)

4
producers do not recognlze and/or do not achieve these
expected wants and marketing failures occur. The third type
of customer wants consists of unspoken exciting quality
features. These are new features or ideas that the customer
cannot tell the producer about because they do not even know
about them or their possibility; for example, new product
features utilizing new technologies. The exciting quality
features, over time, may tend to become expressible and even
expected quality features and need to be reassessed period
ically. An example of this quality feature migration is
instant-on television.
In addition to trying to understand these three types
of customer needs and wants, the Q.F.D. users (generally a
cross-functional team) must also listen to potentially more
than one customer's voice. Besides the end user customer's
voice another customer's voice may be the government's or
society's voice--automobiles must be fuel efficient, less
polluting, etc. Another customer's voice may be the
distributors of the final customer product. Yet another
customer's voice may be the assembler/integrator company
utilizing the product. Thus, Q.F.D. considers multiple
customer voices (usually by having separate Q.F.D. charts
for each customer voice).
Since there are many opportunities to misunderstand the
customers and their needs and wants (seats exactly six and
no more? what does safe mean? how important to you is this

5
new feature? which customer to listen to? etc.), this
portion of the Q.F.D. process is systematic and iterative.
Q.F.D. uses affinity grouping and tree diagramming tech
niques to try to ensure that gaps in the company's knowledge
of the customer's needs or wants do not occur. Q.F.D. is
iterative; it uses market research (surveys, focus groups,
product return history, etc.) to ask the customers for
product information. Q.F.D. then reformulates the questions
and/or prototypes and repeats the process, asking the cus
tomers again, reformulating, asking the customers.
The second step of the Q.F.D. process is to translate
these newly determined customer needs and wants into product
design features and to do a competitive analysis. This is
done by placing the customer needs and wants (written in
customer language) horizontally down a chart. Vertically
across the top of the chart are listed the design features
or characteristics that the designers believe will impact
those customer needs and wants. These design features are
measurable and should affect the customers' perceptions of
meeting their needs and wants. This portion of the Q.F.D.
process is systematic, uSlng affinity groupings and tree
diagramming techniques too. See Figure 2 for an example of
a typical Q.F.D. chart (67).
The interior of the Q.F.D. chart is then completed by
indicating if and to what degree a relationship exists
between the customer's needs/wants and the producer's design

(flELATIONSHIPS:o 9 STRONGo 3 !.EDIUM
..A I WEAl<x
6
04 [ .)8 nI >-'0
IX' n5 ~
02 0"1:>f50
t MAX • MIN 0 TARGET
DESIGNREOUIRE!.ENTS
CUSTOJJERREOUIREI.ENTS
OPERi'l1NG EFFORTS HUM.\N FACTORS
t COflREL:o STRONG.o POSITIVEX NEGATIVE~STRONG.
CUSTOMERRATro
ORGANIZATIONAL DIFFICUlTY • 5 II 3 I I 2 3 • 2 I 5 I I 3 3 • 3 3
OOJECTIVETARGETVALUES
ENGINEERINGCOMPETITIVEASSESSt.£NT
5C HVIct: Kt: I'AIHSlI 000 CAHS
SCRVICE COST: SiCARREG: HINGE STRENGTH
56 5 I. 0 25 18
56
!Z Ul REG: DOOR CRUSH< ~ In;RE"'G"7:"LOC=K"S"'TDoRE=-NG;;::T;THu--+-iM-Jr-+-H-++t-H-I--t-t-IH-+-t-H.... cr 1-=~=::~~;'::":-"'---+.::oIH++-H-++t-H-I-+t-IH-+++:d~_ ~ r-=,OOOR:::.::'::'=OF=-:-F:,:A=SSE:::,,::M"=::--_~M-+:+:::-H-++t-H-I-+t-IH-++-.p.q"" 8 PLASTIC OUTER PANEL 6 Ie..c:.
TECHNICAl. I ABSOLUTEIMPORTANCE I RELATIVE
818 1873 1 I r20 6J 6 18 18 5 913
9 2 2 886 1 1 9 1 8 2 2 1 I 2 2 5 9
Figure 2. Ty~ical Q.F.D. chart. (67, 38)

7
features. Thus, from the Q.F.D. chart a clear detailed
picture of the product's strengths and weaknesses emerges.
Various other information may also be added to the Q.F.D.
chart, such as, product improvement goals and design feature
interrelationships. See Figure 3 for a summary of the
primary Q.F.D. chart. This chart represents Level/Phase 1
of the Q.F.D. process (67).
The second phase in the Q.F.D. process is to construct
another chart with the above determined product design
characteristics listed down the horizontal rows and the
parts (sub-components) characteristics listed across the
vertical columns. Again, the interrelationships are shown
in the body of the matrix. This completes Level/Phase 2 of
the Q.F.D. process (see Figure 4). Thus, the customer
requirements have now been translated into the design of the
sub-components.
The third phase 1S to construct another chart with the
above determined parts characteristics now listed down the
horizontal rows and the manufacturing process characteris
tics listed across the vertical columns. Again, the inter
relationships are shown 1n the body of the matrix. This
completes Level/Phase 3 of the Q.F.D. process (see Figure
4). Thus, the customer requirements have now been
translated into the design of the manufacturing process
characteristics.

fEUlTIONSHIPS:CORRELATIONo 0 STRONG
o 3 MEDIUMMATRIX-.6 1 WEAK
t MAX I MIN OTARGET I I Itt I I I I Ipppit t CORREl:o STRONG.o POSITIVE
DESIGN X NEGATIVEREOUIREMENTS ~ STRONG·
CUSTOMER
HOW RATING
CUSTOMERREOUIREMENTS
~ l:lcrw
~ ~I:wal
IIMPORTANCE" 123456 7 8 9 1011 1213 ,. 15116 17118 19120 ." 1 2 3 4 5
5
2 WI-5tI:>Z
W-WI-
WHAT RELATIONSHIP ~~I-~Ow(/)MATRIX I- (/)
4(/)Q.. Wo::>~(/)f-OO(/)1 () <{
~IMPORTANCE's~I-
ORGANIZATIONAL DIFFICULTY 415 11113111112131421115 111 313 413 3
U~ ACA
UOBJECTIVEo BCAR
TARGET HOW MUCH o CCAR
VALUES
BETIER 5 ENGINEERINGTECHNICAL 4
COMPETITIVECOMPETITIVE 3BENCHMARK 2 ASSESSMENTWOflSE 1
SERVICE REPAIRSlI000 CARS 56 5 14 0 25 Ie 7SE RVICE COST: SJeAR 48 ii' 20 '3 20 56 6
REG: HINGE STRENGTH>-(1) REG: DOOR CRUSH~O REG: lOCK STRENGTH>-crcr>- DOOR OfF ASSEMOz0.0 PlASTIC OUTER PANEL 6 66~u
.~~
TECHNICAL I ABSOLUTE IMPORTANCE ~IMPORTANCE I RELATIVE
8
Figure 3. Primary Q.F.D. chart summary. (67, 53)

across the vertical columns.
The fourth phase of the Q.F.D. process is to construct
another chart with the process characteristics now listed
down the horizontal rows and the production controls listed
This completes Level/Phase 4,
the last of the four basic Q.F.D. charts (see Figure 4).
Thus, the customer requirements have now been translated
into the relevant producer's production controls necessary
to produce the product that will meet the customer's needs
and wants.
PHASE 1
PrOductCharlet.IlSllel
9
CUllom.,Requltamenu
Prod""IChl'lel.u,lIe
hrglll
CUllom.,Dill
PHASE 2
Pa,llSYlllmChl'ICIIUllIcl
ParllS,lllmhrglll
PHASE :l
Proce"Char.c'.,llhes
Parl/Sr.·amChl,.Cllfllllel
ParllSYllamT.fOIII
ProcassT.'0111
PrOCISI
Ch~,aCI.'ISIICS
PHASE 4
PrOduCtionCenltols.
Conuol1~'O.IS
Figure 4. The four basic Q.F.D. charts/phases.

10
Q.F.D. 's power 1S 1n the process and not necessarily 1n
the chart numbers. The systematic and iterative use of
market research data, and the systematic application of this
knowledge, enforces a better understanding of the customer
and taking the time to plan the product, its parts, the
manufacturing process, and the production controls necessary
to build that customer's required quality into the product.
The process sweeps in the customer's perspectives and tries
to maintain it through product delivery so that mistakes and
oversights are avoided. Further, this design and planning
information has been well documented in a concise manner for
easy and clear communication to other employees interested
in marketing, updating, or innovating the product. Since
the customer's needs and wants change with time, the Q.F.D.
chart(s) should be periodically reassessed (at the time of
model updates, innovations, etc.).
Other charts beyond the four basic ones just described
may be formed. These charts may systematically be used to
examine (deploy) technology, cost, and reliability 1ssues
with customer needs, product design features, etc. In fact,
at least 30 additional types of these charts have already
been utilized in deploying quality, technology, cost, and
reliability (37). These four different deployments
(quality, technology, cost, and reliability) comprise a
Total Quality Function Deployment System. This dissertation

11
1S researching only Quality Function Deployment and not
these other Total Quality Function Deployment activities.
Q.F.D. has thus been described as systematically and
iteratively searching out customers' demanded quality
features. It also systematically plans and designs the
product a~d production processes to meet these customers'
needs and wants. Also, Q.F.D. systematically documents and
communicates this information throughout the organization 1n
a clear and thorough manner. With the Q.F.D. process
described, the basic research objective and questions of
this dissertation will now be discussed.
RESEARCH OBJECTIVE AND QUESTIONS
The research objective of this dissertation was to
provide information about Q.F.D. To date, the information
about and the research on Q.F.D. has been limited. Specif
ically the dissertation's task was to address the following
four research questions:
1. What are the variables which affect Q.F.D.?
2. What are the outcomes from using Q.F.D.?
3. What relationships exist between Q.F.D. variables
and outcomes?
4. What guidelines may be offered to practitioners of
Q.F.D.?
The first two research questions were ones of identi
fication. Potential variables which affect Q.F.D. were

12
hypothesized and tested. Potential outcomes from uSlng
Q.F.D. were then hypothesized and tested.
The third and fourth research questions were ones of
exploration. The previously identified Q.F.D. variables and
outcomes may have relationships between each other. An
examination of these variables and outcomes was conduc-
ted. Also some guideline graphs were constructed.
These research questions were generally applicable to
Q.F.D. However, the dissertation applied these research
questions to the subset of Q.F.D. described below.
BOUNDARIES OF THE DISSERTATION
This dissertation did not attempt to consider the
Total Quality Function Deployment System (Quality, Tech
nology, Cost and Reliability Deployment), but only dealt
with the subset known as Quality Function Deployment.
This dissertation was further limited to Q.F.D. as
practiced in America and not in other countries. Different
cultural contexts may affect the identification of Q.F.D.
variables, outcomes, their relationships, and user guide
lines (i.e., Japanese consensus vs. American individualistic
decision making).
This dissertation did not attempt to consider external
environmental variables which may affect the outcomes of
Q.F.D. (i.e., oil crisis results in a product failure).
13
Only internal variables (variables that users may directly
control) are considered ln this dissertation.
This dissertation was further confined to the American
automotive industry. The American automotive industry is in
the forefront of American industry in the number of Q.F.D.
project applications. The American automotive companies
have trained thousands of workers, have hundreds of projects
completed or under way, and have the most experience with
Q.F.D. While the electronics, medical, and light manufac
turing industries are fast becoming very involved in the
use of Q.F.D., different industries' different environments
may affect the identification of variables, outcomes, their
relationships, and user guidelines.
This dissertation was also confined to one of the major
American automotive manufacturers. In order to have access
to a major database of Q.F.D. information, competitive and
confidential concerns necessitated this boundary restric
tion. Within these established boundaries the dissertation
had access to approximately 100 Q.F.D. applications/projects
and was a significant research effort for the reasons stated
next.
SIGNIFICANCE OF THE DISSERTATION
After World War II the Japanese invited knowledgeable
Americans to aid them in rebuilding their society. Specif
ically, they requested aid in rebuilding and improving their

14
industrial facilities. They understood and applied the
knowledge given to them. By the 1960s Japanese product
quality had risen dramatically. The Japanese had come to
understand that meeting product specifications was not
enough. Detecting quality problems by inspecting the fin
ished product to specifications was too late. Reducing
product variation by process controls and better planning
and design could drastically improve the product's quality,
reduce scrap and rework costs, and minimize detection costs.
Moving upstream, from finished goods inspection, to in
process inspection, to process controls, to better designs,
led the Japanese to understand the importance of knowing the
correct (customer focused) product design targets. By fully
satisfying and surpassing their customers' needs and wants,
satisfied and even excited customers would increase the
Japanese product's market share (18). During this same
time, American businesses used many various approaches for
new product innovation and introduction (59).
In 1972 Dr. Yoji Akao (who first proposed Q.F.D. in
1966) was able to operationalize Q.F.D. at Mitsubishi Heavy
Industries' Kobe Shipyard. From that start Q.F.D. is now
the recommended Japanese technique for new product innova
tion and introduction and is being supported and/or taught
by various academic, business, industry, and governmental
organizations. The Japanese had quickly recognized the
importance and value of knowing and using the customer's

15
needs and wants (Q.F.D.). See Figure 5 for the number of
Q.F.D. case presentations reported annually (4). The first
book on Q.F.D. was published In Japan in 1978. Dr. Akao
presented his Q.F.D. concept to Americans for the first time
in Chicago, Illinois, during October 1983. With the first
American application probably occurring In 1984 and the
first American book publication in 1987 (37), America is
about nlne to 12 years behind the Japanese Q.F.D. experience
curve.
With customer satisfaction determining market sales in
the billions of dollars, which determines the location of
millions of jobs and the ownership of billions of dollars of
wealth, the significance of researching new product innova
tion and introduction processes such as Q.F.D. is asserted.
tSO
~
u~
0~
:1~
~
~
0
~~
wJ~e~z
10
'70 '75 '80 '85- Year
Figure 5. Annual number of Japanese Q.F.D. casepresentations. (4, 9)

16
To date, the eight-year-old American Q.F.D. experience
has had some successes and failures. However, there has
been very little public research published on Q.F.D. As far
as is known, the Japanese with their nine to 12 year experl
ence lead have not publicly published any thorough research
on Q.F.D. either.
Both present and future researchers and practitioners
would benefit from additional knowledge concerning Q.F.D.
The dissertation's information will enable researchers to
further develop and test theories about Q.F.D. The informa
tion will also enable practitioners to adapt their imple
mentation strategies and practices to improve the overall
quality and productivity of Q.F.D.
Specifically, the information gained from this disser
tation will aid the American automotive industry to overcome
the nine to 12 year Q.F.D. experience curve disadvantage and
compete more effectively in the international arena.
SUMMARY AND DISSERTATION ORGANIZATION
This dissertation's objective was to provide informa
tion about Q.F.D. After a brief description of Q.F.D., the
research questions were stated. The four research questions
were:
1. What are the variables which affect Q.F.D.?
2. What are the outcomes from using Q.F.D.?

17
3. What relationships exist between Q.F.D. variables
and outcomes?
4. What guidelines may be offered to practitioners of
Q.F.D.?
This dissertation did not attempt to answer these
research questions for all Q.F.D. applications. Boundaries
on the dissertation were explicitly set as to include only
the subset of the Total Quality Function Deployment System
known as Quality Function Deployment. Also, only American
Q.F.D.s were studied, with external environmental (non-user
controllable) variables specifically excluded. The disser
tation was further restricted to automotive applications.
Finally, due to confidentiality and proprietary concerns,
only one American automotive company's Q.F.D. experlences
were researched. Even with these limitations there were
about 100 Q.F.D. projects available to research. This
dissertation provided significant information about Q.F.D.
which will help the American automotive industry overcome a
nine to 12 year Q.F.D. experience curve lag. This will lead
to more successful competition in the international arena
for billions of dollars of sales and wealth and the location
of millions of jobs.
Having introduced the research problem, the next
dissertation chapter reviews the literature and constructs
a research model. Subsequent chapters discuss the design
of the research, including the research hypotheses and

18
methodology, as well as the dissertation's findings, sum
mary, conclusions, and future research recommendations.
Finally, references and supporting appendices are presented.

CHAPTER II
REVIEW OF THE LITERATURE AND
THE RESEARCH MODEL
INTRODUCTION
In order to meet the research objective of providing
information about Q.F.D., a revlew was conducted to find out
what information was already available. The research found
that there were no descriptive or prescriptive Q.F.D. imple
mentation models. This chapter develops a Q.F.D. implemen
tation model framework and then synthesizes the model
elements from the literature review and academic, expert,
and practitioner inputs. The contribution to the Q.F.D.
literature is then detailed and the chapter is summarized.
The balance of the dissertation is then presented.
MODEL FRAMEWORK
A literature search was conducted with Q.F.D. and
related wording as query topics. The literature search
included business, engineering, and quality journal data
bases. In addition, published book databases were investi
gated. Prominent Q.F.D. educators, known authorities, and
organizations (American Supplier Institute, GOAL/Q.P.C.,
20
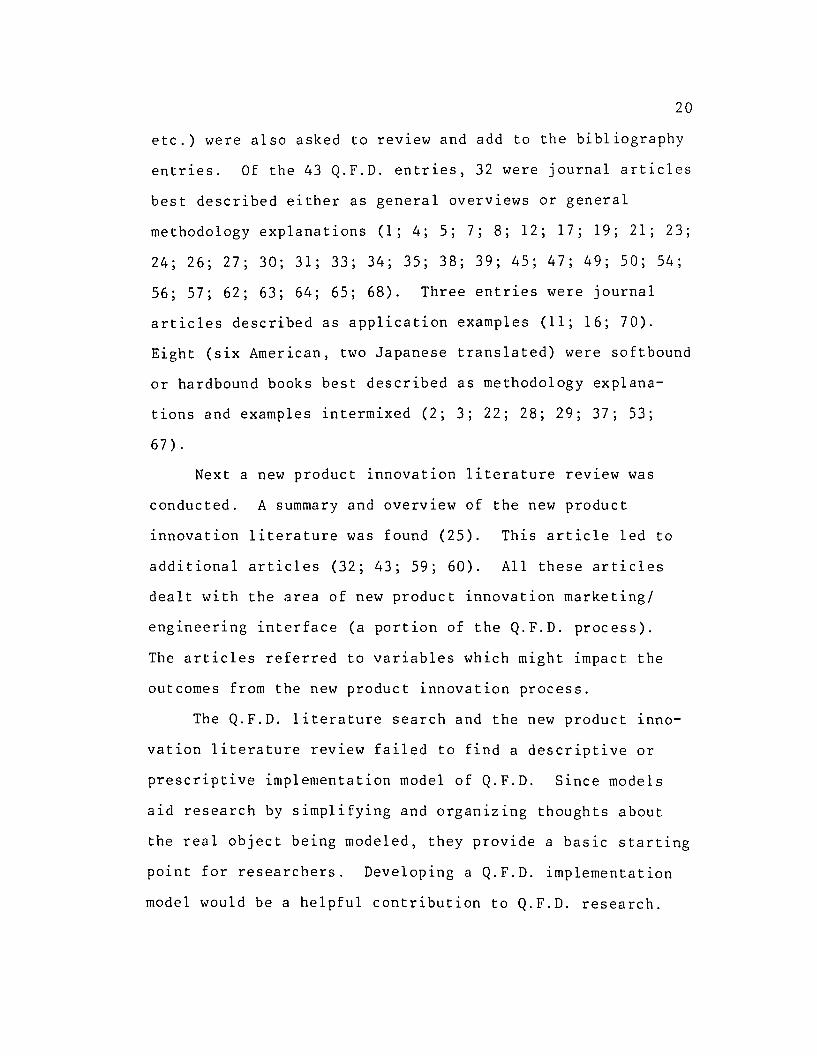
etc.) were also asked to reVlew and add to the bibliography
entries. Of the 43 Q.F.D. entries, 32 were journal articles
best described either as general overviews or general
methodology explanations (1; 4; 5; 7; 8; 12; 17; 19; 21; 23;
24; 26; 27; 30; 31; 33; 34; 35; 38; 39; 45; 47; 49; 50; 54;
56; 57; 62; 63; 64; 65; 68). Three entries were journal
articles described as application examples (11; 16; 70).
Eight (six American, two Japanese translated) were softbound
or hardbound books best described as methodology explana
tions and examples intermixed (2; 3; 22; 28; 29; 37; 53;
67).
Next a new product innovation literature review was
conducted. A summary and overVlew of the new product
innovation literature was found (25). This article led to
additional articles (32; 43; 59; 60). All these articles
dealt with the area of new product innovation marketing/
engineering interface (a portion of the Q.F.D. process).
The articles referred to variables which might impact the
outcomes from the new product innovation process.
The Q.F.D. literature search and the new product lnno
vation literature review failed to find a descriptive or
prescriptive implementation model of Q.F.D. Since models
aid research by simplifying and organizing thoughts about
the real object being modeled, they provide a basic starting
point for researchers. Developing a Q.F.D. implementation
model would be a helpful contribution to Q.F.D. research.
21
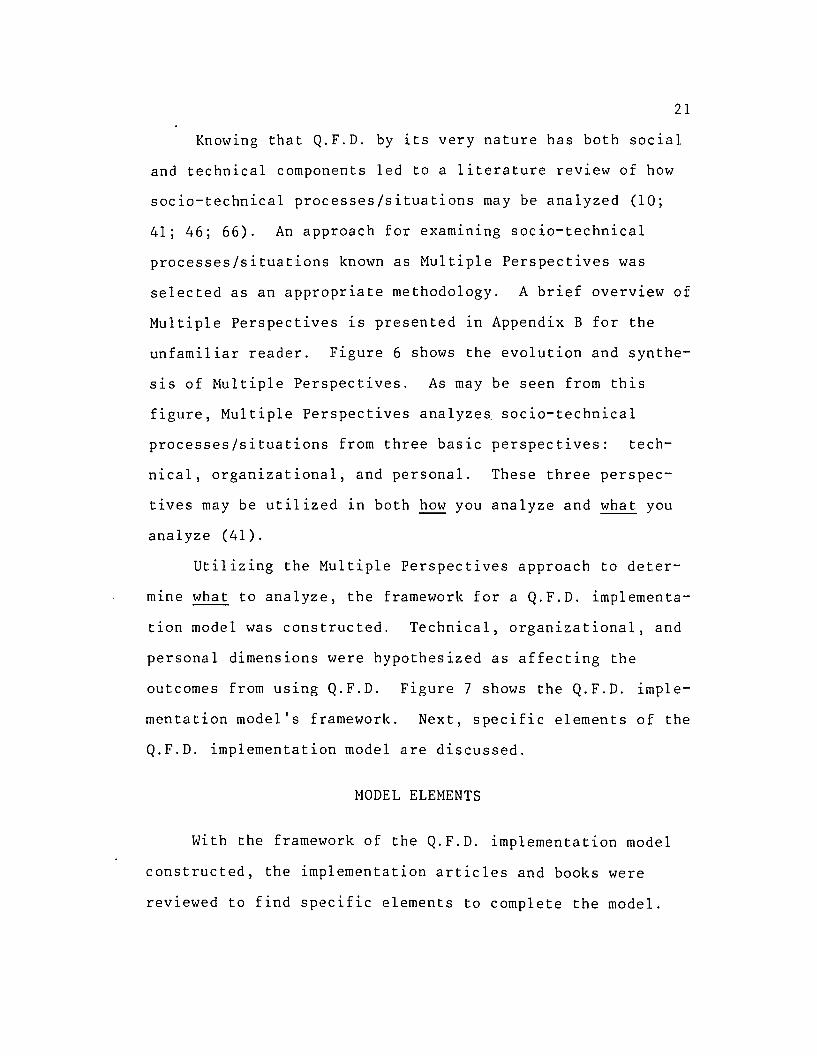
Knowing that Q.F.D. by its very nature has both social
and technical components led to a literature review of how
socia-technical processes/situations may be analyzed (10;
41; 46; 66). An approach for examining socia-technical
processes/situations known as Multiple Perspectives was
selected as an appropriate methodology. A brief overVlew of
Multiple Perspectives is presented in Appendix B for the
unfamiliar reader. Figure 6 shows the evolution and synthe
sis of Multiple Perspectives. As may be seen from this
figure, Multiple Perspectives ana1yze~ socia-technical
processes/situations from three basic perspectives: tech
nical, organizational, and personal. These three perspec
tives may be utilized in both how you analyze and what you
analyze (41).
Utilizing the Multiple Perspectives approach to deter
mlne what to analyze, the framework for a Q.F.D. implementa
tion model was constructed. Technical, organizational, and
personal dimensions were hypothesized as affecting the
outcomes from using Q.F.D. Figure 7 shows the Q.F.D. imple
mentation model's framework. Next, specific elements of the
Q.F.D. implementation model are discussed.
MODEL ELEMENTS
With the framework of the Q.F.D. implementation model
constructed, the implementation articles and books were
reviewed to find specific elements to complete the model.

22
CognitiveDissonance(Festinger)
PersonalPerspectivt:
Noumena(Kant/Loye)
CognitivePerspective
Bureaucraticpolitics
Model 111
Psycho- Singeranalysis Memory Inquiring(Freud) (Neisser) Systems
OrganizationulPt:rspect ivt:
"The Prince""The Discourses"(Machiavelli)
/ "'."Management
andMachiavelli"
Bureaucratic (Jay)Budgeting(Wildavsky)
"PresidentialPower"(Neustadt)
OrganizationalPerspective
Organiza tionalprocess
Model II
Incrementalism(Lindblom)
Theory ofthe Firm(Cyert, March)
OrganizationTheory(March-Simon)
Cybernetics(Beer, Ashby)
Tt:chnical Pt:rspective
Rational ActorModell
SystemsEngineering
IOperationsAnalysis
Allison,1969-1971.
Harvard
Andersen,1977,MIT
Linstoneet al..
1979-1981.PSU
Stein bruner,1968-1974,
MIT
TechnologicalForecasting
PolicyAnalysis(Dror)
/ImpactAssessment
Figure 6. Evolution/synthesis of MultiplePerspectives. (41, 27)

23
Q.F.D.TechnicalDimensionVariables
Q.F.D.Organizational
DimensionVariables
Q.F.D.Personal
DimensionVariables
Q.F.D.Outcomes
Figure 7. Q.F.D. implementation model's framework.
Comments on potential variables and outcomes were discov-
ered. These model elements were categorized according to
the model's framework. Next, over 20 academics, experts,
and practitioners associated with design engineering,
marketing, operations, quality, systems thinking, and espe-
cially Q.F.D. were consulted to add, delete, or rearrange
the model elements inside the model's framework. The Q.F.D.
implementation model's specific potential Q.F.D. variables
and the associated sources were summarized in Figure 8. The
Q.F.D. implementation model's specific potential Q.F.D.
outcomes and the associated sources were summarized in

24
Figure 9. Each of the Q.F.D. implementation model's 17
variables and four outcomes is discussed in turn.
Technical Variables (Tl-T5)
The variables which dealt with the Q.F.D. methodology
(i.e., collecting information, determining numerical values,
building charts, etc.) were grouped as the relevant tech
nical variables. A discussion of the five potential tech
nical variables follows.
Chart Building Methodology (Tl). Both Akao (3) and
King (37), noted Q.F.D. proponents, warn that incorrect
methodology will yield incorrect product. The methodologi
cal procedural trap of the task becoming completing the
chart and completing "cookbook" procedures rather than the
task being understanding and satisfying the customer's needs
and wants was mentioned too (1; 7; 19; 28; 29; 31; 50; 53;
68; E; P).
Chart Size/Complexity (T2). The literature discusses
the chart size/complexity issue. If not prioritized, the
end items grow rapidly. A 30 customer wants by 30 design
features chart has 900 possible interrelationships. Akao
(2; 3) and the Q.F.D. training materials literature (28; 29;
37; 50) especially stressed this point. Other references
included 1; 7; 22; 27; 34; 39; 49; 53; 59; E; P.
Customer Information Availability (T3). Initial knowl
edge of customer needs and wants is the starting point for

25
Model Framework Mode! Elements
Q.F.D.TechnicalDimension
Owt Building MethodologyOwt 5ize1ComplexityCustomer lnlonnatioa AvaibbiIiryCompetitive lnlormation AvaibbiIiryDetermining Accurate Weighu
1. 3, 7, 19,28, 29, 31. 37, SO, 53, 68, E, P2, 3, 7,11. 22, 28, 29, 31, 37,SO,53, 64,68, E, P1. 2, 3, 5, 7, 22, Z7, 28, 29, 34, 37, 39, 49, SO, 53, 59, E, P3, 22, 28, 37, 47, SO, 53, E, P2, 3, 7, 28, 29. 37, SO, 53, 59, E, P
Project Selea.ionTeam Composition ,
Top ManJgement Commitment
Team5izeTe.am Dyiwnic:sImplementation l..eYeVPhas(Project Completion rUDeProject VISlbi!ily
PerSOiW CommitmCDtTraining and ExperiencePerSOlW PowerIndividuals' AY3ilable Work rllllC
1. 22, 53, A. E, P1. 2, 3, 4,7, 8, 22, 28, 29, 37, SO, 53, A. E, P2, 7, 8, 32, A. E, P2, 22, 23, 28, SO, 53, A. E, PL- --J
Q.F.D.Personal
Dimension
Q.F.D.Organizational
Dimension
LEGEND
No. - Bibliography SourCC3A - Academic SourCC3E - Expert SourCC3P - Praditioner SourCC3
Figure 8.sources.
Potential Q.F.D. variables and their

Model Framework Model Elements
Improved Product's Design
26
Q.F.D.Outcomes
Improved Product's Cost
Improved Product's Time-ta-Market
Improved Product's Communicationsand Documentation Effort
1, 2, 3, 4, 7, 8, 16, 22, 23, 24, 1:7, 28, 29,35,37,38,39,45,47,49,53,59,64,67,68, A, E, P
1, 2, 3, 4, 16,22, 23, 24, 28, 29, 35, 37, 38,45,49,53,64,67, 68, 70, A, E, P
1, 2, 8, 11, 12, 16, 19,21, 22, 23, 24, 28,29,37,45,47, SO, 53, 56, 62, 64, 67, E, P
LEGEND
No. - Bibliography Sources
A = Academic Sources
E = Expert Sources
P = Practitioner Sources
Figure 9. Potential Q.F.D. outcomes and theirsources.
product development (59). While this knowledge may be
difficult and time consuming to collect, generally the
literature recognized its importance and that Q.F.D. encour-
ages seeking more customer information. Again, Akao (2; 3;
5), King (37), and the training materials (28; 29) high
lighted this variable. Nicholson (50) in particular offers
methods for aiding the collection of customer information.
Other references included 1; 7; 22; 27; 34; 39; 49; 53; 59;
E; P.
Competitive Information Availability (T4). For a
significantly new concept/product, determining the competi
tion may be very difficult. When Q.F.D. is used to update

27
and improve an already existing marketed product, this is
less likely to be a problem. Only a few sources (3; 22; 28;
37; 47; 50; 53; E; P) mentioned this concern.
Determining Accurate Weights (T5). Akao (2; 3) and
Aswad (7), as well as the training materials (28; 29; 37),
discuss the trial and error subjective process that Q.F.D.
utilizes to determine weights of customer importance,
perceptions, and chart interrelationships. Aswad (7), ln
particular, called for research to improve this process.
Use of inaccurate customer information, especially statis
tically invalid customer information, may result ln lnappro
priate product designs (50; 53; 59; E; P).
Organizational Variables (06-013)
The variables which dealt with organizations' deci
sions, formation, strength, and stability were grouped as
the relevant organizational variables. A discussion of the
eight potential organizational variables follows.
Top Management Commitment (06). Many sources cited
this variable as being crucial. Academics, experts, and
practitioners; the new product introduction literature
sources (25; 32); the training materials (2; 3; 28; 29; 37;
50); and others (1; 22; 33; 39; 45; 53; 62; 65; 68) all
stated that top management commitment was imperative for new
product introduction/Q.F.D. success.

28
Project Selection (07). The training materials litera
ture (3; 28; 29; 37; 50) especially discussed how appropri
ate Q.F.D. project selection may encourage a company's
Q.F.D. success. They recommended that initial Q.F.D. pilot
projects be ones that update existing products rather than
projects that are brand new concepts or brand new market
product introductions. This was to allow for learning the
Q.F.D. process without the added problem of learning a brand
new product market, new customer profile, new manufacturing
technology, and/or new product technology. Others (2; 7; 8;
22; 47; 53; 68) simply stated that project selection was a
variable or that a problem product should be selected so as
to show a large degree of improvement/success with Q.F.D.
This success may then be used as a showcase to encourage
further Q.F.D. implementation. Experts and practitioners
concurred that project selection may affect Q.F.D. outcomes.
Team Composition (08). This variable was the most
often cited as necessary to the new product introduc
tion/Q.F.D. process. In all, 20 literature sources and
academics, experts, and practitioners cited team composition
as an important variable in product introduction/Q.F.D.
Q.F.D. is cross-functional in nature and should have team
members representing marketing, design engineering, and
manufacturing areas (2' 3' 7' 11' 21' 22' 23' 26' 27' 28', , , , , , , , , ,
29; 32; 37; 43; 45; 47; 49; 50; 53; 60).

29
Team Size (09). A scattering of sources (2; 7; 37; 53;
60) briefly mentioned that when teams get large they may
take longer to complete a project. Academics, experts, and
practitioners concurred.
Team Dynamics (010). Akao (2; 3), King (37), and the
training materials (28; 29; 50) discussed the affect esprit
de corps or lack of good team member interactions (marketing
member vs. engineering member) may have on the process.
Other references included 1; 7; 22; 32; 43; 45; 53; 60; 68;
A; P.
Implementation Level/Phase (all). Akao (3), King (37),
and Nicholson (50) mentioned the importance of completing
the Q.F.D. process through the production controls stage
(Level/Phase 4). Others (1; 19; 60) see most value in the
up front determination, understanding, and documentation of
the customer's needs and wants and the competitive assess
ment (all Level/Phase 1 activities). The views were not
contradictory, but rather complementary, and experts' and
practitioners' statements confirmed that all Levels/Phases
should contribute toward success. The more experienced
Q.F.D. sources (3; 37; 50) stated the importance of com
pleting each next Level/Phase. Less experienced Q.F.D.
sources stated that understanding the customer and the com
petition (1; 19; 60) provided the major benefit.
Project Completion Time (012). A large body of refer
ences cited imposed project completion times (the desire for

30
immediate results, rushing product to market) as a variable
that detrimentally affected Q.F.D. or any new product intro
duction process (1; 2; 3; 11; 22; 23; 28; 29; 31; 37; 45;
50; 53; 59; 64; 68; E; P).
Project Visibility (013). The new product introduction
literature review (25; 32; 60) discussed that the more
visible or important a new product project was, the better
chance for success the new product had. Other references
included 28; 53; A; P.
Personal Variables (P14-P17)
The variables which dealt with an individual's aspect
of and ability to affect Q.F.D. were grouped as the relevant
personal variables. A discussion of the four potential
personal variables follows.
Personal Commitment (P14). Mostly academics, experts,
and practitioners discussed that the greater an individual's
(the Q.F.D. team leader or a team member) personal belief 1n
Q.F.D., recognized need for Q.F.D., and commitment to
Q.F.D., the more energy that individual will expend on doing
Q.F.D. and, hence, improve the Q.F.D. project outcome. One
practitioner source (53), one book (22), and one article (1)
also referred to this variable.
Training and Experience (P15). Akao (2; 3; 4), King
(37), the training materials (28; 29; 50), academics,
experts, and practitioners referred to an individual's pr10r

31
Q.F.D. training and exper~ence as favorably impacting the
Q.F.D. process. Other references included 1; 7; 8; 22; 53.
Personal Power (P16). Academics and practitioners
referred to individuals (the Q.F.D. team leader or a team
member) using leadership position and/or influence--that is,
their personal power--to impact the Q.F.D. process. Other
references included 2; 7; 8; 32. Experts, when queried on
the subject, concurred.
Individuals' Available Work Time (P17). Practitioners
referred to individuals on the Q.F.D. team as not being
given enough time to work thoroughly on the Q.F.D. project.
Academics and experts, when queried, concurred that this may
be a variable that impacts Q.F.D. One practitioner source
(53), one book (22), Akao (2), Fosse (23), Nicholson (50),
and one training material source (28) briefly referenced
this topic as well.
Outcomes (OUTI-OUT4)
The specific potential Q.F.D. variables are important
to study only if Q.F.D. provides outcomes significantly
better than a company's prior methodology. The Japanese
have reported measur~ng some of these Q.F.D. outcomes (see
Figures la, 11, and 12). After conducting the Q.F.D.
literature search and the new product introduction litera
ture review, four specific model elements were proposed to
categorize Q.F.D. 's potential outcomes. These four specific
32
potential Q.F.D. outcomes were reviewed by academics,
experts, and practitioners in the same manner as the 17
specific potential Q.F.D. variables which were discussed
earlier. The four specific potential Q.F.D. outcomes are
improved product's design, improved product's cost, improved
product's time-to-market, and improved product's communica
tions and documentation effort. See Figure 9 for a summary
of these potential Q.F.D. outcomes and their associated
sources. Each of the Q.F.D. implementation model's four
outcomes is discussed in turn.
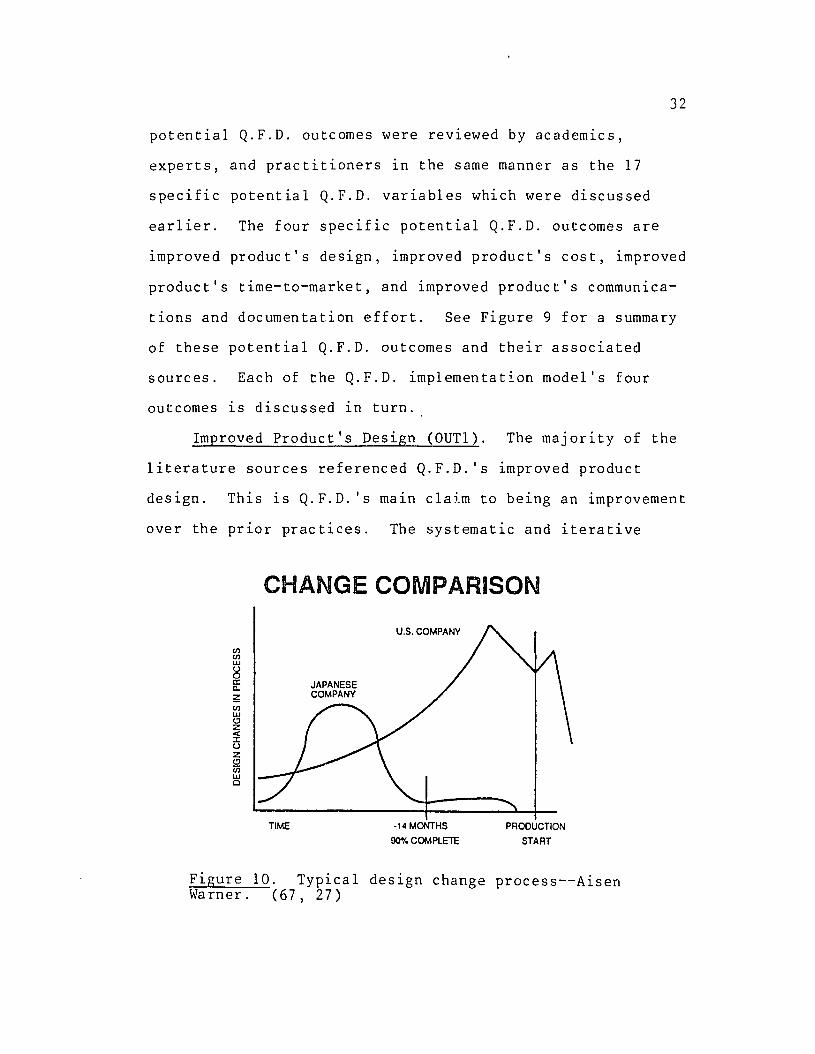
Improved Product's Design (OUTl). The majority of the
literature sources referenced Q.F.D. 's improved product
design. This is Q. F. D. 's maln claim to being an improvement
over the prior practices. The systematic and iterative
CHANGE COMPARISON
U.S. COMPANY
VlVlUJga:c.~VlUJClz:tuzCliiiUJc
TIME ·14 MONTHS
90% COMPLETE
PRODUCTION
START
Figure 10. Typical design change process--AisenWarner. (67, 27)

TOYOTA PRODUCTION STARTUP PROBLEMS
33
enIZ
3Cl.:::EoUIU::JCoa:Cl.
BEFORE QFD
AFTER QFD
~ ~ ~ ~ ~ 234 5 6
MONTI-IS PRODUCTIONSTART
After implementing Q.F.D., Toyota found thatthe level of problems was reduced while thesurge at startup was eliminated. QualityFunction Deployment helped elinlinate thesurge by causing problems to be anticipatedbefore they happened, allowing preventiveaction to be taken instead of correctiveaction.
certainly Toyota had some startup problems,but the magnitude was sUbstantially reduced.
Figure 11. Q.F.D. startup problem reduction-Toyota. (67, 29)
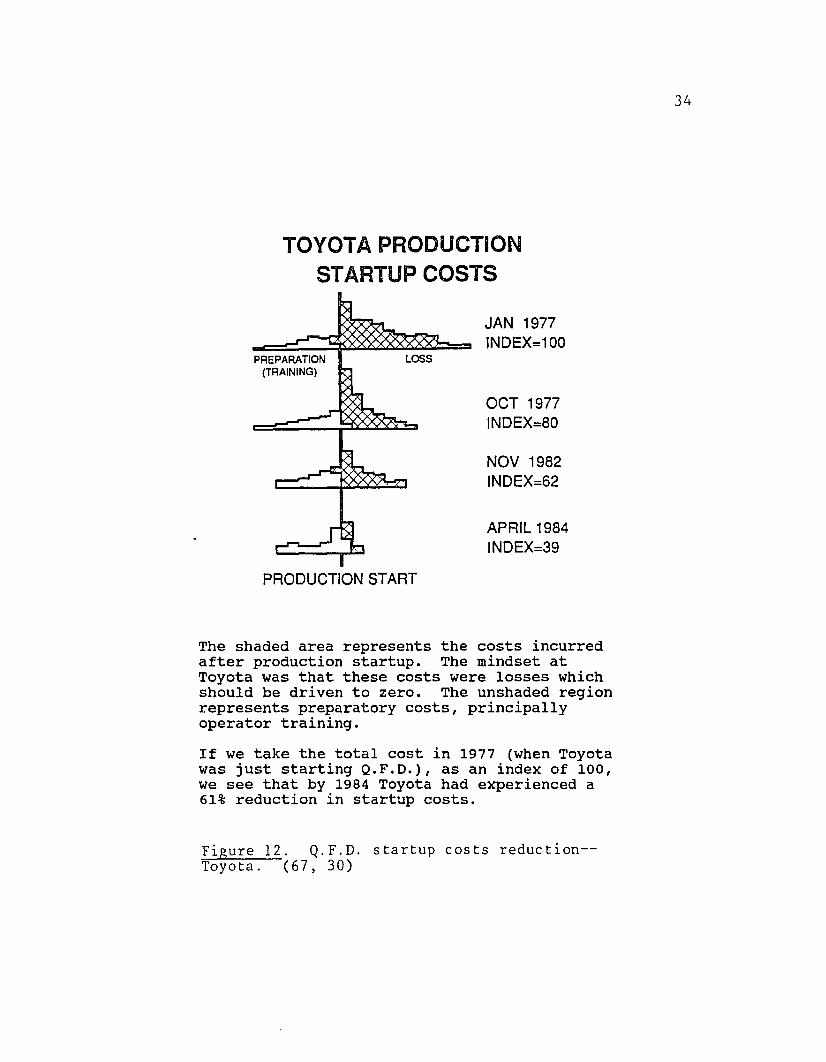
TOYOTA PRODUCTIONSTARTUP COSTS
JAN 1977INDEX=100
34
PREPARATION(TRAINING)
LOSS
OCT 1977INDEX=80
NOV 1982INDEX=62
APRIL 1984INDEX=39
PRODUCTION START
The shaded area represents the costs incurredafter production startup. The mindset atToyota was that these costs were losses whichshould be driven to zero. The unshaded regionrepresents preparatory costs, principallyoperator training.
If we take the total cost in 1977 (when Toyotawas just starting Q.F.D.), as an index of 100,we see that by 1984 Toyota had experienced a61% reduction in startup costs.
Figure 12. Q.F.D. startup costs reduction-Toyota. (67, 30)

35
development of the customer's needs and wants and the pro
ducer's production processes and controls are referred to as
definitely improving customer satisfaction and leading to
increased sales and market share over old methods. Thirty
two references referred to this topic (1; 2; 3; 4; 5; 7; 8;
11; 16; 19; 21; 22; 23; 24; 27; 28; 29; 35; 37; 38; 39; 45;
47; 49; 50; 53; 56; 59; 64; 67; 68; 70; A; E; P). Also, the
historical success of the Japanese companies who employ
Q.F.D. tends to support this model element as a potential
Q.F.D. outcome.
Improved Product's Cost (OUT2). A very large body of
the literature discussed various product cost savings,
including reduced engineering change notices and reduced
start up costs. In addition, Q.F.D. 's clearly stated design
interrelationships and trade-offs may be utilized to reduce
the product's direct costs. Also mentioned is that customer
returns and warranty costs are reduced when compared to the
prior practices. The literature sources simply stated that
the product's cost should be reduced. Other than Figures
10, 11, and 12, no specific data were referred to or found.
The references included 1; 2; 3; 4; 7; 8; 16; 22; 23; 24;
27; 28; 29; 35; 37; 38; 39; 45; 47; 49; 53; 59; 64; 67; 68.
Academics, experts, and practitioners agreed that improved
product's cost is a potential Q.F.D. outcome.
Improved Product's Time-to-Market (OUT3). In regard to
the four potential Q.F.D. outcomes, the fewest number of

36
sources referred to Q.F.D. reducing the product's time-to
market. King (37; 38), in particular, insisted that a
product's time-to-market will be significantly reduced (by
half) and references Akao (2; 3; 4) for support. Other
references stated that while the upfront designing and
planning time is increased, the subsequent pilot runs and
production debugging time is reduced. With the debugging
time reduced, more than the upfront time 1S increased; the
overall time-to-market is reduced. Also mentioned is that
the initial Q.F.D. chart development process may take
longer, but once the initial documentation has occurred,
this 1nsures that subsequent model changes will be moved
more rapidly to market. Academics, experts, and practition
ers concurred that improved product's time-to-market 1S a
potential Q.F.D. outcome (1; 16; 22; 23; 24; 28; 29; 35; 45;
49; 53; 64; 67; 68; 70; A; E; P).
Improved Product's Communications and Documentation
Effort (OUT4). Q.F.D. communicates the customer's needs and
wants, the competitive assessments, the design trade-offs
made, and the strategic marketing plan to all team members.
Q.F.D. also documents these same items on its charts. The
following sources referenced the communications and documen
tations effort and they simply stated that it is improved
with Q.F.D.: 1; 2; 8; 11; 12; 16; 19; 21; 22; 23; 24; 28;
29; 37; 45; 47; 50; 53; 56; 62; 64; 67. Experts and practi
tioners agreed that improved product's communications and
37
documentation effort is a potential Q.F.D. outcome. Academ
ics did not address the topic.
CONTRIBUTION TO THE LITERATURE
The literature search and reVlews contributed to the
compilation of the known published English language body of
literature concerning Q.F.D. To date, no known descriptive
or prescriptive implementation model of Q.F.D. exists. This
dissertation identified an implementation model framework
and added specific model elements to construct an initial
descriptive Q.F.D. implementation model. This model will
aid researchers and practitioners. Researchers will be able
to further develop and test theories about Q.F.D. implemen
tation based on this or a similar model. Practitioners will
be able to adapt their implementation strategies and prac
tices to improve the overall quality and productivity of
Q.F.D. based upon this or a similar model. This initial
descriptive implementation model was researched as discussed
in Chapter III, Design of the Research.
SUMMARY
A description of the dissertation's Q.F.D. literature
search, new product introduction literature review, and
socio-technical processes/situations analysis literature
review was presented. A list of the known English language
material on Q.F.D. was compiled. Recognizing a lack of a

38
Q.F.D. implementation model, an appropriate socia-technical
analysis methodology, known as Multiple Perspectives, was
utilized to construct a Q.F.D. implementation model frame
work. Using literature sources and academic, expert, and
practitioner inputs, specific model elements were developed
and described. By synthesizing the model elements into the
implementation model framework, an initial descriptive
Q.F.D. implementation model was completed. These contribu
tions were noted. The Q.F.D. implementation model was
researched as discussed next in Chapter III, Design of the
Research, and Chapter IV, Findings of the Research. Chapter
V then presents the dissertation's Conclusions, Contribu
tions, Future Research Recommendations and Summary of the
Research. Finally, references and supporting appendices are
presented.
CHAPTER III
DESIGN OF THE RESEARCH
INTRODUCTION
In order to meet the research objective of providing
information about Q.F.D., four research questions were
raised. They were:
1. What are the variables which affect Q.F.D.?
2. What are the outcomes from using Q.F.D.?
3. What relationships exist between Q.F.D. variables
pnd outcomes?
4. What guidelines may be offered to practitioners of
Q.F.D.?
From the literature search, literature reVlews, and
inputs frpm academics, experts, and practitioners, an
initial d~scriptiwe Q.F.D. implementation model of Q.F.D.
variables and outcomes was developed. This implementation
model identifies potential Q.F.D. variables and outcomes
which nee~ed to be tested for confirmation. Also potential
relationships between Q.F.D. 's variables and outcomes needed
to be exp~ored alpng with some guidelines for Q.F.D. practi
tioners.

40
The following sections describe the specific research
hypotheses that were tested. Next, the research methodology
that was used to test these hypotheses is described. A
summary of this chapter and the balance of the dissertation
is then presented.
RESEARCH HYPOTHESES
The initial Q.F.D. implementation model identified 17
potential Q.F.D. variables and four potential Q.F.D. out
comes. Each variable may potentially affect each outcome.
For each variable, there are four research hypotheses using
Vi and 0i to symbolize distinct variables and outcomes; the
first three research hypotheses are shown below:
HZ
= Q.F.D. Chart Building Methodologysignificantly improved the product'sdesign.
= Q.F.D. Chart Size/Complexity significantly improved the product's design.
= Q.F.D. Customer Information Availabilitysignificantly improved the product'sdesign.
The last three of this set of the research hypotheses
are shown below:
= Individuals' Training and Experience inQ.F.D. significantly improved theproduct's communications and documentation effort.
H67 = HVl604 = Individuals' Personal Power significantly improved the product's communications and documentation effort.

41
= Individuals' Available Work Time forQ.F.D. significantly improved theproduct's communications and documentation effort.
These 68 specific research hypotheses addressed the
first research question of "What are the variables which
affect Q.F.D.?" In order to address the second research
. f II h h f' Q F ?" hquestlon 0 W at are t e outcomes rom uSlng .. D.. t e
following four research hypotheses are specified:
= Q.F.D. significantly improved the product'sdesign compared to the prior methodology.
= Q.F.D. significantly reduced the product's costcompared to the prior methodology.
= Q.F.D. significantly reduced the product's timeto-market compared to the prior methodology.
= Q.F.D. significantly improved the product'scommunications and documentation effort comparedto the prior methodology.
The third research question of "What relationships
exist between Q.F.D. variables and outcomes?" is addressed
by the following 21 research hypotheses. The four research
hypotheses dealing with relationships between Q.F.D. varia
bles are:
H73 = There is no significant difference between theQ.F.D. variables' affect on improving theproduct's design.
= There is no significant difference between theQ.F.D. variables' affect on reducing theproduct's cost.
= There is no significant difference between theQ.F.D. variables' affect on reducing theproduct's time-to-market.

42
There is no significant difference between theQ.F.D. variables' affect on improving theproduct's communication and documentation effort.
The first and last of the 17 research hypotheses deal-
ing with relationships between Q.F.D. outcomes are:
There is no significant difference between theQ.F.D. outcomes for the Q.F.D. Chart BuildingMethodology variable.
There is no significant difference between theQ.F.D. outcomes for the Individual's AvailableWork Time for Q.F.D. variable.
To address the fourth research question of "What guide
lines may be offered to practitioners of Q.F.D.?" the six
most directly measurable (ratio data) Q.F.D. variables were
utilized to develop the following six research hypotheses:
The larger the number of items in the Q.F.D.interrelationship chart, the less positive theoutcomes will be from using Q.F.D.
The higher the availability of Q.F.D.'s customerinformation, the more positive the outcomes willbe from using Q.F.D.
The higher the availability of Q.F.D. 's competitive information, the more positive the outcomeswill be from using Q.F.D.
The larger the Q.F.D. team size, the more positive the outcomes will be from using Q.F.D.
The higher the Q.F.D. Level/Phase completed, themore positive the outcomes will be from usingQ.F.D.
H99 = The longer the Q.F.D. project time, the morepositive the outcomes will be from using Q.F.D.
These specific 99 research hypotheses were tested so
that the four research questions could be answered. The

43
research methodology used to test these 99 research
hypotheses is described next.
RESEARCH METHODOLOGY
As noted in Chapter II, Q.F.D. 1S a socio-technical
process, and a Multiple Perspectives approach was appropri
ately used to develop and organize what the Q.F.D. implemen
tation model's potential Q.F.D. variables were. Multiple
Perspectives also may be used to improve how the research
examines Q.F.D.· Different methods for examining technical,
organizational, and personal variable groups may be neces
sary and even more appropriate than one standard method.
The dissertation's research methodology included the
use of a standard technical assessment process as well as an
organization and personal assessment process. Each of these
assessment processes, as well as their integration, 1S
described in turn.
Technical Assessment
The dissertation's research was ex post facto and
social-psychological in nature. Therefore, psychological
principles of measurement methodology and data collection
and statistical principles for data analysis were used.
Measurement Methodology. Psychological principles of
measurement were used to design an assessment instrument
(14; 15; 20; 36; 48; 51; 58; 61). A questionnaire based on

44
the 99 research hypotheses was developed. Its developmental
process is shown in Figure 13 and described below.
From the first 68 research hypotheses, representative
measures were constructed. These measures use a five-point
interval Likert scale to enable respondents to indicate how
the potential Q.F.D. variable affected each Q.F.D. outcome.
A typical example is shown below:
In regard to thisQ.F.D. project:
How Affected(circle your answer)
How did customerinformationavailabilityaffect the Q.F.D.product design?
1StronglyImpairedDesign
2ImpairedDesign
3No
Affect
4ImprovedDesign
5StronglyImprovedDesign
These 68 measures/questions were arranged and formatted
according to sociological survey methods (20). These 68
measures/questions comprise Section I of the Q.F.D. ques-
tionnaire and are shown in Appendix C.
Section II of the Q.F.D. questionnaire is comprised of
measures constructed for research hypotheses 69 through 72.
These measures compare the Q.F.D. implementation model's
four Q.F.D. outcomes to a prior product design and introduc
tion methodology. These measures/questions also utilize a
five-point interval Likert scale as was discussed above.
Section II of the Q.F.D. questionnaire is shown in Appendix
C. No additional measures are required to test hypotheses
73 through 93.

45
Research Objective I
Research Questions ILiterature Search's and Academics, Experts,Literature Reviews' and Practitioners'
Framework, Variables, Inputsand Outcomes Research Model I
Research Hypotheses IPsychologicalMeasurement
PrinciplesConstruction of
Measures forQuestionnaire
Social ScienceData Collection
PrinciplesPretest of
Questionnaire
Modification ofQuestionnaire
Data Collection
IData Analysis
Figure 13. Questionnaire's development process.

46
Finally, measures/questions were constructed for
research hypotheses 94 through 99. These questions collec
ted ratio data on six of the 17 potential Q.F.D. variables.
These measures/questions did not utilize Likert scales, but
rather were of a direct nature, such as, What Q.F.D. Level/
Phase did your project team complete? Numerical answers had
to be provided (i.e., Level/Phase 1 through 4). These six
ratio measures comprise Section III of the Q.F.D. question
na1re and are shown in Appendix C.
The initial Q.F.D. questionnaire was pretested at a
Q.F.D. practicing company not involved with the automotive
company being studied. After administering the question
naire to seven Q.F.D. team leaders, the appropriateness of
the items, word clarity, ease of understanding, and comple
tion time were specifically questioned. The questionnaire's
content validity was also questioned through this same face
to-face exchange. Suggested improvements were considered.
Several word and sentence improvements were made to the
questionnaire.
Content validity 1S the agreement that the measures
represent the items being measured. Content validity is
generally assessed by the researcher's and measurement
subjects' agreement on the content of the measurement
instrument. The dissertation's research questionnaire and
model are based on a specific literature review with exten
sive inputs from academics, experts, and practitioners. In

47
addition, the Q.F.D. questionnaire was refined with inputs
from pretest subjects. Therefore, the measurement instru
ment was deemed to be content valid and ready for the data
collection step.
Data Collection. Q.F.D. deals with customer informa-
tion, marketing strategies, competitive assessment, and new
product designs at a minimum. Thus, companies are very
concerned about confidentiality of information when being
questioned about their Q.F.D. projects. The prior stated
boundaries of the dissertation reflect these concerns by
limiting the study to one of the major American automotive
manufacturers. This company agreed to supply information on
their Q.F.D. projects. Approximately 100 Q.F.D. project
teams had been formed by this company. The dissertation's
technical assessment used census data collection to collect
the necessary research data. The census data collection
utilized almost the entire population of the Q.F.D. project
team leaders. Sampling of the population was not conducted.
The Total Design Method was used to construct, adminis-
ter, and collect the research data (20). The dissertation
utilized the Total Design Method's following four steps for
data collection:
1. Initial mailing: Cover letter and Q.F.D.questionnaire
2. One-week follow-up: Postcard reminder
3. Three-week follow-up: Second letter andreplacement Q.F.D. questionnaire

48
4. Seven-week follow-up: Personal phone call andthird letter and replacement Q.F.D. questionnaire
The dissertation's Q.F.D. questionnaire is shown in
Appendix C. The associated Q.F.D. questionnaire's other
mailing documents are shown in Appendix D. Completed ques
tionnaires were mailed directly back to the researcher to
ensure confidentiality. A summary of the dissertation's
research findings and conclusions was mailed to the com-
pany's Corporate Q.F.D. Coordinator for dispersion to the
Q.F.D. project team leaders.
Some Q.F.D. project team leader non-respondents were
interviewed via telephone to examine for any non-response
bias. A high response rate (70% or higher) was expected due
to the past responses associated with use of the Total
Design Method (20) and due to the respondents' interest ln
Q.F.D.
Data Analysis. Reliability is the ability to produce
consistent scores. The test-retest, split-halves, a1terna-
tive form, and internal consistency methods represent the
generally accepted means for assessing reliability. Testing
complications and result ambiguities have led researchers
and academics to recommend the use of the internal consis-
tency method over the test-retest, split-halves, and a1ter-
native form methods (14; 36; 51; 52; 55).
This dissertation used the internal consistency method
to determine the measure's reliability. The reliability was

49
estimated by calculating a reliability coefficient.
Cronback's alpha is the generally accepted reliability
coefficient in use and was used in the dissertation's relia
bility assessment. A reliability assessment was done after
the data collection step was completed. Individual measures
may be considered for elimination to improve the reliability
coefficient. Typically for beginning research, alphas of
0.5-0.6 have been used. The dissertation used 0.5-0.6 for
its alpha range for assessing the reliability of the measur
lng instrument. An alpha of 0.7 was hoped for and has been
sufficient for modestly reliable ongolng research measurlng
instruments in the past (13; 36; 51; 52; 55).
Measurements are valid if they measure what it lS
intended for them to measure. Three different types of
validity are generally examined: content validity,
criterion-related validity, and construct validity. The
measurement instrument was earlier deemed to be content
valid. Criterion-related validity (also known as external
or predictive validity) is the extent to which a measurlng
instrument is related to an independent measure of the
relevant criterion. Since there does not exist at present
any known independent criterion, criterion-related validity
cannot be assessed.
Construct validity lS the degree to which the instru
ment measures the theoretical concept it is purported to
measure. Evidence is ordinarily accumulated through

50
repeated ~sel of the instrument over a period of time. Since
this is the first application of the measurement instrument,
construct validity cannot be assessed as yet.
The ~ata were entered into a computer database so that
statisticql talculations were facilitated. The statistical
analysis ~oftware package SYSTAT 5.1 was utilized for the
dissertat~onls statistical calculations. The data were
organized and entered by each Q.F.D. project team leader's
individua~ question response. The software package was then
utilized to dalculate the appropriate statistical measures
shown and described next.
Basic descriptive statistics were calculated for the
first set Ofi68 research hypotheses. A histogram was also
constructed nor each of these 68 research hypotheses (see
Table I).
Basic descriptive statistics were calculated for the
second set of four research hypotheses. A histogram was
also construoted for each of these four research hypotheses
(see Table II).
A two-, three- and four-level factor analysis of the 17
Q.F.D. potential variables was completed for each of the
four outcomes. These factor analyses were used to
compare/contnast to the research model's Technical, Organi
zational and .Personal factors.
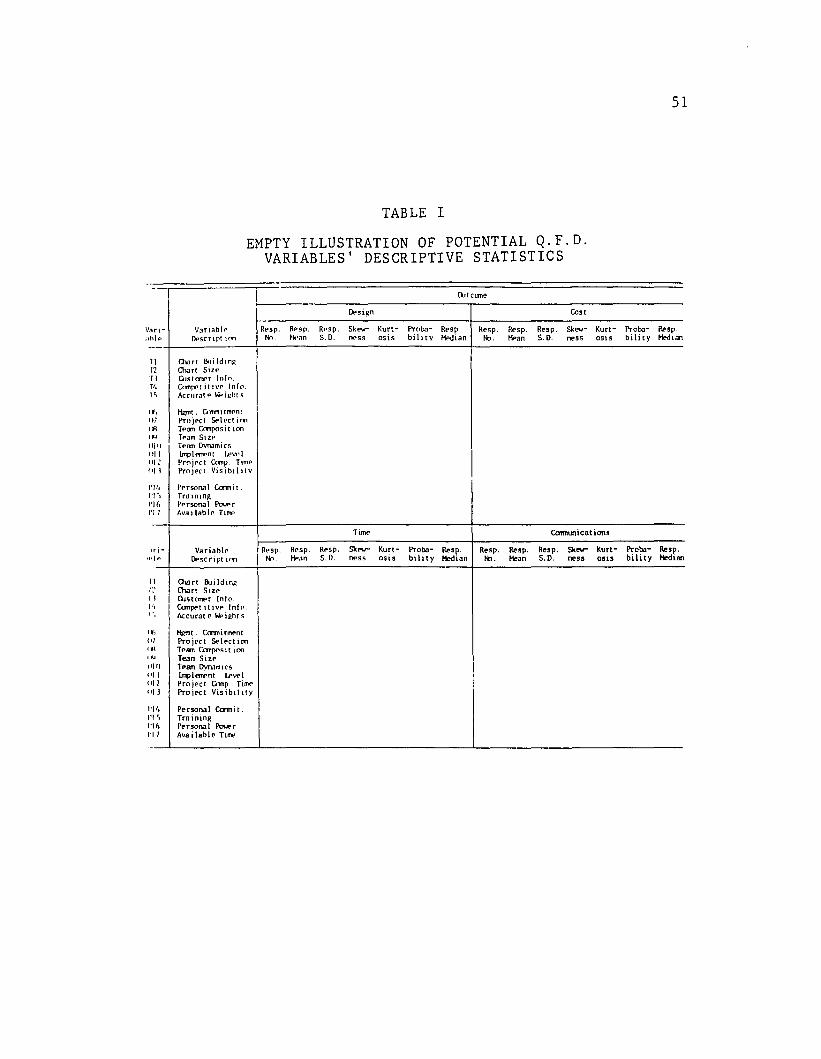
TABLE I
EMPTY ILLUSTRATION OF POTENTIAL Q.F.D.VARIABLES' DESCRIPTIVE STATISTICS
51
-o.lt cant'
(),.i~n Cost
':1ri- V3riablf' Resp. Resp. Rrsp. 5k...,- Kurt- Proba- Rosp. Resp. Rosp. Resp. 51".,\,- Kurt- Proba- Rosp..hlp OPsC'rtpt 10fl No Hf'an 5. D. ne.s osis bill ty HPdian No. liPan 5.0. ne's 0515 bill ty Hl'dlClfl
TI Olarl BlIi Idln£I, Chan SiZl"Tl OJstOlY'r Inf•.Tt. Cnnf)('t It IV" Infc l _
1, Accllrat p ~. i~ht S
It, ~t. Cermn tmPot117 Projpct Seol('c( icnIJl Tpmn Cmtposit ton
'" Tpam Sizp1I111 TpmTl livnamics1111 ltnpl.".,nt lRV1'1
IIII.? Prfljpct Conp Timp"II P'rojf>ct Visibllitv
1'1', Pprsonal Cannat.1'1·, Tra ininRI'll, Pprsona I P<M>r1'17 Ava liable Ti...,
Tune Ccmnunicat ions
Ir i- Variablp Rt'sp. Resp. Resp. Skev- Kurt- Proba- ReS~. Resp. Resp. Resp. 51<...,- Kurt- Proba- Re.~.i,l,. ~script im tlr . PiP.1" 5. D. OE'SS osis bili ty Hechan No. Hean 5.0. ness osis bility Hed.1lll
11 OllJrt BulldtlU:I~' Chan Sizf:>IJ OJstcrner Info.I', Canppt itlvP 10(1.'., Accurat (I ~ ieht 5
I'> HIlmt. Crnmi tment., Project Select ,onJl Tesm Canpo.. [ ,on
'" Team SizpIll) TpBm Dvnamtcsoil lmpl..,pnt 1Rllt'1'11 Project Conp Tim<''11 Pro jeet Visibtl,ty
'II. Personal Crnmi t-'I, Tra injnR% Personal P<M>r'17 Available T'....
-

52
TABLE II
EMPTY ILLUSTRATION OF POTENTIAL Q.F.D.OUTCOMES I :DESCRIPTIVE STATISTICS
Canparison to Prior Non-Q.F.D. Experience
Out- Outcanecome Description
OOTl Impr. Design
OUT2 Impr. Cost
OOT3 Impr. Time
OUT4 Impr. Comm.
Resp. Resp. Resp. Skew- Kurt- Proba- Resp.No. Mean S.D. ness OSlS bility Median

53
TABLE III
EMPTY ILLUSTRATION OF RELIABILITYASSESSMENT SUMMARY
No. Scale Inter-Item CoefficientFactor Outcome Items Correlation Ave. Alpha
Technical Impr. DesignOrganiz. Impr. DesignPersonal Impr. Design
Technical Impr. CostOrganiz. Impr. CostPersonal Impr. Cost
Technical Impr. TimeOrganiz. Impr. TimePersonal Impr. Time
Technical Impr. Corrm.Organiz. Impr. Canm.Personal Impr. Corrm.
The reliability coefficients were calculated for the
research model's factor groupings for each of the four
outcomes (see Table III).
The pertinent statistics from Table I were used to
conduct Multivariate Analysis of Variance (MANOVA) analy
ses for research hypotheses 73 through 93. These MANOVA
analyses allowed statements to be made concerning the Q.F.D.
variables' and outcomes' relationships (see Table IV).
The ratio data for research hypotheses 94 through 99
were collected in Section III of the research questionnaire.
These ratio data were plotted on the X coordinate axis of

54
box and whiskers X-Y graphs. The Q.F.D. projects' median
values for each of the four Q.F.D. outcomes were plotted on
the Y coordinate axis of these box and whiskers graphs.
Guidelines for Q.F.D. practitioners were developed based on
the 24 graphed relationships (six variables each with four
outcomes) (see Figure 14).
TABLE IV
EMPTY ILLUSTRATION OF Q.F.D. VARIABLES'AND OUTCOMES' MANOVA SUMMARY
Variab1e/ Variab1"e/OutcaneOutcane Description
5
Wilks'lambda
FStatistic
Degrees ofFreedom
Probability
Q.F.D. Improved
Product's Design
Compared to
Prior Methodology
4
3
2
1
20 40I60 80 100
Customer Information Availability (%)
Figure 14. Q.F.D. practitioner's guidelines graphexample.

55
Organizational Assessment
A technical assessing process 1S not necessarily the
process most suited for examining organizational concerns.
Multiple Perspectives calls for different paradigms to be
used in the assessing process (not just the typical objec
tive/quantifiable technical assessing process). If the
reader is unfamiliar with Multiple Perspectives, a brief
overview is presented in Appendix B.
Measurement Methodology. An organizational assessment
1S conducted from the point of view of affected and affect
1ng organizations. The relevant organizations involved with
the Q.F.D. project were identified. Due to the disserta
tion's economic and time considerations, a sample size of
three Q.F.D. projects was selected. The company's Corporate
Q.F.D. Coordinator was asked to confirm selection of one
outstanding/successful project, one typical project, and one
difficult/unusual project.
Multiple Perspectives encourages the use of unstruc
tured interviews of prominent/key persons involved in the
situation being studied. Interviewees were listened to so
as to identify the various organizations' support of or
opposition to Q.F.D. and any coalitions and standard oper
ating procedures that may have developed in regard to the
Q.F.D. project.
Data Collection. While an interviewing team is pre
ferred, due to the dissertation's economic constraints a
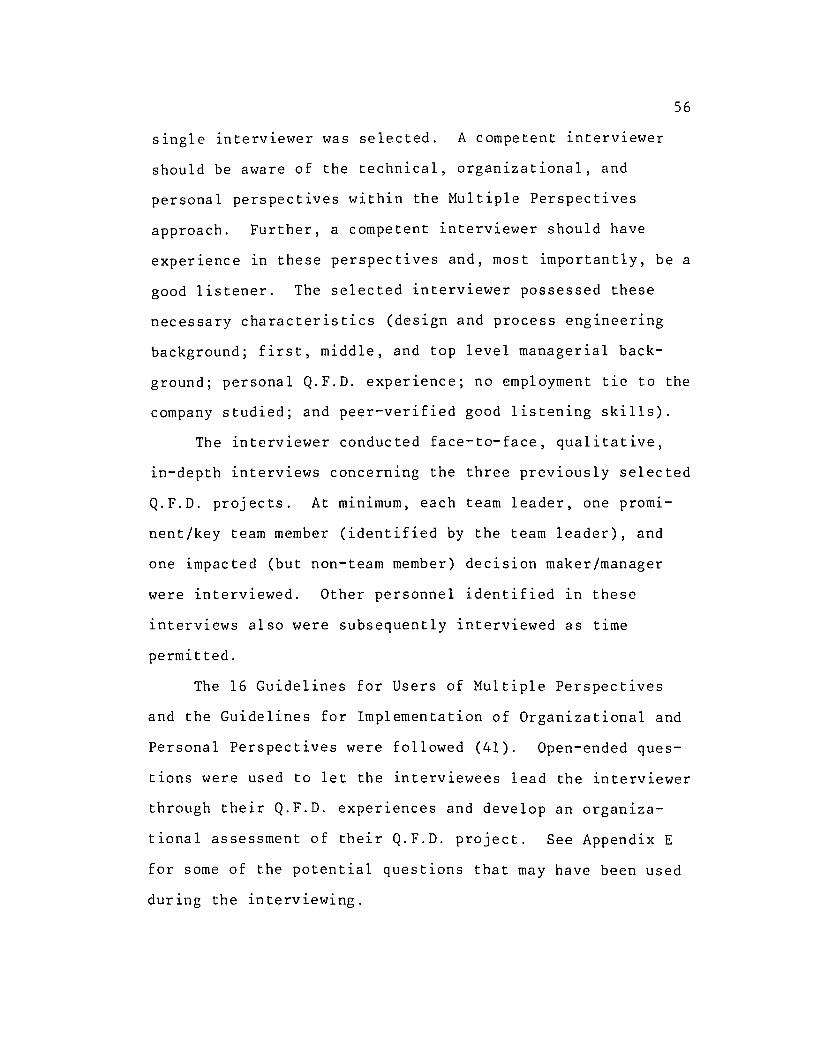
56
single interviewer was selected. A competent interviewer
should be aware of the technical, organizational, and
personal perspectives within the Multiple Perspectives
approach. Further, a competent interviewer should have
experlence in these perspectives and, most importantly, be a
good listener. The selected interviewer possessed these
necessary characteristics (design and process engineering
background; first, middle, and top level managerial back
ground; personal Q.F.D. experience; no employment tie to the
company studied; and peer-verified good listening skills).
The interviewer conducted face-to-face, qualitative,
in-depth interviews concerning the three previously selected
Q.F.D. projects. At minimum, each team leader, one proml
nent/key team member (identified by the team leader), and
one impacted (but non-team member) decision maker/manager
were interviewed. Other personnel identified ln these
interviews also were subsequently interviewed as time
permitted.
The 16 Guidelines for Users of Multiple Perspectives
and the Guidelines for Implementation of Organizational and
Personal Perspectives were followed (41). Open-ended ques
tions were used to let the interviewees lead the interviewer
through their Q.F.D. experiences and develop an organlza
tional assessment of their Q.F.D. project. See Appendix E
for some of the potential questions that may have been used
during the interviewing.

57
Data Analysis. Qualitative interpretations of the
interviews were done. Brief summaries of the various organ
izations' postures and positions were constructed and com
pared to an ideal project scenario for each of the three
Q.F.D. projects.
Personal Assessment
Neither a technical nor an organizational assessment
tends to be able to capture intuition, charisma, leadership,
and personal self-interests. These items often play central
roles in policy and decision making.
Measurement Methodology. A personal assessment is
conducted from the point of view of affected and affecting
individuals. Utilizing the same three Q.F.D. projects as
the organizational assessment, the same key individuals were
investigated. "Powers behind the throne," "puppeteers
pulling the strings," "information gatekeepers," and
"dynamic leaders" were hopefully identified. Interviewees
were listened to so as to identify these people, their
support or opposition to Q.F.D. and any of their intuitions,
leadership qualities, and self-interests they may have
demonstrated during the Q.F.D. project.
Data Collection. Personal assessment data were col
lected in a manner similar to the organizational assessment
data collection. The same key individuals were investigated
as in the organizational assessment. However, different

58
open-ended questions may have been used to let the inter
viewees lead the interviewer through their personal Q.F.D.
experiences and develop a personal assessment of their
Q.F.D. project. See Appendix E for some potential questions
that may have been asked during the interviews.
Data Analysis. Qualitative interpretations of the
interviews were done. Brief descriptions of the varlOUS key
individuals on the three projects were constructed. These
brief descriptions were utilized to capture the essence of
the personal assessment data.
Integration of Assessments
Each separate perspective--technical, organizational,
and personal--is presented in the Findings of the Research
chapter. Additionally, the perspectives were examined to
see if they work at cross purposes or if they are comple
mentary (cross-cuing). There is a large risk ln extrapo
lating the three Q.F.D. projects' organizational and
personal assessments to the approximately 100 Q.F.D.
projects. There is also a large risk in integrating the
three assessments together due to their selection criteria
(Outstanding/Successful, Typical, Difficult/Unusual).
Therefore, only lists of the similarities and discontinu
ities between the assessments were developed.
59
SUMMARY
The research objective and questions were developed
into 99 specific research hypotheses. The dissertation's
research methodology was described as one using a Multiple
Perspectives approach. This approach used three assessment
processes--technical, organizational, and personal.
The technical assessment utilized the research hypoth
eses and developed a measurement instrument (questionnaire).
This questionnaire was administered to approximately all
Q.F.D. project team leaders via the Total Design Method.
This multi-step method has been demonstrated to obtain very
high response rates. Descriptive statistics, histograms,
factor analyses and reliability coefficients were calcu
lated/constructed to examine the first 72 research hypoth
eses. MANOVA analyses were conducted to examine the next
21 research hypotheses. Further, graphical relationships
for 24 selected variable/outcome relationships were con
structed to provide guidelines for Q.F.D. practitioners (to
examine the last six research hypotheses).
The organizational assessment utilized one interviewer
to conduct face-to-face interviews with key personnel to
obtain qualitative brief summaries of various organizations'
postures and positions supporting or 0pposlng the Q.F.D.
project. Three Q.F.D. projects (one successful, one

60
typical, and one difficult) were assessed and compared to an
ideal Q.F.D. project scenario.
The personal assessment utilized a similar measurement
methodology and data collection process and the same three
Q.F.D. projects as the organizational assessment. Brief
personal descriptions were constructed to capture the
essence of key individuals' intuitions, leadership quali
ties, and self-interests.
The technical, organizational, and personal assessments
were examined for similarities and discontinuities. The
major similarities and discontinuities were then listed.
Chapter IV, Findings of the Research, is presented
next, followed by Chapter V, Conclusions, Contributions,
Future Research Recommendations and Summary of the Research.
The dissertation's references and supporting appendices are
presented last.

CHAPTER IV
FINDINGS OF THE RESEARCH
INTRODUCTION
The appropriate data were collected and analyzed as
described in Chapter III, Design of the Research. After a
brief review of the research model, the findings of the
technical, organizational and personal assessments are
presented, as well as an integration of those assessments.
The chapter is then summarized, and the balance of the
dissertation is then presented.
MODEL REVIEW
The Q.F.D. implementation model consists of variables
and outcomes. The 17 Q.F.D. variables are grouped into
three dimensional factors (technical, organizational and
personal). There are four Q.F.D. outcomes; they are a
Product's Improved Design, Improved Cost, Improved Time-to
Market and Improved Communications and Documentation Effort
(see Figures 8 and 9).

62
TECHNICAL ASSESSMENT FINDINGS
Questionnaire Response
The American automotive company which participated in
this study identified a population of 104 Q.F.D. projects.
The questionnaire was prepared and mailed to the appropriate
Q.F.D. team leaders/contacts. In the course of implementing
the study's Total Design Methodology duplicate projects,
deaths and personnel turnover were discovered which
accounted for 15 Q.F.D. projects. A total of 68 question-
naires were returned for an 80% response rate.
Some nonrespondents were telephoned to examine for
nonresponse bias. No apparent pattern or bias was found.
Reasons for nonresponse were scattered and were stated as
never received (1), lack of time (1), questionnaire too long
(2), vacation (1), and wrong person (1).
With the high response and lack of nonrespondent bias,
the data were deemed to be census in nature.
Q.F.D. Variables' DescriptiveStatistlcs and Hlstograms
The 17 Q.F.D. variables were examined as to their
effect on the four Q.F.D. outcomes. The descriptive statis
tics are shown in Table V. The 68 individual histograms are
shown in Appendix F, Questionnaire Q.F.D. Variable/Outcome
Histograms.

TABLE V
POTENTIAL Q.F.D. VARIABLES' DESCRIPTIVE STATISTICS
63
OJtcan.
DesiR" re.t
V:1ri- Vf1riahlt" Re.p. Resp. Resp. 51<....- Kurt- Proba- Re,p. R.sp. Resp. R.,p. Sk....- Kurt- Proba- Resp...hlp DPscripr inn lb . Hean S.D. ""5' osis bi Iity Median lb. Hean S.D. """ 0515 bi Ii ty MedIan
TI O13rl Buildin~ 59 3.71 o 56 -0.59 O. J7 0.000 4.0 56 J.07 0.53 0.07 0.48 0.322 3.0T2 O1.1rf Sizp 58 3.19 0.76 0.16 -0.J8 0.062 3.0 56 2.95 0.48 -0.15 1.27 0.410 J.OTJ CuSfClT'f>r Inf0, 58 3.50 I. 11 -0.62 -Q.48 0.001 4.0 55 2.80 0.80 -0.49 -Q.02 0.070 3.UT4 CanPf"t if ivp Info. 58 3.59 0.94 -0.64 -0.09 0000 4.0 55 2.96 0.77 0.06 0.02 0.727 3.0T) AcctJratp \ok>i~hts % 3.23 0.71 -0.06 -Q.50 0.018 3.0 55 3.11 0.46 0.43 1. 36 U.083 3.0
IV, IWnt. CmTnitnlf"nt 57 J.33 1.14 -0.46 -0.45 0.031 3.0 55 J.05 0.59 -0.01 -0.10 U.4% 3.007 Pro ipct Sf'tpct Lpn 53 3.55 0.85 0.04 -0.60 0.000 4.0 55 3.05 0.52 u.85 J. J2 0.444 3.0(fl Tpam CrntpoSlf im 59 3.86 0.88 -1.11 1. 37 0.000 4.0 56 J.20 0.70 -0.28 0.95 0.040 3.U(llJ TE'am SLZP 59 3.36 0.87 -0.27 -0.15 0.003 3.0 56 2.95 0.55 -0.68 2.40 0.472 3.0(110 Tpl1m Ovn.1mics 58 3.74 U.95 -0.84 0.30 0.000 4.0 56 3.20 0.64 -Q.20 -0.65 0.U26 3U01) Impl"",·nl. I"vel 57 3.25 0.66 -U.68 0.94 0007 JO 56 J.04 0.50 -0.79 4.70 U.597 3.0012 Prt1jrct Co'np, Time 58 3.05 o 74 -U.U8 -I. 12 0.594 3.0 55 2.87 0.47 -0.40 1.00 0.051 3.001 J Prrqpct Visibility 59 3.47 U.84 -0.19 -0.58 U.OOO 4.0 56 3.18 0.58 0.57 1.09 U.024 3.0
1'14 Per,onal Coornit. 59 3.76 0.80 -\.01 0.68 0.000 4.0 56 J.41 0.68 0.67 0.12 0.000 3.01'15 ira inin~ 58 3.59 0.86 -0.44 -0.47 0.000 4.0 56 3.27 0.67 -0.37 1. 36 0.004 J.O1'16 PprsoOe,l ~r 58 3.29 084 -0.23 -0.07 0.010 3.0 56 J.09 0.58 0.56 1.55 0.255 3.01'17 Ava i lable T111'<' 59 3.10 I. II -0.13 -I. 20 U.484 J.O 55 2.96 0.67 -0.34 0.36 0.687 3.0
Time Ccmnunications
I/:Irl- VariablE" Resp. Re.p. R••p. 51<....- Kurt- Proba- Re.p. R••p. Re.p. Re,~. Sk...... Kurt- Probo- Resp..hlp DrSCript im lb. Hean S.D. ""'s osi s bil i ty fit.odian I«J. HelIn S.D. nes, osi, bility Medlm
II O13rt BI~. 55 3.22 0.66 0.14 -0.05 0.017 J.O 58 3.84 0.89 -Q.88 0.86 0.000 4.0r.? Olart SlZP 55 2.84 0.74 0.54 1.41 0.107 3.0 58 3.03 0.92 0.21 -0.62 0.776 3.0TI OJ!ljtCTT'Pr Info. 54 2.94 0.90 -0.05 -0.00 0.652 3.0 58 J.66 1.04 -0.90 0.45 0.000 4.014 Crnlpt"t It ivp Info. 54 3.02 0.90 -0.19 0.02 0.880 3.0 58 J.62 0.93 -Q.75 0.62 0.000 4.015 AcclJratp "*i2hts 54 3.20 0.49 0.44 0.15 0.004 3.0 57 3.JJ 0.72 0.60 0.25 0.001 3.0
IV, IWnt. Crnrni trrw>nt 54 3.13 0.78 0.50 0.11 0.226 3.0 57 J.58 0.94 -1.00 1.09 0.000 4.007 Prn jeel 5f-lpet ion 52 3.08 o 71 -0.11 0.91 0.438 3.0 57 3.26 0.70 -0.40 0.99 0.006 3.0ttl TplWTl Canposit ion 53 3.23 0.64 -0.23 -0.65 0.013 3.0 58 3.79 0.77 -1.05 2.22 0.000 4.0
"" Tpam SlZP 53 3.00 0.62 0.00 -Q.35 1.000 3.0 58 J.40 0.70 -0.40 -Q.49 0.000 3.0010 T{'am Dvnamics 53 3.19 0.81 0.30 -0.34 0.096 3.0 57 3.63 0.84 -0.33 -0.4\ 0.000 4.0(111 Imp I.m.n l. U-VP I 52 3.13 0.44 0.64 1. 31 OOJJ 3.0 58 3.J1 0.63 0.53 0.39 0.000 3.0012 Projpct Conp. limp 52 3 02 0.64 -0.47 o 95 0.830 3.0 56 3.04 0.69 0.30 0.09 0.699 3.001 J Projpcr Visibility 52 3.29 0.67 0.41 0.26 0.003 3.0 58 3.62 0.70 0.35 -Q.50 0.000 4.0
1'14 PersoMl Coorni t. 52 3.44 0.67 0.41 -0.00 O.lIOO 3.0 58 J.66 0.7\ -Q.85 2.00 0.000 4.0l'I'j Trainin(l 53 3.30 0.64 0.10 -Q 12 0.001 3.0 58 J.72 0.10 0.11 -Q.46 0.000 4.01'If, Pt>rsona l POWf'r 52 3.29 0.67 0.81 0.78 lIOOJ 3.0 57 3.37 0.10 0.64 0.22 0.000 J.U1'17 Ava i labl. T, ... 53 3 13 0.88 0.09 -0.15 0.278 l.O 58 3.19 1.02 -0.00 -Q 73 U.161 3.0
NOTE: Probability of obtaining the mean given the hypothesized value of thr••.

64
Discussion on Design Findings
The 17 Design questions/answers had high relative
response numbers and high relative means (mean of 3 is no
affect; mean above 3 is improved design). Unusual histo
grams were defined as having relatively high combinations of
standard deviation values (about 1 or higher) and skewness
or kurtosis values (about 0.4 or larger). Customer Informa
tion (T3), Management Commitment (06), and Individual's
Available Work Time (Pl7) were identified as unusual.
T3 dealt with a very strong positive response to cus
tomer information availability affecting the design outcome.
Customer information availability was stated as very lmpor
tant both in the questionnaire responses and additional
questionnaire comments and in later interviews. Apparently
customer information availability plays a vital part in the
Q.F.D. process.
06 dealt with a strong positive response to top manage
ment commitment affecting the design outcome. Top manage
ment commitment was also mentioned in the questionnaire's
comments sections as very important to the Q.F.D. process.
P17 dealt with a bimodal response to an individual's
available Q.F.D. work time affecting the design outcome.
After rereading the question, one possible explanation
emerged. The question may be answered either positive or
negative depending upon the respondent's thought process.
The more time individuals had to work on a Q.F.D. project,
65
the better the design outcome (a positive questionnaire
response). However, when individuals lacked time to work on
the Q.F.D. project, the more impaired the design outcome
became (a negative questionnaire response). With salaried
workforce cutbacks over the past several years some respon
dents might have commented from the lack-of-time perspec
tive. With increased emphasis on upfront designing/
planning/mistake-proofing some respondents might have
commented from the more-planning-time perspective. These
perspective$ are two different issues, and the ambiguity of
the question may have led to the bimodal response. This
question should be rewritten for better clarity when this
questionnaire is used again.
Using a two-tailed student's t test with 95% criterion,
Chart Size (T2), Project Completion Time (012), and Individ
ual's Available Work Time (P17) were observed to be not
statistically significant.
T2 dealt with chart size/complexity affecting the
design outcome. Chart size simply may not be very important
to the Q.F.D. process. This variable was one of the six
variables on which ratio data were collected for developing
box and whisker X-Y graphs for use in developing guidelines
for practitioners. Please see the Ratio Data Assessment
section for further discussion.
012 dealt with project completion time affecting the
design outcome. From additional questionnaire comments
66
and later interviews a possible explanation occurred. New
car introduction timing is usually predetermined (by e~ther
the standard annual August/September new car rollout or a
set corporate strategy). The Q.F.D. projects may h~ve been
rushed to make the timeline or may have been completed early
with no subsequent earlier introduction of the prodpct~
P17 dealt with an individual's available Q.F.D. work
time affecting the design outcome. The earlier dis~us6ion
on the ambiguity of this question may also be applicable
here.
The response medians show the same general patterns as
discussed above. Nine out of the 17 variables had ~ median
of 4.0. The three non-statistically significant variables
had medians of 3.0 (no affect). The stronger the probabil
ity of significance, the higher the medians were.
Discussion on Cost Findings
The 17 Cost questions/answers had low relative response
numbers and neutral relative means (mean of 3 is no affect).
Unusual histograms were defined as having relatively h~gh
combinations of standard deviation values (about 1 pr I
higher) and skewness or kurtosis values (about 0.4 pr I
larger). No unusual histograms were identified.
Using a two-tailed student's! test with a 95%
criterion, only Team Composition (08), Team Dynamicp (010),
Project Visibility (013), Personal Commitment (P14), and

67
Training (PIS) were observed to be statistically
significant.
Why did the team leaders respond such that 12 out of
the 17 variables were not statistically significant? From
additional questionnaire comments and later interviews a
possible explanation occurred. With thousands of subcom
ponents in an automobile it 1S very difficult to impact the
automobile's overall cost. Additionally any cost savings
are usually hard to estimate (avoiding manufacturing prob
lems, quality problems, etc.). Thus the Q.F.D. project's
impact on the Cost outcome may have been very indirect.
Contrast this indirectness with the direct impact that the
Q.F.D. projects have on Design and Communications outcomes.
The Q.F.D. process causes direct decisions to be made on
product features. The Q.F.D. process brings a cross
functional team together face to face and has the different
functions explicitly explain and discuss their information
and opinions before a team decision is made. These deci
sions are then written down on the Q.F.D. charts. The
Q.F.D. project's indirect impact on the cost outcome may be
the cause of the large number of statistically not signifi
cant variables.
The response medians show the same general pattern as
discussed above. All cost outcome medians were 3.0 (no
affect).

68
Discussion on Time Findings
The 17 Time questions/answers had the lowest relative
response numpers and neutral relative means (mean of 3 is no
affect). Un~sual histograms were defined as having rela
tively high ~ombinations of standard deviation values (about
1 or higher) and sk~wness or kurtosis values (about 0.4 or
larger). No unusual histograms were identified.
Using a two-tailed student's t test with a 95% criter
lon, only Ch~rt Building Methodology (Tl), Determining
Accurate Weights (TS), Team Composition (08), Project Imple
mentation Level (011), Project Visibility (013), Personal
Commitment (fI4), Training (PIS) and Personal Power (P16)
were observe9 to be istatistically significant.
Why did the team leaders respond such that nlne out of
the 17 variables were not statistically significant? The
earlier disc~ssions Ion annual new car introductions or set
corporate strategy predetermining time schedules may be
applicable here. The Q.F.D. project's indirect impact on
the set time outcome may be the cause of the large number of
statistically not significant variables.
The response medians show the same general pattern as
discussed abqve. All time outcome medians were 3.0 (no
affect).

69
Discussion on CommunicationFindings
The 17 Communication questions/answers had high rela-
tive response numbers and high relative means (mean above 3
is improved communications). Unusual histograms were
defined as having relatively high combinations of standard
deviation values (about 1 or higher) and skewness or kur
tosis values (about 0.4 or larger). Customer Information
Availability (T3) and Individual's Available Work Time (P17)
were identified as unusual.
T3 dealt with a very strong positive response to cus
tomer information availability affecting the communications
outcome. Customer information availability was stated as
very important both in the questionnaire responses and addi-
tional questionnaire comments and in later interviews.
Apparently customer information availability plays a vital
part in the Q.F.D. process.
P17 dealt with a mixed response to an individual's
available Q.F.D. work time affecting the communication out
come. As discussed earlier, the ambiguity of this question
may have led to the mixed response. Some respondents may
have answered from a lack-of-time perspective, while others
may have answered from a more-planning-time perspective.
This question should be rewritten for better clarity when
this questionnaire is used again.

70
Using a two-tailed student's t test with 95% criterion,
Chart Size (T2), Project Completion Time (012) and Individ
ual's Available Work Time (P17) were observed to be not
statistically significant.
These three variables are the exact same three varia-
bles that were found to be not statistically significant in
the Design Findings. The same discussion there applies
here.
The response medians show the same general patterns as
discussed above. Nine out of the 17 variables had a median
of 4.0. The three non-statistically significant variables
had medians of 3.0 (no affect). The stronger the probabil-
ity of significance, the higher the medians were.
Discussion on Integrationof Findings
Generally two of the Q.F.D. model's four outcomes
appear to be affected strongly by the Q.F.D. variables.
These were the Improved Design and Improved Communications
outcomes. Generally the Improved Cost and Improved Time
outcomes were not affected by the Q.F.D. variables. A
possible explanation is that Q.F.D. directly impacts the
Improved Design and Improved Communication outcomes by the
nature of its process. Q.F.D. in this automoti~e company
may only indirectly impact the Improved Cost outcome and may
not impact the predetermined Improved Time outcome. Thus

71
Improved Cost and Improved Time outcomes were not affected
by the Q.F.D. variables.
Generally three of the 17 Q.F.D. model's variables
appear to be not significant to any of the model's four
outcomes. Chart Size (T2) simply may not be very important
to the Q.F.D. process. Please see the Ratio Data Assessment
section for further discussion. Project Completion Time
(012) may not be important for the same predetermined time
schedule lssues discussed earlier. This finding correlates
with the Q.F.D. model's Improved Time outcome results.
Individuals' Available Work Time (Pl7) may be an ambiguously
worded question. The bimodal mixed responses are an indica
tion that the question should be reworded for better clarity
before the questionnaire is used agaln.
Q.F.D. Outcomes' DescriptiveStatistics and Histograms
The four Q.F.D. outcomes were examined as to the degree
of improvement when compared to prior non-Q.F.D. experi
ences. The descriptive statistics are shown in Table VI.
The four individual histograms are shown in Appendix F,
Questionnaire Q.F.D. Variable/Outcome Histograms.
Design Findings
The Design question had a high relative response number
and a high relative mean (mean of 4 is better than prior
experience). The histogram was not unusual. The degree of

72
TABLE VI
POTENTIAL Q.F.D. OUTCOMES' DESCRIPTIVE STATISTICS
Comparison to Prior Non-Q.F.D. Experience
Out- Outcome Resp. Resp. Resp. Skew- Kurt- Proba- Resp.come Description No. Mean S.D. ness OSlS bility Median
OUT1 Impr. Design 55 4.02 0.76 -1.06 3.00 0.000 4.0
OUT2 Impr. Cost 53 3.34 0.73 0.27 -0.10 0.001 3.0
OUT3 Impr. Time 54 3.20 0.81 0.48 -0.08 0.070 3.0
OUT4 Impr. Corrm. 55 4.07 0.77 -1.37 3.81 0.000 4.0
NOTE: Probability of obtaining the mean glven thehypothesized value of three.
improved design was observed to be statistically signifi
cant. The response median showed the same pattern (a 4.0,
which is better than prior experience).
Cost Findings
The Cost question had a low relative response number
and a low relative mean (mean of 3 is same as prior experi-
ence). The histogram was not unusual. The degree of
improved cost was observed to be statistically significant.
The response median showed a value of 3.0 (which is same as
prior experience).
Time Findings
The Time question had a low relative response number
and a low relative mean (mean of 3 is same as prior

73
experience). The histogram was not unusual. The degree of
improved time was observed to be not statistically signifi
cant. The response median showed the same pattern (a 3.0,
which is same as prlor experience).
Communication Findings
The Communication question had a high relative response
number and a high relative mean (mean of 4 is better than
prior experience). The histogram was not unusual. The
degree of improved communications was observed to be
statistically significant. The response median showed the
same pattern (a 4.0, which is better than prior experience).
Discussion on Integrationof Findings
Generally the outcome findings support the variable
findings. Q.F.D. strongly impacts/improves the product's
design and communication efforts. Q.F.D. may only
indirectly impact/improve the product's cost. Q.F.D. may
not impact/improve the product's time to market (for this
automotive company). The earlier discussions stated ln the
Q.F.D. Variables' Descriptive Statistics and Histograms sec
tion are applicable here as the findings are compatible and
reinforcing.
Earlier a theory-based model of Q.F.D. variables was
proposed and described. Now these Q.F.D. variables have
been statistically described. How do the two descriptions
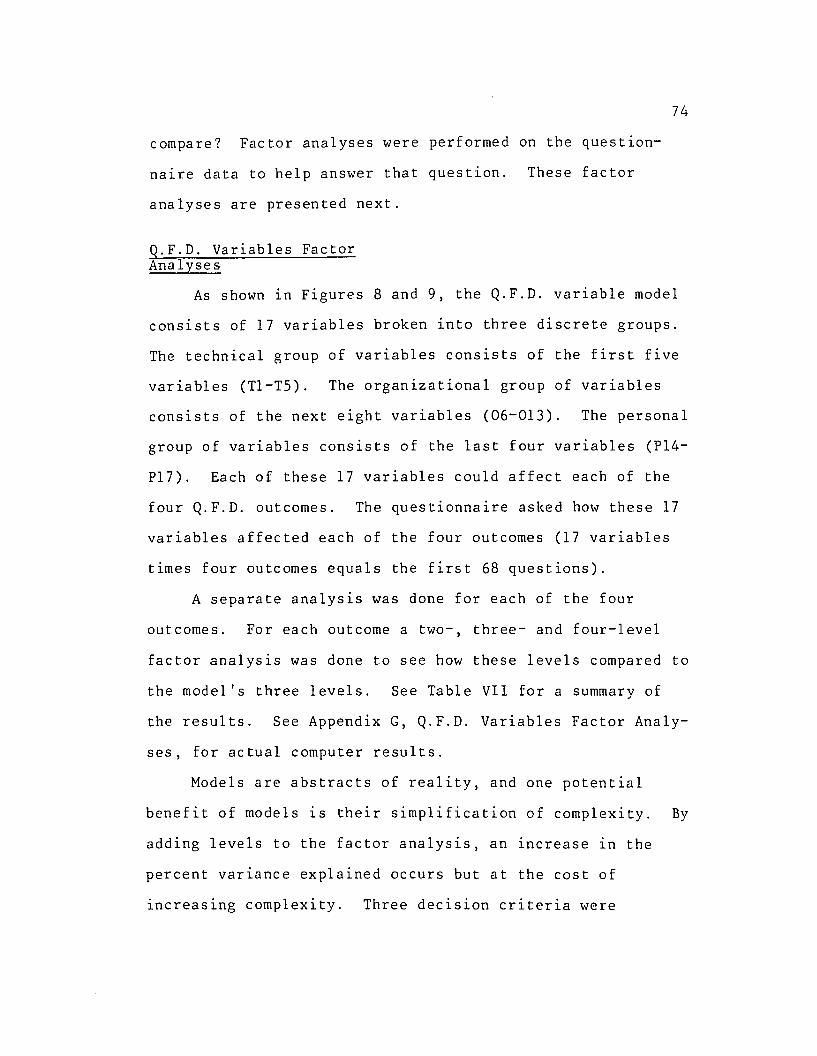
74
compare? Factor analyses were performed on the question
naire data to help answer that question. These factor
analyses are presented next.
four Q.F.D. outcomes. The questionnaire asked how these 17
variables affected each of the four outcomes (17 variables
times four outcomes equals the first 68 questions).
A separate analysis was done for each of the four
outcomes. For each outcome a two-, three- and four-level
factor analysis was done to see how these levels compared to
the model's three levels. See Table VII for a summary of
the results. See Appendix G, Q.F.D. Variables Factor Analy-
ses, for actual computer results.
Models are abstracts of reality, and one potential
benefit of models is their simplification of complexity. By
adding levels to the factor analysis, an lncrease ln the
percent variance explained occurs but at the cost of
increasing complexity. Three decision criteria were

75
TABLE VII
FACTOR ANALYSES MULTI-LEVEL COMPARISONS
Out- Outcome Factor Analyses Percent Variance Smallestcorne Description Level Explained Level > 10%
OUTl Design 2 36 YesOUTl Design 3 44 YesOUTl Design 4 49 No
ooT2 Cost 2 38 Yes0UT2 Cost 3 47 YesooT2 Cost 4 53 No
OUT3 Time 2 44 YesOUT3 Time 3 51 Yes0UT3 Time 4 56 Yes
ooT4 Carro. 2 43 YesOUT4 Comm. 3 49 YesooT4 Carm. 4 55 Yes
selected. First the smallest level had to contribute at
least 10% to the percent variance explained. Second, maXl
mize the percent variance explained. Third, all four out
comes' analyses must be considered. The two-level model was
always surpassed by the three-level model in percent varl-
ance explained. The three-level model was preferred over a
four-level model for Design and Cost outcomes, while the
four-level model was marginally preferred for the Time out-
come and preferred for the Communications outcome. However,
the four-level model did not meet the smallest level> 10%
criterion. Since the dissertation's variable model was
based on all four Q.F.D. outcomes in general (not on each

76
individual Q.F.D. outcome), the three-level model was the
appropriate choice.
If the three-level factor analysis corroborates the
model's three levels, how do the three-level factor
analysis' variables within each of the three levels compare
to the model's variable assignments to each level?
The three-level factor analysis which was performed for
each of the four outcomes was compared to the model's three
levels. See Table VIII for a summary of the results. See
Appendix G for the detailed computer results.
Generally Levell groupings (the technical groupings)
show a strong Customer Information (T3), Competitive Infor
mation (T4) pairing and a very weak Determining Accurate
Weights (TS) result. Some Technical variables group with
Organizational variables, but in this case Technical varla
b1es did not group with Personal variables.
Generally Level 2 groupings (the organizational group
ings) show a strong Management Commitment (06), Team Compo
sition (08), and Team Size (09) collection, a strong Project
Selection (07), Project Visibility (013) pairing and a very
weak Project Completion Time (012) result. Some Organiza
tional variables especially Implementation Level (011) group
with Technical variables and some Organizational variables
group with Personal variables.
Generally Level 3 grouplngs (the personal groupings)
show a strong Training (PIS), Personal Power (P16) pairing

77
TABLE VIII
MODEL AND FACTOR ANALYSIS THREE-LEVEL COMPARISONS
Model F.A. Design F.A. Cost F.A. Time F.A. Comn.level Variables Variables Variables Variables Variables
1 Tl-TS T3,T4 Tl ,T2,012 T3,T4 T3,T4
2 06-013 T2,Oll T3,T4,06, T2,Oll Tl, TS ,06,08,09 07,08,09 ,
0l0,01l ,013
3 P14-17 06,07,08, 07,013, 08,OlO, P1S,P1609,010,013, P14,PlS, P14,P1S,P14 P16 P16, P17
Not None Tl, TS,0l2, TS,OlO, Tl, TS ,06, T2,012,Sig- PlS,PI6,P17 011 ,P17 07,09, P14,P17nif. 012,013
NOTES: 1. TI-Chart Bldg.T2-Chart SizeT3-Cust. Info.T4-Canp. Info.TS-Accur. Wts.
06-Mgmt. CoImlit.07-Proj. Select.08-Team Canp.09-Team SizeOlO-Team Dynam.Oll-lmplem. level012-Proj. Compo Tline013-Proj. Vis.
P14-Pers. Canmit.PIS-TrainingPI6-Pers. PowerP17-Ava i 1. Time
2. There is no significance associated with level numbering.
3. Computer program uses O.SO to select significant variables(shown in Appendix G).
and a very weak Individual's Available Work Time (P17)
result. Some Personal variables group with Organizational
variables, but in this case Personal variables did not group
with Technical variables. See Figure IS for a visual
summary of these results.

T1·T5
T
78
06·013
T3,T4
T\
\
\\
\
\\
\
DesignF.A
T3,T4
T
1Im:Illmmr:===_Amm;CIll4!iilm p P14.P17
Model
\
\
\
\\
\
\
\\
---p07,013, P14,
P15,P16
CostF.A
T3, T4
T\
\
\\
\
\
\
\...,.,.08,010, P14·P17
T1, T5.06·011,
013
\\
\\
\
\\
\\
PP15.P16
Tune F.A Communications F. A
Figure 15. Model and factor analysis three-levelvisual summaries. (Note: Increasing size ofletters and bars indicates increasing strength.)
79
A possible explanation for the above results may be
that Technical variables are fairly distinct and quantifi
able, at least more so than the Organizational variables,
which 1n turn are more distinct and quantifiable than the
Personal variables. This leads to the Technical variables
being the most consistent group1ng and only occasionally
grouping with Organizational variables. The Organizational
variables are the least consistent group1ng as they can and
do group with either the Technical or Personal variables.
The Personal variables are the second most consistent group
ing, and in this case they only grouped with Organizational
variables.
Three individual variab1es--Determining Accurate
Weights (TS), Project Completion Time (012) and Individual's
Available Work Time (P17)--show very weak results. Earlier
it was explained that Project Completion Time (012) usually
1S predetermined by annual new car introduction schedules or
corporate strategy, this may account for its weak results.
Earlier it was explained that the Individual's Available
Work Time (P17) question was ambiguous, this may account for
its weak result. Accurate Chart Weights (TS) may just be
unimportant, thus its weak result. Deletion of Determining
Accurate Weights (TS), Project Completion Time (012) and
Individual's Available Work Time (P17) may be warranted.
The model's remaining variables and their groupings were
appropriate.

80
Just how reliable were the questionnaire's data? A
reliability assessment is presented next to answer this
question.
Reliability Assessment
To assess the reliability of the Q.F.D. variable
factors, the internal consistency method was utilized. The
three-level factor analysis groupings were utilized for each
of the four Q.F.D. outcomes. Pearson's correlation matrix
and a frequency table were generated for each grouping.
Next Cronbach's coefficient alpha was calculated. See Table
IX for summary purposes. See Appendix H, Reliability
Matrices and Tables, for detailed computer results.
All factor/outcome scales were deemed acceptably relia
ble for beginning research when compared to the disser
tation's 0.5-0.6 coefficient alpha acceptable range. In
fact nine of the 12 scales exceeded the hoped for 0.7
result, with SlX above 0.8 and one above 0.9. The three
scales with the lowest reliability coefficient alphas all
had only two scale items. This suggests that if more scale
items were developed and added that their reliabilities may
be improved significantly.
A variation analysis of the data provided some insight
into the usefulness of the dissertation's information. The
MAN OVA analyses are presented next.

81
TABLE IX
RELIABILITY ASSESSMENT SUMMARY
Outcane No. Scale Inter-Item CoefficientFactor Description Items Correlation Ave. Alpha
Technical Impr. Design 2 0.623 0.77Organiz. Impr. Design 2 0.397 0.57Personal Impr. Design 7 0.501 0.88
Technical Impr. Cost 3 0.514 0.76Organiz. Impr. Cost 5 0.467 0.81Personal Impr. Cost 5 0.420 0.78
Technical Impr. Time 2 0.794 0.89Organiz. Impr. Time 2 0.475 0.64Personal Impr. Time 6 0.520 0.87
Technical Impr. Canm. 2 0.861 0.93Organiz. Impr. Corrm. 9 0.428 0.87Personal Impr. Canm. 2 0.499 0.67
NOTE: Coefficient Alpha = per-bar)1 + (p-l)(r-bar)
where p = number of scale itemswhere r-bar = inter-item correlation ave.
MANOVA Analyses
Multivariate Analysis of Variance (MANOVA) analyses
were conducted to explore significant differences between
the Q.F.D. variables for each of the four outcomes, and also
between the Q.F.D. outcomes for each of the 17 variables.
Via the questionnaire, each outcome was measured 17 times
(with each variable), and each variable was measured four
times (with each outcome). Thus multiple dependent vari
ables repeated measures MANOVAs were conducted. The testing

82
evaluated the differences between the values of the varl-
abIes and outcomes without any independent variables
included ln the design. Instead of testing to discover
whether the means were equal, the data were transformed so
as to discover whether the means were different from each
other. See Table X for summary
TABLE X
Q.F.D. VARIABLES' AND OUTCOMES' MANOVA SUMMARY
Variable/Outcome
Tl12T3T4T5
060708Cf)
010Oll012013
P14PISP16P17
OUT10UT2OUT3OlJf4
Variable/OutcomeInteraction
Chart BuildingChart SizeCustomer Info.Competitor Info.Determining Acc.
Weights
Top Mgmt. Commit.Project SelectionTeam CompositionTeam SizeTeam DYnamicsImplem. LevelProj. Canp. TimeProj. Visibility
Personal Commit.Train. and Exper.Personal PowerIndivid's. Avail.
Work Time
DesignCostTimeCanmunications
Wilks'Lambda
0.4620.9070.6920.6890.921
0.7530.7310.5970.7550.7510.8740.9460.809
0.8750.7920.8740.925
0.3480.5300.5040.280
FStatistic
18.6391.6426.9817.0861.316
5.0245.151
10.5785.0705.2002.1540.8413.609
2.1934.0362.1601.243
4.0901.9951. 9716.419
Degrees ofFreedom
3,483,483,473,473,46
3,463,423,473,473,473,453,443,46
3,463,463,453,46
16,3516,3616,3216,40
Probability
0.0000.1920.0010.0010.281
0.0040.0040.0000.0040.0030.1070.4790.020
0.1020.0120.1060.305
0.0000.0430.0500.000

83
purposes. See Appendix I, MANOVA Analyses, for the detailed
computer results.
Discussion
Using a 95% criterion, at least one of the following
variables' four outcome means was not statistically signifi
cantly different from the others: Chart Size (T2), Deter
mlnlng Accurate Weights (T5), Implementation Level (011),
Project Completion Time (012), Personal Commitment (P14),
Personal Power (P16), and Individuals' Available Work Time
(P17). Additionally with variables T2, T5, 011, 012 and
P17, all the univariate Probabilities were not statistically
significant either. Personal Commitment (P14) and Personal
Power (P16) had only one statistically significant unlvarl
ate Probability.
At least one of the outcomes' 17 variables' means was
statistically significantly different from the others.
This result suggested that the means (affectance) of
Chart Size (T2), Determining Accurate Weights (T5), Imple
mentation Level (011), Project Completon Time (012) and
Individual's Available Work Time (P17), and to a lesser
extent Personal Commitment (P14) and Personal Power (P16),
do not change very much no matter what the outcome. Chart
Size (T2), Determining Accurate Weights (T5), Project Com
pletion Time (012) and Individual's Work Time (P17) were
discussed earlier as candidates for dropping from the model

84
or rewriting their questions so as to clarify the answers/
information received from their questions. Implementation
Level (011), Personal Commitment (P14) and Personal Power
(P16) may also be considered as candidates for dropping from
the model or rewriting.
Some additional data (ratio data) were collected when
the questionnaire was administered. An assessment of these
data provided some guidelines for Q.F.D. practitioners. The
ratio data assessment is presented next.
Ratio Data Assessment
Ratio data were collected on SlX of the 17 Q.F.D.
variables. These included Chart Size (T2) (number of chart
interrelationships found by multiplying the number of verti
cal columns and the number of horizontal rows), Customer
Information Availability (T3) (percent available), Competi
tive Information Availability (T4) (percent available), Team
Size (09) (number of core team members), Implementation
Level (011) (Level/Phase number completed), and Project
Completion Time (012) (number of months).
Each of these six values was paired with each of the
four Q.F.D. vs. prior experience outcome scores. Each
Q.F.D. project's results were collected and displayed in an
X-Y box and whisker plot. Due to the outcome scores being
whole integers (1, 2, 3, 4 or 5), box and whisker median
plots were deemed to be more appropriate and meaningful than

85
the typical X-Y means graph. The 24 graphs are shown ln
Appendix J, Ratio Data Graphs.
Discussion on Chart Size (T2)
Various academics, experts and practitioners have
warned about charts becoming so big as to become too complex
and unwieldy for the team to utilize. As regards Improved
Design, scores of 3 (same as prior experience) had a median
chart size of about 650 interactions (about a 25 x 25
chart). Better and Much Better Improved Design scores (4
and 5) had median chart sizes of about 1,300 to 1,600 inter
actions (about a 40 x 40 chart). Chart sizes larger than
that dropped off ln Improved Design scores (outliers only
appear on 3 and 4 scale). Guideline lis: Q.F.D. benefits
seem to decline when a Q.F.D. chart contains more than 1,600
interactions. A 1,600+ size chart might be too complex for
the designers to use effectively to improve their designs.
As regards Improved Cost, no pattern emerged, perhaps
due to the indirect impact Q.F.D. may have on the product's
costs as discussed earlier. No additional guidelines could
be formulated. As regards Improved Time, no pattern
emerged, perhaps due to the predetermined time schedules as
discussed earlier. No additional guidelines could be formu
lated. As regards Improved Communications, the same pattern
as Improved Design occurred, except that instead of about a
1,600 interaction threshold, one of about 1,300 interactions

86
(a 36 x 36 chart) was determined. Guideline 1 may be
strengthened and slightly adjusted to become: Q.F.D. bene
fits seem to decline when a Q.F.D. chart contains more than
1,300 interactions. A 1,300+ size might be too complex for
the designers to use effectively to improve their designs
and communication efforts.
Discussion on Customer Information Availability (T3)
The more customer information that is available, the
better one would think that the product's design, cost,
time-to-market and communication efforts would be. As
regards Improved Design, scores of 3 (same as prior exper1-
ence) had a median of about 30%. Better and Much Better
Improved Design scores (4 and 5) had medians of about 75%
and 50%. This result was not linear. Apparently no Q.F.D.
project was attempted or completed with less than about 20%
of the customer information available. Guideline 2 1S:
Q.F.D. benefits start to occur when there is 20% or more of
the customer information available.
As regards Improved Cost, no pattern emerged, perhaps
due to the indirect impact Q.F.D. may have on the product's
cost as discussed earlier. No additional guidelines could
be formulated. As regards Improved Time, no pattern
emerged, perhaps due to the predetermined time schedules as
discussed earlier. No additional guidelines could be formu-
lated. As regards Improved Communications, the same pattern

87
as Improved Design occurred, except that instead of about a
20% threshold, one of about 10% was determined. Guideline
2, therefore, may remain the same: Q.F.D. benefits start to
occur when there is 20% or more of the customer information
available. A smaller amount of information may mean that
the designers may not be able to improve their designs and
communication efforts because the Q.F.D. project will not be
able to be completed.
Discussion on CompetitiveInformation Availability (T4)
The more competitive information that is available, the
better one would think that the product's design, cost,
time-to-market, and communication efforts would be. As
regards Improved Design scores, no patterns or thresholds
emerged. No guidelines could be formulated. As regards
Improved Cost and Improved Time, no patterns or thresholds
emerged, perhaps due to the same possible explanations
offered earlier. As regards Improved Communications, gener
ally the more competitive information that was available,
the better the communication efforts were. Guideline 3 1S:
The more competitive information that is available, the
better are the Q.F.D. communication benefits.
Discussion on Team Size (09)
Too small a team and not enough diversity and synergy
may exist in that team. Too large a team and the diversity

88
and unwieldiness hurt the team's effectiveness. An optimum
team size may exist. Teams of about five to 12 people were
the only ones formed regardless of whether or not their
results were better or worse than their prior exper1ence.
As regards Improved Design, the better the design outcomes
were, the same or larger were the teams. Guideline 4 1S:
Q.F.D. teams seem to be between five and 12 people in Slze.
As regards Improved Cost, Time and Communications, no
patterns emerged. The same guideline of about five to 12
people applies.
Discussion on ImplementationLevel (all)
The further a Q.F.D. project was completed, one would
think the more the product would have had Improved Design,
Cost, Time-to-Market and Communications effort. As regards
Improved Design, generally the more levels that were com-
pleted, the better was the design. Guideline 5 1S: The
more levels a Q.F.D. team completes, the better the
product's design.
As regards the product's Improved Cost, Time-to-Market
and Communications efforts, no patterns or thresholds
emerged.
Discussion on Project CompletrOn Time (012)
The shorter the project completion time, one would
think the worse the product's Improved Design, Cost and

89
Communications efforts would be. The product's Time-to
Market should be better/improved. As regards Improved
Design, Cost, Time and Communications effort, no patterns or
thresholds emerged, perhaps due to the same possible prede
termined time schedules explanation offered earlier. No
guidelines could be formulated.
In addition to the questionnaire's numerical responses,
selective interviewing was performed to further assess the
Q.F.D. process at the American automotive company. These
findings are presented next.
ORGANIZATIONAL ASSESSMENT FINDINGS
Three Q.F.D. projects were selected for conducting the
organizational assessment. The corporate Q.F.D. coordinator
confirmed the selection of one outstanding/successful
project, one typical project and one difficult/unusual
project. Multiple perspective interviewing was used for
assesslng each of these three Q.F.D. projects. For each
Q.F.D. project, at a minimum the team leader, one prominent/
key team member (identified by the team leader) and one
impacted but non-team member decision-maker/manager (identi
fied by the team leader) were interviewed. Interviewee and
Q.F.D. project confidentiality were promised and sometimes
requested before the actual interviewing took place. An
ideal Q.F.D. project scenario was modeled and the three
Q.F.D. projects' organizational assessments were summarized
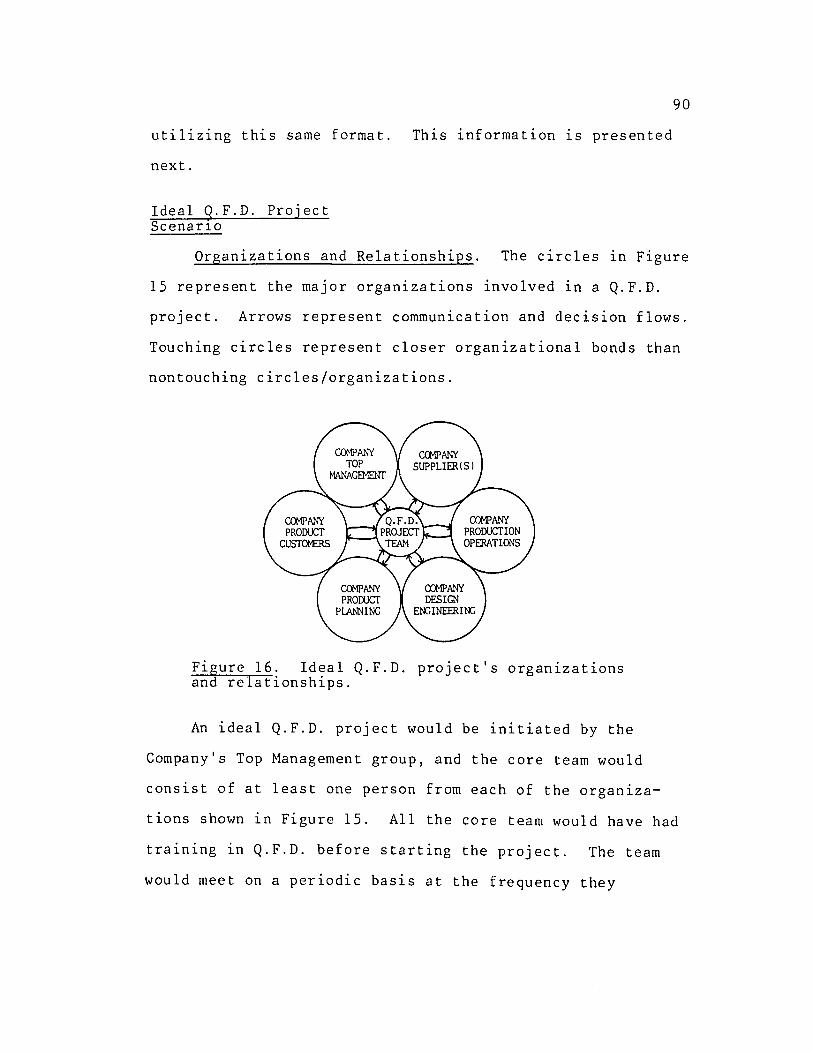
90
utilizing this same format. This information 1S presented
next.
Ideal g.F.D. ProjectScenar10
Organizations and Relationships. The circles 1n Figure
15 represent the major organizations involved in a Q.F.D.
project. Arrows represent communication and decision flows.
Touching circles represent closer organizational bonds than
nontouching circles/organizations.
Figure 16. Ideal Q.F.D. project's organizationsand relationships.
An ideal Q.F.D. project would be initiated by the
Company's Top Management group, and the core team would
consist of at least one person from each of the organiza-
tions shown in Figure 15. All the core team would have had
training in Q.F.D. before starting the project. The team
would meet on a periodic basis at the frequency they

91
determined was necessary to complete the Q.F.D. project on
time. The Q.F.D. project completion time would be set by
the core team after considering the relevant company strate-
gies, customer information availability and resources avail-
ability. See Table XI for a summary of the ideal project's
organizations, goals, and postures and procedures.
Discussion. The ideal scenario consists of the right
organizations all fully participating together in conducting
the Q.F.D. project. A lack of anyone organization's parti
cipation may severely limit the success of the Q.F.D. proJ
ect. The necessary resources must be made available by top
management, and the necessary knowledge must be collected
and shared with all the organizations involved.
How did the three selected Q.F.D. projects compare to
this ideal project scenario? Each of these three Q.F.D.
project's findings are presented next.
Outstanding/SuccessfulQ.F.D. ProJect
Organizations and Relationships. See Figure 16. This
Q.F.D. project was initiated by the Company's Supplier Qual-
ity group, and the core team consisted of one company person
and seven to nine supplier personnel. The team met for two
hours a seSSlon, with one to two sessions per month for
about one year. A project/production deadline was imposed.
This was the first exposure to Q.F.D. for the supplier's

TABLE XI
SUMMARY OF IDEAL Q.F.D. PROJECT'S ORGANIZATIONS,GOALS, AND POSTURES AND PROCEDURES
92
Organization
Company TopManagement
CompanyProductCustomers
CompanyProductPlanning
CompanyDesignEngineering
CompanyProductionOperations
CompanySupplied s)
Goal
To initiate and provideassistance and resourcesto personnel to ensurebest valued products areproduced.
To purchase the bestvalued products.
To plan for the bestvalued products.
To design the bestvalued products.
To build the best valuedproducts.
To provide the bestvalued materials and/orsubcomponents forinclusion in the bestvalued products.
Posture and Procedures
Very favorable toward Q.F.D.Initfates and fully supportsQ.F.D. projects with training, funding, and personnelresources. Checks itselfperiodically to ensureprogress in this area.
Very favorable toward Q.F.D.Voltmteers to provide knowledge of customer wants/needsso best product is produced.
Very favorable toward Q.F.D.Fully participates on Q.F.D.project. Leads the customerinformation gathering; helpsexpress it accurately viaQ.F.D. chart/process.
Very favorable toward Q.F.D.Fully participates on Q.F.D.project. Listens to thecustomer, planning andproduction inputs via theQ.F.D. chart/process.
Very favorable toward Q.F.D.Fully participates on Q.F.D.project. Voltmteers to provide mfg. and assembly problem avoidance knowledge andhelps express it accuratelyvia Q.F.D. chart/process.
Very favorable toward Q.F.D.Fully participates on Q.F.D.project. Volunteers to provide mfg. problem avoidanceknowledge and helps expressit accurately via the Q.F.D.chart/process.

93
Figure 17. Outstanding/Successful Q.F.D.project's organizations and relationships.
personnel. See Table XII for a summary of the project's
organizations, goals, and postures and procedures.
Discussion. The Company's Supplier Quality group
viewed the project as very successful since the Q.F.D.
project led to some discussions with the Company's Design
Engineering group which helped the product's design. Also
the Q.F.D. project led to performing a Designed Experiment
(DOE) which discovered and solved a major quality problem
before full-scale production started.
The supplier's top management remained neutral, having
seen some benefits (happy customer, some improved product
quality), but also having seen some costs (two people
replaced, additional time expended, unmotivated employees).

94
TABLE XII
SUMMARY OF OUTSTANDING/SUCCESSFUL Q.F.D.PROJECT'S ORGANIZATIONS, GOALS, AND
POSTURES AND PROCEDURES
Organization
CompanySupplierQuality
SupplierTopManagement
SupplierQ.F.D. TeamMembers
Goal
To successfully trainSupplier in Q.F.D. onnew modification toexisting product byspecified timeline.
To please the Companywhich is a major purchaser of theirproducts.
Complete Q.F.D. projectto please Supplier TopManagement and CanpanySupplier Quality.
Posture and Procedures
Very favorable toward Q.F.D.Used standard operating procedures for coordinationbetween Supplier groups andCompany Design Engineering.Coordinated Q.F.D. trainingand assistance.
Neutral wait-and-see attitude toward Q.F.D. Usedhands-off, let-teamrdo-workmanagement procedures.However, eventually removedDesign Engineer and QualityManager for non-team play.
Unfavorable toward Q.F.D.Viewed as company programof the year, having hadDOE, FMEA and SPC pastexperiences. Found theQ.F.D. training confusingand saw a lack of topmanagement presence. Mostused teamwork; two overdominated and were removedeventually.
The Supplier's Q.F.D. team members remained unfavorable
to Q.F.D., claiming it did not teach them anything new.
They were of the opinion that if the Company's Design Engin
eerlng group would work more closely with them they would be
able to improve their product quality anyway. They admitted
that one of the two people removed needed to be removed

95
anyway and were neutral on the other personnel change. They
definitely did not view the Q.F.D. project as a success.
Typical Q.F.D. Project
Organizations and Relationships. See Figure 17. This
Q.F.D. project was initiated by the Company's Advance Team
Design Engineering group, and the core team consisted of one
person from each organization plus the team leader from the
Company's Advance Team Design Engineering group. The team
was actually still in what they termed as the pre-Phase 1
stage. They had not been through Q.F.D. training together,
but all had had some form or exposure to Q.F.D. in their
past experiences. All were professional degreed individ
uals. The team leader contacted members by phone or circu-
lated documents for input or information. Contact occurred
about once every two weeks. This format had been used for
about six months. The team leader had plans to transition
Figure 18. Typical Q.F.D. project's organlzations and relationships.

96
to face-to-face meetings on an as needed basis. Several
team members had known each other through past work asslgn
ments. No specific timeline had been established. See
Table XIII for a summary of the project's organizations,
goals, and postures and procedures.
Discussion. The Company's Advance Team groups (both
Sales and Marketing and Design Engineering) viewed Q.F.D.
favorably and were clearly focused on the success of this
new major subcomponent system. The success of the Advance
Team as a whole was directly tied to a successful design and
TABLE XIII
SUMMARY OF TYPICAL Q.F.D. PROJECT'S ORGANIZATIONS,GOALS, AND POSTURES AND PROCEDURES
Organization
CompanyAdvance TeamDesignEngineering
CompanyAdvance TeamSales andM:1rketing
CompanyOperations
Goal
To successfully designnew maj or subcomponentsystem for internal andexternal sales.
To obtain and use marketinformation in thedesign of the new majorsubcomponent system.
To receive a produceableassemblable good subcomponent system.
Posture and Procedures
Very favorable toward Q.F.D.Used unusual standard operating procedures for coordination between team members.Have not had full teammeeting to date. Verbaland written one-to-oneexchanges. No coordinatedtraining was conducted.
Favorable toward Q.F.D.Assertive team play procedures utilized.
Neutral toward Q.F.D. Lackof time, wait-and-see-whatunfolds approach.

97
launch of this product. It was their whole reason for being
ln existence.
The company's other groups (Operations, Business Plan
nlng and Design Engineering) viewed Q.F.D. neutrally or
slightly favorably. The subcomponent system, while impor
tant, was only a subcomponent of the entire automobile.
Their success was not tied either way to the success or
failure of the new product. They could and presently did
buy this subcomponent system equivalent from suppliers.
Their focus was on current production and its problems and
increasing their productivity. Little time had been
allotted for future new product development efforts.
Difficult/Unusual Q.F.D.Project
Organizations and Relationships. See Figure 18. This
Q.F.D. project was initiated by the Company's Design Engin
eerlng group, and the core team consisted of four of their
personnel including the team leader and two from the
Figure 19. Difficult/Unusual Q.F.D. project'sorganlzations and relationships.

98
Company's Materials Engineering group and one person each
from the remaining groups. The core team did not train in
Q.F.D. together, but all had some training before starting
the project. The team met about two hours every two weeks
for about eight months. A deadline was imposed by manage
ment. See Table XIV for a summary of the project's organl
zations, goals, and postures and procedures.
Discussion. The Company's Design Engineering group
had decided to do a Q.F.D. project as this technique was
heralded as being very helpful. A product was selected and
the Company's Materials Engineering group and the Supplier
were asked to participate. Q.F.D. calls for a cross
functional team, so the Company's Operations and Product
Planning groups were asked to help too. They had reluc
tantly agreed.
The Company's Design Engineering management had changed
one month after the project started. There was no real
champion; this Q.F.D. project was piled on top of other work
projects, and no money was allocated to it. Company Opera
tions saw little benefit to them in the short term. They
felt they had no warranty or repalr information and so could
not contribute anything. So to them it was a waste of their
time. Company Product Planning saw it as an infringement on
their marketing research area, not a priority for their
department and no nondepartment funds were available to

TABLE XIV
SUMMARY OF DIFFICULT/UNUSUAL Q.F.D. PROJECT'SORGANIZATIONS, GOALS, AND POSTURES
AND PROCEDURES
99
Organization
CompanyDesignEngineering
CompanyMaterialsEngineering
Supplier
CompanyOperations
CompanyProductPlanning
Goal
To accomplish a Q.F.D.project.
To participate asreq~ested by fellowengmeers.
To appease customer.
Minimize time involved.
Minimize time and moneyinvolved.
Posture and Procedures
Slightly favorable towardQ.F.D. Standard operatingprocedure was used to havegoal tied to performancereview at low prioritylevel. Manager changedafter one month.
Neutral toward Q.F.D. Business and professional tiesto Design Engineering generated some response toparticipate.
Negative toward Q.F.D.Another program of themonth. Standard operatingprocedure is to do whateverthe customer wants whileminimizing the paininvolved.
Negative toward Q.F.D. Usedphysical and businessdistance to sporadicallyattend.
Negative toward Q.F.D. Sawit as engineering tool toget in marketing area. Usedorganizational prioritiesand high expense estimatesto stop marketing researchinquiries.

100
conduct any market research so they essentially stopped
participating.
Personalities also may playa maJor role 1n the Q.F.D.
process. A personal assessment was conducted on the same
three Q.F.D. projects described above. These findings are
presented next.
PERSONAL ASSESSMENT FINDINGS
The same three Q.F.D. projects selected for the organ1-
zational assessment were used in conducting the personal
assessment. Multiple perspective interviewing was used for
assessing each of these three Q.F.D. projects. For each
Q.F.D. project, at a minimum the team leader or contact, one
prominent/key team member (identified by the team leader)
and one impacted but non-team member decision-maker/manager
(identified by the team leader) were interviewed. Inter-
viewee and Q.F.D. project confidentiality was promised and
sometimes requested before the actual interviewing took
place. Brief descriptions of the key individuals of the
three Q.F.D. projects are presented next.
Outstanding/Successful Q.F.D.Project: Kev Individuals'Descriptions
The Optimist (Team Contact). The n1ce guy with the
eternally positive attitude. Everything is improved or 1S
improving. He possesses a firm belief in Q.F.D. and that

101
people generally want to do a good job. He percelves his
job as a coordinator who gets people together so they can
solve problems to their mutual benefit.
The Doubting Thomas (Team Member). The employee who
questions the benefit of any activity. He is confused about
the purpose of Q.F.D.; he questions the amount of time spent
on the project, the benefits gained from the project, the
lack of resources allocated to the project, etc.
The Theory Y Leader (Non-Team Member Manager). The
leader who believes in giving subordinates a wide range of
authority and responsibility. Teamwork is the only way to
improve productivity. Eventually continual non-team play
will not be tolerated.
Discussion. The Optimist appeared to be unaware or
subconsciously minimizing some of the Q.F.D. project's prob
lems. His dogged, purposeful, positive approach kept the
project progresslng. He simply would not let it die when it
reached a crisis point.
The Doubting Thomas questioned everything, even contra
di c ting him self. Not on 1y "Wha twa s the Q. F . D. pro j e c t ' s
purpose?" and "Why do it?" but also "Why were not more
resources allocated to do it?" This team member was nega
tive to neutral, but he would do what he was told to do
(participate in Q.F.D. project).
The Theory Y leader entrusted the Q.F.D. project
responsibility to his people. He did not want to dominate

102
or influence their actions. They viewed his lack of appear
ance as a lack of leadership and priority. Two of the more
dominating people asserted themselves and brought the Q.F.D.
project to a standstill. Concern for his customer and his
other team players led Theory Y to terminate one person and
cause the resignation of the other person by mutual agree
ment. The Q.F.D. project's progress, which had reached a
standstill, resumed forward momentum.
Typical Q.F.D. Project: KeyIndividuals' Descrlptions
The Young Buck (Team Leader). This individual
possessed the desire, energy and skills to cause action.
Selected by top management to be the key to a major new
product development effort, this person had a mlSSlon.
Embodying enthusiasm, exuding confidence, his charisma was
immediately noticeable.
The Proponent (Team Member). This person was a polite,
positive, proactive professional. Confident in the team's
eventual success and confident in the team member's ability
to contribute to that team success. Rationally ticked off
Q.F.D. milestones and the potential problems which might
arise before the team had succeeded (not if it succeeded).
The Nonpartisan (Non-team Member Manager). The guy who
has been around the block a few times. He will wait and see
what happens. This Q.F.D. stuff is probably more important
for the younger guys. Every department is an empire unto

103
itself, and if the project helps, it's okay; if it does not
help, their department had not wasted resources.
Discussion. The Young Buck was selected by top manage
ment and clearly had past relevant experlence and skills.
His dynamic, energetic personality was an attractive magnet
to people like the Proponent who wanted to be associated
with progress and success. He had used some unusual methods
to minimize the time involved at getting the Q.F.D. project
started, thus keeping the Nonpartisan's group involved.
With a minimal amount of cost (their time) and a perceived
large benefit (new big project success), the team members
had strong commitments to the Q.F.D. project.
Difficult/Unusual Q.F.D.Project: Key Individuals'Descriptions
The Fatalist (Team Leader). This person was resigned
to the fact that most things do not work out as planned. He
had not perceive himself as the Q.F.D. project champion,
while others had looked to him to be that champion. His
personal view of lack of management support and commitment
in terms of people, people's time, project time and money
had permeated the other team members.
The Plodder (Team Member). This individual worked
steadily at the tasks sent down to his out-of-the-way desk.
Once found, he quietly and laboriously described in detail
his recollections of the project. Once started down this
104
path, it was hard to get him to deviate from it. Questions
in other directions and exiting excuses went unnoticed. He
still may be muttering on.
The Rising Star (Non-team Member Manager). The rapid
promotions of this individual were apparent; the telephone
directory listed one location. After having arrived at that
location, the secretary referred to him as having been
"bumped upstairs." At this "upstairs" office the secretary
referred the interviewer on to his very latest position/
office. Finally at that office, which was still being
arranged, he was present. A self-described big picture
problem-solver, he was not arrogant but rather very direct
and very busy.
Discussion. With the Fatalist not championing the
Q.F.D. project and no one soliciting the top management
support for people and money, the Q.F.D. project was handi
capped from the very beginning. With the Rising Star having
moved on one month after the project was started, there was
no one to carry the torch and the diverse organizations
involved reverted back to plodding along toward their own
objectives.
An integration of the Technical, Organizational and
Personal Assessment Findings is presented next.

105
INTEGRATION OF ASSESSMENTS
The assessments' findings were examined to see if they
complemented or worked at cross purposes with each other.
There is a large risk in extrapolating the three Q.F.D.
projects' organizational and personal assessments to the
approximately 100 Q.F.D. projects. There is also a large
risk in integrating the three assessments due to their
selection criteria (Outstanding/Successful, Typical,
Difficult/Unusual). Therefore, only lists of the simi-
larities and discontinuities between the assessments are
presented.
Q.F.D. Variables' Assessments' Similarities
The three perspectives--technical, organizational and
personal--all pointed toward commitment to the Q.F.D.
project as important. Whether it was top management,
organizational or a personal commitment, commitment seemed
necessary to move the Q.F.D. project along when it hit the
real-world difficult moments.
Customer information availability also was a consistent
theme throughout all three assessments. The lack of cus-
tomer information seemed to severely hamper the Q.F.D.
project effort.
The team's composition and dynamics certainly impacted
the Q.F.D. project. The technical assessment showed this,
106
but it was especially confirmed ln the organizational and
personal assessments.
Finally, the Q.F.D. project completion time was an
important variable too. Unfortunately the technical assess
ment question was ambiguously worded. However, during the
organizational and personal assessments many strongly stated
positions were received that a strictly imposed project
completion time was generally detrimental to the Q.F.D.
project (it rushed the project and sacrificed the quality of
the Q.F.D. process).
Q.F.D. Outcomes' Assessments' Similarities
The technical assessment clearly showed that the
strongest outcomes were improved product design and improved
communications and documentation efforts. This was con-
firmed during the organizational and personal assessments.
The Q.F.D. project's time-to-market was not affected as this
was predetermined by annual new model introduction schedules
or by corporate strategy. The Q.F.D. project's product cost
seems to be so indirectly related to the Q.F.D. project as
to not show a strong tie to the Q.F.D. project efforts.
Thus by comparison the Design and Communication outcomes
were stronger than the Time and Cost outcomes for this
American automotive company.

107
Q.F.D. Variables' Assessments' Discontinuities
There were no major discontinuities between the three
assessments concerning the variables which may affect a
Q.F.D. project.
Q.F.D. Outcomes' Assessments' Discontinuities
There were no major discontinuities between the three
assessments concerning the Q.F.D. outcomes.
SUMMARY
After revlewlng the model, the technical assessment
findings were reported. An 80% questionnaire response was
obtained with no nonrespondent bias found. Descriptive
statistics and histograms were developed and described for
both Q.F.D. variables and outcomes responses (see Table VI).
Generally the Improved Design and Improved Communications
outcomes had stronger positive responses than Improved Cost
and Improved Time outcomes. A possible explanation was
offered. The Improved Time outcome was predetermined, and
the Improved Cost outcome was only indirectly related to the
Q.F.D. project.
Customer Information Availability and Top Management
Commitment had non-normal and large variations in their
responses. This was due to a large amount of strong

108
affecting responses. One ambiguous question was discovered
concerning Individual's Available Work Time.
Factor analyses were performed on the Q.F.D. variables
model. Overall a three-level analysis appeared to be the
best selection from among the two-, three- and four-level
analyses that were run for each of the four outcomes. This
three-level result agreed with the model's proposed three
levels (see Table VII).
A comparlson of the three-level factor analysis and the
three-level model showed that most variables were explaining
a significant amount of variation in the four different
outcomes. In this study Technical variables did not group
with Personal variables, while Organizational variables did
group with both Technical and Personal variable groups.
Three variables--Determining Accurate Weights (T5), Projec
tion Completion Time (012) and Individual's Available Work
Time (P17)--may be considered for deletion from the model
for this study (see Table VIII).
A Reliability Assessment was conducted and all factor/
outcome scales were found to be within or have exceeded the
acceptable beginning research coefficient alpha range of
0.5-0.6 (see Table IX).
Multiple dependent variables repeated measures MANOVAs
were conducted. The testing evaluated the differences
between the values of the variables and outcomes without any
independent variables included in the design. The data were

109
transformed so as to test whether the means were different
from each other. Five variables' means do not change very
much no matter what the outcome. These variables may be
considered for deletion from the model--Chart Size (T2),
Determining Accurate Weights (TS), Implementation Level
(011), Project Completion Time (012) and Individual's Avail
able Work Time (P17). To a lesser extent two other
variables may also be considered for deletion--Personal
Commitment (P14) and Personal Power (P16) (see Table X).
A Ratio Data Assessment was conducted using six of the
17 variables on which additional data had been collected Vla
the questionnaire. These six variables were Chart Size
(T2), Customer Information Availability (T3), Competitive
Information Availability (T4), Team Size (09), Implementa
tion Level (011), and Project Completion Time (012). These
six variables' ratio data were paired with each project's
four outcomes' improvement to prior experience scores. This
information was plotted on box and whiskers X-Y graphs.
Five guidelines were developed from this information (see
Appendix J for the 24 graphs).
After the technical assessment findings were reported,
the organizational assessment findings were reported. An
ideal Q.F.D. project scenario was modeled. Utilizing the
same format three Q.F.D. projects--Outstanding/Successful,
Typical, and Difficult/Unusual--were examined. The major
organizations, relationships, goals and postures and
110
procedures were described and discussed for each of these
projects.
After the technical and organizational findings were
reported, the personal assessment findings were reported.
The same three projects and interviewees were utilized as 1n
the organizational assessment. Each of the three Q.F.D.
project's key individuals' personal descriptions were com
piled and discussed.
An integration of the three assessments was compiled.
This consisted of listing the Q.F.D. Variables' and Out
comes' assessments' similarities and discontinuities.
Chapter V, Conclusions, Contributions, Future Research
Recommendations and Summary of the Research, is presented
next. The dissertation's references and supporting appen
dices are presented last.

CHAPTER V
CONCLUSIONS, CONTRIBUTIONS, FUTURE RESEARCH
RECOMMENDATIONS AND SUMMARY
OF THE RESEARCH
INTRODUCTION
The Conclusions and Contributions of the research are
stated and presented. Future Research Recommendations are
made and presented. A Summary of the research problem, the
literature review, the research model, the design of the
research, the findings of the research, the conclusions of
the research, the contributions of the research and the
future research recommendations are also presented. The
chapter is summarized and the balance of the dissertation 1S
then presented.
CONCLUSIONS OF THE RESEARCH
1. There is a limited amount of English language
literature on Q.F.D. The majority of what does
exist 1S very general 1n nature.
2. There presently does not exist any descriptive or
prescriptive Q.F.D. models.

112
3. There presently does not exist any standard Q.F.D.
research measuring instrument.
4. An American automotive company's internal Q.F.D.
projects have been studied and used to verify a
general purpose Q.F.D. implementation model's
variables' and outcomes' relationships. For this
company Chart Size (T2), Determining Accurate
Weights (T5), Implementation Level (011), Project
Completion Time (012), and Individual's Available
Work Time (P17) variables may be candidates for
removal from the model or rewritten for clarifica
tion purposes. For this company Improved Design
and Improved Communication outcomes were signifi
cantly better than the prior product development
methodology. No significant change was found with
the Improved Cost or Improved Time-to-Market
outcomes.
5. For this American automotive company five guide
lines were developed. First, Q.F.D. benefits seem
to decline when a Q.F.D. chart contains more than
1,300 interactions. Second, Q.F.D. benefits start
to occur when there 1S 20% or more of the customer
information available. Third, the more the compet
itive information that is available, the better are
the Q.F.D. communication benefits. Fourth, Q.F.D.
teams seem to be between five and 12 people 1n

113
size. Fifth, the more levels a Q.F.D. team com
pletes, the better the product's design.
6. For this American automotive company similarities
between the technical, organizational and personal
assessments regarding Q.F.D. variables included
commitment (top management, organizational and
personal), customer information availability, team
composition and dynamics and project completion
time.
7. For this American automotive company similarities
between the technical, organizational and personal
assessments regarding Q.F.D. outcomes included
Improved Design and Improved Communications as the
major results from utilizing Q.F.D. Improved Cost
was only indirectly affected and Improved Time-to
Market was not affected.
8. For this American automotive company no major dis
continuities between the technical, organizational
and personal assessments regarding either Q.F.D.
variables or outcomes were found.
CONTRIBUTIONS OF THE RESEARCH
1. An English language literature list of articles and
books on Q.F.D. has been compiled.

114
2. A general purpose Q.F.D. implementation model has
been created which describes both Q.F.D. variables
and outcomes.
3. A general purpose standard Q.F.D. research measur
ing instrument has been created.
4. An American automotive company's Q.F.D. projects
have been researched for verifying both the general
purpose Q.F.D. model and the Q.F.D. research
measuring instrument.
5. Another Multiple Perspect~ves study has been com
pleted which adds to the growing body of knowledge
on the effectiveness of going beyond the standard
technical assessment process.
FUTURE RESEARCH RECOMMENDATIONS
1. Additional academic research should be conducted on
the Q.F.D. implementation process to further aid
practitioners in developing Successful Q.F.D.
projects. Specifically additional research on the
Q.F.D. implementation model's variables and out
comes would be especially beneficial. Also
research to further refine and expand practitioners
guidelines would be beneficial. Some research by
Andreas Krinninger, Amit Pandey and Professor Don
Clausing with the Laboratory for Manufacturing and
Productivity at the Massachusetts Institute of

115
Technology is currently underway to this end.
Additionally Assistant Professor M. Christine Lewis
and Associate Professor Barbara Price of School of
Business at Wayne State University are currently
studying the Q.F.D. process.
2. Additional research should be conducted by non
American industries/companies on the Q.F.D. imple
mentation process. This research would provide
interesting cultural analysis opportunities.
3. Additional industry/company studies should be con
ducted utilizing the general purpose Q.F.D. model
and measuring instrument. This research would
enable further validation and refinement of the
model and instrument. These studies would also
present an interesting comparison between indus
tries and companies. Some companies who are known
to have an extensive number of Q.F.D. projects are
AT and T, Black and Decker, Chrysler, DEC, General
Electric, General Motors, Hewlett-Packard, Honda,
Oregon Cutting Systems, and Proctor and Gamble, and
Toyota.
4. Additional research should be conducted on the
Q.F.D. implementation process on the company
studied in this dissertation. This research would
provide interesting time trend analysis opportuni
ties.

116
5. Additional research should be conducted to develop
expert or knowledge based Q.F.D. systems. Some
work has already begun in this area (31).
SUMMARY OF THE RESEARCH
This dissertation's research objective was to provide
information about Q.F.D. The dissertation's four research
questions were:
1. What are the variables which affect Q.F.D.?
2. What are the outcomes from using Q.F.D.?
3. What relationships exist between Q.F.D. variables
and outcomes?
4. What guidelines may be offered to practitioners of
Q.F.D.?
The boundaries on the dissertation were explicitly set as
to include only the subset of the Total Quality Function
Deployment System known as Quality Function Deployment.
Only an American automotive company's Q.F.D. effort was
studied and the external environment was specifically
excluded. This dissertation did provide significant infor
mation about Q.F.D. which will help the American automotive
industry overcome a nine to 12 year Q.F.D. experience curve
lag. This may lead to more successful competition in the
international arena for billions of dollars of sales and
wealth and the location of millions of jobs.

117
Q.F.D. new product development and socio-technical
analysis literature searches and reviews were conducted and
presented. Recognizing a lack of a Q.F.D. implementation
model, the Multiple Perspectives methodology was utilized
to construct a Q.F.D. implementation model framework. Using
literature sources and academic, expert and practitioner
inputs, specific model elements were developed and
described. By inserting the model elements into the imple
mentation model's framework, an initial descriptive Q.F.D.
implementation model was completed, as was the compilation
of the known English language Q.F.D. material. See Figures
8 and 9 and References section of this dissertation.
The dissertation's research objective and questions
were developed into 99 specific research hypotheses. The
dissertation's research design methodology was based on a
Multiple Perspectives approach. This approach used three
assessment processes--technical, organizational and
personal.
The technical assessment utilized the research hypoth
eses and developed a measurement instrument (questionnaire).
This questionnaire was administered to approximately all
Q.F.D. project team leaders via the Total Design Method.
This multi-step method has been demonstrated to obtain very
high response rates. Descriptive statistics, histograms,
factor analyses and reliability coefficients were calcu
lated/constructed to examine the first 72 research

118
hypotheses. MANOVA analyses were conducted to examlne the
next 21 research hypotheses. Further, graphical relation
ships for 24 selected variable/outcome relationships were
constructed to provide guidelines for Q.F.D. practitioners
(to examlne the last six research hypotheses).
The organizational assessment utilized one interviewer
to conduct face-to-face interviews with key company person
nel to obtain qualitative brief summaries of various organi
zations' postures and positions supporting or opposing the
Q.F.D. project. Three Q.F.D. projects (one successful, one
typical, and one difficult) were assessed and compared to an
ideal Q.F.D. project scenario.
The personal assessment utilized a similar measurement
methodology and data collection process and the same three
Q.F.D. projects as the organizational assessment. Brief
personal descriptions were constructed to capture the
essence of key individuals' intuitions, leadership
qualities, and self-interests.
The technical, organizational, and personal assessments
were examined for similarities and discontinuities. The
major similarities and discontinuities were then listed.
The dissertation's research findings were reported. An
80% questionnaire response was obtained with no respondent
bias found. Descriptive statistics and histograms were
developed and described for both Q.F.D. variables' and out
comes' responses. See Table VI. Generally the Improved
119
Design and Improved Communications outcomes had stronger
positive responses than the Improved Cost and Improved Time
outcomes. A possible explanation was offered. The Improved
Time outcome was predetermined, and the Improved Cost out
come was only indirectly related to the Q.F.D. project.
Customer Information Availability and Top Management
Commitment had non-normal and large variations in their
responses. This was due to a large amount of strong
affecting responses. One ambiguous question was discovered
concerning Individual's Available Work Time.
Factor analyses were performed on the Q.F.D. variables
model. Overall a three-level analysis appeared to be the
best selection from among the two-, three- and four-level
analyses that were run for each of the four outcomes. This
three-level result agreed with the model's proposed three
levels. See Table VII.
A comparison of the three-level factor analysis and the
three-level model showed that most variables were explaining
a significant amount of variation in the four different
outcomes. In this study Technical variables did not group
with Personal variables, while Organizational variables did
group with both Technical and Personal variable groups.
Three variables--Determining Accurate Weights, Project Com
pletion Time and Individual's Available Work Time may be
considered for deletion from the model for this study. See
Table VIII.
120
A Reliability Assessment was conducted and all factor/
outcome scales were found to be within or have exceeded the
acceptable beginning research coefficient alpha range of
0.5-0.6. See Table IX.
Multiple dependent variables repeated measures MANOVAs
were conducted. The testing evaluated the differences
between the values of the variables and outcomes without any
independent variables included in the design. The data were
transformed so as to test whether the means were different
from each other. Five variables' means do not change very
much no matter what the outcome. These variables may be
considered for deletion from the model--Chart Size, Deter
mining Accurate Weights, Implementation Level, Project
Completion Time and Individual's Available Work Time. To a
lesser extent two other variables may also be considered
for deletion--Personal Commitment and Personal Power. See
Table X.
A Ratio Data Assessment was conducted uSlng SlX of the
17 variables on which additional data had been collected Vla
the questionnaire. These six variables were Chart Size,
Customer Information Availability, Competitive Information
Availability, Team Size, Implementation Level, and Project
Completion Time. These six variables' ratio data were
paired with each project's four outcomes' improvement to
prior experience scores. This information was plotted on

121
box and whiskers X-Y graphs. Five guidelines were developed
from this information. See Appendix J for the 24 graphs.
After the technical assessment findings were reported,
the organizational assessment findings were reported. An
ideal Q.F.D. project scenario was modeled. Utilizing the
same format, three Q.F.D. projects--Outstanding/Successful,
Typical, and Difficult/Unusual--were examined. The major
organizations, relationships, goals and postures and pro
cedures were described and discussed for each of these
projects.
After the technical and organizational findings were
reported, the personal assessment findings were reported.
The same three projects and interviewees were utilized as ln
the organizational assessment. Each of the three Q.F.D.
project's key individuals' personal descriptions were
compiled and discussed.
An integration of the three assessments was compiled.
Similarities between the three assessments regarding Q.F.D.
variables included Commitment (top management, organiza
tional and personal), Customer Information Availability,
Team Composition and Dynamics, and Q.F.D. Project Comple
tion Time.
Similarities between the three assessments regarding
Q.F.D. outcomes included Improved Design and Improved
Communications as the major results from utilizing Q.F.D.
Improved Cost was only indirectly affected and Improved

122
Time-to-Market was not apparently impacted at all. No maJor
discontinuities were found between the three assessments
regarding either Q.F.D. variables or outcomes.
Eight conclusions were drawn from the research and five
contributions of the research were noted. Five future
research recommendations were also made.
SUMMARY
Eight conclusions were drawn from the research and five
contributions of the research were noted. Five future
research recommendations were also made. The dissertation's
references and supporting appendices are presented next.

REFERENCES
1. Adams, Rober t M., and Mark D. Gavoor. "Qual i tyFunction Deployment: Its Promise and Reality."A.S.Q.C. Quality Congress Transactions (1990):33-38.
2. Akao, Yoji, ed.Articles.
Series ofQPC, 1987.
3. ed. Quality Function Deployment: Inte~rating
Customer Requirements into Product Deslgn.Cambridge, MA: Productivity, 1990.
4. "History of Quality Function Deployment inJapan. II Annual IAQ Meeting. 22 Oct. 1989.Buenos Aires, Arg.: n.p., n.d. N. pag.
5. "Recent Aspects of Quality Function Deployment onService Industry in Japan. II IntI. Conference onQuality Control 1989 Proc. 26-27 Oct. 1989. Riode Janeiro, Braz.: n.p., n.d. N. pag.
6. Andrews, Frank M., Laura Klem, Terrance N. Davidson,Patrick M. O'Malley, and Willard G. Rodgers. AGuide for Selecting Statistical Techniques forAnalyzing Social Science Data. Ann Arbor, MI:Survey Research Center of the Inst. for SocialResearch of U of Michigan, 1975.
7. Aswad, Adnan. "Quality Function Deployment: A Tool ora Philosophy. II Int!. Congo and Exposition Conference Proc. 27 Feb.-3 Mar. 1989. Detroit, MI:n.p., n.d. N. pag. (See also Society of Automotive Engineering Technical Paper Series No.890163.)
8. Carey, William R. "Quality Function Deployment. II MAPIProducts Liability Council Proc. N.p.: n.p., n.d.N. pag.
9. Churchill, Gilbert A., Jr. "A Paradigm for DevelopingBetter Measures of Marketing Constructs. II Jour.of Marketing Research 16 (1979): 64-73.

124
10. Churchman, C. West. The Design of Inquiring Systems.New York: Basic, 1971 ..
11. Cohen, Lewis. "Quality Funct.ion Deployment: An Application Perspective from Digital IEquipment Corporation." National Product.ivity Rev. 7.3 (1988):197-208. .
12. Conti, Tito. "Process Manag~ment anqi Quality FunctionDeploymen t." Qual i ty Progres s 42.12 (1989): 45-48. .
13. Cronbach, L. J. "Coefficient~ Alpha amd the InternalStructure of Tests." P~)ychometrika 16 (1951):297-334.
14. Dawes, Robyn M. Fundamentals of Attitude Measurement.New York: Wiley, 1972.
15. De Vaus, D. A. Surveys in Social Research. London:Allen, 1986.
16. De Vera, Dennis, Tom Glennon, Andrew IA. Kenny, MohemmadA. H. Khan, and Mike Mayer. "Automotive CaseStudy." Quality Progress 21. 6 (1988): 35-38.
17. Delatore, J. P., E. M. Press, and M. K. Vora. "Translating Customer Needs i~to Product Specifications." Quality Progress 22.1 (1989): 50-53.
18. Deming, W. Edwards. Out of Crisis. ,Cambridge: M.I.T.Center for Advanced Engineering Study, 1986.
19. Denton, D. Keith. "Enhance Competitiveness andCustomer Satisfaction ... Here's One Approach."Industrial Engineering May 1990:124-30.
20. Dillman, Don A. Mail and Telephone Surveys: The TotalDesign Method. New York: Wiley,i 1978.
21. Ea ley, Lance. "QFD--Bad Name for a Grrea t Sys tern. "Automotive Industries July 1987: 12.
22. Eureka, William E., and Nancy E. Ryan~ The CustomerDriven Company: Manageri~l Perspectives on QFD.Dearborn, MI: American S~pplier [nst. P, 1988.
23. Fosse, Chris. "Quality Assurpnce Through StrategicProduct Development and QFD." Assn. forManufacturing Excellence 1988 Conference Proc.Aug. 1988. Portland, OR: n.p., n.d. N. pag.

125
24. Fortuna, Ronald M. "Beyond Quality: Taking SPCUpstream. II Quality Progress 21.6 (1988): 23-28.
25. Gupta, A. K., S. P. Raj, and Da~idfor Studying R&D: MarketlngProduct Innovation Process."50 (1986): 7-17.
Wileman. "A ModelInterface in theJour. of Marketing
26. Hauser, John R., and Don Claus ing. liThe House ofQuality." Harvard Business Rev. 66.3 (1988):63-73.
27. Hauser, John R., and Robert L. Klein. "Without GoodResearch, Quality Is a Shot in Dark. II MarketingNews 22.1 (1988): 1+.
28. Hofmeister, Kurt, and Bill Slabey. QFD AwarenessSeminar. Quality Education and Training Center,Ford Motor Co. May 1989 ..Detroit: n.p., n.d.
29. QFD Team Training Four Day Workshop. Dearborn,MI: American Supplier Inst., 1988.
30. Huthwaite, Bart. "Designing-In Quality." Quality27.11 (1988): 34-35.
31. Jackson, Philip C., Philip Klahr, Robert E. Veres, andLakshmi S. Vora. "TIES: An Engineering DesignMethodology and System. II Innovative Applicationsof Artificial Intelligence Conference Proc. 1-3May 1990. Georgetown U, Washington, DC: n.p.,n.d. N. pag. (See also Society of ManufacturingEngineers Technical Paper, TIES, Autofact Conference 1989.)
32. Johne, F. Axel, and Patricia A. Snelson. "SuccessFactors in Product Innovation: A Selective Reviewof the Literature." Jour. of Product InnovationManagement 5 (1988): 114-28.
33. Jones, Ken. "A Break with Tradition." IndustrialManagement 12.4 (1988): 30-32.
34. Kano, Noriaki, Nobuhiku Seraku, Fumio Takahashi, andShinichi Tsuji. "Attractive Quality and Must-BeQuality." Quality 14.2 (1984): 39-48.
35. Kenny, Andrew A. "New Paradigm for Quality Assurance. II
Quality Progress 21.6 (1988): 30-32.

126
36. Ker1inger, Fred N. Foundations of Behavioral Research.New York: Holt, 1973.
37. King, Bob. Better Designs in Half the Time. Methuen,ME: The GOAL/QPC, 1987.
38. King, Robert. "Listening to the Voice of the Customer:Using the Quality Function Deployment System."Nat1. Productivity Rev. 6.3 (1987): 277-81.
39. Kogure, Masao, and Yoji Akao. "Quality FunctionDeployment and CWQC in Japan." Quality Progress16.10 (1983): 25-29.
40. Lansing, John B., and James N. Morgan. Economic SurveyMethods. Ann Arbor: Survey Research Center of theInst. for Social Research of U of Michigan, 1974.
41. Linstone, Harold A. Multiple Perspectives for DecisionMaking Bridging the Gap Between Analysis andAction. New York: Elsevier Science, 1984.
42. Long, Thomas J., John J. Convey, and Adele R. Chwa1ek.Completing Dissertations in the BehavioralSciences and Education. San Francisco: JosseyBass, 1985.
43. Lorsch, Jay W., and Paul R. Lawrence. "Organizing forProduct Innovation." Harvard Business Rev. 43(1965): 109-22.
44. Mauch, James E., and Jack W. Birch. Guide to theSuccessful Thesis and Dissertation. New York:Marcel Dekker, 1989.
45. McElroy, John. "QFD Building the House of Quality."Automotive Industries January 1989: 30-32.
46. Miser, Hugh J., and Edward S. Quade, eds. Handbook ofSystems Analysis, Overview of Uses, Procedures,APE1ications, and Practice. New York: ElsevierSc lence, 1985.
47. Morrell, Norman E. "Quality Function Deployment." SAETechnical Paper Series No. 870272. Warrendale,PA: Soc. of Automotive Engineers, Feb. 1987.N. pag.
48. Moser, C. A., and G. Ka1ton. Survey Methods in SocialInvestigation. London: Heinemann EducationalBooks, 1971.

127
49. Newman, Richard G. "QFD Invol ves Buyers /Suppl iers. "Purchasing World 32.10 (1988): 91-93.
50. Nicholson, Charlie. Quality Function Deployment,Customer Driven Manufacturing, An Overview.Portland, OR: Blount, 1990.
51. Nunnally, Jum C. Psychometric Theory. New York:McGraw, 1978.
52. Peter, J. Paul. "Reliability: A Review of PsychometricBasics and Recent Marketing Practices." Jour. ofMarketing Research 16 (1979), 6-17.
53. Qualit¥ Function Deployment: A Collection of Presentat~ons and QFD Case Studies. Dearborn, MI:American Supplier Inst. P, n.d.
54. Ross, Philip J. "Role of Taguchi Methods and Design ofExperiments in QFD." Quality Progress 21.6(1988): 41-47.
55. Saraph, Jayant V., P. George Benson, and Roger G.Schroeder. "An Instrument for Measurin* theCritical Factors of Quality Management. DecisionSciences 20 (1989): 810-29.
56. Shiraki, Takeshi, and Somi Hibino. "Deployment ofQuality Information Ranging from Product Planningto Sales Service." 1984 A.S.Q.C. 28th AnnualStanford Conference Proc. 13 Oct. 1984. PaloAlto, CA: n.p., n.d. N. pag.
57. Shores, Dick. "TQC: Science, Not Witchcraft." QualityProgress 22.4 (1989): 42-45.
58. Siegel, Sidney. Non-Parametric Statistics for theBehavioral Sciences. New York: McGraw, 1956.
59. Sommers, William P. Product Development: NewApproaches in the 1980s. New York: Booz-Allenand Hamilton, 1979.
60. Souder, William E. "Managing Relations Between R&Dand Marketing in the New Product DevelopmentProjects." Jour. of Product Innovation Management 5 (1988): 6-19.
61. Srinivasan, V., and Amiya K. Basu.of Ordered Categorical Data."8.3 (1989): 205-30.
"The Metric QualityMarketing Science

62. Stratton, Brad.Quality."
"The Refined Focus of AutomotiveQuality Progress 1.10 (1989): 47-50.
128
63. Sullivan, Lawrence P. "Policy Management ThroughQuality Function Deployment." Quality Progress21.6 (1988): 18-20.
64. "Quality Function Deployment." Quality Progress19.6 (1986): 39-50.
65. "Seven Stages in Company-Wide Qual i ty Control."Quality Progress 19.5 (1986): 77-83.
66. Tomlinson, Rolfe, and Istvan Kiss, eds. Rethinking theProcess of Operational Research and SystemsAnalysis. London: Pergamon, 1984.
67. Transactions from a Symposium on Quality FunctionDeployment. 19-20 June 1989. Novi, MI: PlanningCommittee for a Symposium on Quality FunctionDeployment, n.d.
68. Vasilash, Gary S. "Rearing the Voice of the Customer."Production 101.2 (1989): 66-68.
69. Zaltman, Gerald, Karen Lemasters, and Michael Reffring.Theory Construction in Marketing Some Thoughts onThink~. New York: Wiley, 1982.
70. Zultn~r, Richard E. Software Quality Deployment Adaptlng QFD to Software. Princeton: Zultner, 1989.

APPENDIX A
THE SUBJECTIVE AND OBJECTIVE
QUALITY CONCEPTS

130
This dissertation is concerned with providing informa
tion on Q.F.D. In order to provide information on Q.F.D. a
thorough grasp of the Q.F.D. process is required. However,
to understand the Q.F.D. process, an understanding of the
dual nature (subjective and objective) of the word "quality"
1S required.
Just what 1S meant when the word quality is used? Even
today knowledgeable people in the quality field disagree on
the exact definition of the word. It has been widely con
jectured that every person would define it differently.
However, some major elements of the definition of quality
have been agreed upon by thinkers in the quality field.
Around 350 B.C. Aristotle wrote on quality. His four
definitions were stated in his book titled Metaphysics.
John Locke (1632-1704) wrote in Human Intelligence at least
two definitions of quality from his perspective. W.A.
Shewhart, generally considered to be the founder of statis
tical quality techniques, clearly classified the var10US
definitions to date into two broad categories. The first
category is objective quality; and the second is subjective
quality (34).
The objective quality definitions centered around
physical properties; for example, conformance to physically

131
measurable specifications. The subjective quality defini-
tions centered around feelings; for example, goodness of fit
and pleasing looks. These two categories of quality defini-
tions are overlap~ and !should not be seen as mutually
exclusive. The 1950s to the present day has seen more
integrative definitions, such as, products of maximum use
fulness and salability (Deming), customer satisfaction
(Feigenbaum, Juran, and Ishikawa), and loss to societyI
(Taguch i) (34).
In the past, the product's producers' perspective
encouraged the producers to express their quality definitionI
in objective measurements. However, the product's cus-I
tomers' perspective encouraged the customers to expressI
their quality definition in subjective feelings.
The better the product designers listen to the custom-
h b )1 "d ., l' "Th b hers, t e etter tle eSign qua ity. e etter t e pro-I
ducers meet the measurablel design targets, the better theI
"conformance quality." Thus "subjective design quality" and
I "objective conformance quality are both necessary for over-I
all customer satisfaction to occur. Recognition that bothI
"subjective design quality'r' and "objective conformance qual-
ity" are necessary to achi(eve overall product quality is
very importan t.I
It is one of the reasons why the Q.F.D.I
process has been described: as a powerful quality improvementI
methodology.

132
Notice that the better the "objective conformance qual
ity" measures are tied to the "subjective design quality"
feelings, the better the product producers satisfy the cus
tomers. Q.F.D. is directed at improving both the under
standing of the customer's "subjective design quality"
definitions (through a systematic and iterative process) and
the translation of these subjective feelings into the pro
ducer's "objective conformance quality" measures (through a
systematic process). The Q.F.D. process ties "subjective
quality" feelings directly to "objective quality" measures.
The Q.F.D. process is described in more detail in
Chapter I, so that potential Q.F.D. variables, outcomes, and
their relationships may be identified and researched.

APPENDIX B
A MULTIPLE PERSPECTIVES OVERVIEW

134
By its very nature Q.F.D. has both social and technical
components. Therefore, both components should be included
in an assessment of the Q.F.D. process. In the past, most
assessments were done only technically. An excellent sum
mary and overview of the problems with utilizing only a
technical perspective for socio-technical problems are
presented by Linstone (41). Further, a new approach for
improving the analysis of socio-technical situations 1S
developed and presented in this reference. This new
approach is known as Multiple Perspectives. A brief reV1ew
of why Multiple Perspectives is necessary and applicable to
the dissertation and an overview of Multiple Perspectives
follow.
A development of Frederick Taylor's Scientific Manage
ment approach was mankind's increasing reliance upon finding
technical solutions to problems. World War II and opera
tions research led to mathematical/statistical approaches to
solving system problems. Man's successes 1n these areas
were extrapolated such that all systems were thought to be
solvable by systems analysis. However, as socio-technical
problems were analyzed and solved using this technical
approach, analysts and society noticed that the solutions
were not working.

135
Decisions are made by organizations and individuals.
Their perspectives may be very different from a rational/
technical analyst's. Modes of inquiry and problem solving
based solely on a rational/technical approach, inherently,
will not be able to discover all insights concerning organi
zations and individuals. Modes of inquiry and problem
solving based on organizational and personal perspectives
are necessary to improve the socio-technical problem-solving
process (10).
System thinkers found, for example, that some problems
probably cannot be solved. Technical analysis implicitly
assumes a solution. Some social problems have only trade
offs with no optimal solution that satisfies everyone.
Complex social problems cannot be reduced to sub-problems,
which we manage to solve and then reassemble the sub
solutions back into a master solution. The complex interac
tions between social sub-problems prohibit this analytic
reductionism and modeling approach from working.
Further, the rational problem analysis approach
requires quantifiable information. However, not all social
and personal information is easy to quantify. The technical
appr08ch actually encourages objectivity and unbiased obser
vation. By purposely ignoring subjective human factors
(societal, organizational, and personal), the technical
approach encouraged the non-relevance of its "optimum" solu
tion. The investigators also found the rational scientific

136
approach did not handle discounting. For example, an indi
vidual may be opposed to burying garbage in his backyard,
but is not be opposed to burying garbage a hundred miles
away (geographical discounting). Another example is time
discounting. An action taken today is viewed as having more
impact than that same action taken five years from now.
Various system thinkers recognized. the inadequacy of
using only a rational, technical perspective in analyzing
problems--especially socio-technical problems. Their liter
ature and thoughts have been reviewed.and integrated into
the new problem analysis known as Multiple Perspectives (see
Figure 6, Evolution and Synthesis of Multiple Perspectives).
Multiple Perspectives utilizes multiple modes of inquiry to
enrich our understanding of the socio-technical problem
which aids ln improving decisions about these problems (41).
Multiple Perspectives seeks a balanced viewing of
problems. It includes not only the use of the important
technical perspective for viewing and understanding a
problem, but also the use of an organizational perspective
and a personal perspective. These three perspectives are
not mutually exclusive, but they use different viewing
paradigms and different ways of obtaining input. The
technical perspective uses the rational, objective, analyt
ical reductionist paradigm. It gathers its inputs via
abstract non-personal, quantifiable means if possible. The
organizational perspective uses the dialectic, adversarial

· 137
paradigm similar to courtroom ~nqu~ry mode. It gathers its
inputs via group conferences, interviews, probing of
insiders, examining policy, and/or standard operating
procedures. The personal perspective uses the individual
reality, experience and intuition paradigm. It gathers its
inputs via stories, personal discussions, and narratives.
An excellent comparison of the three perspectives is shown
~n Figure 14, A Multiple Perspectives Comparison (41).
Multiple Perspectives was used in the dissertation's
Q.F.D. implementation model's development. Also, it will be
used in the assessment of the model's potential variables
and outcomes.

APPENDIX C
Q.F.D. QUESTIONNAIRE


You are being asked to complete the following CONFIDENTIAL questionnaire. Please thinkback to your Q.F.D. project listed below and answer the questions m regards to only that Q.F.D.project experience.
140
Q.F.D. Project Number: Description:
ISECI10NI
First we would like to ask you some questions about factors which may have affected the Q.F.D.product's design.
How Affected(Circle your answer)
In regards to this Q.F.D. project:
1. How did the chao buildin2 Strongly Stronglymethodolo2)' affect the Q.F.D. Impaired Impaired No Improved ImproVedproduct design? · .......... Design Design Affect Design Design
2. How did chao size/complexity StronglyImproved
StronglyImpaired Impaired No improVed
affect the Q.F.D. product design? Desi8n Design Affect Design Design
3. How did customer informa.tiwl Strongly Stronglyavailability affect the Q.F.D. Impaired Impaired No Improved Improvedproduct design? ·.......... Design Design Affect Design Design
4. How did ~etitive informatioD Strongly Stronglyavailability ect the Q.F.D. Impaired Impaired No Improved ImproVedproduct design? · .......... Design Design Affect Design Design
5. How did determinjn2 accurateStrongly Stronglychan weil:hts affect the Q.F.D. Impaired ImprovedImpaired No ImproVed
product design? · .......... Design Design Affect Design Design
6. How did top manal:ement Strongly Stronglycommjtment affect the Q.F.D. Impaired Impaired No Improved Improvedproduct design? · ......... Design Design Affect Design Design
7. How did Q.F.D. project selection StronglyImpaired Improved
StronglyImpaired No Improved
affect the Q.F.D. product design? Design Design Affect Design Design
8. How did Q.F.D. team composition StronglyImpaired
StronglyImpaired No Improved Improved
affect the Q.F.D. product design? . Design Design Affect Design Design
9. How did Q.F.D. team size affect StronglyImpaired
StronglyImpaired No Improved improVed
the Q.F.D. product design? ... Design Design Affect Design Design
10. How did Q.F.D. team dynamics StronglyImpaired Improved
StronglyImpaired No Improved
affect the Q.F.D. product design? . Design Design Affect Design Design

141
How AfTected(Circle your answer)
In regards to this Q.F.D. project:
11. How did the Q.F.D. Strongly Stronglyimplementation leyellPhase Impaircil Impaired No Improved Improvedaffect the Q.F.D. product design? . Design Design Affect Design Design
12. How did the Q.F.D.~ Strongly Stronglycompletion time affect the Q.F.D. Impaircil Impaired No Improved Improvedproduct design? ........... Design Design Affect Design Design
13. How did the Q.F.D. project's Strongly Stronglyrisibility affect the Q.F.D. product Impaircil Impaired No Improved Improveddesign? ................ Design Design Affect Design Design
14. How did an individual's personal Strongly StronglyQ.F.D. commitment affect the Impaircil Impaired No Improved ImprovedQ.F.D. product design? · ..... Design Design Affect Design Design
15. How did an individual's Q.F.D. Strongly Stronglytraining and experience affect the Impaircil Impaired No Improved ImprovedQ.F.D. product design? · ..... Design Design Affea Design Design
16. How did an individual's personal Strongly Strongly~ affect the Q.F.D. product Impaircil Impaired No Improved Improveddesign? ................ Design Design Affect Design Design
17. How did an individual's ayailable Strongly StronglyQ.F.D. work time affect the Impaircil Impaired No Improved ImprovedQ.F.D. product design? · ..... Design Design Affect Design Design
Second, we would like to ask you some questions about factors which may have affected the Q.F.D.product's cost.
How AfTected(Circle your answer)
In regards to this Q.F.D. project:
18. How did the chan buildingmethodology affect the Q.F.D.product cost? .
19. How did chan sizekoIDplexil)'affect the Q.F.D. product cost? ..
Str:fjR'Cost
StrotWvRaisedCost
RaisedCost
RaisedCost
No LoweredStronglyLowercil
Affect C06l Cost
No LoweredStronglyLowered
Affect C06l Cost

142
How Affected(Circle your answer)
In regards to this Q.F.D. project:
20. How did customer information Str~ StronglyaYaila~ affect the Q.F.D. R' Raised No Lowered Loweredproduct cost? Cost Cost Affect Cost Cost· ...........
21. How did co~etitive informationStr~ Strongly
availabilitY ect the Q.F.D. R' Raised No Lowered Loweredproduct cost? ............ Cost Cost Affect Cost Cost
22. How did determining accurateStr~ Strongly
chan weil:hts affect the Q.F.D. R' Raised No Lowered Loweredproduct cost? · ........... Cost Cost Affect Cost Cost
23. How did top managementStro~ Strongly
commitment affect the Q.F.D. Raise Raised No Lowered Loweredproduct cost? · ........... Cost Cost Affect Cost Cost
24. How did Q.F.D. project selectjon Str:!!?' StronglyR' Raised No Lowered Lowered
affect the Q.F.D. product cost? .. Cost Cost Affect Cost Cost
25. How did Q.F.D. team composition Str:fj StronglyR' Raised No Lowered Lowered
affect the Q.F.D. product cost? .. Cost Cost Affect Cost Cost
26. How did Q.F.D. team size affect str:!!?' StronglyR' Raised No Lowered Lowered
the Q.F.D. product cost? . . . . . . Cost Cost Affect Cost Cost
27. How did Q.F.D. team dynamics Str:!!?' StronglyR' Raised No Lowered Lowered
affect the Q.F.D. product cost? Cost Cost Affect Cost Cost
28. How did the Q.F.D.Str:!!?' Stronglyimplementation LevellPbase R' Raised No Lowered Lowered
affect the Q.F.D. product cost? Cost Cost Affect Cost Cost
29. How did the Q.F.D.~Slr:fj Stronglycompletion time affect the Q.F.D. R' Raised No Lowered Lowered
product cost? · ........... Cost Cost Affect Cost Cost
30. How did the Q.F.D. project'sStronglv StronglyvisjbilitY affect the Q.F.D. product Raised Raised No Lowered Lowered'
cost? ................. Cost Cost Affect Cost Cost
31. How did an individual's personalStrongll StronglyQ.F.D. commitment affect the Raise Raised No Lowered LoweredQ.F.D. product cost? ....... Cost Cost Affect Cost Cost
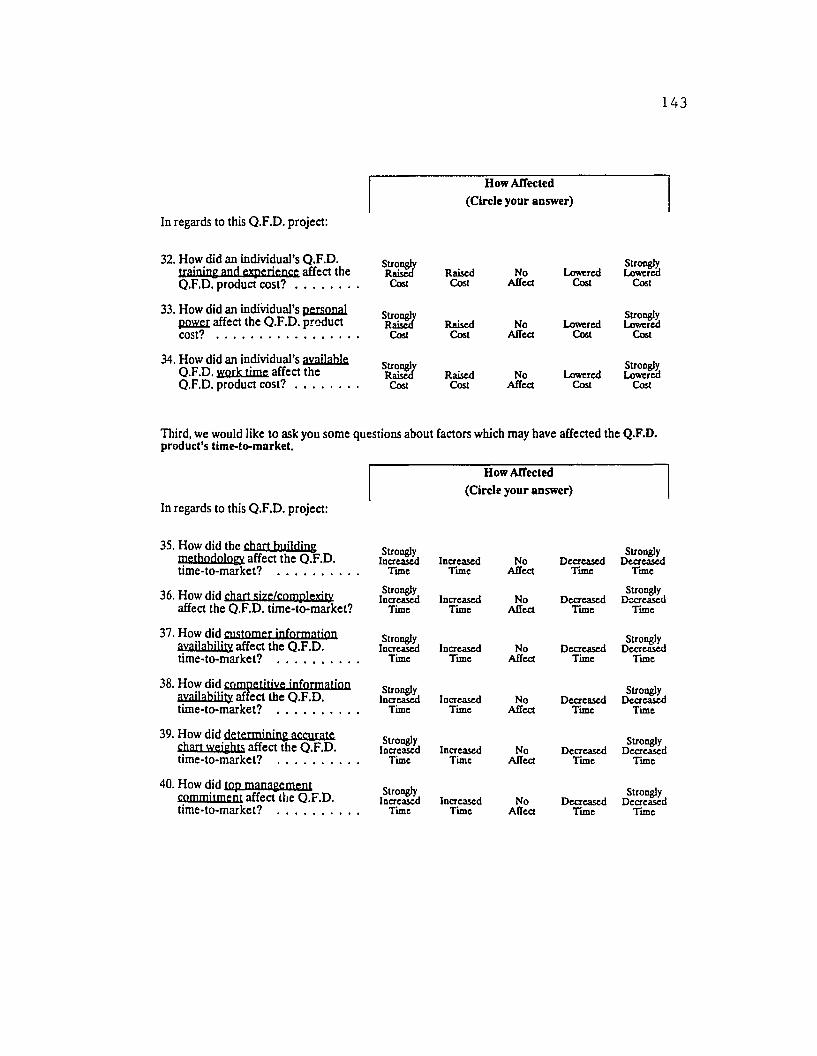
How Affected
(Circle your answer)
In regards to this Q.F.D. project:
32. How did an individual's Q.F.D.Str:fJ Strongly
training and experience affect the R' Raised No Lowered LowcredQ.F.D. product cost? ........ Cost Cost Affect CoM CoM
33. How did an individual's personalStr~ Strongly
~ affect the Q.F.D. product R' Raised No Lowered Lowcredcost? ................. Cost Cost Affect CoM Cost
34. How did an individual's availableStr:fl Strongly
Q.F.D. work time affect the R' Raised No Lowcred LowcredQ.F.D. product cost? ........ Cost CoM Affect Cost Cost
Third, we would like to ask you some questions about factors which may have affected the Q.F.D.product's time-to-market.
143
How Affected
(Circle your answer)
In regards to this Q.F.D. project:
35. How did the chao building Strongly Stronglymethodology affect the Q.F.D. IncreaSed Increased No Decreased Decreasedtime-to-market? · ......... TIlDe TIlDe Affect TIlDe TIlDe
36. How did chao size/complexity Strongly StronglyIncreaSed Increased No Decreased Ir..creased
affect the Q.F.D. time-ta-market? Time Time Affect TIlDe TIlDe
37. How did customer information Strongly Stronglyavailability affect the Q.F.D. IncreaSed Increased No Decreased Decreasedtime-ta-market? · ......... Time TIlDe Affect Time TIlDe
38. How did ~etitive information Strongly Stronglyavailability ect the Q.F.D. IncreaSed Increased No Decreased Decreisedtime-ta-market? · ......... Time Time Affect Time Time
39. How did determining accurate Strongly Stronglychan weights affect the Q.F.D. IncreaSed Increased No Decreased Decreasedtime-to-market? · ......... Time Time Affect Time TIlDe
40. How did top management Strongly Stronglycommitment affect the Q.F.D. Increased Increased No Decreased Decreasedtime-to-market? · ......... Time Time Affect Time Time

144
How Affected
(Circle your answer)
In regards to this Q.F.D. project:
41. How did Q.F.D. project selectionStrongly
No DecreasedStrongly
IncreaSed Increased Decreasedaffect the Q.F.D. time-ta-market? Tune Time Affect Tune Time
42. How did Q.F.D. team compositionStrongly
No DecreasedStrongly
IncreaSed Increased Decreasedaffect the Q.F.D. time-ta-market? Tune Time Affect Tune Time
43. How did Q.F.D. team size affectStrongly
DecreasedStrongly
IncreaSed Increased No Decreasedthe Q.F.D. time-ta-market? ... Tune Tune Affect Time Time
44. How did Q.F.D. team dYnamicsStrongly
DecreasedStrongly
IncreaSed Increased No Decreasedaffect the Q.F.D. time-to-market? Time Time Affect Tune Time
45. How did the Q.F.D. Strongly Stronglyimplementation LeyellPbjl!je IncreaSed Increased No Decreased Decreasedaffect the Q.F.D. time-to-market? Time Time Affect Time Time
46. How did the Q.F.D.~ Strongly Stronglycompletion time affect the Q.F.D. Increased Increased No Decreased Decreasedtime-to-market? · ........ Time Time Affect Time Time
47. How did the Q.F.D. proiect's Strongly Stronglyyjsibilin- affect the Q.F.D. Increased Increased No Decreased Decreasedtime-to-market? · ...... Time Time AffCCl Time Time
48. How did an individual's personal Strongly StronglyQ.F.D. commitment affect the IncreaSed Increased No Decreased Decre.iSedQ.F.D. time-ta-market? ..... Tune Time Affect Time Tune
49. How did an individual's Q.F.D. Strongly Stronglytrainjng and elQ2erience affect the Increased Increased No Decreased DecreasedQ.F.D. time-ta-market? ..... Time Time Affect Time Time
50. How did an individual's personal Strongly Strongly~ affect the Q.F.D. Increased Increased No Decreased Decreasedtime-to-market? · ........ Time Time Affect Time Tune
51. How did an individual's ayailable Strongly StronglyQ.F.D. work time affect the Increased Increased No Decreased DecreasedQ.F.D. time-ta-market? ..... Time Time Affect Time Time

Fourth, we would like to ask YOlu some ques~ons about factors which may have affected the Q.F.D.product's communications and documentation effort.
How Afl'ected(Circle your answer)
In regards to this Q.F.D. project:
52. How did the chan b~ldjng I Strongly Stronglymethodology affect e Q.FfD. Impaircil Impaired Improved ImproVedproduct communications and Commun. Commun. No Commun. Commun.documentation effort? ..:..... Docum. Docum. Affect Docum. Docum.
53. How did chart size/cClmplexitYStrongly Strooglyaffect the Q.F.D. pr~uct I Impaircil Impaired Improved ImproVed
communications and I Commun. Commun. No Commun. Commun.documentation effort? · . ,..... Docum. Docwn. Affect Docum. Docum.
54. How did customer infQrmationStrongly StronglyavailabilitY affect the Q.F.Di. Impaircil Impaired Improved ImproVed
product communications and Commun. Commun. No Commun. Commun.documentation effo~? ..:..... Docwn. Docwn. Affect Docum. Docwn.
55. How did co~etitive infornnationStrongly StronglyavailabilitY ect theQ.F.Di. Impaired Impaired Improved ImproVed
product communications and Commun. Commun. No Commun. Commun.documentation effort? ....... Docwn. Docwn. Affect Docwn. Docum.
56. How did determjninQ' accuratechan weights affect ~le Q.FfD. Strongly
Impaired ImprovedStroogly
Impaired Improvedproduct communications and Commun. Commun. No Commun. Commun.documentation effort,? ..,.... Docum. Docwn. Affect Docum. Docum.
57. How did top manage1Dent IStronglycommitment affect tqe Q.F.p. Strongly
Impaired ImprovedImpaired ImproVedproduct communicati,ons and Commun. Commun. No Commun. Commun.documentation effort,? ..,.... Docum. Docwn. Affect Docum. Docum.
58. How did Q.F.D. proj~ct selcl.l:1ianaffect the Q.F.D. prOj:!uct , Strongly
Impaired ImprovedStroogly
communications and I ImpairedNo
improVedCommun. Commun. Commun. Commun.
documentation effort,? · . ~ . . . . Docwn. Docum. Affect Docum. Docum.
59. How did Q.F.D. tealIl compbsitinnaffect the Q.F.D. propuct , Strongly
ImpairedStroogly
communications and I Impaircil Improved ImproVedCommun. Commun. No Commun. Commun.
documentation effort,? · . ~ . . . . Docum. Docwn. Affect Docwn. Docum.
145
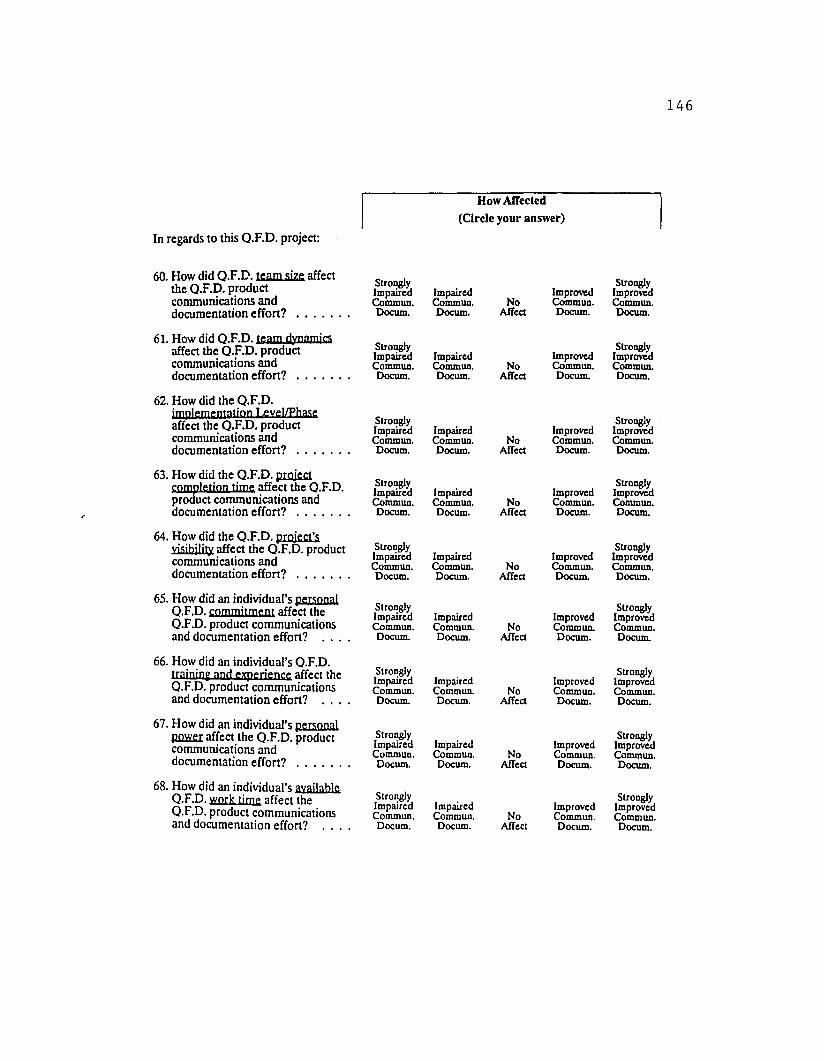
How Affected(Circle your answer)
In regards to this Q.F.D. project:
60. How did Q.F.D. team sjze affectStroJ!8ly Stronglythe Q.F.D. product Impairca Impaired Improved Improved
communications and Commun. Commun. No Commun. Commun.documentation effort? Docum. Docum. Affect Docum. Docum.· ......
61. How did Q.F.D. team dynamjcsStronglyaffect the Q.F.D. product StroJ!8ly
ImprovedImpaired Impaired ImproVedcommunications and Commun. Commun. No Commun. Commun.documentation effort? · ...... Docum. Docum. Affect Docum. Docum.
62. How did the Q.F.D.implementation I.eyelIPhase
StroJ!8ly Stronglyaffect the Q.F.D. product Impaired Impaired Improved ImproVedcommunications and Commun. Commun. No Commun. Commun.documentation effort? · ..... Docum. Docum. Affect Docum. Docum.
63. How did the Q.F.D.~StroJ!8ly Strongly
co~letjQn time affect the Q.F.D. Impaired Impaired Improved ImproVedpr uct communications and Commun. Commun. No Commun. Commun.documentation effort? ....... Docum. Docum. Affect Docum. Docum.
64. How did the Q.F.D. project'svisibilin' affect the Q.F.D. product Strongly Strongly
Impaired Impaired Improved Improvedcommunications and Commun. Commun. No Commun. Commun.documentation effort? · ..... Docum. Docum. Affect Docum. Docum.
65. How did an individual's personalStronglyQ.F.D. commitment affect the StroJ!8ly
ImprovedImpaired Impaired ImprovedQ.F.D. product communications Commun. Commun. No Commun. Commun.and documentation effort? ... Docum. Docum. Affect Docum. Docum.
66. How did an individual's Q.F.D.Strongly Stronglytrajnjnl: and elijJerience affect the Impaired Impaired Improved ImprovedQ.F.D. product communications Commun. Commun. No Commun. Commun.
and documentation effort? Docum. Docum. Affect Docum. Docum.
67. How did an individual's personal~ affect the Q.F.D. product StroJ!8ly
Impaired ImprovedStrongly
communications and Impaired ImprovcdCommun. Commun. No Commun. Commun.
documentation effort? · ..... Docum. Docum. Affect Docum. Docum.
68. How did an individual's ayajlableQ.F.D. work time affect the Strongly
ImpairedStrongly
Impaired Improved ImprovedQ.F.D. product communications Commun. Commun. No Commun. Commun.and documentation effort? Docum. Docum. Affect Docum. Docum.
146

ISEcrIONII
Now we would like to ilSk you a few questions on your Q.F.D. process experience.
Degree orImprovement(Circle your Dnswer)
When compared to pnor non-Q.F.D.experiences/processes: I
147
69. To what degree did. the Q.F.D.process improve tb~ product'sdesign? . . . . . . . . . " . . . . .
70. To what degree did the Q.F.D.process reduce the product's costs?
71. To what degree did the C).F.D.process reduce the produ(;fs .tjme-to-market? I..;......
Much MuchWorse Worse Same Better Better
Much MuchH~r H~r Same Lower Lower
Cost Cost Cost
Much MuchLonger Longer Same Shorter ShorterTune Tune Tune Tune Tune
72. To what degree did the G>.F.D.process improve tb~ product'sproject communicalioos WIddocumentation? . , .. J ••••••
ISECIlONIII
MuchWorse Worse Same Better
MuchBetter
Finally, we would like to ask'you to provide some measurements about this Q.F.D. project.
73. a. Approximately how many customer wants (chart's horizontal) end items were used in thisQ.F.D. project? :
____.....:Pdmary chart rows (end items)
b. Approximately t,ow many product design features (chart's vertical) end items were used inthis Q.F.D. proj~ct? I
_____Primary chart columns (end items)
74. Approximately wha~ percentage of the necessary customer information was available tosupport this Q.F.D. projeCt?
----_%

75. Approximately what percentage of the necessary competitive information was available tosupport this Q.F.D. project?
----_%
76. Approximately how many people, incll./ding yourself, did your Q.F.D. core team include?
_____People
77. What was the Q.F.D. LeveVPhase that this Q.F.D. pr(j)ject completed? (check one box)
o Completed through ~..eveVPhase 1-I Product Planning
o Completed through ~..eveVPhase2 -I Product Design
o Completed through 1..eveVPhase 3 -I Process Planning
o Completed through 1..eveVPhase 4 -I Production Controls Manufacturing
78. Approximately how many months did t.his Q.F.D. pro.lectlast?
_____Months
148

What else would you like to tell the researchers concerning this Q.F.D. project?
Your contribution to this important research on Q.F.D. is greatlyappreciated. Improving Q.F.D. and its implementation is of vital
importance to sales, profits, and jobs. Thank you!
Please return this questionnaire to:
Attention: Geoffrey P. GilmoreSYSTEM SCIENCE Ph.D. PROGRAMPORTI.AND STATE UNIVERSITYP.O. Box 751Portland, Oregon 97207
149

APPENDIX D
ASSOCIATED Q.F.D. QUESTIONNAIRE DOCUMENTS:
ONE-WEEK POST CARD FOLLOW-UP, THREE-WEEK
COVER LETTER FOLLOW-UP AND SEVEN-WEEK
COVER LETTER FOLLOW-UP

151
PORTLAND STATE UNIVERSITYSYSTEMS SCIENCE PH.D. PROGRAMPortland, Oregon 97207
January 14, 1991
John DoeCompany AddressDearborn, Michigan 18428
Last week a questionnaire seeking your knowledge of QualityFunction Deployment (Q.F.D.) was mailed to you.
If you have already completed and returned the questionnaire, please accept our sincere thanks. If not, please doso today. Because you were a Q.F.D. project team leader,your knowledge is vital to this research on improving Q.F.D.
If by some chance you did not receive the questionnaire, orit got misplaced, please call me right away at (503) 6598750, extension 237, and I will get another one in the mailto you today.
Sincerely,
Geoffrey P. GilmoreProject Director

152
PORTLAND STATE UNIVERSITYSYSTEMS SCIENCE PH.D PROGRAMPortland, Oregon 97207
January 28, 1991
John DoeCompany AddressDearborn, Michigan 18428
About three weeks ago I wrote to you seeking your knowledgeof Quality Function Deployment (Q.F.D.). As of today I haveyet to receive your completed questionnaire.
Our research purpose is to determine Q.F.D. variables, outcomes, and their relationships in order to improve Q.F.D.and its implementation. With billions of dollars in salesand profits (and millions of jobs) depending upon improvingcustomer satisfaction, improving Q.F.D. and its implementation is vitally important.
I am writing you again because of the significance eachquestionnaire has to the importance of this study. Yourparticipation as an experienced Q.F.D. project team leaderis crucial to our results. We have only a limited number ofexperienced Q.F.D. project team leaders who may provide thenecessary information for this study. It is essential thateach Q.F.D. project team leader return their questionnaire.
In the event that your confidential questionnaire has beenmisplaced, a replacement is enclosed.
Your cooperation is greatly appreciated.
Sincerely,
Geoffrey P. GilmoreProject Director
P.S. A number of people have written to ask how they mayreceive a summary of the study's results. You maycontact your Corporate Q.F.D. Coordinator, Hal Schaal,for a summary of the study's results. Your confidentiality will be protected; only a summary of thestudy's results will be provided to those personsexpressing an interest in the study.
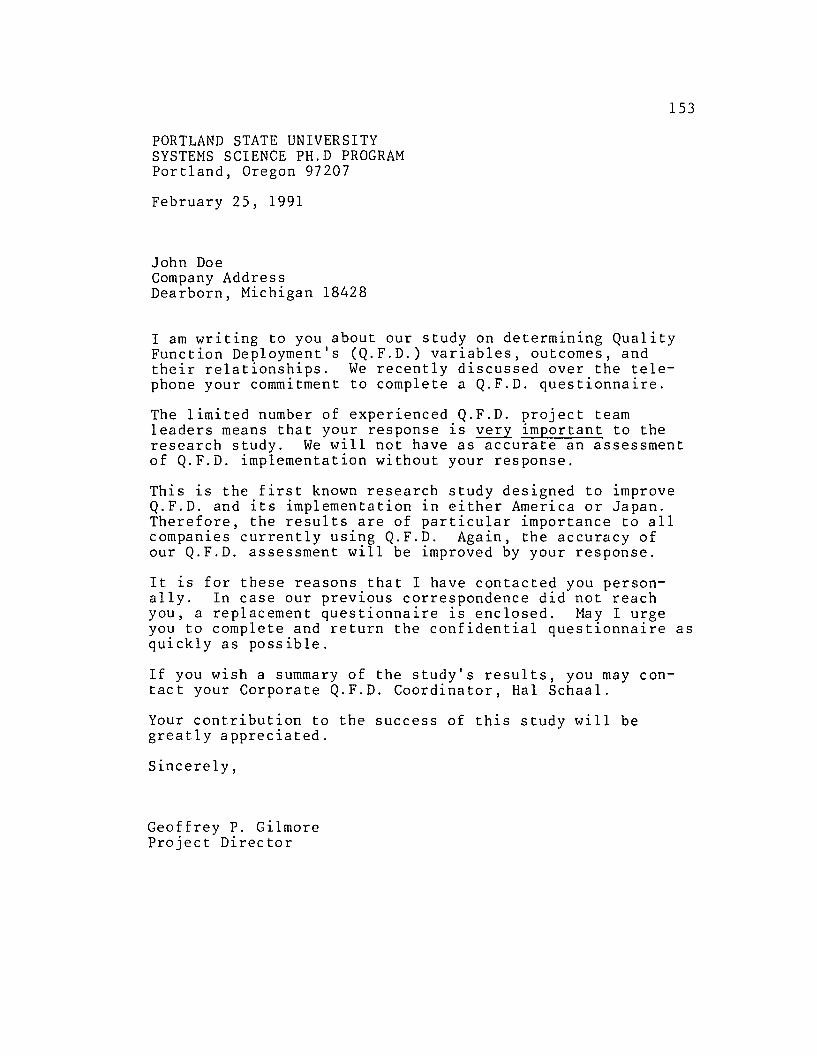
153
PORTLAND STATE UNIVERSITYSYSTEMS SCIENCE PH.D PROGRAMPortland, Oregon 97207
February 25, 1991
John DoeCompany AddressDearborn, Michigan 18428
I am wrltlng to you about our study on determining QualityFunction Deployment's (Q.F.D.) variables, outcomes, andtheir relationships. We recently discussed over the telephone your commitment to complete a Q.F.D. questionnaire.
The limited number of experienced Q.F.D. project teamleaders means that your response is very important to theresearch study. We will not have as accurate an assessmentof Q.F.D. implementation without your response.
This is the first known research study designed to lmproveQ.F.D. and its implementation in either America or Japan.Therefore, the results are of particular importance to allcompanies currently using Q.F.D. Again, the accuracy ofour Q.F.D. assessment will be improved by your response.
It is for these reasons that I have contacted you personally. In case our previous correspondence did not reachyou, a replacement questionnaire is enclosed. May I urgeyou to complete and return the confidential questionnaire asquickly as possible.
If you wish a summary of the study's results, you may contact your Corporate Q.F.D. Coordinator, Hal Schaal.
Your contribution to the success of this study will begreatly appreciated.
Sincerely,
Geoffrey P. GilmoreProject Director

APPENDIX E
POTENTIAL QUESTIONS FOR Q.F.D. INTERVIEWS

155
Potential Organizational Questions:
1. What groups were involved in this Q.F.D. project?(So these groups participated in the Q.F.D. project?)
2. How did groups affect this Q.F.D. project?(So this group affected Q.F.D. how?)
3. How did the Q.F.D. team get organized?(So it was organized by ... ?)
4. Did the Q.F.D. team get any policy or procedure guidelines from anyone?(So the standard policy/procedure of ... ?)
5. How did the Q.F.D. team function?(So the team func t ioned . . .?)
6. How did the teams' project turn out?(Then the project turned out ... ?)
Potential Personal Questions:
7. How do you feel about Q.F.D.?(So you feel Q. F. D. .?)
8. Would you describe some Q.F.D. project benefits/detriments?(Why do you say that? Would you elaborate on that?)
9. Would you describe the Q.F.D. team members for me?(So contributed to ?)
10. How much training and experience in Q.F.D. did you allhave?(So you had training and experience?)
11. How much time was available to work on this Q.F.D.project?(So everyone had time available?)
12. Were there any other key team members excludingyourself?(So was a key player?)
13. Who else would you recommend that I talk with?(Why would they be important to see?)
NOTE: Not all questions may be asked as the interviewershall be opportunistic and adapt the interview to follow theleads provided by the interviewees. Top, middle, and bottomQ.F.D. team personnel will be interviewed to obtain severaldifferent outlooks on the Q.F.D. project.

APPENDIX F
QUESTIONNAIRE Q.F.D. VARIABLE/OUTCOME HISTOGRAMS

157
40 30
30
20
f4 f4
S 20 S00(J(J
1010
003 4 2 32
OESN(l) OESN(2)
30 40
3020
f4f4S S 20
00(J(J
10
10
001 2 3 4 !5 1 2 4
OESN(3) OESN (4)
3025
2020
lot 15S f40 S(J
010 (J 10
5
02 3 4 0
1 2OESN(5)
OESN(6)

158
2540
20
30
15.. ..5 5 200u 10 0
u
510
0 02 3 4 5 1 3 4 5DESN(7) DESN(B)
25 40
2030
15.. ..5 5 200 0u 10 u
105
0 01 2 3 4 5 1 2 3 4 5
DESN(9) DESN(10)

159
30 50
40
2030.. ..
S S0 0C) C) 20
10
10
0 02 3 4 5 2 3 4 5
DESN(13) DESN(14)
40 30
3020
.. ..S 20 S0
0C)
C)
10
10
0 02 3 4 5 4 5
DJ:SN(15) DESN(16)
25
20
15..S0C) 10
5
01 2 3 -41 5
DJ:SN(17)

160
so so .,--
40 40
30 30Eo< Eo<
5 S0 0u 20 u 20
10 10
0 02 3 4 2 3 4
COS'l' (10) COS'l' (19)
40 30
30
20
Eo< Eo<S 20 S0 0u u10
10
0 01 2 3 4 1 2COS'l' (20) COS'l' (21)
5040
40
30
30Eo<
Eo<5 S 200u 20 0
u
10 10
002 3 4
~ 3COS'l' (22)
COS'l' (23)

161
5040
40
30
30.. ..6 6 200
0u 20 u
1010
0 02 3 4 5 1 2 3 4 5COS'l' (24) COS'l' (25)
50 40
4030
30.. ..5 6 200 0u 20 u
1010
0 01 2 3 4 2 3COS'l' (26) COS'l' (27)
5050
4040
3030.. ..5 60
0u 20 u 20
1010
001 2 3 4 2 3 4
COS'l' (28)COS'l' (29)

162
40 40
30 30
f< f<
5 20 S 200 0u u
10 10
0 02 3 4 5 2 3 4 5
COST(30) COST(31)
40 50
4030
30f< I<
S 20 50 0U u 20
1010
0051 2 3 4 2 3 4 5
COST(32) COST (33)
40
30
I<
5 200u
10
01 2 4
COST(34)

163
4040
3030
... ...5 205 2000uU
1010
03 0
2 31TIME (35)
TIME (36)
30 r----,-.....,..-....,..---r--,-~30 r----,-.....,..-....,..---r--,-~
...5ou
20
10
o1 2
TIME (37)
20
10
o1 2 3
TIME (38)
4040
3030
Eo< ..S 20
5 200u
0U
1010
02 3 0
2 3TIME (39)
T:tHE(40)

164
40 . 30
30
20
Eo< Eo<
S 20 S0 0U u
1010
0 01 2 3 4 5 2 3 4
'rIME (41) 'rIHE(42)
40 30
30
20
Eo< Eo<
S 20 S0 0U u
1010
0 02 3 4 2 3 4 5
'rIHE(43) 'l'IKJ: (44)
50 40
4030
30Eo< Eo<
6 S 200 0u 20 u
1010
002 3 4 1 2 3 4
'rIME (45) 'rIKI: (46)

165
40 30
3020
.. ..S 20 S0 0tJ tJ
10
10
0 03 4 5
TIME (47) TIHE(48)
4040
3030
.. ..S 20 S 20
00
tJtJ
1010
00
4 5 3 4 5
TIJa: (49) TIJa: (50)
25
20
15..S0tJ 10
5
0
TIJa:(51)

166
2540
2030
15f< f<
S 20 S00u 10u
105
002 1 21
COHM(52) COMM(53)
1
20
10
30 .....--..---..---..---.--.----,
~ou
234
COHM(54)
1o
30 ...--.....--,r----r-~-_,._-..,
20
10
f<
Sou
4040
3030
f<f<S 20S 2000Uu
1010
04 02 3
1 . 2 3 4 5COMM(S6)
CC»OC (57)

167
40 40
30 30
to ...5 20 5 200 0CJ CJ
10 10
0 01 2 3 4 5 1 3 4 5
COHM(5B) COHK(59)
30 .---,----r--.....,---,..-----,
3 4
COHM(61)
2o
10
20
30 r--,-----r--..-----r-----,
~oCJ
4
COHM(60)
2o
10
20
to
5oCJ
40 40
30 30
toto
5 20 5 20
00
CJCJ
10 10
0 03 4 5
COHM(63)

168
30 40
3020
.. ..S S 200 0U U
10
10
0 04 1 2 3 4 S
COKH(64) COKK(6S)
30 40
30
20
.. ..S S 20
00 Uu10
10
0 02 3 4 S 3 4 5
COKK(66) COKK(67)
20
lS
..5 100u
S
01 2 3 4 5
COKK(68)

169
40 30
30
20
'" '"S 20 S0 0U U
10
10
0 01 3 4 5 2 3 4 5
PROC(69) PROC (70)
30 40
30
20
'" '"S S 200 0U u
10
10
0 02 3 4 5 1 2 3 4 5
PROC(71) PROC(72)

APPENDIX G
Q.F.D. VARIABLES FACTOR ANALYSES

ITERATIVE PRINCIPAL AXIS FACTOR AN~LYSIS
171
ITERATION123456789
MAXIMUM CHANGE IN CO~~ALITIES
0.80830.35050.05130.01670.00640.00400.00250.00150.0009
FINAL COMMUNALITY ESTIMATES
2
0.086 0.130
LATENT ROOTS (EIGENVALUES)
2 3 4 5
4.361 1. 703 0.944 0.624 0.359
6 7 8 9 10
0.177 0.083 0.032 -0.002 -0.092
11 12 13 14 15
-0.127 -0.139 -0.196 -0.368 -0.393
16 17
-0.424 -0.478

FACTOR PATTERN
2
DESN(10) 0.776 -0.157DESN (13) 0.765 -0.130DESN (6) 0.717 -0.128DESN (9) 0.682 -0.070DESN(7) 0.659 -0.276DESN (14) 0.601 -0.031DESN (8) 0.595 -0.346DESN(3) 0.114 0.683DESN(4) 0.044 0.582DESN(17) 0.455 0.479DESN (12) 0.316 0.395DESN (5) 0.158 0.332DESN C16) 0.497 0.316DESN(2) 0.316 0.175DESN(l1) 0.427 0.083DESN(15) 0.292 0.060DESN Cll 0.293 0.009
VARIANCE EXPLAINED BY FACTORS
1 2
4.361 1.703
PERCENT OF TOTAL VARIANCE EXPLAINED
1 2
25.655 10.017
ROTATED FACTOR PATTERN
1 2
DESN C10) 0.787 0.082DESN(13) 0.768 0.105DESN (6) 0.722 0.093DESN (7) 0.712 -0.066DESN(8) 0.672 -0.152DESN(9) 0.671 0.137DESN (14) 0.583 0.150DESN(3) -0.096 0.686
172

DESN (17) 0.291 0.593DESN(4) -0.132 0.569DESN(12) 0.183 0.472DESN (16) 0.380 0.450DESN(5) 0.052 0.364DESN(2) 0.249 0.261DESN(ll) 0.382 0.207DESN(15) 0.260 0.145DESN (1) 0.277 0.096
VARIANCE EXPLAINED BY ROTATED FACTORS
1 2
173
4.123
PERCENT OF TOTAL VARIANCE EXPLAINED
1. 941
2
24.254 11.418
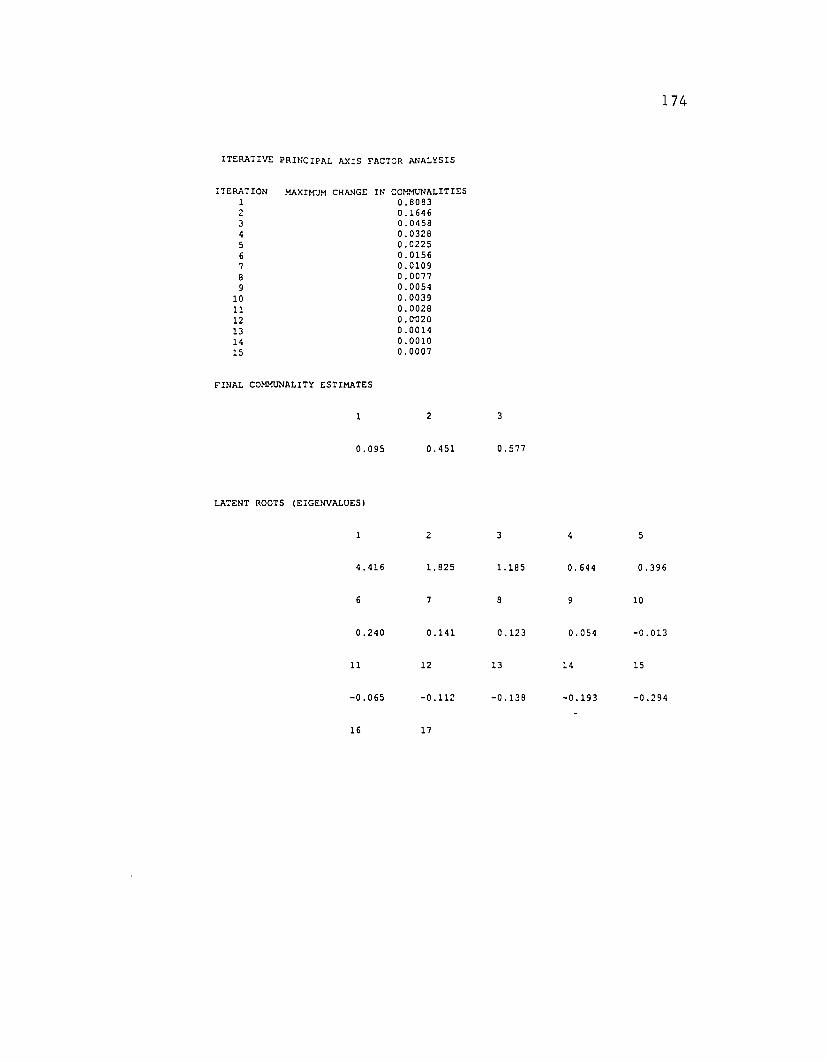
ITERATIVE PRINCIPAL AXIS FACTOR ANALYSIS
174
ITERATION123456789
101112131415
MAXIMUM CHANGE IN COMMUNALITIES0.80830.16460.04580.03280.02250.01560.01090.00770.00540.00390.00280.00200.00140.00100.0007
FINAL COMMUNALITY ESTIMATES
1
0.095
2
0.451
3
0.577
LATENT ROOTS (EIGENVALUES)
2 3 4 5
4.416 1. 825 1.185 0.644 0.396
6 7 8 10
0.240 0.141 0.123 0.054 -0.013
11 12 13 14 15
-0.065 -0.112 -0.138 -0.193 -0.294
16 17
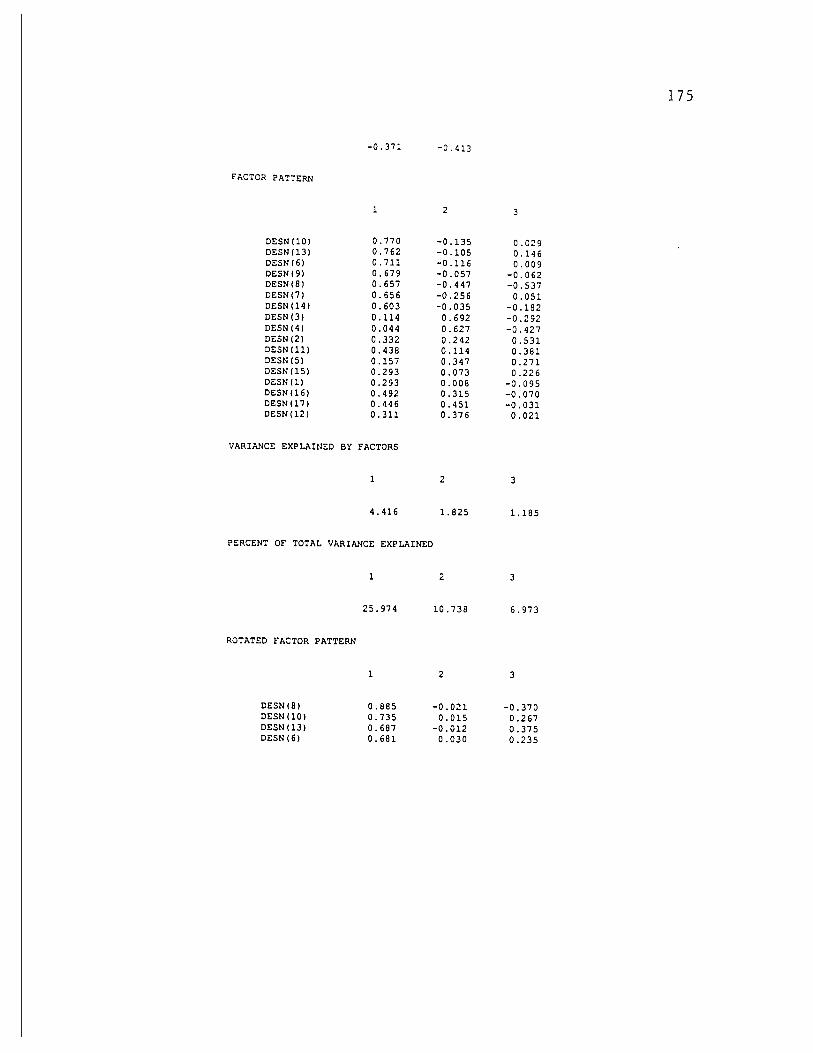
-0.371 -0.413
FACTOR PA':'TERN
2
DESN (10) 0.770 -0.135 0.029DESN(13) 0.762 -0.105 0.146DESN(6) 0.711 -0.116 0.009DESN(9) 0.679 -0.057 -0.062DESN(8) 0.657 -0.447 -0.537DESN(7) 0.656 -0.256 0.051DESN(14) 0.603 -0.035 -0.182DESN(3) 0.114 0.692 -0.292DESN(4) 0.044 0.627 -0.427DESN(2) 0.332 0.242 0.531DESN(l1) 0.438 0.114 0.381DESN(5) 0.157 0.347 0.271DESN (15) 0.293 0.073 0.226DESN(l) 0.293 0.008 -0.095DESN (16) 0.492 0.315 -0.070DESN (17) 0.446 0.451 -0.031DESN(12) 0.311 0.376 0.021
VARIANCE EXPLAINED BY FACTORS
2 3
4.416 1. 825 1.185
PERCENT OF TOTAL VARIANCE EXPLAINED
2 3
25.974 10.738 6.973
ROTATED FACTOR PATTERN
2 3
DESN(8) 0.885 -0.021 -0.370DESN (10) 0.735 0.015 0.267DESN (13) 0.687 -0.012 0.375DESN(6) 0.681 0.030 0.235
175

DESN (7) 0.666 -0.122 0.200DESN(9) 0.650 0.108 0.183DESN(14l 0.605 0.167 0.060DESN(3) -0.051 0.757 0.043DESN (4) -0.058 0.748 -0.122DESN(2) 0.082 0.034 0.666DESN (11) 0.259 0.010 0.532DESN(5) -0.045 0.210 0.416DESN (15) 0.182 0.017 0.330DESN(17) 0.262 0.492 0.304DESN(12l 0.151 0.378 0.271DESN(16) 0.359 0.400 0.239DESN(l) 0.287 0.106 0.032
VARIANCE EXPLAINED BY ROTATED FACTORS
2 3
3.908 1. 788 1.730
PERCENT OF TOTAL VARIANCE EXPLAINED
2 3
22.986 10.520 10.179
176

ITERATIVE PRINCIPAL AXIS FACTOR ANALYSIS
177
aERATION123456789
101112131415
MAXIMUM CHANGE IN COMMUNALITIES0.80830.15600.03730.02600.01760.01200.00830.00570.00410.00310.00240.00190.00150.00110.0009
FINAL COMMUNALITY ESTIMATES
2 3 4
0.093 0.492 0.704 0.539
LATENT ROOTS (E IGENVALUES)
2 3 4 5
4.468 1. 897 1.199 0.760 0.440
6 7 8 9 10
0.278 0.204 0.172 0.071 0.014
11 12 13 14 15
-0.003 -0.051 -0.078 -0.171 -0.236
16 17
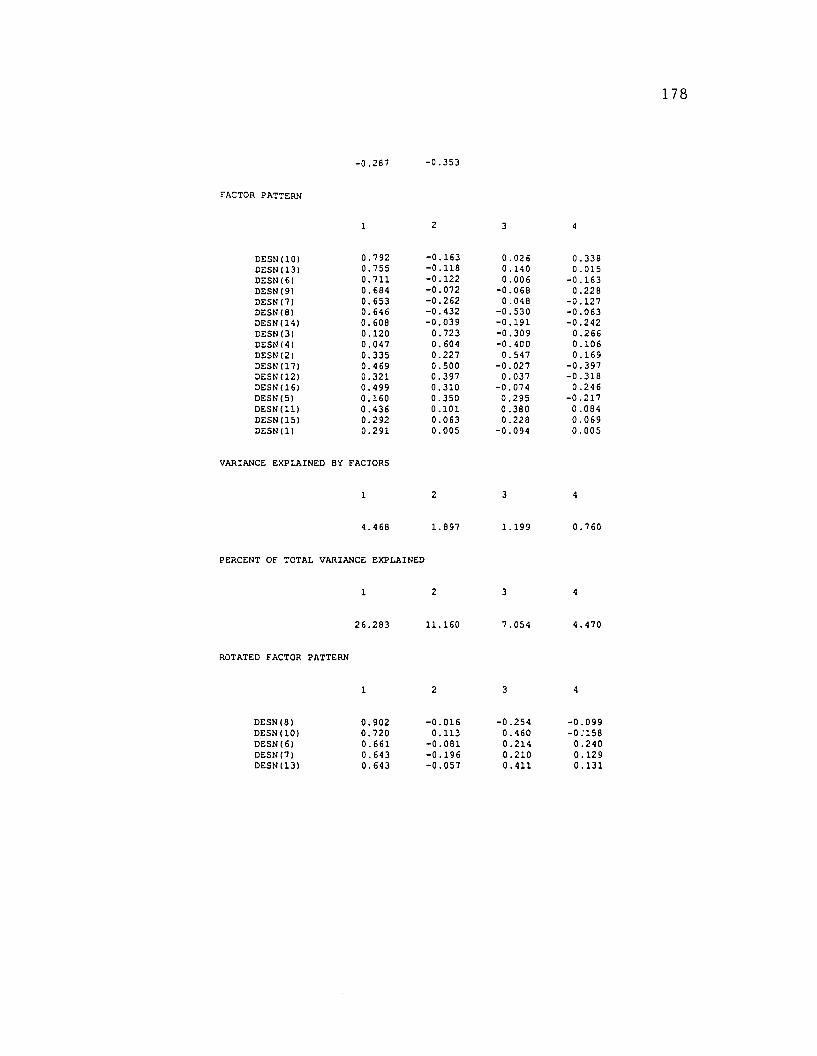
-0.287 -0.353
fACTOR PAT':'ERN
2 3 4
DESN ClO) 0.792 -0.163 0.026 0.338DESN (13) 0.755 -0.118 0.140 0.015DESN (6) 0.711 -0.122 0.006 -0.163DESN (9) 0.684 -0. on -0.068 0.228DESN (7) 0.653 -0.262 0.048 -0.127DESN(8) 0.646 -0.432 -0.530 -0.063DESN (14) 0.608 -0.039 -0.191 -0.242DESN(3) 0.120 0.123 -0.309 0.266DESN(4) 0.047 0.604 -0.400 0.106DESN(2) 0.335 0.227 0.547 0.169DESN (17) 0.469 0.500 -0.027 -0.397DESNCl2) 0.321 0.397 0.037 -0.318DESNCl6) 0.499 0.310 -0.074 0.246DESN(5) 0.160 0.350 0.295 -0.217DESN(l1) 0.436 0.101 0.380 0.084DESN(15l 0.292 0.063 0.228 0.069DESN(l) 0.291 0.005 -0.094 0.005
VARIANCE EXPLAINED BY FACTORS
1 2 3 4
4.468 1. 897 1.199 0.760
PERCENT OF TOTAL VARIANCE EXPLAINED
1 2 3 4
26.283 11.160 7.054 4.470
ROTATED FACTOR PATTERN
2 3 4
DESN(8) 0.902 -0.016 -0.254 -0.099DESN(10) O. no 0.113 0.460 -0:158DESN(6) 0.661 -0.081 0.214 0.240DESN(7) 0.643 -0.196 0.210 0.129DESN(13) 0.643 -0.057 0.411 0.131
178

DESN (9) 0.633 0.164 0.314 -0.062DESNC14l 0.616 0.028 0.000 0.293DESN (3) -0.049 0.820 0.059 0.160DESN(4) -0.032 0.695 -0.133 0.191DESN(2) 0.008 0.021 0.685 0.149DESN (11) 0.203 -0.018 0.537 0.150DESN (17) 0.254 0.263 0.114 0.694DESN(12) 0.136 0.174 0.113 0.549DESNC5l -0.083 0.040 0.280 0.442DESN(15) 0.146 0.003 0.343 0.084DESNC16l 0.340 0.436 0.313 0.082DESN(1) 0.283 0.086 0.051 0.057
VARIANCE EXPLAINED BY ROTATED FACTORS
2 3 4
3.727 1. 544 1. 735 1. 318
PERCENT OF TOTAL VARIANCE EXPLAINED
1 2 3 4
21. 926 9.082 10.205 7.755
179

ITERATIVE PRINCIPAL AXIS FACTOR ANALYSIS
180
ITERATION12345678
MAXIMUM CHANGE IN COMMUNALITIES0.54400.41660.04900.01780.00690.00320.00160.0008
FINAL COMMUNALITY ESTIMATES
1
0.613
2
0.637
LATENT ROOTS (EIGENVALUES)
1 2 3 4 5
4.704 1. 765 1. 061 0.747 0.559
6 7 8 9 10
0.273 0.187 0.101 0.049 -0.137
11 12 13 14 15
-0.225 -0.309 -0.356 -0.401 -0.445
16 17
-0.531 -0.573
FACTOR PATTERN
1 2
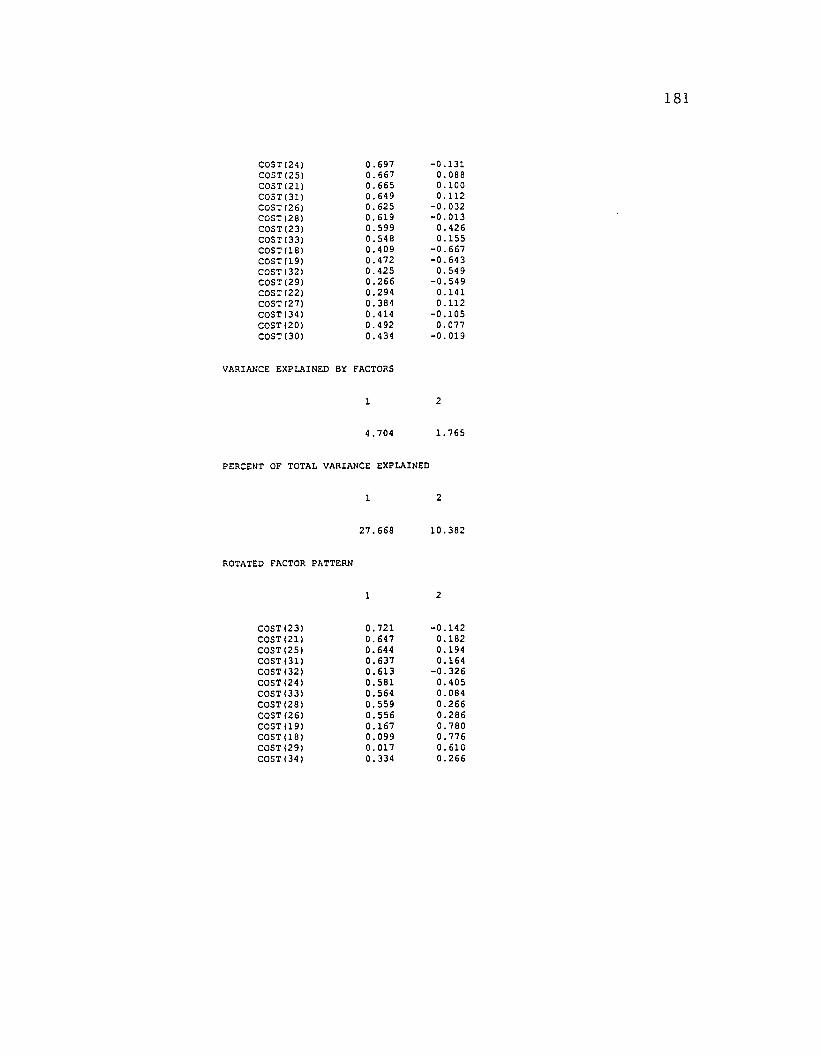
COST(24) 0.697 -0.131COST (25) 0.667 0.088COST(21) 0.665 0.100COST(31) 0.649 0.112COST (26) 0.625 -0.032COST (28) 0.619 -0.013COST (23) 0.599 0.426COST(33) 0.548 0.155COST(18) 0.409 -0.667COST(19) 0.472 -0.643COST (32) 0.425 0.549COST(29) 0.266 -0.549COST(22) 0.294 0.141COST (27) 0.384 0.112COST(34) 0.414 -0.105COST(20) 0.492 0.077COST (30) 0.434 -0.019
VARIANCE EXPLAINED BY FACTORS
1 2
4.704 1.765
PERCENT OF TOTAL VARIANCE EXPLAINED
1 2
27.668 10.382
ROTATED FACTOR PATTERN
2
COST(23) 0.721 -0.142COST (21) 0.647 0.182COST (25) 0.644 0.194COST(31) 0.637 0.164COST (32) 0.613 -0.326COST(24) 0.581 0.405COST (33) 0.564 0.084COST (28) 0.559 0.266COST (26) 0.556 0.286COST(19) 0.167 0.780COST(18) 0.099 0.776COST (29) 0.017 0.610COST(34) 0.334 0.266
181

COST(30)COST (20)COST(27)COST(22)
0.3880.4800.3960.326
0.1950.1320.056
-0.008
182
VARIANCE EXPLAINED BY ROTATED FACTORS
1
4.208
PERCENT OF TOTAL VARIANCE EXPLAINED
1
2
2.260
2
24.753 13.297

ITERATIVE PRINCIPAL AXIS FACTOR ANALYSIS
183
:TERATION123456789
1011121314
MAXIMUM CHANGE IN COMMUNALITIES0.54400.34430.06370.03490.02380.01610.01090.00750.00520.00360.00250.00170.00120.0008
FINAL COMMUNALITY ESTIMATES
1
0.611
2
0.621
3
0.646
LATENT ROOTS (EIGENVALUES)
1 2 3 4 5
4.790 1. 838 1.287 0.794 0.652
6 7 8 9 10
0.318 0.221 0.139 0.091 -0.008
11 12 13 14 15
-0.145 -0.176 -0.264 -0.310 -0.351
16 17
-0.437 -0.522

FACTOR PATTERN
2 3
COST(24) 0.700 -0.140 0.268COST(21) 0.693 0.066 -0.428COST(25) 0.663 0.063 -0.127COST(31) 0.645 0.104 0.154COST (26) 0.619 -0.060 -0.129COST(281 0.612 -0.017 0.147COST (231 0.602 0.398 -0.228COST (33) 0.554 0.159 0.233COST (20) 0.533 0.045 -0.600COST(32) 0.458 0.666 0.429COST(18) 0.399 -0.664 0.104COST(19) 0.460 -0.629 0.116COST (29) 0.258 -0.534 0.064COST(30) 0.450 0.000 0.459COST(34) 0.413 -0.124 -0.187COST(27) 0.383 0.096 -0.144COST(22) 0.294 0.139 0.098
VARIANCE EXPLAINED BY FACTORS
2 3
4.790 1. 838 1. 287
PERCENT OF TOTAL VARIANCE EXPLAINED
1 2 3
28.177 10.811 7.570
ROTATED FACTOR PATTERN
1 2 3
COST(32) 0.827 -0.380 0.093COST (30) 0.598 0.234 -0.028COST(24) 0.579 0.423 0.258COST (33) 0.572 0.089 0.227COST(31) 0.557 0.161 0.339COST(18) 0.083 0.771 0.100COST (19) 0.143 0.763 0.138COST(29) 0.014 0.594 0.053COST (20) -0.043 0.057 0.800
184

185
COST(21) 0.183 0.122 0.787COST (23) 0.381 -0.184 0.628COST (25) 0.364 0.161 0.548COST (26) 0.290 0.258 0.502COST(34) 0.095 0.234 0.397COST(27) 0.185 0.027 0.376COST(28) 0.487 0.259 0.305COST(22) 0.306 -0.006 0.147
VARIANCE EXPLAINED BY ROTATED rACTORS
1 2 3
2.813 2.208 2.894
PERCENT or TOTAL VARIANCE EXPLAINED
1 2 3
16.548 12.987 17.022

ITERATIVE PRINCIPAL AXIS FACTOR ANALYSIS
186
ITERATION123456789
101112131415
MAXIMUM CHANGE IN COMMUNALITIES0.54400.25170.04250.02030.01330.00870.00570.00460.00360.00290.00230.00180.00140.00110.0008
FINAL COMMUNALITY ESTIMATES
1
0.768
2
0.581
3
0.587
4
0.646
LATENT ROOTS (EIGENVALUES)
1 2 3 4 5
4.839 1. 892 1. 321 0.993 0.686
6 7 8 9 10
0.397 0.276 0.224 0.107 0.012
11 12 13 14 15
-0.086 -0.126 -0.167 -0.264 -0.274
16 17
-0.381 -0.404

fACTOR PATTERN
2
COST (24) 0.717 -0.135 0.321 0.299COST(21) 0.685 0.085 -0.392 0.129COST(25) 0.659 0.078 -0.132 0.081COST(31) 0.644 0.109 0.150 0.112COST (26) 0.616 -0.044 -0.147 0.056COST (28) 0.608 -0.008 0.112 0.030COST(23) 0.600 0.415 -0.239 -0.11 7COST(33) 0.566 0.168 0.252 -0.307COST (20) 0.522 0.061 -0.557 -0.008COST(l£) 0.414 -0.703 0.119 0.295COST(32) 0.446 0.632 0.407 -0.068COST(19) 0.458 -0.603 0.082 -0.037COST(29) 0.271 -0.575 0.020 -0.343COST (34) 0.450 -0.147 -0.306 -0.563COST (27) 0.386 0.110 -0.150 0.321COST(30) 0.463 -0.008 0.489 -0.303COST(22) 0.294 0.142 0.132 0.185
VARIANCE EXPLAINED BY fACTORS
2 3 4
4.839 1.892 1.321 0.993
PERCENT Of TOTAL VARIANCE EXPLAINED
1 2 3 4
28.465 11.129 7.771 5.842
ROTATED fACTOR PATTERN
1 2 3 4
COSTIn) 0.782 -0.319 0.182 -0.148COST (30) 0.677 0.223 -0.055 0.183COST (33) 0.638 0.055 0.199 0.238COST (24) 0.518 0.512 0.364 -0.2.4'9COST(18) 0.001 0.858 0.152 -0.096COST(19l 0.117 0.712 0.137 0.202COST (29) 0.050 0.546 -0.034 0.469
187

COST(21) 0.128 0.122 0.780 0.083COST(20) -0.056 0.021 0.724 0.244COST(23) 0.362 -0.217 0.629 0.174COST(25) 0.301 0.164 0.587 0.041COST(26) 0.228 0.248 0.533 0.089,COST (34) 0.135 0.122 0.323 0.704COST(27) 0.083 0.077 0.477 -0.216COST(22) 0.268 0.048 0.208 -0.202COST(31) 0.490 0.196 0.419 -0.087COST(28) 0.421 0.263 0.369 0.021
VARIANCE EXPLAINED BY ROTATED FACTORS
1 2 3
2.567 2.240 3.096 1.142
PERCENT OF TOTAL VARIANCE EXPLAINED
1 2 3
15.102 13.177 18.214 6.715
188

ITERATIVE PRINCIPAL AXIS FACTOR ANALYSIS
189
ITERATION123456789
MP~IMUM CHANGE IN COMMUNALITIES0.51070.48140.09140.03520.01480.00650.00290.00130.0006
FINAL COMMUNALITY ESTIMATES
1
0.436
2
0.509
LATENT ROOTS (EIGENVALUES)
1 2 3 4 5
5.987 1.511 0.821 0.569 0.508
6 7 8 9 10
0.364 0.236 0.099 0.016 -0.073
11 12 13 14 15
-0.203 -0.260 -0.277 -0.366 -0.396
16 17
-0.503 -0.536
FACTOR PATTERN
2
TIME (44) 0.774 0.199

T:ME (48) 0.737 0.389TIME(42) 0.730 0.304TIME (50) 0.717 0.201TIME(39) 0.701 -0.109TIME(47) 0.656 0.038TIME (36) 0.613 -0.365TIME(43) 0.601 0.096TIME(37) 0.579 -0.375TIME(51) 0.562 0.107TIH£(40) 0.553 -0.343TIME(49) 0.442 0.542TIME (35) 0.480 -0.454TIME(38) 0.475 -0.424TIME(4l) 0.455 -0.198TIME (46) 0.304 0.197TlME(45) 0.480 -0.067
VARIANCE EXPLAINED BY FACTORS
1 2
5.987 1.511
PERCENT OF TOTAL VARIANCE EXPLAINED
1 2
35.219 8.891
ROTATED FACTOR PATTERN
1 2
TIME(48) 0.809 0.198TIME (42) 0.748 0.258TUlL(44) 0.711 0.365TIME(49) 0.690 -0.112TIME (50) 0.670 0.326TIME(47) 0.516 0.407TIME(43) 0.513 0.327TIME(36) 0.216 0.680TIME (37) 0.184 0.665TIME(35) 0.057 0.658TIME(38) 0.074 0.633TIME(40) 0.186 0.624TIME(39) 0.452 0.547TIME(4l) 0.209 0.450TIME(45) 0.314 0.369TIME(51) 0.491 0.293TIME(46) 0.358 0.055
VARIANCE EXPLAINED BY ROTATED FACTORS
190
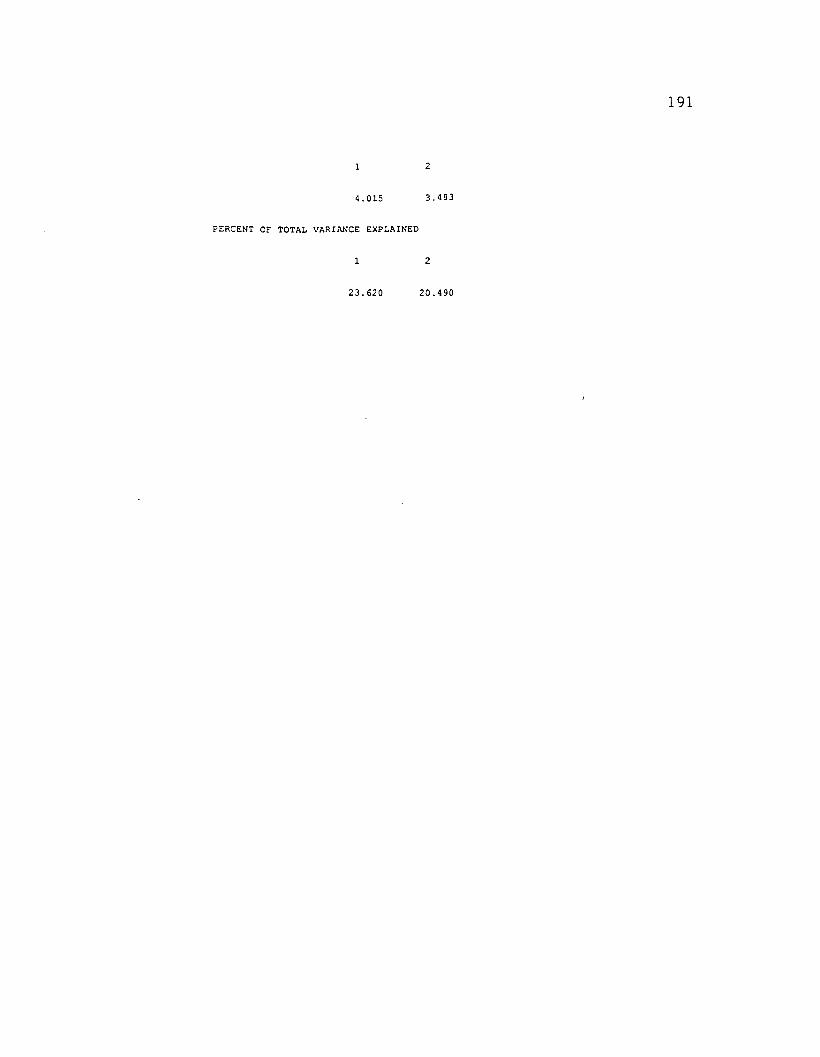
4.015
PERCENT OF TOTAL VARIANCE EXPLAINED
2
3.483
2
191
23.620 20.490

ITERATIVE PRINCIPAL AXIS FACTOR ANALYSIS
192
ITERATION123456789
101112
MAXIMUM CHANGE IN COMMUNALITIES0.51070.47190.07150.02010.01230.00810.00540.00360.00240.00160.00110.0007
FINAL COMMUNALITY ESTIMATES
2 3
0.424 0.682 0.633
LATENT ROOTS (EIGENVALUES)
2 3 4 5
6.063 1.587 0.956 0.600 0.559
6 7 8 9 10
0.392 0.297 0.148 0.089 -0.007
11 12 13 14 15
-0.086 -0.119 -0.252 -0.318 -0.333
16 17
-0.420 -0.519
FACTOR PATTERN
2 3

TIME (44) 0.793 0.228 0.387TIME (48) 0.745 0.405 -0.285TIME (42) 0.727 0.306 0.140TIME 150) 0.725 0.209 -0.300TIMEl391 0.695 -0.098 -0.024TIME(47) 0.653 0.047 0.124TIHE(36) 0.627 -0.385 0.374TIME(43) 0.599 0.100 0.142TIME(37) 0.592 -0.423 -0.322TIME (51) 0.568 0.114 -0.307TIME(40) 0.548 -0.325 -0.011TIME(49) 0.438 0.521 -0.094TIME(38) 0.490 -0.489 -0.369TIME(45) 0.484 -0.067 0.280TIME(35) 0.476 -0.429 0.113TIME(46) 0.302 0.186 0.054TIME (41) 0.452 -0.181 0.054
VARIANCE EXPLAINED BY fACTORS
1 2 3
6.063 1. 587 0.956
PERCENT Of TOTAL VARIANCE EXPLAINED
2 3
35.662 9.333 5.625
ROTATED fACTOR PATTERN
2 3
TIME(48) 0.847 0.261 0.117TIME (50) 0.699 0.390 0.139TIME (49) 0.680 -0.074 0.061TIME(42) 0.651 0.079 0.461TIME(44) 0.571 0.024 0.710TIME (51) 0.531 0.379 0.064TIME (38) 0.067 0.774 0.110TIME (37) 0.168 0.754 0.191TIME (36) 0.029 0.354 0.745TIME(45) 0.190 0.126 0.515TIME(47) 0.423 0.222 0.466TIME (35) -0.029 0.456 0.464TIME(43) 0.420 0.151 0.435TIME (39) 0.386 0.422 0.408TIME(40) 0.125 0.493 0.385TIME (41) 0.148 0.313 0.346TIME(46) 0.313 -0.004 0.175
193
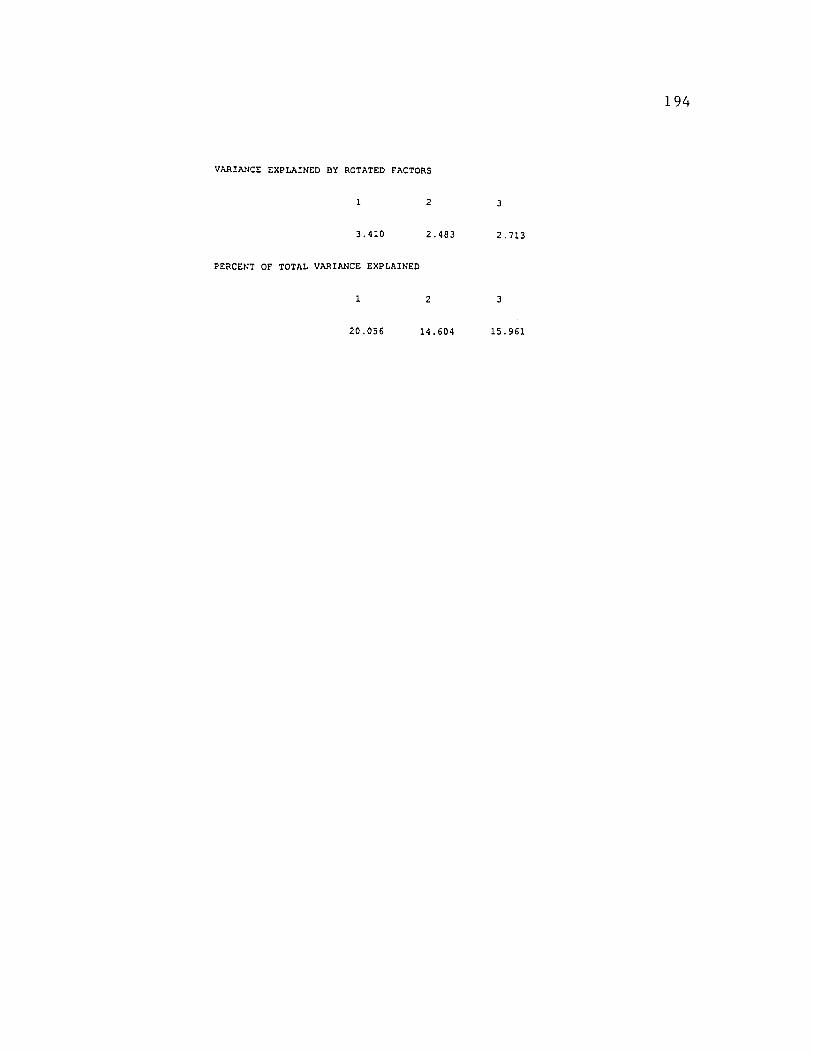
VARIANCE EXPLAINED BY ROTATED FACTORS
2 3
194
3.410
PERCENT OF TOTAL VARIANCE EXPLAINED
1
2.483
2
2.713
3
20.056 14.604 15.961

ITERATIVE PRINCIPAL AXIS FACTOR ANALYSIS
195
I1'ERAT:ON123456789
101112131415161718192021
MAXIMUM CHANGE IN COMMUNALITIES0.51070.26930.15680.06680.03880.03880.03830.03730.03580.03380.03160.02930.00960.00720.00530.00390.00280.00200.00150.00110.0008
FINAL COMMUNALITY ESTIMATES
1
0.529
2
0.659
3
0.665
4
0.615
LATENT ROOTS (EIGENVALUES)
1 2 3 4 5
6.120 1.625 1. 014 0.866 0.600
6 7 8 9 10
0.405 0.334 0.187 0.104 0.037
11 12 13 14 15
-0.057 -0.110 -0.188 -0.221 -0.307

16 17
-0.364 -0.447
FACTOR PATTERN
1 2 3 4
TIME(44) 0.785 0.219 0.291 0.210TIME(48) 0.745 0.400 -0.355 0.031TIME(42) 0.726 0.306 0.160 -0.022TIME (50) 0.722 0.205 -0.232 -0.206TIME(39) 0.700 -0.115 -0.147 0.228TIME(43) 0.653 0.162 0.524 -0.523TIME(47) 0.651 0.040 0.043 0.162TIME(36) 0.622 -0.374 0.315 0.181TIME (37) 0.592 -0.425 -0.228 -0.287TIME (51) 0.564 0.105 -0.292 -0.093TIME(40) 0.550 -0.323 0.074 -0.167TIME (49) 0.439 0.524 -0.209 0.153TIME(45) 0.485 -0.077 0.150 0.332TIME(35) 0.480 -0.466 -0.003 0.286TIME(38) 0.486 -0.487 -0.314 -0.209TIME(46) 0.304 0.192 0.103 -0.073TIME(41) 0.449 -0.182 0.036 0.051
VARIANCE EXPLAINED BY FACTORS
1 2 3 4
6.120 1. 625 1.014 0.866
PERCENT OF TOTAL VARIANCE EXPLAINED
1 2 3 4
36.001 9.559 5.965 5.095
ROTATED FACTOR PATTERN
1 2 3 4
TIME(48) 0.864 0.216 0.141 0.169TIME(49) 0.712 -0.118 0.080 0.089TIME (50) 0.639 0.389 0.298 0.107TIME(42) 0.538 0.075 0.491 0.333TIME (51) 0.524 0.354 0.106 0.110TIME(37) 0.144 0.765 0.138 0.203
196

TIME (38) 0.093 0.755 -0.022 0.189TIME (43) 0.169 0.218 0.952 0.131TIME(36) -0.015 0.295 0.276 0.704TIME(35) 0.010 0.373 -0.081 0.619TIME (44) 0.478 -0.009 0.456 0.598TIME (45) 0.195 0.044 0.096 0.570TIME(39) 0.427 0.338 0.028 0.529TIME (47) 0.399 0.171 0.213 0.468TIME(41) 0.130 0.276 0.133 0.358TIME(40) 0.053 0.497 0.286 0.329TIME(46) 0.241 0.007 0.282 0.086
VARIANCE EXPLAINED BY ROTATED FACTORS
1 2 3 4
2.969 2.240 1. 818 2.569
PERCENT OF TOTAL VARIANCE EXPLAINED
2 3 4
17.467 13.178 10.696 15.112
197

ITERATIVE PRINCIPAL AXIS FACTOR ANALYSIS
198
ITERATION123456789
1011121314151617181920
MAXIMUM CHANGE IN COMMUNALITIES0.64080.31390.03430.01850.01490.01270.01110.00990.00890.00810.00740.00670.00610.00560.00510.00470.00260.00180.00110.0006
FINAL COMMUNALITY ESTIMATES
1
0.423
2
0.102
LATENT ROOTS (EIGENVALUES)
2 3 4 5
5.796 1. 557 0.717 0.650 0.409
6 7 8 9 10
0.260 0.225 0.050 0.012 -0.041
11 12 13 14 15
-0.124 -0.205 -0.267 -0.367 -0.388
16 17

-0.424 -0.511
fACTOR PATTERN
2
COMM(64) 0.805 0.138COMM(59) 0.703 0.183COMM(611 0.682 0.146COMM (58) 0.675 0.220COMM(67) 0.660 -0.039COMM(52) 0.641 0.107COMM(65) 0.631 -0.072COMM(60) 0.595 0.081COMM(56) 0.574 0.226COMM(68) 0.555 -0.053COMM(62) 0.545 0.259COMM(63) 0.528 0.080COMMl541 0.527 -0.687COMM(551 0.451 -0.892COMMl531 0.309 -0.083COMM (66) 0.407 -0.067COMM(57) 0.418 0.006
VARIANCE EXPLAINED BY fACTORS
2
5.796 1.557
PERCENT Of TOTAL VARIANCE EXPLAINED
2
34.095 9.161
ROTATED f~CTOR PATTERN
1 2
COMM(641 0.787 0.220COMM (59) 0.714 0.135COMM(58) 0.705 0.090COMM(61) 0.679 0.160COMM(52) 0.626 0.177COMM(S6) 0.616 0.041COMM(62; 0.604 -0.001COMM(67) 0.580 0.318COMM(601 0.573 0.181COMMl651 0.540 0.335
199

COMM (63)COMM(55)COMM(54)COMM (68)COMM(66)COMM (53)COMM(57)
0.5110.0270.1830.4800.3400.2440.380
0.1531. 0000.8460.2850.2350.2070.173
200
VAR:ANCE EXPLAINED BY ROTATED FACTORS
1
5.022
PERCENT OF TOTAL VARIANCE EXPLAINED
1
29.543
2
2.326
2
13.683

ITERATIVE PRINCIPAL AXIS FACTOR ANALYSIS
201
ITERATION123456789
101112131415161718192021222324252627282930313233
MAXIMUM CHANGE IN COMMUNALITIES0.64080.24180.08340.06780.03040.01080.00710.00630.00570.00530.00490.00460.00420.00390.00370.00340.00320.00290.00270.00250.00240.00220.00200.00190.00180.00160.00150.00140.00130.00120.00110.00110.0010
FINAL COMMUNALITY ESTIMATES
2 3
0.453
LATENT ROOTS (EIGENVALUES)
1
5.846
6
0.110
2
1. 566
7
0.777
3
0.908
8
4
9
5
0.453
10

202
0.297 0.281 0.087 :.J39 0.:::5
11 12 13 ~4 15
-0.066 -0.139 -0.192 -0.231 -0.357
16 17
-0.382 -0.483
FACTOR PATTERN
1 2 3
COMM(64) 0.815 0.151 0.276COMM(59) 0.704 0.183 -0.167COMM(61) 0.679 0.147 0.030COMM(67) 0.675 -0.049 -0.355COMM(58) 0.672 0.218 0.010COMM(52) 0.642 0.111 0.170COMM(65) 0.632 -0.075 -0.149COMM(60) 0.595 0.088 0.184COMM(56) 0.572 0.225 0.015COMM(68) 0.556 -0.054 -0.154COMM(62) 0.543 0.260 0.042COMM(54) 0.527 -0.695 0.123COMM(63) 0.526 0.080 -0.068COMM(55) 0.450 -0.886 0.074COMM(66) 0.432 -0.093 -0.577COMM(57) 0.430 0.016 0.446COMM(53) 0.307 -0.081 0.094
VARIANCE EXPLAINED BY FACTORS
1 2 3
5.846 1. 566 0.908
PERCENT OF TOTAL VARIANCE EXPLAINED
1 2 3
34.386 9.212 5.340
ROTATED FACTOR PATTERN

2 3
COMM(64) 0.829 0.198 0.193COMM(52) 0.626 0.152 0.193COMM(58) 0.617 0.030 0.344COMM(61) 0.603 0.102 0.331COMM(60) 0.588 0.161 0.157COMM(57) 0.556 0.228 -0.153COMM(62) 0.548 -0.044 0.249COMM(56) 0.543 -0.008 0.287COMM(59) 0.542 0.035 0.511COMM(55) 0.030 0.980 0.178COMM(54) 0.191 0.842 0.176COMM (66) 0.022 0.108 0.718COMMl67l 0.336 0.197 0.657COMM(65) 0.391 0.251 0.459COMM(68) 0.338 0.205 0.423COMM(63) 0.409 0.090 0.334COMM(53l 0.252 0.199 0.082
VARIANCE EXPLAINED BY ROTATED FACTORS
1 2 3
4.015 2.028 2.276
PERCENT OF TOTAL VARIANCE EXPLAINED
1 2 3
23.619 11.931 13.387
203

ITERATIVE PRINCIPAL AXIS FACTOR ANALYSIS
204
ITERATION123456789
1011121314151617181920212223242526272829
MAXIMUM CHANGE IN CO~~NALITIES
0.64080.20130.05720.01650.01010.00760.00630.00560.00500.00460.00420.00390.00360.00330.00310.00280.00260.00240.00220.00210.00190.00170.00160.00150.00140.00130.00120.00110.0010
FINAL COMMUNALITY ESTIMATES
2 3 4
0.572
LATENT ROOTS (EIGENVALUES)
5.915
6
0.344
0.128
2
1.575
7
0.310
0.800
3
0.930
0.143
0.969
4
0.875
9
0.087
5
0.497
10
0.043

205
~1 12 13 14 15
-0.048 -0.079 -0.161 -0.192 -0.246
16 17
-0.306 -0.393
FACTOR PATTERN
1 2 3 4
COMM(64) 0.809 0.139 0.173 0.219COMM(61) 0.727 0.196 0.296 -0.489COMM(59) 0.703 0.179 -0.097 -0.188COMM(67) 0.673 -0.058 -0.281 -0.261COMM(58) 0.668 0.207 0.000 0.004COMM(52) 0.650 0.104 0.025 0.372COMM(65) 0.627 -0.085 -0.135 -0.053COMM(60) 0.621 0.110 0.408 -0.285COMM (56) 0.577 0.221 -0.124 0.262COMM(68) 0.554 -0.068 -0.228 0.055COMM(62) 0.542 0.253 -0.053 0.180COMM(63) 0.526 0.066 -0.194 0.181COMM(54) 0.524 -0.711 0.100 0.101COMM(55) 0.443 -0.873 0.098 -0.022COMM(661 0.427 -0.103 -0.519 -0.228COMM(57) 0.427 0.014 0.374 0.195COMM(53) 0.306 -0.089 0.040 0.158
VARIANCE EXPLAINED BY FACTORS
2 3 4
5.915 1.575 0.930 0.875
PERCENT OF TOTAL VARIANCE EXPLAINED
1 2 3 4
34.793 9.267 5.471 5.147
ROTATED FACTOR PATTERN
2 3
COMM(66) 0.704 0.103 0.024 0.093

COMM(67) 0.639 0.184 0.318 0.244COMM(55) 0.188 0.962 0.091 0.003COMM(54) 0.163 0.853 0.099 0.191COMM(61) 0.288 0.059 0.877 0.196COMM(60) 0.073 0.148 0.748 0.241COMM(64) 0.135 0.191 0.419 0.722COMM(52) 0.118 0.159 0.154 0.714COMM(56) 0.239 -0.014 0.122 0.627COMM (62) 0.200 -0.049 0.201 0.557COMM(58) 0.290 0.025 0.388 0.503COMM(63) 0.314 0.089 0.065 0.491COMM (57) -0.180 0.221 0.326 0.415COMM(59) 0.463 0.021 0.455 0.385COMM(68) 0.414 0.200 0.101 0.381COMM(65) 0.419 0.246 0.253 0.348COMM(53) 0.049 0.205 0.067 0.281
VARIANCE EXPLAINED BY ROTATED fACTORS
2 3 4
1. 962 1. 988 2.250 3.095
PERCENT OF TOTAL VARIANCE EXPLAINED
1 2 3 4
11.543 11.695 13.234 18.206
206

APPENDIX H
RELIABILITY MATRICES AND TABLES

PEARSON CORRELATION MATRIX
208
DESN(8) DESN(10) DESN(13) DESN (6) DESN(7)
DESN(8) 1. 000DESN(10) 0.562 1. 000DESN(13) 0.440 0.558 1.000DESN(6) 0.515 0.529 0.697 1.000DESN (7) 0.549 0.506 0.475 0.497 1. 000DESN (9) 0.517 0.685 0.476 0.364 0.488DESN(14) 0.471 0.357 0.482 0.495 0.457
DESN (9)DESN (14)
fREQUENCY TABLE
DESN (9)
1. 0000.400
DESN (14)
1. 000
DESN (8) DESN(10) DESN(13) DESN(6) DESN(7)
DESN (8) 59DESN(10) 58 58DESN(13) 59 58 59DESN (6) 57 56 57 57DESN(7) 53 53 53 52 53DESN (9) 59 58 59 57 53DESN (14) 59 58 59 57 53
DESN(9)DESN(14)
DESN (9)
5959
DESN (14)
59

PEARSON CORRELATION MATRIX
DESN(3) DESN (4)
209
DESN (3)DESN(4)
1. 0000.623 1. 000
NUMBER OF OBSERVATIONS: 58

PEARSON CORRELATION MATRIX
DESN(2) DESN(11)
210
DESN(2)DESN(11)
FREQUENCY TABLE
DESN(2)DESN (11)
1. 0000.397
DESN(2)
5856
1. 000
DESN(11)
57

PEARSON CORRELATION MATRIX
211
COST (32) COST(30) COST(24) COST (33) COST(31)
COST(32) 1. 000COST (30) 0.437 1. 000COST(24) 0.275 0.404 1. 000COST(33) 0.449 0.550 0.466 1. 000COST (31) 0.429 0.366 0.507 0.319 1. 000
FREQUENCY TABLE
COST (32) COST(30) COST(24) COST(33) COST(31)
COST(32) 56COST(30) 56 56COST(24) 55 55 55COST (33) 56 56 55 56COST(31) 56 56 55 56 56

PEARSON CORRELATION MATRIX
COST(18) COST(19) COST(29)
212
COST(18)COST (19)COST(29)
FREQUENCY TABLE
COST(18)COST (19)COST (29)
1. 0000.5780.402
COST(18)
565654
1. 0000.561
COST(19)
5654
1. 000
COST (29)
55

PEARSON CORRELATION MATRIX
213
COST (20) COST(21) COST(23) COST(25) COS:' (26)
COST (20) 1. 000COST(21) 0.738 1. 000COST(23) 0.492 0.453 1.000COST(25) 0.399 0.492 0.418 1. 000COST (26) 0.306 0.427 0.402 0.545 1. 000
FREQUENCY TABLE
COST (20) COST(21) COST (23) COST(25) COST(26)
COST(20) 55COST(21) 55 55COST(23) 55 55 55COST(25) 55 55 55 56COST(26) 55 55 55 56 56
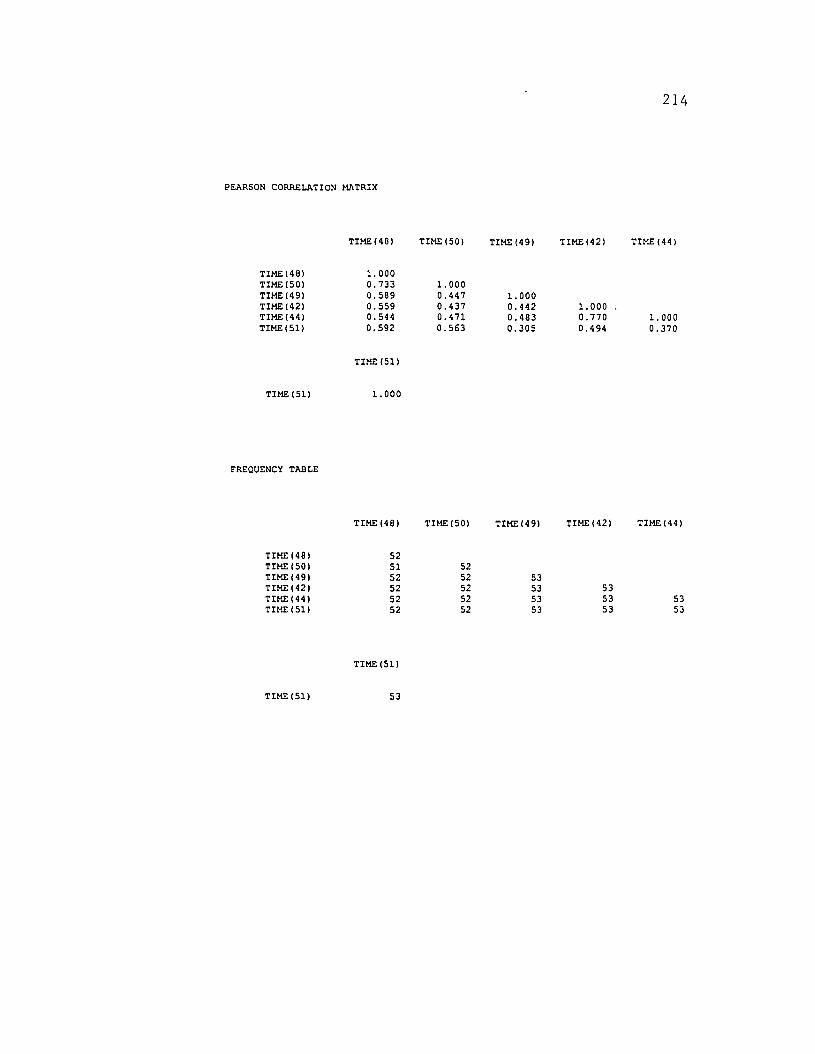
PEARSON CORRELATION MATRIX
214
TIME(48) TIME(50) TIME (49) TIME(42) TIME (44)
TIME(48) 1. 000TIME (50) 0.733 1. 000TIME(49) 0.589 0.447 1. 000TIME(42) 0.559 0.437 0.442 1. 000TIME(44) 0.544 0.471 0.483 0.770 1.000TIME (51) 0.592 0.563 0.305 0.494 0.370
TIME (51)
TIME (51) 1. 000
FREQUENCY TABLE
TIME(48) TIME (50) TIME(49) TIME(42) TIME(44)
TIME(48) 52TIME (50) 51 52TIME (49) 52 52 53TIME(42) 52 52 53 53TIME(44) 52 52 53 53 53TIME (51) 52 52 53 53 53
TIME (51)
TIME (51) 53

PEARSON CORRELATION MATRIX
TIME(3B) TIME(37)
215
TIME(3B)TIME (37)
1. 0000.794 1.000
NUMBER OF OBSERVATIONS: 54

PEARSON CORRELATION MATRIX
TIME(36) TIME (45)
216
TIME(36)TIME(45)
FREQUENCY TABLE
TIME(36)TIME(45)
1. 0000.475
TIME(36)
5552
1. 000
TIME(45)
52

PEARSON CORRELATION MATRIX
217
COMM(64) COMM(52) COMM(58) COMM(61) COMM(60)
COMM(64) 1. 000COMM(52) 0.608 1. 000COMM(58) 0.533 0.394 1. 000COMM(61) 0.583 0.343 0.476 1. 000COMM (60) 0.494 0.296 0.484 0.733 1. 000COMM(57) 0.533 0.357 0.312 0.338 0.305COMM(62) 0.555 0.463 0.426 0.358 0.275COMM(56) 0.503 0.571 0.503 0.328 0.273COMM(59) 0.475 0.438 0.504 0.623 0.483
COMM(57) COMM(62) COMM(56) COMM(59)
COMM(57) 1. 000COMM(62) 0.227 1. 000COMM(56) 0.216 0.409 1. 000COMM(59) 0.263 0.391 0.323 1. 000
fREQUENCY TABLE
COMM(64) COMM(52) COMM(58) COMM(61) COMM(60)
COMM(64) 58COMM(52) 58 58COMM(58) 57 57 57COMM(61) 57 57 57 57COMM(60) 58 58 57 57 58COMM(57) 57 57 56 56 57COMM(62) 58 58 57 57 58COMM(56) 57 57 57 57 57COMM(59) 58 58 57 57 58
COMM(57)COMM(62)COMM(56)COMM (59)
COMM(57)
57575657
COMM(62)
585758
COMM(56)
5757
COMM(59)
58

PEARSON CORRELATION MATRIX
COMM(55) COMM(54)
218
COMM(55)COMM(54)
1. 0000.861 1. 000
NUMBER OF OBSERVATIONS:, 58

PEARSON CORRELATION MATRIX
COMM (66) COMM (67)
219
COMM(66)COMM(67)
fREQUENCY TABLE
COMM(66)COMM(67)
1. 0000.499
COMM(66)
5857
1. 000
COMM(67)
57

APPENDIX I
MANOVA ANALYSES

14 CASES DELETED DUE TO MISSING DATA.
NUMBER OF CASES PROCESSED: 51
DEPENDENT VARIABLE MEANS
221
DESN (1)
3.725
COST(18)
3.078
TIME(35)
3.255
COMM(52)
3.863
-1
REGRESSION COEFFICIENTS B - (X'X) X'Y
CONSTANT
DESN(l)
3.725
COST(18)
3.078
TIME (35)
3.::55
COMM(52)
3.863
MULTIPLE CORRELATIONS
DESN(l)
0.000
HYPOTHESIS.
COST (18)
0.000
TIME(35)
0.000
COMM(52)
0.000

222
C MATRIX
2 3 4
1 1. 000 -1.000 0.000 0.000
2 0.000 1.000 -1.000 0.000
3 0.000 0.000 1. 000 -1.000
UNIVARIATE F TESTS
VARIABLE SS DF MS F P
21. 353 21. 353 38.617 0.000
ERROR 27.647 50 0.553
2 1. 588 1 1. 588 3.125 0.083
ERROR 25.412 50 0.508
3 18.843 1 18.843 17.397 0.000
ERROR 54.157 50 1.083
MULTIVARIATE TEST STATISTICS
WILKS' LAMBDA • 0.462
F-STATISTIC • 18.639 DF • 3, 48 PROB - 0.000
PILLAI TRACE - 0.538
F-STATISTIC - 18.639 DF - 3, 48 PROB • 0.000
HOTELLING-LAWLEY TRACE • 1.165
F-STATISTIC • 18.639 DF • 3, 48 PROB - 0.000
14 CASES DELETED DUE TO MISSING DATA.

223
NUMBER OF CASES PROCESSED: 51
DEPENDENT VARIABLE MEANS
DESN (2) COSTC19l TIME (36) COMM(53)
3.157 2.941 2.843 3.000
-1
REGRESSION COEFFICIENTS B - (X'X) X'Y
)0:
DESN(2) COST (19) TIME (36) COMM(53)
CONSTANT 3.157 2.941 2.843 3.000
MULTIPLE CORRELATIONS
HYPOTHESIS.
DESN(2)
0.000
COST (19)
0.000
TIME (36)
0.000
COMMC53l
0.000
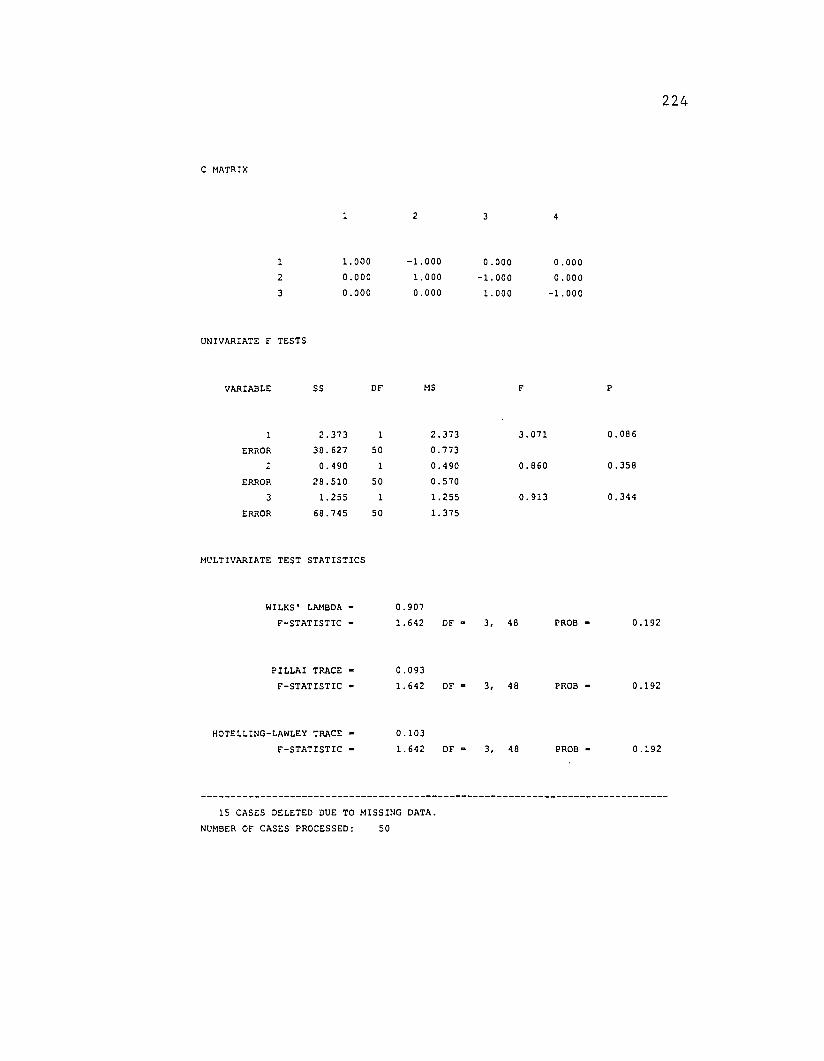
C MATRIX
1 2 3
1 1. 000 -1.000 0.000 0.000
2 0.000 1. 000 -1. 000 0.000
3 0.000 0.000 1. 000 -1.000
UNIVARIATE F TESTS
VARIABLE SS OF MS F P
2.373 1 2.373 3.071 0.086
ERROR 38.627 50 0.773
2 0.490 1 0.490 0.860 0.358
ERROR 28.510 50 0.570
3 1. 255 1.255 0.913 0.344
ERROR 68.745 50 1. 375
224
MULTIVARIATE TEST STATISTICS
WILKS' LAMBDA - 0.907
F-STATISTIC - 1. 642 OF - 3. 48 PROB -
PILLAI TRACE - 0.093
F-STATISTIC - 1. 642 OF - 3. 48 PROB -
HOTELLING-LAWLEY TRACE - 0.103
F-STATISTIC - 1. 642 OF - 3. 48 PROB -
15 CASES DELETED DUE TO MISSING DATA.
NUMBER OF CASES PROCESSED: 50
0.192
0.192
0.192

DEPENDENT VARIABLE MEANS
DESN (3) COST(20) TIME (37) COMM(54)
3.460 2.780 2.960 3.640
-1
REGRESSION COEFFICIENTS B • (X'X) X'Y
DESN (3) COST (20) TIME(7) COMM(54)
CONSTANT 3.460 2.780 2.960 3.640
MULTIPLE CORRELATIONS
225
HYPOTHESIS.
C MATRIX
DESN (3)
0.000
COST (20)
0.000
TIME (37)
0.000
COMM(54)
0.000

226
2 3 4
1 1. 000 -1.000 0.000 0.000
2 0.000 1. 000 -1.000 0.000
3 0.000 0.000 1.000 -1.000
UNIVARIATE F TESTS
VARIABLE SS DF MS F P
1 23.120 1 23.120 11. 694 0.001
ERROR 96.880 49 1.977
2 1. 620 1 1. 620 1. 487 0.229
ERROR 53.380 49 1. 089
3 23.120 1 23.120 14.736 0.000
ERROR 76.880 49 1. 569
MULTIVARIATE TEST STATISTICS
WILKS' LAMBDA D 0.692
F-STATISTIC • 6.981 DF • 3. 47 PROB - 0.001
PILLA! TRACE - 0.308
F-STATISTIC • 6.981 DF • 3, 47 PROB - 0.001
HOTELLING-LAWLEY TRACE • 0.446
F-STATISTIC - 6.981 DF - 3. 47 PROB - 0.001
15 CASES DELETED DUE TO MISSING DATA.
NUMBER OF CASES PROCESSED: 50

DEPENDENT VARIABLE MEANS
DESN (4) COST(21) TIME(38) COMM(551
3.540 2.940 3.000 3.600
-1
REGRESSION COEFFICIENTS B - (X'X) X'Y
DESN (4) COST (21) TIME(38) COMM(551
CONSTANT 3.540 2.940 3.000 3.600
MULTIPLE CORRELATIONS
227
HYPOTHESIS.
C MATRIX
DESN(41
0.000
COST (21)
0.000
TIME(38)
0.000
COMM(55)
0.000
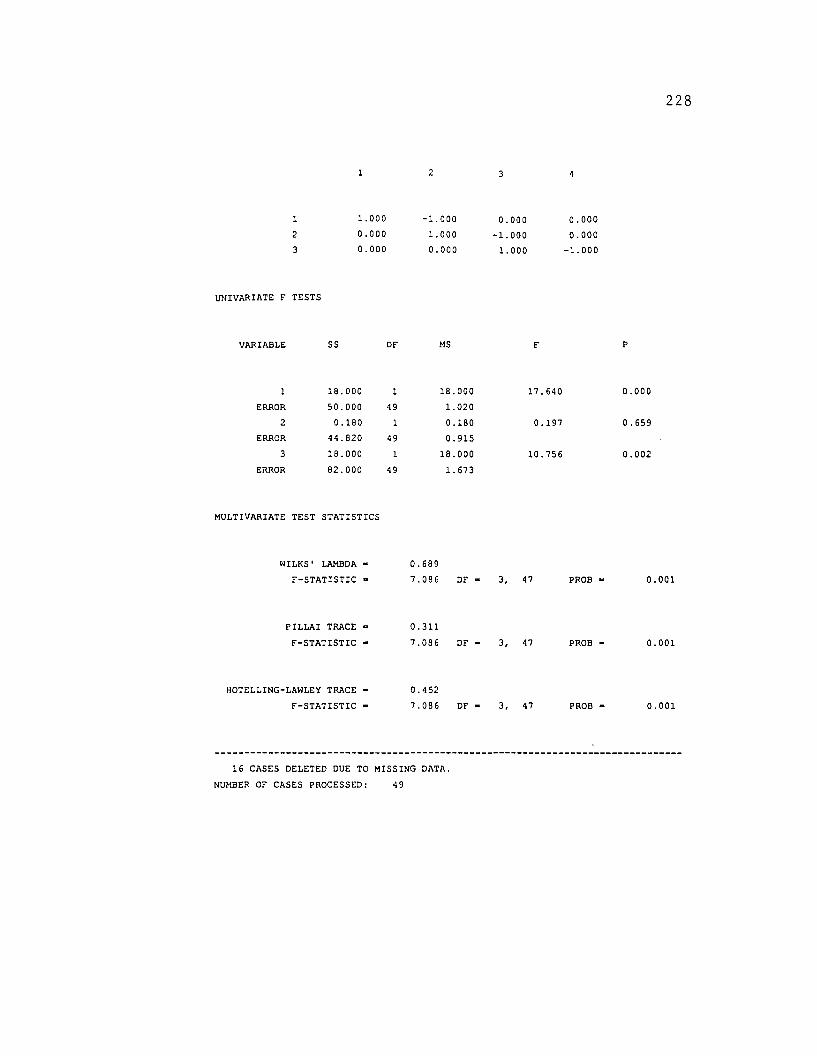
228
2
1 1. 000 -1. 000 0.000 0.000
2 0.000 1. 000 -1.000 0.000
3 0.000 0.000 1.000 -1.000
UNIVARIATE F TESTS
VARIABLE SS DF MS F P
18.000 1 18.000 17.640 0.000
ERROR 50.000 49 1. 020
2 0.180 1 0.180 0.197 0.659
ERROR 44.820 49 0.915
3 18.000 1 18.000 10.756 0.002
ERROR 82.000 49 1. 673
MULTIVARIATE TEST STATISTICS
WILKS' LAMBDA - 0.689
F-STATISTIC - 7.086 OF - 3, 47 PROB - 0.001
PILLAI TRACE - 0.311
F-STATISTIC - 7.086 DF - 3, 47 PROB - 0.001
HOTELLING-LAWLEY TRACE - 0.452
F-STATISTIC - 7.086 DF - 3, 47 PROB - 0.001
16 CASES DELETED DUE TO MISSING DATA.
NUMBER OF CASES PROCESSED: 49

DEPENDENT VARIABLE MEANS
DESN (5) COST(22) TIME (39) COMM (56)
3.204 3.122 3.224 3.388
-1
REGRESSION COEFFICIENTS B • (X'X) X'Y
DESN(5) COST(22) TIME (39) COMM(56)
CONSTANT 3.204 3.122 3.224 3.388
MULTIPLE CORRELATIONS
229
HYPOTHESIS.
C MATRIX
DESN(5)
0.000
COST(22)
0.000
TIME(39)
0.000
COMM(56)
0.000

230
~2 4
1 1. 000 -LOOO 0.000 0.000
2 0.000 LOOO -1.000 0.000
3 0.000 Cl.OOO 1.000 -1.000
UNIVARIATE F TESTS
VARIABLE SS Df' MS F P
0.327 1 0.327 0.439 0.511
ERROR 35.673 48 0.743
2 0.510 1 0.510 1. 690 0.200
ERROR 14.490 48 0.302
3 1. 306 1 1. 306 1. 918 0.173
ERROR 32.694 48 0.681
MULTIVARIATE TEST STATISTICS
WILKS' LAMBDA • 0.92,1
r-STATISTIC • 1.31 16 Dr • 3, 46 PROB • 0.281
PILLAI TRACE • 0.0719
r-STATISTIC • 1.3116 Dr • 3, 46 PROB • 0.281
HOTELLING-LAWLEY TRACE • 0.0816
r-STATISTIC • 1. 3116 Dr • 3, 46 PROB • 0.281
-------------------------------~-----~-----------------------------------------
16 CASES DELETED DUE TO MISS~NG D~TA.
NUMBER or CASES PROCESSED: 49
DEPENDENT VARIABLE MEANS

DESN (6) COST (23) TIME(40) COMM(57)
3.306 3.061 3.163 3.633
-1
REGRESSION COEFFICIENTS B • (XIX) XIY
DESN (6) COST(23) TIME(40) COMM(57)
CONSTANT 3.306 3.061 3.163 3.633
MULTIPLE CORRELATIONS
231
HYPOTHESIS.
C MATRIX
DESN(6)
0.000
COST(23)
0.000
2
TIME(40)
0.000
3
COMM(57)
0.000
4

232
1 1. 000 -1.000 0.000 0.000
2 0.000 1. 000 -1.000 0.000
3 0.000 0.000 1.000 -1.000
UNIVARIATE F TESTS
VARIABLE SS OF MS F P
2.939 1 2.939 2.237 0.141
ERROR 63.061 48 1.314
2 0.510 1 0.510 0.754 0.390
ERROR 32.490 48 0.677
3 10.796 1 10.796 8.903 0.004
ERROR 58.204 48 1. 213
MULTIVARIATE TEST STATISTICS
WILKS' LAMBDA • 0.753
F-STATISTIC • 5.024 OF • 3, 46 PROB • 0.004
PILLAI TRACE • 0.247
F-STATISTIC • 5.024 OF • 3, 46 PROB • 0.004
HOTELLING-LAWLEY TRACE • 0.328
F-STATISTIC • 5.024 OF • 3, 46 PROB • 0.004
20 CASES DELETED DUE TO MISSING DATA.
NUMBER OF CASES PROCESSED: 45
DEPENDENT VARIABLE MEANS
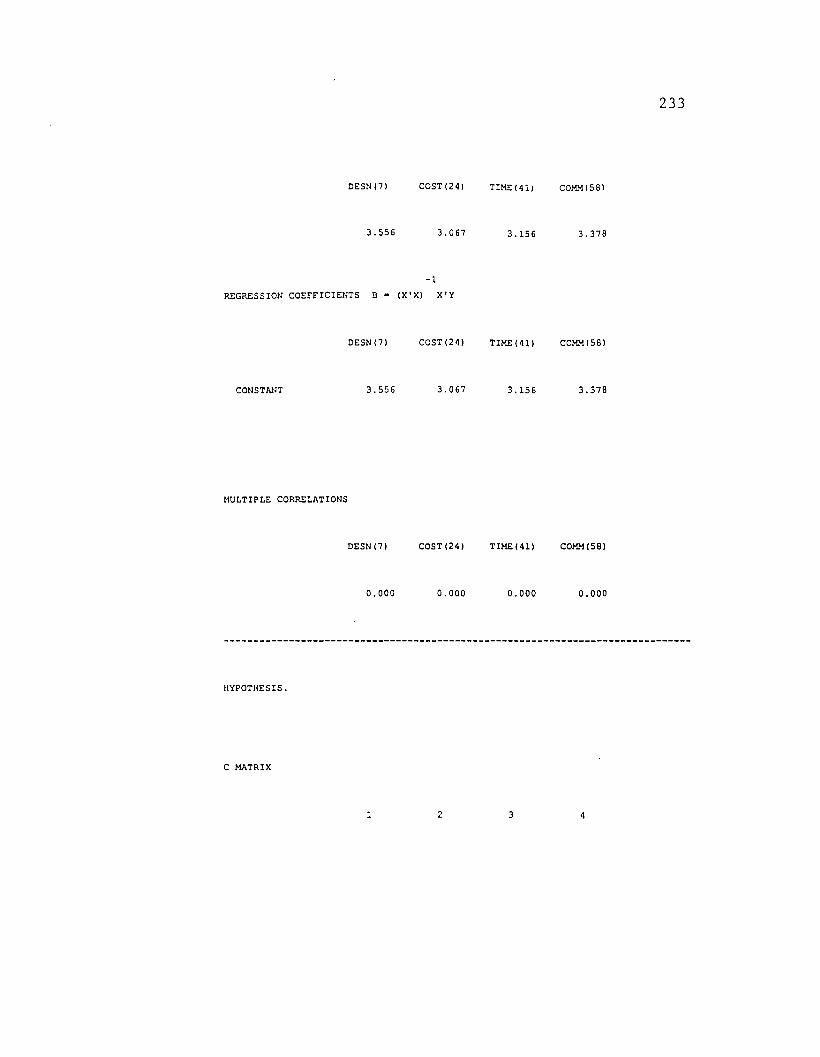
DESN (7) COST(24) TIME (41) COMM(58)
3.556 3.067 3.156 3.378
-1
REGP£SSION COEFFICIENTS B • (X'X) X'Y
DESN (7) COST (24) TIME(41) COMM(58)
CONSTANT 3.556 3.067 3.156 3.378
MULTIPLE CORRELATIONS
233
HYPOTHESIS.
C MATRIX
DESN (7)
0.000
COST(24)
0.000
2
TIME(41)
0.000
3
COMM(58l
0.000
4

234
1 1. 000 -1.000 0.000 0.000
2 0.000 1. 000 -1.000 0.000
3 0.000 0.000 1.000 -1.000
UNIVARIATE F TESTS
VARIABLE SS OF MS F P
10.756 10.756 12.706 0.001
ERROR 37.244 44 0.846
2 0.356 1 0.356 0.465 0.499
ERROR 33.644 44 0.765
3 2.222 1 2.222 3.520 0.067
ERROR 27.778 44 0.631
MULTIVARIATE TEST STATISTICS
WILKS' LAMBDA - 0.731
F-STATISTIC - 5.151 OF - 3, 42 PROB - 0.004
PILLAI TRACE - 0.269
F-STATISTIC - 5.151 OF - 3, 42 PROB - 0.004
HOTELLING-LAWLEY TRACE - 0.368
F-STATISTIC - 5.151 OF - 3, 42 PROB - 0.004
15 CASES DELETED DUE TO MISSING DATA.
NUMBER OF CASES PROCESSED: 50
DEPENDENT VARIABLE MEANS

DESN(8) COST(Z5) TIME(4Z) COM!'! (59)
3.860 3.180 3.240 3.780
-1
REGRESSION COEFFICIENTS B - (X'X) X'Y
DESN(8) COST(25) TIME(42) COMM (59)
CONSTANT 3.860 3.180 3.240 3.780
MULTIPLE CORREL~TIONS
235
HYPOTHESIS.
C MATRIX
DESN(8)
0.000
COST (25)
0.000
2
TIME(42)
0.000
3
COMM(59)
0.000
4
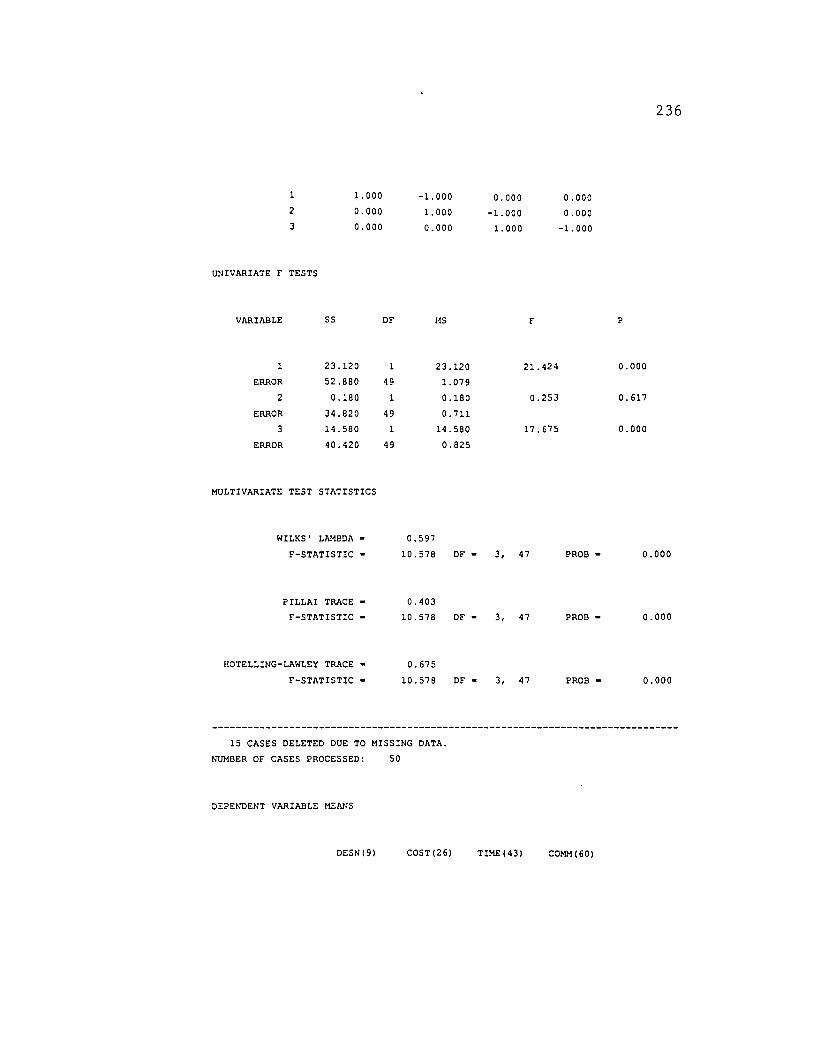
236
1 1. 000 -1.000 0.000 0.0002 0.000 1. 000 -1.000 0.0003 0.000 0.000 1. 000 -1.000
UNIVARIATE F TESTS
VARIABLE SS OF HS P
1 23.120 1 23.120 21. 424 0.000
ERROR 52.880 49 1.079
2 0.180 1 0.180 0.253 0.617
ERROR 34.820 49 0.711
3 14.580 1 14.580 17.675 0.000
ERROR 40.420 49 0.825
MULTIVARIATE TEST STATISTICS
WILKS' LAHBDA • 0.597
F-STATISTIC - 10.578 OF - 3, 47 PROB - 0.000
PILLAI TRACE - 0.403
F-STATISTIC - 10.578 OF - 3, 47 PROB - 0.000
HOTELLING-LAWLEY TRACE - 0.675
F-STATISTIC • 10.578 OF • 3, 47 PROB - 0.000
15 CASES DELETED DUE TO MISSING DATA.
NUMBER OF CASES PROCESSED: 50
DEPENDENT VARIABLE MEANS
DESN (9) COST (26) TIME(43) COHM(60)

3.360 2.940 3.020 3.340
237
-1
REGRESSION COEFFICIENTS B· (X'X) X'Y
CONSTANT
DESN (9)
3.360
COST (26)
2.940
TIME(43)
3.020
COMM(60)
3.340
MULTIPLE CORRELATIONS
DESN (9)
0.000
HYPCTHESIS.
C MATRIX
1. 000
COST (26)
0.000
2
-1.000
TIME(43)
0.000
3
0.000
COMM(60)
0.000
4
0.000

238
2 0.000 1. 000 -1.000 0.000
3 0.000 0.000 1. 000 -1.000
UNIVARIATE F TESTS
VARIABLE SS DF MS F P
8.820 1 8.820 10.756 0.002
ERROR 40.180 49 0.820
2 0.320 1 0.320 0.797 0.376
ERROR 19.680 49 0.402
3 5.120 1 5.17.0 8.124 0.006
ERROR 30.880 49 0.630
MULTIVARIATE TEST pTATISTICS
WILKS' :~AMBDA = 0.755
F-STA1rISTIC - 5.070 DF - 3, 47 PROB - 0.004
PILLAI TRACE - 0.245
F-STMISTIC - 5.070 DF • 3, 47 PROB - 0.004
HOTELLING-LAWLEY TRACE - 0.324
F-STA':rrSTIC - 5.070 DF - 3, 47 PROB - 0.004
------------------~------------------------------------------------------------
15 CASES DELETEp DUE TO MISSING DATA.
NUMBER OF CASES PRpCESSED: 50
DEPENDENT VARIABLE MEANS
DESN no) COST(27) TIME (44) COMM(61)

3.740 3.180 3.220 3.580
239
-1
REGRESSION COEFFICIENTS B· (X'XI X'Y
CONSTANT
MULTIPLE CORRELATIONS
DESN(10)
3.740
COST(27)
3.180
TIME(44)
3.220
COMM(61)
3.580
HYPOTHESIS.
C MATRIX
2
DESN (10)
0.000
1.000
0.000
COST(27)
0.000
2
-1.000
1.000
TIME(44)
0.000
3
0.000
-1.000
COMM(61)
0.000
4
0.000
0.000

240
3 0.000 0·900 1.000 -1.000
UNIVARIATE f TESTS
VARIABLE SS DF MS f P
1 15.680 1 +5.680 14.144 0.000
ERROR 54.320 49 1.109
2 0.080 1 0.080 0.094 0.761
ERROR 41. 920 49 0.856
3 6.480 1 6.480 4.999 0.030
ERROR 63.520 49 1.296
MULTIVARIATE TEST STATISTICS
WILKS' LAMBDA .' 0.751
f-STATISTIC • 5.200 DF • 3) 47 PROS • 0.003
PILLAI TRACE • 0.249
F-STATISTIC • 5.200 DF • 3) 47 PROS • 0.003
HOTELLING-LAWLEY TRACE • 0.332
f-STATISTIC • 5.200 DF • 3; 47 PROS • 0.003
--------------------------------------~----------------------------------------
17 CASES DELETED DUE TO MISSING DAT~.
NUMBER OF CASES PROCESSED: 48
DEPENDENT VARIABLE MEANS
DESN (11) COST(;~8) TIME!(45l COMM (62)

3.208 3.042 3.146 3.333
241
-1
REGRESSION COEffICIENTS B - (X'X) X'Y
CONSTANT
MULTIPLE CORRELATIONS
DESN (11)
3.208
COST (28)
3.042
TIME(45)
3.146
COMM(62)
3.333
HYPOTHESIS.
C MATRIX
2
3
DESN(ll)
0.000
1. 000
0.000
0.000
COST(28)
0.000
2
-1.000
1. 000
0.000
TIME(45)
0.000
3
0.000
-1.000
1. 000
COMM(62)
0.000
4
0.000
0.000
-1.000

UNIVARIATE F TESTS
VARIABLE SS OF MS F P
1 1. 333 1. 333 2.541 0.118
ERROR 24.667 47 0.525
2 0.521 0.521 1. 962 0.168
ERROR 12.479 47 0.266
3 1. 687 1. 687 3.402 0.071
ERROR 23.313 47 0.496
MULTIVARIATE TEST STATISTICS
WILKS' LAHBDA - 0.874
F-STATISTIC - 2.154 OF - 3, 45 PROB • 0.107
PILLAI TRACE - 0.126
F-STATISTIC - 2.154 OF • 3, 45 PROB - 0.107
HOTELLING-LAWLEY TRACE - 0.144
F-STATISTIC - 2.154 OF - 3, 45 PROB - 0.107
18 CASES DELETED DUE TO MISSING DATA.
NUMBER OF CASES PROCESSED: 47
DEPENDENT VARIABLE MEANS
242
DESN (12)
3.000
COST (29)
2.872
TIME(46)
3.021
COMM(63)
3.043
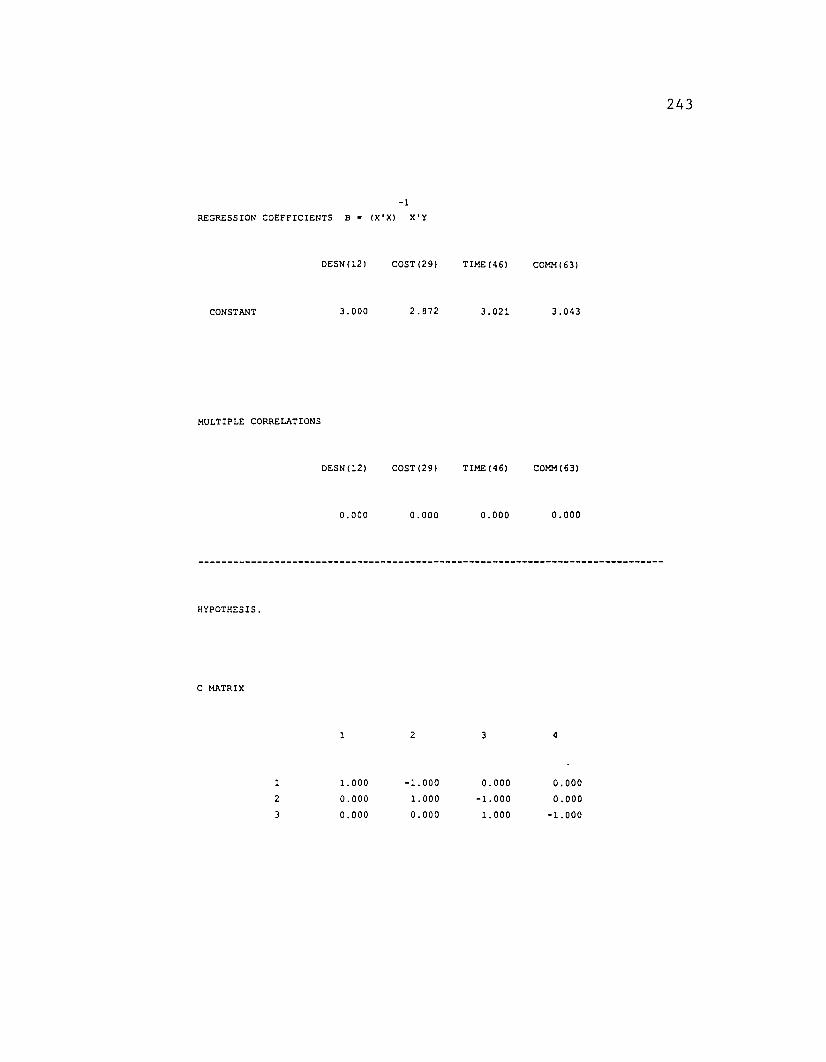
-1
REGRESSION COEFFICIENTS B· (X'XI X'Y
243
CONSTANT
DESN(121
3.000
COST (29)
2.872
TIME (46)
3.021
COMM(631
3.043
MULTIPLE CORRELATIONS
DESN(12)
0.000
HYPOTHESIS.
COST(29)
0.000
TIME(46)
0.000
COMM(63)
0.000
C MATRIX
1 2 3 4
1. 000 -1.000 0.000 0.000
2 0.000 1.000 -1.000 0.000
3 0.000 0.000 1. 000 -1.000
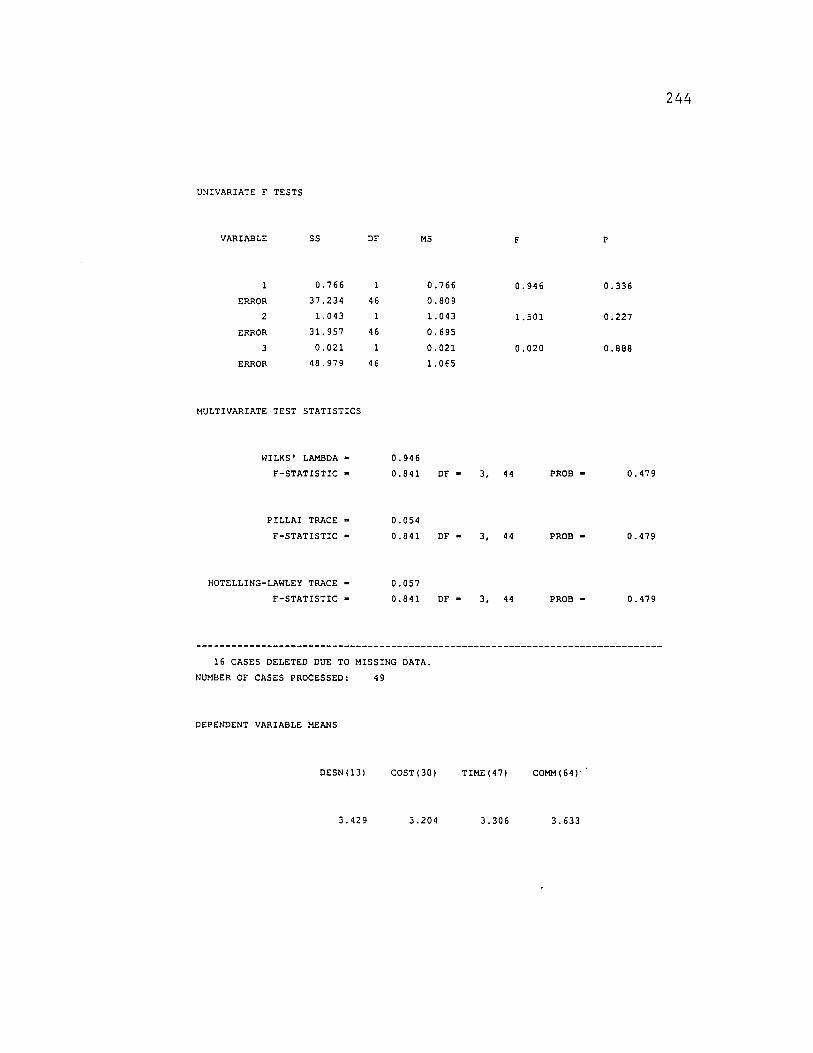
UNIVARIATE F TESTS
VARIABLE SS DF MS F P
0.766 1 0.766 0.946 0.336
ERROR 37.234 46 0.809
2 1. 043 1 1. 043 1. 501 0.227
ERROR 31.957 46 0.695
3 0.021 1 0.021 0.020 0.888
ERROR 48.979 46 1. OE5
MULTIVARIATE TEST STATISTICS
WILKS' LAMBDA • 0.946
F-STATISTIC • 0.841 DF • 3, 44 PROB • 0.479
PILLAI TRACE • 0.054
F-STATISTIC • 0.841 OF • 3, 44 PROB - 0.479
HOTELLING-LAWLEY TRACE • 0.057
F-STATISTIC • 0.841 OF • 3, 44 PROB • 0.479
16 CASES DELETED DUE TO MISSING DATA.
NUMBER OF CASES PROCESSED: 49
DEPENDENT VARIABLE MEANS
244
DESN (13)
3.429
COST(30)
3.204
TIME(47)
3.306
COMM(64)'
3.633

-1
REGRESSION COEFFICIENTS B - (X'XI X'Y
245
CONSTANT
MULTIPLE CORRELATIONS
DESN(131
3.429
COST(301
3.204
TIME(47)
3.306
COMM(64)
3.633
HYPOTHESIS.
DESN (13)
0.000
COST (30)
0.000
TIME(471
0.000
COMM(64)
0.000
C MATRIX
1 2 3 4
1 1.000 -1.000 0.000 0.000
2 0.000 1. 000 -1.000 0.000
3 0.000 0.000 1. 000 -1. 000

UNIVARIATE F TESTS
VARIABLE SS DF MS P
2.469 1 2.469 2.442 0.125
ERROR 48.531 48 1. 011
2 0.510 1 0.510 0.860 0.358
ERROR 28.490 48 0.594
3 5.224 1 5.224 7.211 0.010
ERROR 34.776 48 0.724
MULTIVARIATE TEST STATISTICS
WILKS' LAMBDA - 0.809
F-STATISTIC • 3.609 DF • 3, 46 PROB • 0.020
PILLAI TRACE • 0.191
F-STATISTIC • 3.609 DF • 3, 46 PROB • 0.020
HOTEL~ING-LAWLEY TRACE • 0.235
F-STATISTIC • 3.609 DF • 3, 46 PROB • 0.020
16 CASES DELETED DUE TO MISSING DATA.
NUMBER OF CASES PROCESSED: 49
DEPENDENT VARIABLE MEANS
246
DESN(14)
3.735
COST(31)
3.429
TIME(48)
3.449
COMM(65)
3.592

-1
REGRESSION COEFFICIENTS B· (X'X) X'Y
247
CONSTANT
DESN (14)
3.735
COST(311
3.429
TIME(48)
3.449
COMM(65)
3.592
MULTIPLE CORRELATIONS
DESN (14)
0.000
HYPOTHESIS.
C MATRIX
COST(31)
0.000
TIME(48)
0.000
COMM(65)
0.000
1 2 3 4
1 1.000 -1.000 0.000 0.000
2 0.000 1. 000 -1.000 0.000
3 0.000 0.000 1.000 -1.000
UNIVARIATE F TESTS

248
VARIABLE SS DF MS F P
4.592 1 4.592 6.406 0.015
ERROR 34.408 48 0.717
2 0.020 1 0.020 0.058 0.811
ERROR 16.980 48 0.354
3 1.000 1 1. 000 1. 714 0.197
ERROR 28.000 48 0.583
MULTIVARIATE TEST STATISTICS
WILKS' LAMBDA = 0.875
F-STATISTIC • 2.193 DF • 3, 46 PROB • 0.102
PILLAI TRACE • 0.125
F-STATISTIC = 2.193 DF • 3, 46 PROB • 0.102
HOTELLING-LAWLEY TRACE = 0.143
F-STATISTIC • 2.193 DF • 3. 46 PROB • 0.102
16 CASES DELETED DUE TO MISSING DATA.
NUMBER OF CASES PROCESSED: 49
DEPENDENT VARIABLE MEANS
DESN (151
3.571
COST(32)
3.306
-1
TIME (49)
3.306
COMM(66)
3.694

REGRESSION COEFFICIENTS B ~ (X'XI X'Y
249
CONSTANT
MULTIPLE CORRELATIONS
DESN (15)
3.571
COST(32)
3.306
TIME(49)
3.306
COMM(66)
3.694
HYPOTHESIS.
C MATRIX
2
3
UNIVARIATE F TESTS
DESN(15)
0.000
1
1. 000
0.000
0.000
COST(32)
0.000
2
-1.000
1. 000
0.000
TIME(49)
0.000
3
0.000
-1.000
1. 000
COMM(66)
0.000
4
0.000
0.000
-1. 000

VARIABLE SS DF MS F P
1 3.449 1 3.449 3.801 0.057
ERROR 43.551 48 0.907
2 0.000 1 0.000 0.000 1. 000
ERROR 22.000 48 0.458
3 7.367 7.367 11.934 0.001
ERROR 29.633 48 0.617
MULTIVARIATE TEST STATISTICS
WILKS' LAMBDA· 0.792
F-STATISTIC • 4.036 DF • 3, 46 PROB • 0.012
PILLAI TRACE • 0.208
F-STATISTIC • 4.036 DF • 3, 46 PROB • 0.012
HOTELLING-LAWLEY TRACE • 0.263
F-STATISTIC • 4.036 DF • 3, 46 PROB • 0.012
17 CASES DELETED DUE TO MISSING DATA.
NUMBER OF CASES PROCESSED: 48
DEPENDENT VARIABLE MEANS
250
DESN (16)
3.250
COSTC331
3.104
TIME(50)
3.292
COMM(67)
-1
REGRESSION COEFFICIENTS B· (X'X) X'Y

CONSTANT
MULTIPLE CORRELATIONS
DESN (16)
3.250
COST(33)
3.104
TIMEl501
3.292
COMM(671
3.354
251
HYPOTHESIS.
C MATRIX
1
2
3
UNIVARIATE F TESTS
DESN(16)
0.000
1. 000
0.000
0.000
COST(33)
0.000
2
-1.000
1.000
0.000
TIME (50)
0.000
3
0.000
-1. 000
1.000
COMM(67)
0.000
4
0.000
0.000
-1. 000

VARIABLE SS DF MS F P
1. 021 1. 021 1. 091 0.302
ERROR 43.979 47 0.936
2 1. 687 1 1. 687 5.180 0.027
ERROR 15.313 47 0.326
3 0.188 1 0.188 0.306 0.583
ERROR 28.813 47 0.613
MULTIVARIATE TEST STATISTICS
WILKS' LMIDDA ~ 0.874
F-STATISTIC - 2.160 DF - 3, 45 PROB - 0.106
PILLAI TRACE - 0.126
F-STATISTIC - 2.160 OF - 3, 45 PROB - 0.106
HOTELLING-LAWLEY TRACE - 0.144
F-STATISTIC - 2.160 DF • 3, 45 PROB - 0.106
16 CASES DELETED DUE TO MISSING DATA.
NUMBER OF CASES PROCESSED: 49
DEPENDENT VARIABLE MEANS
252
DESN(l7)
3.102
COST(34)
2.918
TIME (51)
3.163
COMM(68)
3.224
-1
REGRESSION COEFFICIENTS B· (X'X) X'Y
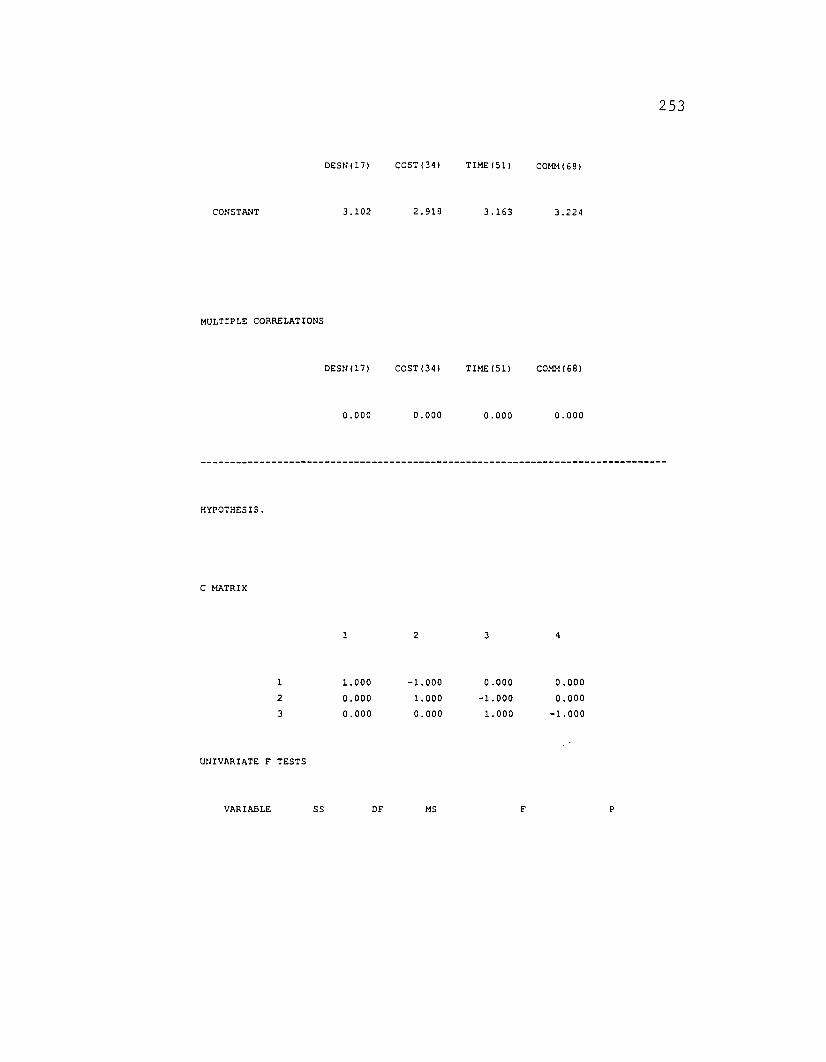
CONSTANT
MULTIPLE CORRELATIONS
DESN (17)
3.102
COST (34)
2.918
TIME (51)
3.163
COMM(681
3.224
253
HYPOTHESIS.
C MATRIX
DESN (17)
0.000
COST(34)
0.000
TIME (51)
0.000
COMM (68)
0.000
1 2 3 4
1 1.000 -1. 000 0.000 0.000
2 0.000 1. 000 -1. 000 0.000
3 0.000 0.000 1. 000 -1.000
UNIVARIATE F TESTS
VARIABLE SS DF MS P

1.653 1 1. 653 1.144 0.290
ERROR 69.347 48 1.445
2 2.939 2.939 3.~76 0.077
ERROR 43.061 48 0.897
3 0.184 1 0.184 0.239 0.627
ERROR 36.816 48 0.767
MULTIVARIATE TEST STATISTICS
WILKS' LAHBOA • 0.925
F-STATI3TIC • 1.243 OF • 3, 46 PROS • 0.305
PILLAI TRACE • 0.075
F-STATISTIC • 1.243 OF • 3, 46 PROS • 0.305
HOTELLING-LAWLEY TRACE • 0.081
F-STATISTIC • 1.243 DF • 3, 46 PROB • 0.305
254

14 CASES DELETED DUE TO MISSING DATA.
NUMBER OF CASES PROCESSED: 51
DEPENDENT VARIABLE MEANS
DESN (1) DESN(2) DESN(3) DESN(4) DESN (5)
3.765 3.235 3.490 3.529 3.196
DESN (6) DESN(7) DESN (8) DESN(9) DESN (10)
3.294 3.569 3.843 3.412 3.804
DESN (11) DESN (12) DESN(13) DESN(14) DESN (15)
3.275 3.078 3.529 3.765 3.667
DESN (16) DESN (17)
3.333 3.137
-1
REGRESSION COEFFICIENTS 8 - (X·X) X'y
DESN(1) DESN(2) DESN(3) DESN (4) DESN(S)
CONSTANT 3.765 3.235 3.490 3.529 3.196
255
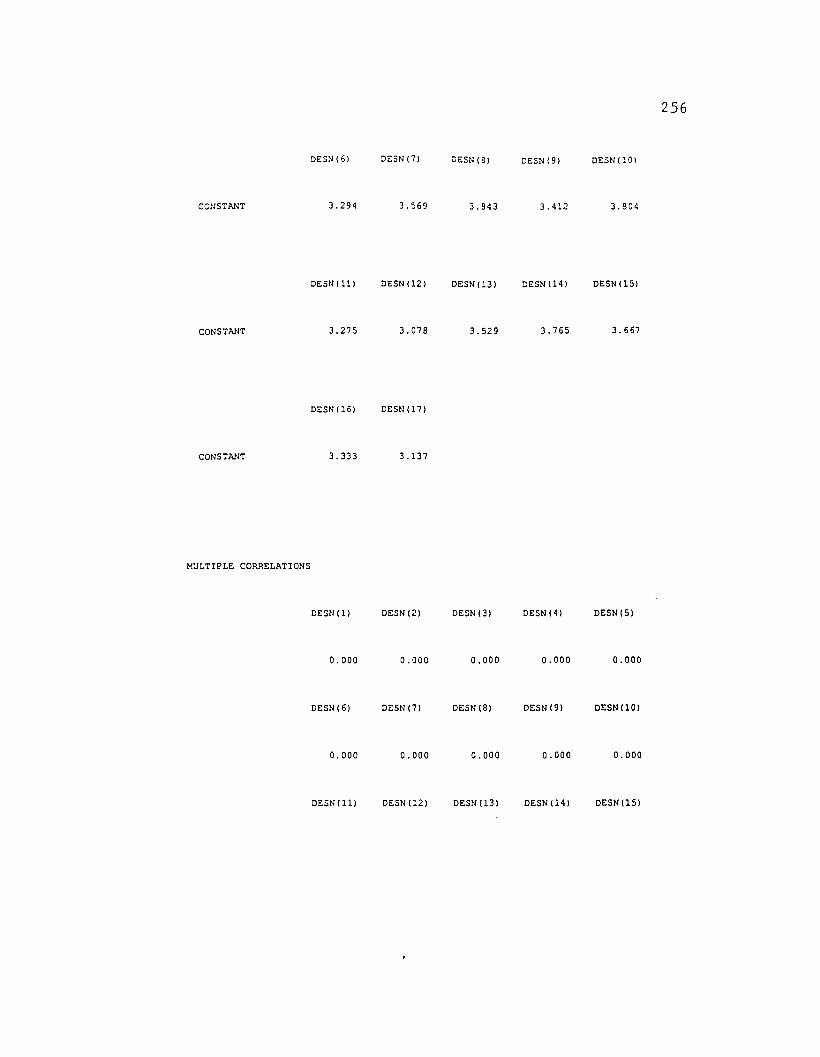
CONSTANT
CONSTANT
CONSTANT
DESN(6)
3.294
DESN (11)
3.275
DESN (16)
3.333
DESN (7)
3.569
DESN (12)
3.078
DESN(17)
3.137
DESN (8)
3.843
DESN (13)
3.529
DESN (9)
3.412
DESN (14)
3.765
DESN(10)
3.804
DESN (15)
3.667
256
MULTIPLE CORRELATIONS
DESN(l)
0.000
DESN(6)
0.000
DESN(l1)
DESN(2)
0.000
DESN (7)
0.000
DESN(12)
DESN(3)
0.000
DESN(8)
0.000
DESN(13)
DESN (4)
0.000
DESN (9)
0.000
DESN (14)
DESN(S)
0.000
DESN(10)
0.000
DESN (15)

HYPOTHESIS.
0.000
DESN(16l
0.000
o.coo
DESN (17)
0.000
0.000 0.000 0.000
257
C MATRIX
2 3 4 5
1 1. 000 -1.000 0.000 0.000 0.000
2 0.000 1. 000 -1.000 0.000 0.000
3 0.000 0.000 1.000 -1. 000 0.000
4 0.000 0.000 0.000 1. 000 -1. 000
5 0.000 0.000 0.000 0.000 1.000
6 0.000 0.000 0.000 0.000 0.000
7 0.000 0.000 0.000 0.000 0.000
8 0.000 0.000 0.000 0.000 0.000
9 0.000 0.000 O.OOC 0.000 0.000
10 0.000 0.000 0.000 0.000 0.000
11 0.000 0.000 0.000 0.000 0.000
12 0.000 0.000 0.000 0.000 0.000
13 0.000 0.000 0.000 0.000 0.000
14 0.000 0.000 0.000 0.000 0.000
15 0.000 0.000 0.000 0.000 0.000
16 0.000 0.000 0.000 0.000 0.000
6 7 8 9 10

1 0.000 0.000 0.000 0.000 0.0002 0.000 0.000 0.000 0.000 0.000
3 0.000 0.000 0.000 0.000 0.000
4 0.000 0.000 0.000 0.000 0.000
S -1.000 0.000 0.000 0.000 0.000
6 1. 000 -1.000 0.000 0.000 0.000
7 0.000 1. 000 -1.000 0.000 0.000
8 0.000 0.000 1. 000 -1. 000 0.000
9 0.000 0.000 0.000 1.000 -1. 000
10 0.000 0.000 0.000 0.000 1.000
11 0.000 0.000 0.000 0.000 0.000
12 0.000 0.000 0.000 0.000 0.000
13 0.000 0.000 0.000 0.000 0.000
14 0.000 0.000 0.000 0.000 0.000
lS 0.000 0.000 0.000 0.000 0.000
16 0.000 0.000 0.000 0.000 0.000
11 12 13 14 lS
1 0.000 0.000 0.000 0.000 0.000
2 0.000 0.000 0.000 0.000 0.000
3 0.000 0.000 0.000 0.000 0.000
0.000 0.000 0.000 0.000 0.000
S 0.000 0.000 0.000 0.000 0.000
6 0.000 0.000 0.000 0.000 0.000
7 0.000 0.000 0.000 0.000 0.000
8 0.000 0.000 0.000 0.000 0.000
9 0.000 0.000 0.000 0.000 0.000
10 -1.000 0.000 0.000 0.000 0.000
11 1. 000 -1. 000 0.000 0.000 0.000
12 0.000 1. 000 -1.000 0.000 0.000
13 0.000 0.000 1. 000 -1.000 0.000
14 0.000 0.000 0.000 1.000 -1. 000
lS 0.000 0.000 0.000 0.000 1.000
16 0.000 0.000 0.000 0.000 0.000
16 17
258

1 0.000 0.000
2 0.000 0.000
3 0.000 0.000
4 0.000 0.000
5 0.000 0.000
6 0.000 0.000
7 0.000 0.000
8 0.000 0.000
9 0.000 0.000
10 0.000 0.000
11 0.000 0.000
12 0.000 0.000
13 0.000 0.000
14 0.000 0.000
15 -1.000 0.000
16 1.000 -1.000
UNIVARIATE F TESTS
VARIABLE SS DF MS F P
14.294 1 14.294 18.465 0.000
ERROR 38.706 50 0.774
2 3.314 3.314 1. 890 0.175
ERROR 87.686 50 1.754
3 0.078 O. 078 0.094 0.761
ERROR 41.922 50 0.838
5.667 5.667 4.337 0.042
ERROR 65.333 50 1. 307
5 0.490 1 0.490 0.304 0.584
ERROR 80.510 50 1.610
6 3.843 3.843 3.990 0.051
ERROR 48.157 50 0.963
7 3.843 3.843 5.315 0.025
ERROR 36.157 50 0.723
9.490 9.490 13.750 0.001
ERROR 34.510 50 0.690
9 7.843 1 7.843 14.993 0.000
ERROR 26.157 50 0.523
259

10 14.294 14.294 15.987 0.000ERROR 44.706 50 0.894
11 1. 961 1 1. 961 2.332 0.133ERROR 42.039 50 0.841
12 10.373 1 10.373 10.244 0.002ERROR 50.627 50 1.013
13 2.824 1 2.824 4.528 0.038ERROR 31.176 50 0.624
14 0.490 1 0.490 0.434 0.513
ERROR 56.510 50 1.130
15 5.667 1 5.667 4.620 0.036
ERROR 61. 333 50 1. 227
16 1. 961 1 1.961 2.041 0.159
ERROR 48.039 50 0.961
MULTIVARIATE TEST STATISTICS
WILKS' LAMBDA • 0.348
F-STATISTIC • 4.090 DF • 16, 35 PROB • 0.000
PILLAI TRACE • 0.652
F-STATISTIC • 4.090 OF • 16, 35 PROB • 0.000
HOTELLING-LAWLEY TRACE • 1. 870
F-STATISTIC • 4.090 OF • 16, 35 PROB • 0.000
13 CASES DELETED DUE TO MISSING DATA.
NUMBER OF CASES PROCESSED: 52
DEPENDENT VARIABLE MEANS
260
COST(18l
3.077
COST(l9)
2.981
COST (20)
2.769
COST(21)
2.962
COST(22)
3.077

COST(2.3) COST(24) COST (25) COST(26) COST(27)
3.058 3.058 3.212 2.962 3.212
COST(28) COST (29) COST (30) COST (31) COST(32)
3.077 2.865 3.173 3.423 3.308
COST(33) COST(34)
3.096 2.981
-1
REGRESSION COEFFICIENTS B - (X'X) X''f
COST (18) COST(19) COST (20) COST (21) COST(22)
CONSTANT 3.077 2.981 2.769 2.962 3.077
261
CONSTANT
COST (23)
3.058
COST(28)
COST (24)
3.058
COST (29)
COST(25)
3.212
COST(30)
COST(26)
2.962
COST (31)
COST(27)
3.212
COST(32)
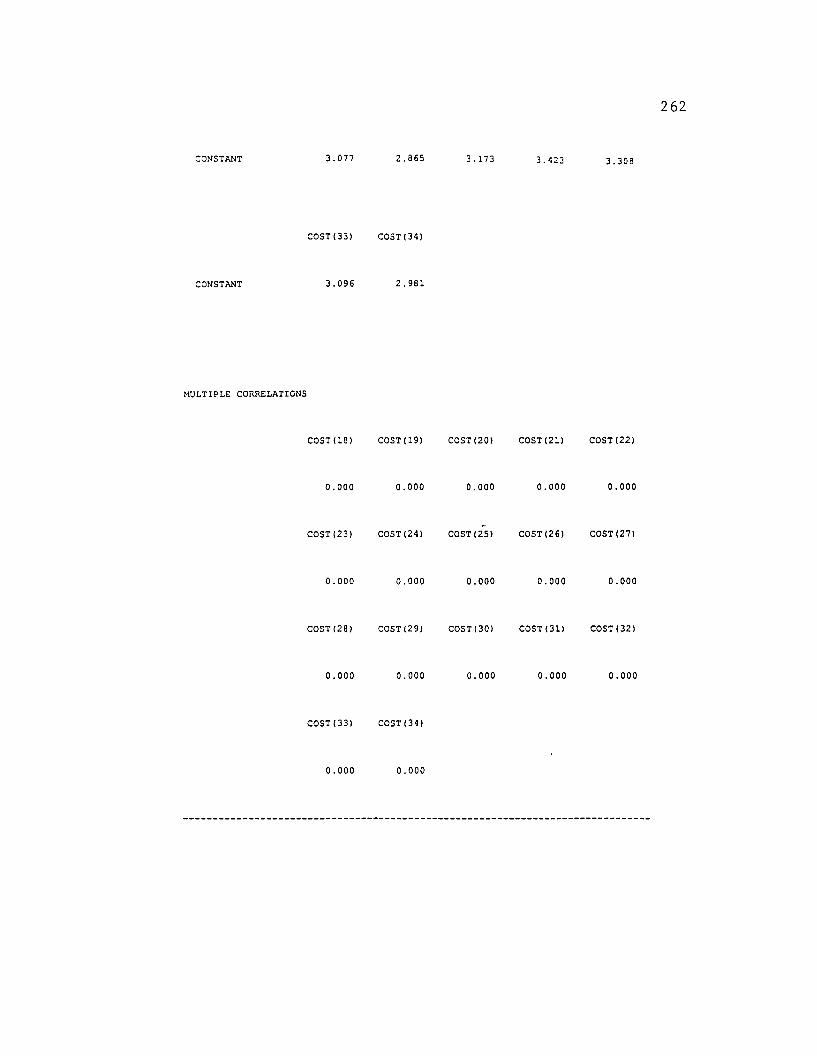
CONSTANT
CONSTANT
3.077
COST (33)
3.096
2.865
COST(34)
2.981
3.173 3.423 3.308
262
MULTIPLE CORRELATIONS
COST (18 I COST (19) COST(20) COST (21) COST(22)
0.000 0.000 0.000 0.000 0.000
COST (23) COST(241 COST (25) COST(26) COST(27)
0.000 0.000 0.000 0.000 0.000
COST(28) COST (29) COST (30) COST (31) COST(321
0.000 0.000 0.000 0.000 0.000
COST(331 COST (34)
0.000 0.000

HYPOTHESIS.
C MATRIX
2 3 5
1 1. 000 -1. 000 0.000 0.000 0.000
2 0.000 1. 000 -1.000 0.000 0.000
3 0.000 0.000 1.000 -1.000 0.000
4 0.000 0.000 0.000 1. 000 -1.000
5 0.000 0.000 0.000 0.000 1. 000
6 0.000 0.000 0.000 0.000 0.000
7 0.000 0.000 0.000 0.000 0.000
8 0.000 0.000 0.000 0.000 0.000
9 0.000 0.000 0.000 0.000 0.000
10 0.000 0.000 0.000 0.000 0.000
11 0.000 0.000 0.000 0.000 0.000
12 0.000 0.000 0.000 0.000 0.000
13 0.000 0.000 0.000 0.000 0.000
14 0.000 0.000 0.000 0.000 0.000
15 0.000 0.000 0.000 0.000 0.000
16 0.000 0.000 0.000 0.000 0.000
7 8 9 10
1 0.000 0.000 0.000 0.000 0.000
2 0.000 0.000 0.000 0.000 0.000
3 0.000 0.000 0.000 0.000 0.000
4 0.000 0.000 0.000 0.000 0.000
5 -1.000 0.000 0.000 0.000 0.000
6 1. 000 -1.000 0.000 0.000 0.000
7 0.000 1. 000 -1.000 0.000 0.000
8 0.000 0.000 1.000 -1.000 0.000
9 0.000 0.000 0.000 1. 000 -1.000
263

10 0.000 0.000 0.000 0.000 1. 000
11 0.000 0.000 0.000 0.000 0.000
12 0.000 0.000 0.000 0.000 0.000
13 0.000 0.000 0.000 0.000 0.000
14 0.000 0.000 0.000 0.000 0.000
15 0.000 0.000 0.000 0.000 0.000
16 0.000 0.000 0.000 0.000 0.000
11 12 13 14 15
1 0.000 0.000 0.000 0.000 0.000
2 0.000 0.000 0.000 0.000 0.000
3 0.000 0.000 0.000 0.000 0.000
4 0.000 0.000 0.000 0.000 0.000
5 0.000 0.000 0.000 0.000 0.000
6 0.000 0.000 0.000 0.000 0.000
7 0.000 0.000 0.000 0.000 0.000
8 0.000 0.000 0.000 0.000 0.000
9 0.000 0.000 0.000 0.000 0.000
10 -1.000 0.000 0.000 0.000 0.000
11 1. 000 -1.000 0.000 0.000 0.000
12 0.000 1.000 -1. 000 0.000 0.000
13 0.000 0.000 1. 000 -1. 000 0.000
14 0.000 0.000 0.000 1. 000 -1. 000
15 0.000 0.000 0.000 0.000 1. 000
16 0.000 0.000 0.000 0.000 0.000
16 17
1 0.000 0.000
2 0.000 0.000
3 0.000 0.000
4 0.000 0.000
5 0.000 0.000
6 0.000 0.000
7 0.000 0.000
8 0.000 0.000
9 0.000 0.000
10 0.000 0.000
264

11 0.000 0.000
12 0.000 0.000
13 0.000 0.000
14 0.000 0.000
15 -1.000 0.000
16 1. 000 -1.000
UNIVARIATE F TESTS
VARIABLE SS DF MS F P
0.481 1 0.481 2.87B 0.096
ERROR 8.519 51 0.167
2 2.327 1 2.327 3.423 0.070
ERROR 34.673 51 0.680
3 1. 923 1 1.923 6.100 0.017
ERROR 16.077 51 0.315
0.692 1 0.692 1.128 0.293
ERROR 31. 308 51 0.614
5 0.019 1 0.019 0.047 0.830
ERROR 20.981 51 0.411
6 0.000 1 0.000 0.000 1.000
ERROR 22.000 51 0.431
7 1.231 1.231 2.757 0.103
ERROR 22.769 51 0.446
3.250 1 3.250 8.392 0.006
ERROR 19.750 51 0.387
9 3.250 1 3.250 5.571 0.022
ERROR 29.750 51 0.583
10 0.942 1 0.942 1. 998 0.164
ERROR 24.058 51 0.472
11 2.327 1 2.327 7.118 0.010
ERROR 16.673 51 0.327
12 4.923 1 4.923 11.912 0.001
ERROR 21. 077 51 0.413
13 3.250 1 3.250 5.973 0.018
ERROR 27.750 51 0.544
14 0.692 1 0.692 1. 395 0.243
ERROR 25.308 51 0.496
15 2.327 1 2.327 6.355 0.015
265

ERROR 18.673 51 0.366
16 0.692 1 0.692 1.205 0.278ERROR 29.308 51 0.575
MULTIVARIATE TEST STATISTICS
WILKS' LAMBDA - 0.530
F-STATISTIC - 1. 995 OF • 16, 36 PROB - 0.043
PILLAI TRACE - 0.470
F-STATISTIC • 1. 995 OF - 16, 36 PROB - 0.043
HOTELLING-LAWLEY TRACE • 0.887
F-STATISTIC • 1. 995 OF • 16, 36 PROB • 0.043
17 CASES DELETED DUE TO MISSING DATA.
NUMBER OF CASES PROCESSED: 48
DEPENDENT VARIABLE MEANS
TIME(351 TIME (36) TIME (37) TIME (38) TIME(39)
3.250 2.854 2.979 3.000 3.208
TIME(40) TIME(41) TIME(42) TIME (43) TIME(44)
3.146 3.083 3.208 3.042 3.188
TIME (45) TIME (46) TIME(47) TIME (48) TIME(49)
266
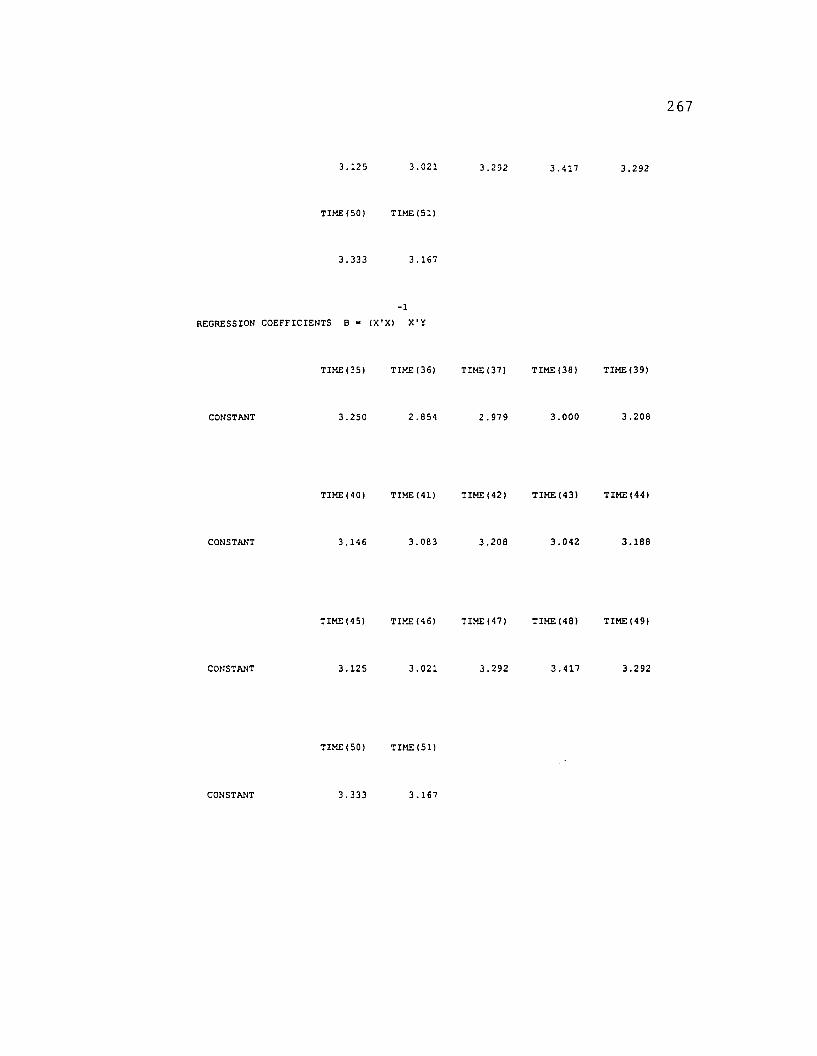
3.125 3.021 3.292 3.417 3.292
TIME (50) TIME (51)
3.333 3.167
-1
REGRESSION COEFFICIENTS B - (X'X) X'Y
TIME(35) TIME (36) TIME(37) TIME (38) TIME(39)
CONSTANT 3.250 2.854 2.979 3.000 3.208
267
CONSTANT
CONSTANT
CONSTANT
TIME(40)
3.146
TIME (45)
3.125
TIME(50)
3.333
TIME(41)
3.083
TIME(46)
3.021
TIME (51)
3.167
TIME (42)
3.208
TIME(47)
3.292
TIME(43)
3.042
TIME (48)
3.417
TIME(44)
3.188
TIME(49)
3.292

MULTIPLE CORRELATIONS
TIME(35) TIME(36) TIME(37) TIME(38) TIME(39)
0.000 0.000 0.000 0.000 0.000
TIME (40) TIME (41) TIME(42) TIME (43) TIME(44)
0.000 0.000 0.000 0.000 0.000
TIME(45) TIME (46) TIME(47) TIME (48) TIME (49)
0.000 0.000 0.000 0.000 0.000
TIME(50) TIME (51)
0.000 0.000
HYPOTHESIS.
C MATRIX
268
2 3 4 5

1 1.000 -1.000 0.000 0,000 0.0002 0.000 1. 000 -1.000 0.000 0.000
3 0.000 0.000 1. 000 -1.000 0.000
4 0.000 0.000 0.000 1. 000 -1.000
5 0.000 0.000 0.000 0.000 1.000
6 0.000 0.000 0.000 0.000 0.000
7 0.000 0.000 0.000 0.000 0.000
8 0.000 0.000 0.000 0.000 0.000
9 0.000 0.000 0.000 0.000 0.000
10 0.000 0.000 0.000 0.000 0.000
1: 0.000 0.000 0.000 0.000 0.000
12 0.000 0.000 0.000 0.000 0.000
13 0.000 0.000 0.000 0.000 0.000
14 0.000 0.000 0.000 0.000 0.000
15 0.000 0.000 0.000 0.000 0.000
16 0.000 0.000 0.000 0.000 0.000
6 7 8 10
1 0.000 0.000 0.000 0.000 0.000
2 0.000 0.000 0.000 0.000 0.000
3 0.000 0.000 0.000 0.000 0.000
4 0.000 0.000 0.000 0.000 0.000
5 -1. 000 0.000 0.000 0.000 0.000
6 1.000 -1.000 0.000 0.000 0.000
7 0.000 1. 000 -1.000 0.000 0.000
8 0.000 0.000 1. 000 -1.000 0.000
9 0.000 0.000 0.000 1. 000 -1.000
10 0.000 0.000 0.000 0.000 1.000
11 0.000 0.000 0.000 0.000 0.000
12 0.000 0.000 0.000 0.000 0.000
13 0.000 0.000 0.000 0.000 0.000
14 0.000 0.000 0.000 0.000 0.000
15 0.000 0.000 0.000 0.000 0.000
16 0.000 0.000 0.000 0.000 0.000
11 12 13 14 15
269

1 0.000 0.000 0.000 0.000 0.000
2 0.000 0.000 0.000 0.000 0.000
3 0.000 0.000 0.000 0.000 0.000
4 0.000 0.000 0.000 0.000 0.000
5 0.000 0.000 0.000 0.000 0.000
6 0.000 0.000 0.000 0.000 0.000
7 0.000 0.000 0.000 0.000 0.000
8 0.000 0.000 0.000 0.000 0.000
9 0.000 0.000 0.000 0.000 0.000
10 -1.000 0.000 0.000 0.000 0.000
11 1. 000 -1.000 0.000 0.000 0.000
12 0.000 1. 000 -1. 000 0.000 0.000
13 0.000 0.000 1. 000 -1.000 0.000
14 0.000 0.000 0.000 1. 000 -1.000
15 0.000 0.000 0.000 0.000 1. 000
16 0.000 0.000 0.000 0.000 0.000
16 17
1 0.000 0.000
2 0.000 0.000
3 0.000 0.000
4 0.000 0.000
5 0.000 0.000
6 0.000 0.000
7 0.000 0.000
8 0.000 0.000
9 0.000 0.000
10 0.000 0.000
11 0.000 0.000
12 0.000 0.000
13 0.000 0.000
14 0.000 0.000
15 -1.000 0.000
16 1.000 -1.000
UNIVARIATE F TSSTS
270

VAlUABLE SS Of MS f P
7.521 7.521 13.873 0.001
ERROR 25.479 47 0.542
2 0.750 0.750 1. 060 0.308
ERROR 33.250 47 0.707
3 0.021 0.021 0.075 0.785
ERROR 12.979 47 0.276
4 2.083 1 2.083 3.068 0.086
ERROR 31.917 47 0.679
5 0.188 1 0.188 0.329 0.569
ERROR 26.813 47 0.570
6 0.188 1 0.188 0.269 0.607
ERROR 32.813 47 0.698
7 0.750 0.750 1. 294 0.261
ERROR 27.250 47 0.580
8 1. 333 1.333 5.875 0.019
ERROP. 10.667 47 0.227
9 1. 021 1 1. 021 2.401 0.128
ERROR 19.979 47 0.425
10 0.187 1 0.187 0.386 0.537
ERROR 22.813 47 0.485
11 0.521 0.521 1. 089 0.302
ERROR 22.479 47 0.478
12 3.521 3.521 5.613 0.022
ERROR 29.479 47 0.627
13 0.750 1 0.750 1. 831 0.182
ERROR 19.250 47 0.410
14 0.750 0.750 2.043 0.159
ERROR 17.250 47 0.367
15 0.083 0.083 0.197 0.659
ERROR 19.917 47 0.424
16 1. 333 1 1. 333 2.765 0.103
ERROR 22.667 47 0.482
MULTIVARIATE TEST STATISTICS
WILKS' LAMBDA - 0.504
f-STATISTIC - 1.971 Of - 16, 32 PROS - 0.050
271

PILLAI TRACE ~
F-STATISTIC a
HOTELLING-LAWLEY TRACE
F-STATISTIC -
0.496
1. 971 OF = 16, 32
0.985
1.971 OF = 16, 32
PROB a
PROB a
0.050
0.050
272
9 CASES DELETED DUE TO MISSING DATA.
NUMBER OF CASES PROCESSED: 56
DEPENDENT VARIABLE MEANS
COMM(52) COMM(53) COMM(54) COMM (55) COMM(56)
3.804 2.982 3.643 3.625 3.339
COMM(57) COMM(58) COMM(59) COMM(60) COMM(61)
3.571 3.268 3.768 3.357 3.607
COMM(62) COMM(631 COMM(64) COMM(65) COMM(66)
3.286
COMM(67)
3.357
3.036
COMM(68)
3.196
3.589 3.625 3.696
-1
REGRESSION COEFFICIENTS B - (X'X) X'Y

CONSTANT
CONSTANT
CONSTANT
CONSTANT
MULTIPLE CORRELATIONS
COMM(52)
3.804
COMM(57)
3.571
COMM(62)
3.286
COMM(67)
3.357
COMM(52)
0.000
COMM(53)
2.982
COMo"! (58 l
3.268
COMM(63)
3.036
COMM(68l
3.196
COMM(53)
0.000
COMM(54)
3.643
COMM (59)
3.768
COMM(64l
3.589
COMo"! (54)
0.000
COMM(55)
3.625
COMM(60)
3.357
COMM(65)
3.625
COMM(55)
0.000
COMM(56)
3.339
COMM(61)
3.607
COMM(66)
3.696
COMM(56)
0.000
273

HYPOTHESIS.
COMM(57) COMM (58) COMM(59) COMM(60) COMM(61)
0.000 0.000 0.000 0.000 0.000
COMM(62l COMM(63) COMM(64) COMM(65) COMM(66l
0.000 0.000 0.000 0.000 0.000
COMM(67l COMM(68l
0.000 0.000
274
C MATRIX
1 2 4 5
1 1. 000 -1.000 0.000 0.000 0.000
2 0.000 1. 000 .. 1. 000 0.000 0.000
3 0.000 0.000 1. 000 -1.000 0.000
4 0.000 0.000 0.000 1. 000 -1.000
5 0.000 0.000 0.000 0.000 1. 000
6 0.000 0.000 0.000 0.000 0.000
7 0.000 0.000 0.000 0.000 0.000
8 0.000 0.000 0.000 0.000 0.000
9 0.000 0.000 0.000 0.000 0.000

10 0.000 0.000 0.000 0.000 0.000
11 0.000 0.000 0.000 0.000 0.000
12 0.000 0.000 0.000 0.000 0.00013 0.000 0.000 0.000 0.000 0.00014 0.000 0.000 0.000 0.000 0.000
15 0.000 0.000 0.000 0.000 0.000
16 0.000 0.000 0.000 0.000 0.000
6 7 9 10
1 0.000 0.000 0.000 0.000 0.000
2 0.000 0.000 0.000 0.000 0.000
3 0.000 0.000 0.000 0.000 0.000
4 0.000 O.OOC 0.000 0.000 0.000
5 -1.000 0.000 0.000 0.000 0.000
6 1. 000 -1.000 0.000 0.000 0.000
7 0.000 1.000 -1.000 0.000 0.000
8 0.000 0.000 1. 000 -1. 000 0.000
9 0.000 0.000 0.000 1.000 -1.000
10 0.000 0.000 0.000 0.000 1.000
11 0.000 0.000 0.000 0.000 0.000
12 0.000 0.000 0.000 0.000 0.000
13 0.000 0.000 0.000 0.000 0.000
14 0.000 0.000 0.000 0.000 0.000
15 0.000 0.000 0.000 0.000 0.000
16 0.000 0.000 0.000 0.000 0.000
11 12 13 14 15
1 0.000 0.000 0.000 0.000 0.000
2 0.000 0.000 0.000 0.000 0.000
3 0.000 0.000 0.000 0.000 0.000
0.000 0.000 0.000 0.000 0.000
5 0.000 0.000 0.000 0.000 0.000
6 0.000 0.000 0.000 0.000 0.000
7 0.000 0.000 0.000 0.000 0.000
8 0.000 0.000 0.000 0.000 0.000
9 0.000 0.000 0.000 0.000 0.000
10 -1.000 0.000 0.000 0.000 0.000
275

11 1. 000 -1.000 0.000 0.000 0.000
12 0.000 1. 000 -1.000 0.000 0.000
13 0.000 0.000 1. 000 -1.000 0.000
14 0.000 0.000 0.000 1. 000 -1. 000
15 0.000 0.000 0.000 0.000 1.000
16 0.000 0.000 0.000 0.000 O.OOU
16 17
1 0.000 0.000
2 0.000 0.000
3 0.000 0.000
4 0.000 0.000
5 0.000 0.000
6 0.000 0.000
7 0.000 0.000
8 0.000 0.000
9 0.000 0.000
10 0.000 0.000
11 0.000 0.000
12 0.000 0.000
13 0.000 0.000
14 0.000 0.000
15 -1. 000 0.000
16 1. 000 -1.000
UNIVARIATE f TESTS
VARIABLE SS Of MS f P
37.786 1 37.786 38.333 0.000
ERROR 54.214 55 0.986
2 24.446 24.446 17.564 0.000
ERROR 76.554 55 1. 392
3 0.018 1 0.018 0.066 0.799
ERROR 14.982 55 0.272
4.571 4.571 3.333 0.073
ERROR 75.429 55 1.371
276

5 3.018 1 3.018 2.678 0.107ERROR 61.982 55 1.127
6 5.161 1 5.161 5.272 0.026ERROR 53.839 55 0.979
7 14.000 1 14.000 27.500 0.000ERROR 28.000 55 0.509
8 9.446 1 9.446 16.466 0.000
ERROR 31. 554 55 0.574
9 3.500 1 3.500 10.405 0.002
ERROR 18.500 55 0.336
10 5.786 5.786 8.787 0.004
ERROR 36.214 55 0.658
11 3.500 1 3.500 6.754 0.012
ERROR 28.500 55 0.518
12 17 .161 17.161 33.903 0.000
ERROR 27.839 55 0.506
13 0.071 0.071 0.131 0.719
ERROR 29.929 55 0.544
14 0.286 1 0.286 0.466 0.498
ERROR 33.714 55 0.613
15 6.446 1 6.446 13.352 0.001
ERROR 26.554 55 0.483
16 1. 446 1 1. 446 1. 543 0.219
ERROR 5•. 554 55 0.937
MULTIVARIATE TEST STATISTICS
WILKS' LAMBDA • 0.280
F-STATISTIC • 6.419 OF • 16, 40 PROB • 0.000
PILLAI TRACE • 0.720
F-STATISTIC • 6.419 DF - 16, 40 PROB - 0.000
HOTELLING-LAWLEY TRACE • 2.567
F-STATISTIC • 6.419 DF • 16, 40 PROB - 0.000
277

APPENDIX J
RATIO DATA GRAPHS
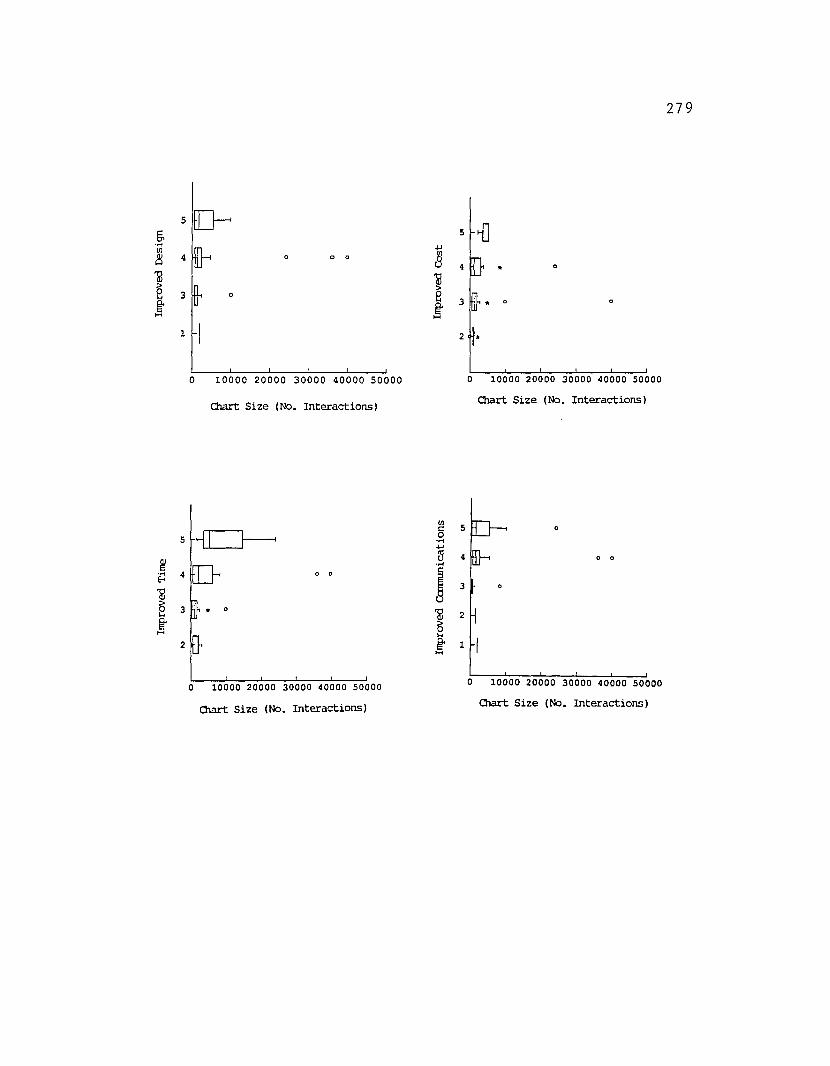
5
§,....III
~ 4 0 0
'@:>e 3
~1
5 1]+J
8 4 * 0
]8 3 * 0g
2 •
279
o 10000 20000 30000 40000 50000
01art Size (No. Interactions)
o 10000 20000 30000 40000 50000
Chart Size (No. Interactions)
{C]---.~ 5 0
5 0....+J
.~~ 4 0 0....
Eo<4 0 0
J'@3
8 3 0
~'@ 2
H ~...2 ~ 1 IH
0 10000 20000 30000 40000 50000 0 10000 20000 30000 40000 50000
Chart Size (No. Interactions) Olart Size (No. Interactions)
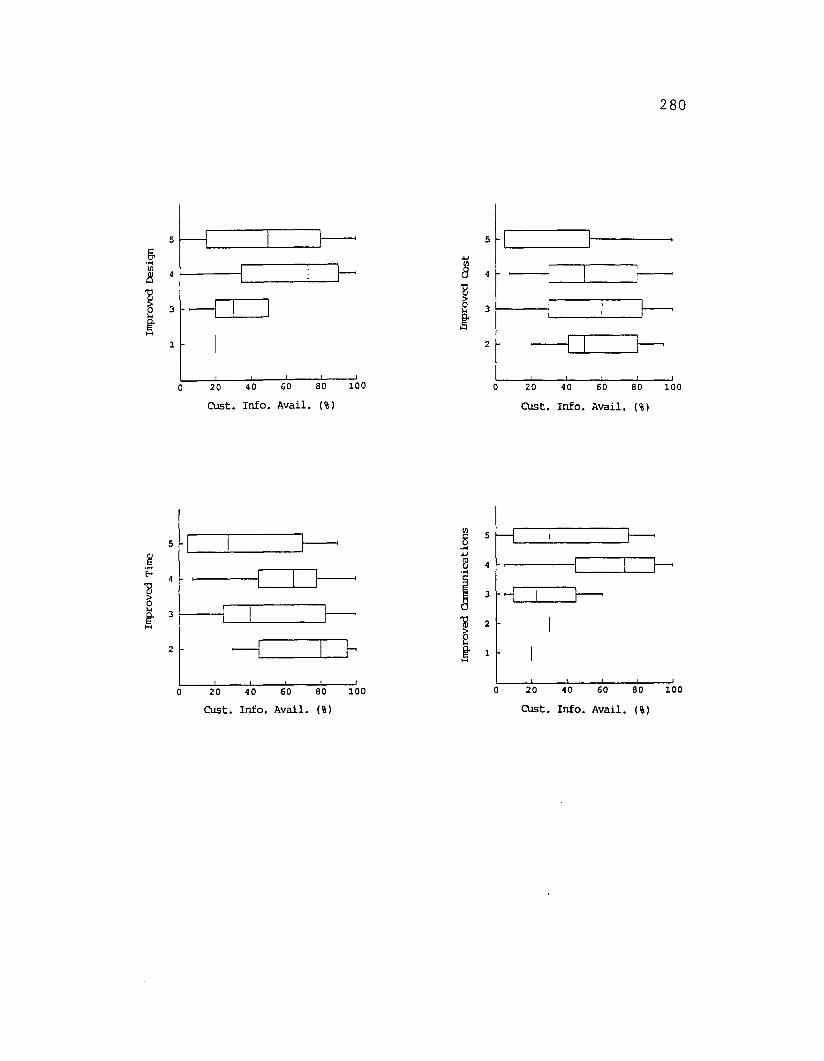
280
2
5 I 1----<
§ 4 -C=1_--e:-
i ,1-----:... ""-_--'
5
G-....III
~4
'@
~:>
38~.....
I1
o 20 40 GO 80 100 o 20 40 60 80 100
Cust. Info. Avail. (%) Cust. Info. Avail. (%)
III5c.=J f--. 85 ....
.~+J
8 4 I rEo<~
....'@ i l-~:> 3 ...,8~
3'@ 2.....~
--1 G \.<2
~ 1
0 20 40 60 80 100 0 20 40 60 80 100
Cust. Info. Avail. (%) Cust. Info. Avail. (%)

281
5 5 cr& ...,
Ul.... 8Ul 4 4~ *
] ~3 .-1 ~ 38 ~j1 2 *
0 20 40 60 eo 100 0 20 40 60 eo 100
canpet. Info. Avail. (%) canpet. Info. Avail. (%)
~ 8 55 .......,
.~ ~ 4 *4
....... j'@ 3 0
>8 3
~
~2
H
2 j 1
0 20 40 60 eo 100 0 20 40 60 eo 100
Ca1lJet. Info. Avail. (%) Ca1lJet. Info. Avail. (%)

282
5 ------c:JJ--< 5 iI}§, .....
~Ul
.",
4 8 ---G f--.Ul 4
~ '@
1 ...-ITJ---.>
3 • 8 3 ..--[0-~
~.... 1 I .-[J---.2
! ! ! I
0 5 10 15 20 0 5 10 15 20
Team Size (No. People) Team Size (No. People)
-cD§ 5 ..-[]]----
5 ~.....
~~ 4~
.",
~ JEo< 4
'@ 3 [] f-->8 3 ~ '@~ 8
2 I2 ~ ~ 1 I....
0 5 10 15 20 0 5 10 15 20
Team Size (No. People) Team Size (No. People)
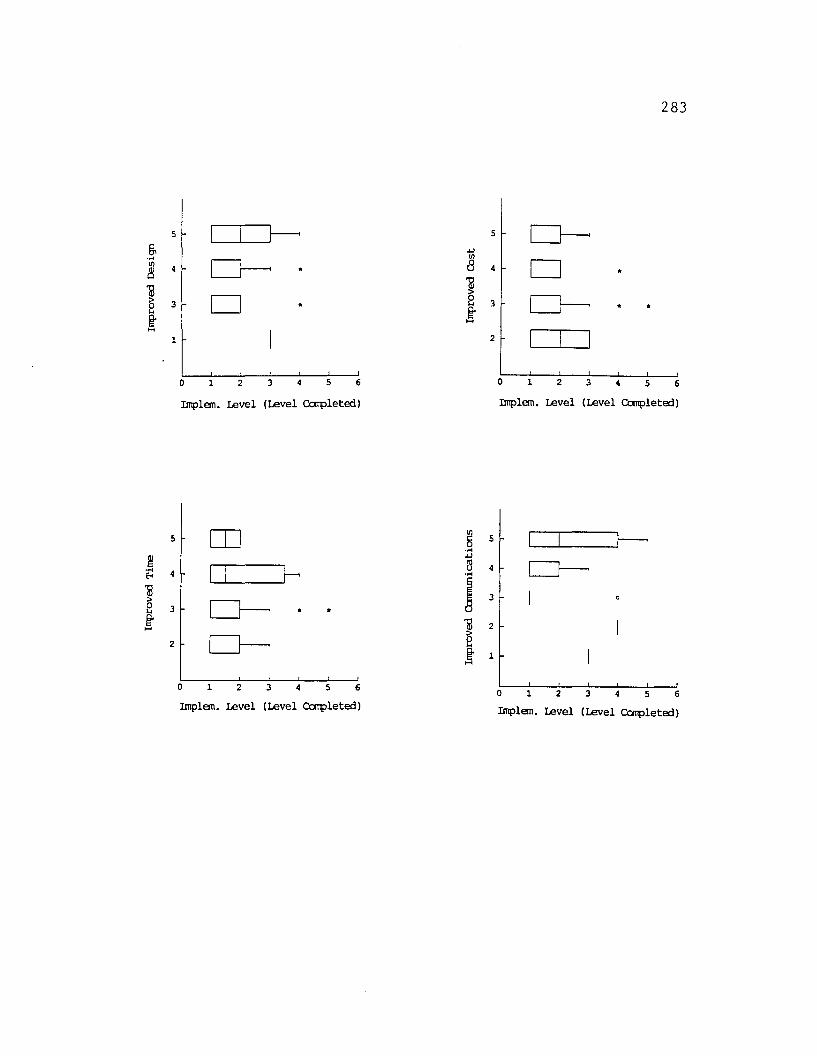
283
5 ~ 5 ~& +J....~
VIUl
4 8 4 0~
al al>
8 3 D * 8 :1 ~ * *~~ >-l>-l
CIJ1 2
0 1 2 3 5 6 0 1 2 :> 4 5 6
Implem. Level (Level eat1pleted) Implem. Level (Level eat1pleted)
5 [[] 8 5 0 ~....~
+J
....4 0 ~
~ CJ-----t-< ....al j 3 I>~8 3 *
~ al 2
2 ~ 8~ 1
0 1 2 3 4 5 60 1 2 3 4 5 6
Implem. Level (Level eat1pleted) Implem. Level (Level CoTq:>leted)
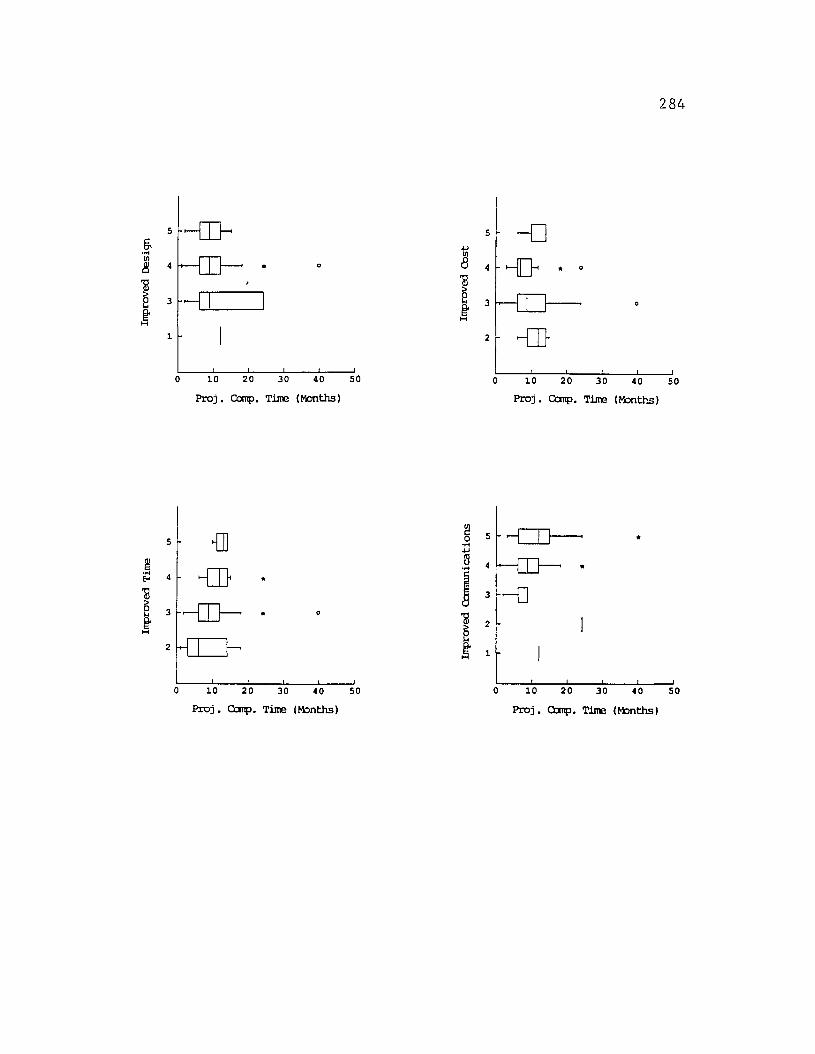
284
5 .-m- 5 -05, ....... IIIIII 8 -flY8 4 * 4 * 0
] ]8 3 ~ 8 3
It ItH
H
1 2 .-(J}
0 10 20 30 40 50 0 10 20 30 40 50
Proj. canp. T:iJre (!'kmths) Proj. canp. T:iJre (Months)
{]]:g
5~5 0.......~ ~ 4 *~
........4 iE-o *
"@ 3 --08 3~ * 0
1~ 2H
2 ! 1
0 10 20 30 40 50 0 10 20 30 40 50
Proj. canp. T:iJre (Months) Proj. canp. T:iJre (fobnths)

APPENDIX K
DR. W. EDWARDS DEMING'S REVIEW COMMENTS

286
To The Office Of Graduate Studies:
I have reviewed the dissertation of Geoffrey Paul Gilmore. My comments havebeen communicated to Geoffrey Paul Gilmore who has understood and satisfactorilyresponded to them. With those comments and responses in mind, I approve thedissertation of Geoffrey Paul Gilmore.
1V~~ ca~ c=-,.
Dr. W. Edwards Deming ~External Faculty Reviewer