Embed Size (px)
Citation preview

IDENTIFYING GENETIC ASSOCIATIONS WITH VARIABILITY IN METABOLIC HEALTH AND BLOOD COUNT LABORATORY VALUES: DIVING INTO THE QUANTITATIVE TRAITS BY LEVERAGING LONGITUDINAL DATA FROM AN EHR*
SHEFALI S. VERMA1, ANASTASIA M. LUCAS1, DANIEL R. LAVAGE1, JOSEPH B. LEADER1, RAGHU METPALLY2, SARATHBABU KRISHNAMURTHY1, FREDERICK DEWEY3, INGRID BORECKI3,
ALEXANDER LOPEZ3, JOHN OVERTON3, JOHN PENN3, JEFFREY REID3, SARAH A PENDERGRASS1, GERDA BREITWIESER2, MARYLYN D. RITCHIE1
Department of Biomedical and Translational Informatics, Geisinger Health System, Danville, PA1
Department of Functional and Molecular Genomics, Geisinger Health System, Danville, PA2 Regeneron Genetics Center, Tarrytown, NY3
A wide range of patient health data is recorded in Electronic Health Records (EHR). This data includes diagnosis, surgical procedures, clinical laboratory measurements, and medication information. Together this information reflects the patient’s medical history. Many studies have efficiently used this data from the EHR to find associations that are clinically relevant, either by utilizing International Classification of Diseases, version 9 (ICD-9) codes or laboratory measurements, or by designing phenotype algorithms to extract case and control status with accuracy from the EHR. Here we developed a strategy to utilize longitudinal quantitative trait data from the EHR at Geisinger Health System focusing on outpatient metabolic and complete blood panel data as a starting point. Comprehensive Metabolic Panel (CMP) as well as Complete Blood Counts (CBC) are parts of routine care and provide a comprehensive picture from high level screening of patients’ overall health and disease. We randomly split our data into two datasets to allow for discovery and replication. We first conducted a genome-wide association study (GWAS) with median values of 25 different clinical laboratory measurements to identify variants from Human Omni Express Exome beadchip data that are associated with these measurements. We identified 687 variants that associated and replicated with the tested clinical measurements at p<5x10-08. Since longitudinal data from the EHR provides a record of a patient’s medical history, we utilized this information to further investigate the ICD-9 codes that might be associated with differences in variability of the measurements in the longitudinal dataset. We identified low and high variance patients by looking at changes within their individual longitudinal EHR laboratory results for each of the 25 clinical lab values (thus creating 50 groups – a high variance and a low variance for each lab variable). We then performed a PheWAS analysis with ICD-9 diagnosis codes, separately in the high variance group and the low variance group for each lab variable. We found 717 PheWAS associations that replicated at a p-value less than 0.001. Next, we evaluated the results of this study by comparing the association results between the high and low variance groups. For example, we found 39 SNPs (in multiple genes) associated with ICD-9 250.01 (Type-I diabetes) in patients with high variance of plasma glucose levels, but not in patients with low variance in plasma glucose levels. Another example is the association of 4 SNPs in UMOD with chronic kidney disease in patients with high variance for aspartate aminotransferase (discovery p-value: 8.71x10-09 and replication p-value: 2.03x10-06). In general, we see a pattern of many more statistically significant associations from patients with high variance in the quantitative lab variables, in comparison with the low variance group across all of the 25 laboratory measurements. This study is one of the first of its kind to utilize quantitative trait variance from longitudinal laboratory data to find associations among genetic variants and clinical phenotypes obtained from an EHR, integrating laboratory values and diagnosis codes to understand the genetic complexities of common diseases.
* This work is supported by funds from Geisinger Health System and the Regeneron Genetics Center. Supplementary
material can be found at: http://ritchielab.psu.edu/publications/supplementary-data/psb-2017/CBC-Met-Labs.
Pacific Symposium on Biocomputing 2017
533

1. Introduction
In this era of personalized medicine, emphasis is on preventive care facilitated by integration of a patient’s medical and genomic information. De-identified electronic health records (EHR) and bio-repositories represent significant resources of information that have been widely used for association studies in past decade1. Electronic health record (EHR) data is primarily designed for clinical care and is represented in both structured (such as ICD-9 codes, medication information, clinical laboratory values) as well as unstructured (physician notes) forms. Many association studies have utilized ICD-9 codes as well as clinical lab variables (structured forms of EHR data) to identify variants associated with EHR-derived phenotypes that might be of clinical relevance2–4. The number of association studies using EHR-derived phenotypes (both structured and unstructured data) has been increasing rapidly5. The complete blood count (CBC) panel and comprehensive/basic metabolic panel (CMP/BMP) are part of routine medical care for all medical practices. These panels are comprised of tests that help clinical practitioners identify underlying causes for conditions like weakness and fatigue, as well as to identify chronic illnesses (e.g., kidney failure, heart disease). These tests are generally conducted on patients that show some signs of illness, but these routine measurements are conducted from time to time on healthy individuals as well. Thus, utilizing these panels can help us understand overall health of patients by comparing these measurements across all patients in an EHR. These tests are recorded as quantitative variables for which units of measurements can be standardized across multiple clinical practices. ICD-9 codes and clinical measurements go hand in hand for a patient’s medical record as a diagnosis code may either initiate the lab test which confirms the code or the code may be entered as a result of the test. Thus, integrating both clinical laboratory measurements and diagnosis codes present powerful approaches for understanding genetic variants that show similar associations with both data types obtained from an EHR3. The majority of association studies that use quantitative traits derived from an EHR as phenotypes use either mean/median values3,6 or most recent measurements7. While this approach has been successful, utilizing only mean/median values limits the understanding of these traits by neglecting the variability over time that may be present in an individual patient’s clinical history. This can be captured for analysis by using unique longitudinal information from EHR. Longitudinal data provides a better picture of the patient’s health by actually pinpointing the time of disease onset, or time in which the quantitative trait became out of the normal range, which is especially important for the diseases that are more heterogeneous in nature and progress over time/age. A strategy such as this has been applied to family-based studies, using a mixed effects model to find associations among candidate genes and longitudinal data8. Utilizing the longitudinal data in some way other than considering one value also provides the opportunity to consider not just the average, but also the variability in these traits over time. In this study, our goal was to develop a strategy to embrace the longitudinal data in a population-based dataset, using trait variance, rather than a measure of central tendency approach such as median values, by binning patients in high and low variance groups separately to then test for associations. This strategy allows for the integration of clinical lab measurements as quantitative traits, embracing the variability in the traits, along with ICD-9 code PheWAS associations as well as SNPs.
Pacific Symposium on Biocomputing 2017
534

2. Materials and Methods
2.1 Genotype Data
The MyCode® Community Health Initiative is a research initiative to engage Geisinger Health System patients in research and integrate their clinical EHR data along with genetic information to make discoveries in health and disease9. Over 109,000 Geisinger patients have consented to participate in MyCode and approximately 50,000 participants have whole exome sequencing and genome-wide genotype data generated. For this study, we used participants that have been genotyped using the Illumina Human Omni Express plus Exome beadchip. This dataset contains 45,899 samples and ~600K variants after some initial quality control procedures. For this analysis, after sample QC (removing one sample from pairs of highly related samples up to 1st cousins and removing any samples that did not pass a sample call rate filter of 90%), we divided the total dataset into two random sets to perform discovery and replication analyses. We included only European American samples with age >18 years. Our discovery dataset consisted of 17,347 samples and our replication dataset consisted of 17,348 samples (see Supplementary Table 1 for demographic information on these samples). We also filtered the variants that did not pass a genotype call rate filter of 99% to keep only high quality SNP data. To test common variants only, we applied a minor allele frequency (MAF) filter of 1%. This resulted in a total of 629,274 variants that were considered for association testing in the discovery dataset and 629,016 variants tested in the replication dataset.
2.2 Phenotype Data
Twenty-five clinical laboratory variables were extracted from EHR outpatient data and checked for consistency of unit measurements. A list of all 25 variables is provided in Table 1, along with information on the panel from which they were obtained. The phenotype data is extracted from the EHR as longitudinal data for all patients across their clinical history. Thus, each sample has multiple entries for each variable. The first step in conducting our GWAS analysis was to obtain median values for all 25 variables across patients’ longitudinal data. We wanted to be able to compare the GWAS on median values with the analyses in the high-variance and low-variance groups. We visually inspected the clinical lab variable distributions to determine which variables needed a natural log transformation. We also removed all outliers that were more than 2.5 standard deviations from the mean. While this could lose some very interesting data points, for this pilot analysis, we wanted to be sure to remove gross errors in lab variable coding/data entry. Supplementary Figure 1 and 2 show the distribution of discovery and replication datasets, respectively, after removing outliers and performing natural log transformation wherever necessary. Table 1 lists the name of the variable, how the sample is collected (i.e. Blood or Serum/Plasma), which panel the variable is obtained from (i.e. Complete Blood Count (CBC) or Comprehensive Metabolic Panel (CMP) or Basic Metabolic Panel (BMP)), the total sample size for each phenotype in both discovery and replication datasets, and whether or not the data were transformed.
Pacific Symposium on Biocomputing 2017
535

Table 1. List of 25 clinical laboratory measurements that are used in the analysis.
Clinical Laboratory Measurement Panel type Discovery Sample Size
Replication Sample Size
Transformation
ALANINE AMINOTRANSFERASE (ALT) -
SERUM/PLASMA
CMP 15527 15393 Yes
ALBUMIN - SERUM/PLASMA CMP 15519 15439 Yes ALKALINE PHOSPHATASE -
SERUM/PLASMA CMP 15189 15088 Yes
ANION GAP - SERUM/PLASMA BMP/CMP 15954 15849 No ASPARTATE
AMINOTRANSFERASE (AST) - SERUM/PLASMA
CMP 15406 15310 Yes
BILIRUBIN - SERUM/PLASMA CMP 15224 15141 Yes CALCIUM (CA) - SERUM/PLASMA
BMP/CMP 16164 16098 No
CARBON DIOXIDE (CO2) - SERUM/PLASMA
BMP/CMP 16309 16203 No
CHLORIDE (CL) - SERUM/PLASMA
BMP/CMP 16235 16130 No
CREATININE - SERUM/PLASMA
BMP/CMP 16403 16323 Yes
Erythrocyte Distribution Width (RDW) - BLOOD
CBC 16032 15974 Yes
GLUCOSE - SERUM/PLASMA BMP 16184 16137 Yes Hematocrit (HCT) - BLOOD CBC 16213 16184 No HEMOGLOBIN - BLOOD CBC 16234 16186 No
Mean Corpuscular Hemoglobin (MCH) - BLOOD
CBC 16175 16120 No
Mean Corpuscular Hemoglobin Concentration (MCHC) - BLOOD
CBC 16166 16114 No
Mean Corpuscular Volume (MCV) - BLOOD
CBC 16220 16161 No
PLATELET - BLOOD - COUNT CBC 16122 16099 No Platelet Mean Volume (MPV) -
BLOOD CBC 16281 16247 No
POTASSIUM (K) - SERUM/PLASMA
BMP/CMP 16255 16165 No
PROTEIN - SERUM/PLASMA CMP 15002 14932 No RBC-COUNT-BLOOD CBC 16187 16142 No
SODIUM (NA) - SERUM/PLASMA
BMP/CMP 16222 16144 No
UREA NITROGEN - SERUM/PLASMA
BMP/CMP 16147 16049 No
WBC-COUNT-BLOOD CBC 16478 16455 Yes
Pacific Symposium on Biocomputing 2017
536

For the variance based analysis, we first calculated the variance for each sample across their longitudinal clinical data from EMR. For each clinical lab variable, we visually inspected scatterplots of the variance distribution and determined a threshold for discovery and replication datasets separately (Supplementary Table 2). Next, samples were divided into high and low variance groups. For the high-variance/low-variance PheWAS analyses, we extracted all ICD-9 codes from the EHR. Participants were defined as cases if they had 3 or more instances of a particular ICD-9 code; less than 3 instances per participant were set to missing; and for no occurrence of an ICD-9 code, participants were designated control status. This resulted in testing a total of 541 ICD-9 codes.
2.3 Analysis Methods
We performed the analysis for this study as a two-step process. First we performed a GWAS on median values for 25 different clinical lab variables (Figure 1). Next, we took the SNPs associated with the median trait values and performed an ICD-9 code PheWAS after grouping the participants into high-variance and low-variance groups for each clinical lab variable (Figure 2). Each of these analyses is described in more detail in the following sections.
2.3.1 Genome wide association analysis for 25 median clinical laboratory measurement
We performed a genome-wide association study (GWAS) to identify associations among all variants from the data (after quality control data cleaning) with median lab values for each of the 25 phenotypes. Linear regression analysis was performed using PLATO10 (http://ritchielab.psu.edu/software/plato-download). All models were adjusted for age, sex and first 4 principal components to control for confounding influences in the analysis. Approximately 15M (~600,000 SNPs and 25 variables) tests were performed for each patient for both discovery and replication datasets. This analysis was repeated for both discovery and replication datasets separately and then we identified p-values for all variant and clinical lab combinations that were below genome-wide significance (p-value 5x10⁻⁸) in both datasets (discovery and replication).
Figure 1. Flow chart describing the analyses for median lab variable linear regression GWAS on 25 clinical labs
Pacific Symposium on Biocomputing 2017
537
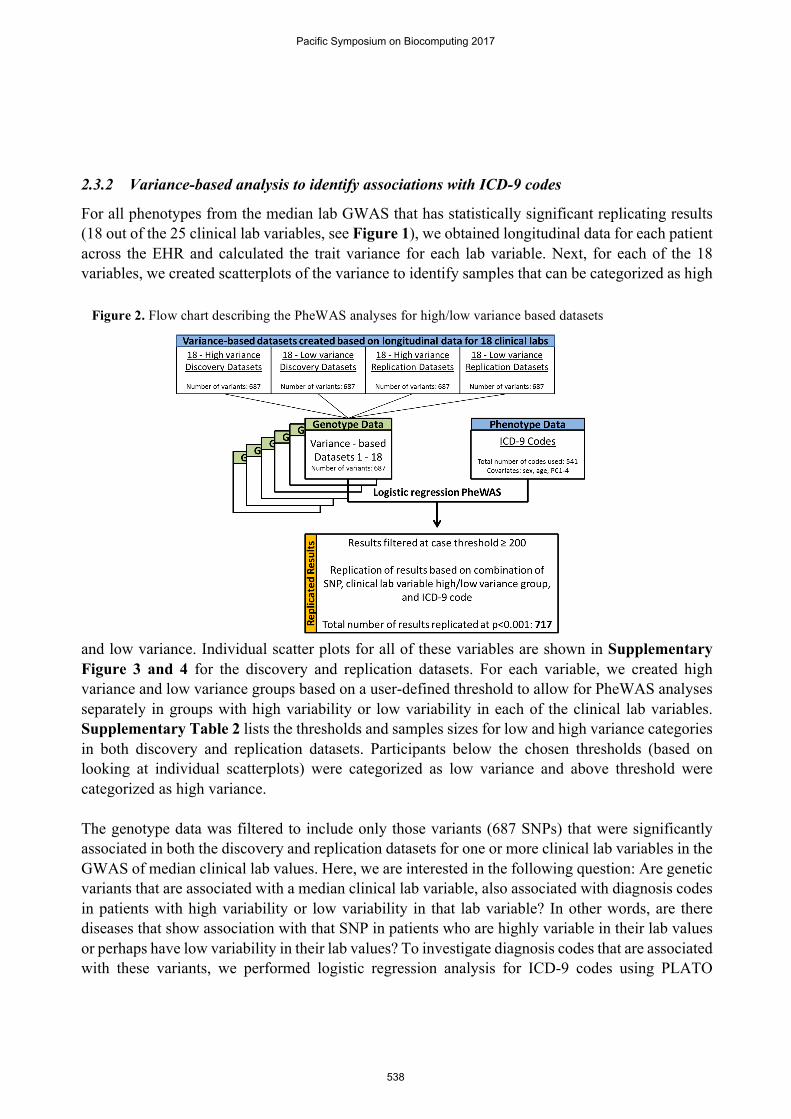
2.3.2 Variance-based analysis to identify associations with ICD-9 codes
For all phenotypes from the median lab GWAS that has statistically significant replicating results (18 out of the 25 clinical lab variables, see Figure 1), we obtained longitudinal data for each patient across the EHR and calculated the trait variance for each lab variable. Next, for each of the 18 variables, we created scatterplots of the variance to identify samples that can be categorized as high
and low variance. Individual scatter plots for all of these variables are shown in Supplementary Figure 3 and 4 for the discovery and replication datasets. For each variable, we created high variance and low variance groups based on a user-defined threshold to allow for PheWAS analyses separately in groups with high variability or low variability in each of the clinical lab variables. Supplementary Table 2 lists the thresholds and samples sizes for low and high variance categories in both discovery and replication datasets. Participants below the chosen thresholds (based on looking at individual scatterplots) were categorized as low variance and above threshold were categorized as high variance. The genotype data was filtered to include only those variants (687 SNPs) that were significantly associated in both the discovery and replication datasets for one or more clinical lab variables in the GWAS of median clinical lab values. Here, we are interested in the following question: Are genetic variants that are associated with a median clinical lab variable, also associated with diagnosis codes in patients with high variability or low variability in that lab variable? In other words, are there diseases that show association with that SNP in patients who are highly variable in their lab values or perhaps have low variability in their lab values? To investigate diagnosis codes that are associated with these variants, we performed logistic regression analysis for ICD-9 codes using PLATO
Figure 2. Flow chart describing the PheWAS analyses for high/low variance based datasets
Pacific Symposium on Biocomputing 2017
538

(http://ritchielab.psu.edu/software/plato-download) by adjusting all models by age, sex and first 4 principal components. We only considered ICD-9 codes that had at least 200 or more cases with the code to reduce any false positive associations. Thus, for each sample 371,667 tests were erformed (687 SNPs and 541 ICD-9 codes). Lastly, we report the PheWAS results below a p-value threshold of 0.001 that replicate in low variance and/or high variance categories.
3. Results
Genome-wide association studies for median values from 25 clinical laboratory variables produced 935 SNP-phenotype associations that are present in discovery and replication sets at p-value less than 5x10⁻⁸. Association results below p-value 0.1 are shown in Figure 3 as Manhattan plots for both discovery and replication datasets. Among the top results are multiple variants in the UGT1A gene family associated with serum bilirubin levels, where p-values for both discovery and replication datasets is 3.29 x 10-83. This association has been identified and extensively reported by candidate gene and genome-wide association studies11. Hyperbilirubinemia results from a mutation in the UGT1A1 gene which causes the non- or slow elimination of bilirubin from the body. We also identified variants in SLCO1B1 associated with bilirubin levels, as suggested by previous GWAS studies 12–14 (rs4149081, Discovery p-value: 8.18x10⁻³¹ Replication p-value:3.81x10⁻²²). Another association we identified is between missense variant, rs855791, on chromosome 22 in
gene TMPRSS6 (Discovery p-value: 2.04x10-60 (beta=-0.27); Replication p-value: 1.73x10-51 (beta=-0.25)). This association was identified by previous GWAS studies with hemoglobin levels as well as hemoglobin concentration15,16. It has been suggested that TMPRSS6 is essential for maintaining iron levels in blood as it is involved in the control of iron homeostasis 16,17. In addition, our GWAS analyses also identified many more previously reported associations, including variants
Figure 3. Manhattan plots for GWAS performed on all 25 clinical lab variables. X-axis represents the chromosome and base pair location of each SNP and Y-axis represent the –log10 of p-value from association
analysis. The two colors represent p-value for discovery and replication datasets. Direction of effect (positive or negative) is shown by the direction of arrows. Results at p-value <0.1 are shown in the plot. Black line indicates
genome-wide significance (5e-08) threshold.
Pacific Symposium on Biocomputing 2017
539
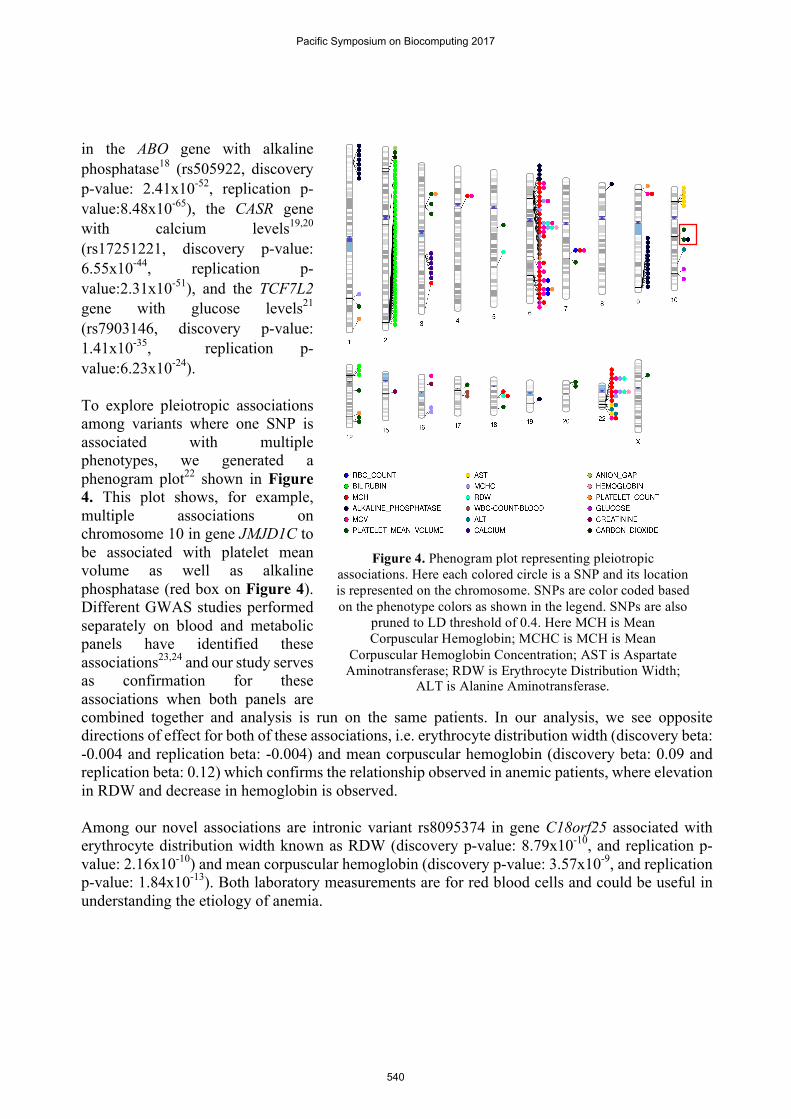
in the ABO gene with alkaline phosphatase18 (rs505922, discovery p-value: 2.41x10-52, replication p-value:8.48x10-65), the CASR gene with calcium levels19,20 (rs17251221, discovery p-value: 6.55x10-44, replication p-value:2.31x10-51), and the TCF7L2 gene with glucose levels21 (rs7903146, discovery p-value: 1.41x10⁻³⁵, replication p-value:6.23x10⁻²⁴). To explore pleiotropic associations among variants where one SNP is associated with multiple phenotypes, we generated a phenogram plot22 shown in Figure 4. This plot shows, for example, multiple associations on chromosome 10 in gene JMJD1C to be associated with platelet mean volume as well as alkaline phosphatase (red box on Figure 4). Different GWAS studies performed separately on blood and metabolic panels have identified these associations23,24 and our study serves as confirmation for these associations when both panels are combined together and analysis is run on the same patients. In our analysis, we see opposite directions of effect for both of these associations, i.e. erythrocyte distribution width (discovery beta: -0.004 and replication beta: -0.004) and mean corpuscular hemoglobin (discovery beta: 0.09 and replication beta: 0.12) which confirms the relationship observed in anemic patients, where elevation in RDW and decrease in hemoglobin is observed. Among our novel associations are intronic variant rs8095374 in gene C18orf25 associated with erythrocyte distribution width known as RDW (discovery p-value: 8.79x10⁻¹⁰, and replication p-value: 2.16x10⁻¹⁰) and mean corpuscular hemoglobin (discovery p-value: 3.57x10⁻⁹, and replication p-value: 1.84x10⁻¹³). Both laboratory measurements are for red blood cells and could be useful in understanding the etiology of anemia.
Figure 4. Phenogram plot representing pleiotropic associations. Here each colored circle is a SNP and its location is represented on the chromosome. SNPs are color coded based on the phenotype colors as shown in the legend. SNPs are also
pruned to LD threshold of 0.4. Here MCH is Mean Corpuscular Hemoglobin; MCHC is MCH is Mean
Corpuscular Hemoglobin Concentration; AST is Aspartate Aminotransferase; RDW is Erythrocyte Distribution Width;
ALT is Alanine Aminotransferase.
Pacific Symposium on Biocomputing 2017
540

Our next approach was to integrate ICD-9 code data along with clinical lab variables to identify variants that we have found to be associated with median values of quantitative traits, and are also linked to diagnosis codes in the EHR. To perform this analysis, we wanted to utilize longitudinal data, rather than a measure from a single point in time. Hence, we divided patients into categories of high and low variance as described in Methods. Replication was observed based on the combination of SNP, clinical lab variable, ICD-9 code, and variance category (high or low). Replicated results are shown in form of a heat map in Figure 5. These heat maps show that in our study, the majority of our replicating associations occur in the low variance category. The primary reason for this is likely due to low sample size in the high variance groups gave us less statistical power to detect associations; although we would like to continue to explore this to determine whether there is a biological explanation for this. In total, this analysis resulted in 717 replicated associations. We observed 39 SNPs on chromosome 6 that map to multiple genes (C6orf10, FKBPL, BAT3, BAT2, EGFL2, RDBP, MSH5, TNXB, C6orf27, CSNK2B and BAT1) are associated with Type 1 Diabetes (ICD-9 code 250.01) when the samples with high variance glucose levels were evaluated. These associations were not seen in samples in the low variance glucose category. One of the most interesting associations identified is between four SNPs in the uromodulin (UMOD) gene and ICD-9 code 585.3 (Chronic kidney disease) in patients with low variance for aspartate aminotransferase (discovery p-value: 8.71x10⁻⁹ and replication p-value: 2.03x10⁻⁶). It has been observed by previous studies that patients with chronic kidney disease usually have low levels of aminotransferase in serum25. This association was not replicated in the high variance aspartate aminotransferase group. Association of variants in the UMOD gene with chronic kidney disease, kidney stones, and end
Figure 5. Heat map representing p-values (on left) and beta (on right) from variance based analysis for the combination of a SNP, ICD-9 code and clinical lab measurement in both high and low variance
categories. Each point is the replicating SNP with the color gradient showing the range of p-value and beta. The results are only shown for replicating results at p-value<0.001 for both discovery and
replication datasets in both high variance and low variance categories. X-axis lists all the ICD-9 codes and Y-axis lists the corresponding clinical lab variable for which replicating association is observed.
Pacific Symposium on Biocomputing 2017
541

stage renal diseases has been previously established26,27 but an association with aspartate aminotransferase levels has not been identified by previous studies. Next, to integrate both the GWAS results and variance-based grouping PheWAS results, we generated networks of all genome-wide significant results from GWAS analysis and replicated results from variance based PheWAS analysis using Cytoscape28 as shown in Figure 6. We explored the integrated results for SNP-Clinical lab variable- ICD-9 code in order to identify the three-way associations that are indicative of disease diagnosis. This figure shows the three top integrated networks from our analysis where both ICD-9 codes and clinical lab variables are linked via a SNP. One thing to note here is that all these networks resulted from the low variance groups only. From the network visualization, we determined three variants in gene TCF7L2 are associated with Type 2 Diabetes (T2D) and glucose levels. This association is expected because these variants have been reported by many previous studies to be associated with T2D21,29,30. Similarly, from this network analysis we also observed variants in the UMOD gene associated with chronic kidney disease and creatinine levels obtained from serum which has been previously reported by GWAS26,27,31. Lastly, a novel network obtained from this analysis is a link between rs3132941 (mapped to gene, EGFL8) with WBC count and Type I Diabetes. A high WBC has been observed in a few studies in T1D patients32,33. The EGFL8 gene maps near the MHC region (Major-histocompatibility complex) on chromosome 6 and thus its association with T1D can be easily
established34,35 but its association with WBC has not been found in any previous studies. Our study presents this novel result which warrants further investigation.
Figure 6. Network visualization generated by Cytoscape using replicated results from both GWAS and variance based analysis. Here, triangles represent ICD-9 code description, rectangles represent clinical lab variable, and ovals represent SNP. Darker edges represent more significant associations.
TCF7L2 gene network
EGFL8 gene network
UMOD gene network
Pacific Symposium on Biocomputing 2017
542

4. Discussion
Genome-wide association studies have been tremendously successful in unravelling the etiologies of common complex diseases and the use of EHR in conducting such genome-wide and phenome-wide studies has shown resounding progress. Many researchers are now working on approaches to incorporate longitudinal information from the EHR into these studies. As a proof of concept, in this study we aimed at advancing the use of longitudinal information from laboratory values by looking at the variance for each outpatient clinical lab value rather than just mean/median or most recent value. We first conducted a GWAS for 25 clinical lab median values and then, based on variance, we divided participants into high and low variance groups. Next, we conducted a PheWAS to identify which SNPs are associated with median clinical lab variable and ICD-9 codes. This study represents a proof-of concept approach for utilizing trait variance and the longitudinal data as we successfully identified and confirmed many previously known associations. We also described several novel associations observed from our study. Variance, rather than mean/median may better capture the richness of the longitudinal data. In this pilot analysis, we demonstrate that this approach can be used to identify networks which reveal trends of associations among SNPs, laboratory measurements, and diagnosis codes. In the future, we plan to replicate this analysis with a larger sample size and in an independent EHR system. We also plan to use variance as the outcome for an association study in all 50,000 patients from Geisinger MyCode dataset and replicate in an independent dataset. One limitation of our approach here is that the use of longitudinal data in the way shown in this study ignores the fact that in an EHR, the duration of longitudinal information varies from patient to patient. Future approaches should also focus on developing methods which adjust for the duration of longitudinal information. Developing approaches, such as the one described in this manuscript, to explore the longitudinal nature of EHR data will provide greater opportunities for discovery and understanding of the genetic and clinical architecture of common diseases.
5. References
1. Manolio, T. A. Biorepositories--at the bleeding edge. Int J Epidemiol 37, 231–233 (2008). 2. Moore, C. B. et al. Phenome-wide Association Study Relating Pretreatment Laboratory Parameters With Human
Genetic Variants in AIDS Clinical Trials Group Protocols. Open Forum Infectious Diseases 2, ofu113–ofu113 (2015).
3. Verma, A. et al. INTEGRATING CLINICAL LABORATORY MEASURES AND ICD-9 CODE DIAGNOSES IN PHENOME-WIDE ASSOCIATION STUDIES. Pac Symp Biocomput 21, 168–179 (2016).
4. Namjou, B. et al. Phenome-wide association study (PheWAS) in EMR-linked pediatric cohorts, genetically links PLCL1 to speech language development and IL5-IL13 to Eosinophilic Esophagitis. Front Genet 5, (2014).
5. Wei, W.-Q. & Denny, J. C. Extracting research-quality phenotypes from electronic health records to support precision medicine. Genome Med 7, (2015).
6. Kullo, I. J., Ding, K., Jouni, H., Smith, C. Y. & Chute, C. G. A Genome-Wide Association Study of Red Blood Cell Traits Using the Electronic Medical Record. PLoS One 5, (2010).
7. Namjou, B. et al. EMR-linked GWAS study: investigation of variation landscape of loci for body mass index in children. Front Genet 4, (2013).
8. Luan, J. ’an et al. A multilevel linear mixed model of the association between candidate genes and weight and body mass index using the Framingham longitudinal family data. BMC Proc 3 Suppl 7, S115 (2009).
9. Carey, D. J. et al. The Geisinger MyCode community health initiative: an electronic health record-linked biobank for precision medicine research. Genet Med (2016). doi:10.1038/gim.2015.187
Pacific Symposium on Biocomputing 2017
543
10. Grady, B. J. et al. Finding unique filter sets in PLATO: a precursor to efficient interaction analysis in GWAS data. Pac Symp Biocomput 315–326 (2010).
11. Lin, J.-P. et al. Association between the UGT1A1*28 allele, bilirubin levels, and coronary heart disease in the Framingham Heart Study. Circulation 114, 1476–1481 (2006).
12. de Azevedo, L. A. et al. UGT1A1, SLCO1B1, and SLCO1B3 polymorphisms vs. neonatal hyperbilirubinemia: is there an association? Pediatr Res 72, 169–173 (2012).
13. Kang, T.-W. et al. Genome-wide association of serum bilirubin levels in Korean population. Hum. Mol. Genet. 19, 3672–3678 (2010).
14. Johnson, A. D. et al. Genome-wide association meta-analysis for total serum bilirubin levels. Hum. Mol. Genet. 18, 2700–2710 (2009).
15. Chambers, J. C. et al. Genome-wide association study identifies variants in TMPRSS6 associated with hemoglobin levels. Nat Genet 41, 1170–1172 (2009).
16. van der Harst, P. et al. Seventy-five genetic loci influencing the human red blood cell. Nature 492, 369–375 (2012).
17. Benyamin, B. et al. Common variants in TMPRSS6 are associated with iron status and erythrocyte volume. Nat Genet 41, 1173–1175 (2009).
18. Li, J. et al. Genome-wide association study on serum alkaline phosphatase levels in a Chinese population. BMC Genomics 14, 684 (2013).
19. Bonny, O. & Bochud, M. Genetics of calcium homeostasis in humans: continuum between monogenic diseases and continuous phenotypes. Nephrol. Dial. Transplant. 29, iv55–iv62 (2014).
20. Kapur, K. et al. Genome-Wide Meta-Analysis for Serum Calcium Identifies Significantly Associated SNPs near the Calcium-Sensing Receptor ( CASR ) Gene. PLOS Genet 6, e1001035 (2010).
21. Billings, L. K. & Florez, J. C. The genetics of type 2 diabetes: what have we learned from GWAS? Ann N Y Acad Sci 1212, 59–77 (2010).
22. Wolfe, D., Dudek, S., Ritchie, M. D. & Pendergrass, S. A. Visualizing genomic information across chromosomes with PhenoGram. BioData Min 6, 18 (2013).
23. Yuan, X. et al. Population-based genome-wide association studies reveal six loci influencing plasma levels of liver enzymes. Am. J. Hum. Genet. 83, 520–528 (2008).
24. Qayyum, R. et al. A meta-analysis and genome-wide association study of platelet count and mean platelet volume in african americans. PLoS Genet. 8, e1002491 (2012).
25. Ray, L., Nanda, S. K., Chatterjee, A., Sarangi, R. & Ganguly, S. A comparative study of serum aminotransferases in chronic kidney disease with and without end-stage renal disease: Need for new reference ranges. Int J Appl Basic Med Res 5, 31–35 (2015).
26. Gudbjartsson, D. F. et al. Association of Variants at UMOD with Chronic Kidney Disease and Kidney Stones—Role of Age and Comorbid Diseases. PLOS Genet 6, e1001039 (2010).
27. Reznichenko, A. et al. UMOD as a susceptibility gene for end-stage renal disease. BMC Medical Genetics 13, 78 (2012).
28. Smoot, M. E., Ono, K., Ruscheinski, J., Wang, P.-L. & Ideker, T. Cytoscape 2.8: new features for data integration and network visualization. Bioinformatics 27, 431–432 (2011).
29. Wellcome Trust Case Control Consortium. Genome-wide association study of 14,000 cases of seven common diseases and 3,000 shared controls. Nature 447, 661–678 (2007).
30. Lyssenko, V. et al. Mechanisms by which common variants in the TCF7L2 gene increase risk of type 2 diabetes. J. Clin. Invest. 117, 2155–2163 (2007).
31. Pattaro, C. et al. A meta-analysis of genome-wide data from five European isolates reveals an association of COL22A1, SYT1, and GABRR2 with serum creatinine level. BMC Med. Genet. 11, 41 (2010).
32. Xu, W. et al. Correlation between Peripheral White Blood Cell Counts and Hyperglycemic Emergencies. Int J Med Sci 10, 758–765 (2013).
33. Twig, G. et al. White Blood Cells Count and Incidence of Type 2 Diabetes in Young Men. Diabetes Care 36, 276–282 (2013).
34. Nejentsev, S. et al. Localization of type 1 diabetes susceptibility to the MHC class I genes HLA-B and HLA-A. Nature 450, 887–892 (2007).
35. Abraham, R. S., Wen, L., Marietta, E. V. & David, C. S. Type 1 Diabetes-Predisposing MHC Alleles Influence the Selection of Glutamic Acid Decarboxylase (GAD) 65-Specific T Cells in a Transgenic Model. J Immunol 166, 1370–1379 (2001).
Pacific Symposium on Biocomputing 2017
544


![OPENING THE DOOR TO THE LARGE SCALE USE OF …psb.stanford.edu/psb-online/proceedings/psb17/bauer.pdf · 32623-1 Platelet mean volume [Entitic volume] in Blood by Automated count](https://img.dokumen.tips/doc/110x75/5c5c989809d3f2e04d8b86a7/opening-the-door-to-the-large-scale-use-of-psb-32623-1-platelet-mean-volume.jpg)