Embed Size (px)
Citation preview

CERNA SEARCH METHOD IDENTIFIED A MET-ACTIVATED SUBGROUP AMONG
EGFR DNA AMPLIFIED LUNG ADENOCARCINOMA PATIENTS
HALLA KABAT*
Outreach Program, miRcore, 2929 Plymouth Rd.
Ann Arbor , MI 48105, USA
Email: [email protected]
LEO TUNKLE*
Outreach Program, miRcore, 2929 Plymouth Rd.
Ann Arbor , MI 48105, USA
Email: [email protected]
INHAN LEE
miRcore, 2929 Plymouth Rd.
Ann Arbor, MI 48105, USA
Email: [email protected]
Given the diverse molecular pathways involved in tumorigenesis, identifying subgroups among cancer
patients is crucial in precision medicine. While most targeted therapies rely on DNA mutation status in
tumors, responses to such therapies vary due to the many molecular processes involved in propagating DNA
changes to proteins (which constitute the usual drug targets). Though RNA expressions have been
extensively used to categorize tumors, identifying clinically important subgroups remains challenging given
the difficulty of discerning subgroups within all possible RNA-RNA networks. It is thus essential to
incorporate multiple types of data. Recently, RNA was found to regulate other RNA through a common
microRNA (miR). These regulating and regulated RNAs are referred to as competing endogenous RNAs
(ceRNAs). However, global correlations between mRNA and miR expressions across all samples have not
reliably yielded ceRNAs. In this study, we developed a ceRNA-based method to identify subgroups of cancer
patients combining DNA copy number variation, mRNA expression, and microRNA (miR) expression data
with biological knowledge. Clinical data is used to validate identified subgroups and ceRNAs. Since ceRNAs
are causal, ceRNA-based subgroups may present clinical relevance. Using lung adenocarcinoma data from
The Cancer Genome Atlas (TCGA) as an example, we focused on EGFR amplification status, since a
targeted therapy for EGFR exists. We hypothesized that global correlations between mRNA and miR
expressions across all patients would not reveal important subgroups and that clustering of potential ceRNAs
might define molecular pathway-relevant subgroups. Using experimentally validated miR-target pairs, we
identified EGFR and MET as potential ceRNAs for miR-133b in lung adenocarcinoma. The EGFR-MET up
and miR-133b down subgroup showed a higher death rate than the EGFR-MET down and miR-133b up
subgroup. Although transactivation between MET and EGFR has been identified previously, our result is the
first to propose ceRNA as one of its underlying mechanisms. Furthermore, since MET amplification was
seen in the case of resistance to EGFR-targeted therapy, the EGFR-MET up and miR-133b down subgroup
may fall into the drug non-response group and thus preclude EGFR target therapy.
* These authors contributed equally to this work.
Pacific Symposium on Biocomputing 2017
438
1. Introduction
Lung cancer accounts for more deaths than any other cancers, with a 5-year survival rate of 10%
[1]. Several gene mutations have been shown to play a role in lung adenocarcinoma (LUAD),
including KRAS and EGFR [2]. Multiple drugs have been developed to target EGFR proteins and
are actively used for those with EGFR mutation cancers. However, some patients do not respond
to the targeted therapy and many initially responded patients develop resistance to such drugs.
Since diverse molecular pathways are associated with any mutated genes, additional information
other than DNA mutation is needed to properly identify which subgroup will benefit from the
targeted therapy.
Though mRNA expression data have been used to categorize tumors, correlations across
mRNA expression data alone are often difficult to decipher within high dimensional data.
Moreover, the most correlated genes or samples often do not provide clinically useful insight. To
increase the signals, other types of data such as DNA methylation, microRNA (miR) expression,
proteomics, and metabolic data have been incorporated with mRNA expression. In terms of RNA
levels, mRNA and miR expression correlations have been heavily mined. However, the lack of
known miR targets and excessive false positive target predictions hinder the computational search
for significant miR-target gene networks. Worse, since miR effects on most target genes are small
in degree, in vitro experimental confirmation is difficult, although the effects may contribute to
long term clinical outcomes. Usual mRNA-miR expression analyses calculate correlations among
RNAs for all samples.
Studies have recently demonstrated that RNAs can compete with one another for the same
regulating miRNAs [3]. One of the earliest of these studies, focused on expression of PTEN,
hypothesized that expression levels of “competing endogenous” RNAs (ceRNAs) affected PTEN
expression. When siRNAs were used to deplete these RNAs, PTEN expression levels also
decreased. Decreased ceRNA levels resulted in fewer miRNAs (which target both the ceRNA and
PTEN) being “used-up” in regulation. This frees more of these miRNAs to target PTEN, thereby
decreasing its expression. Overall, a decrease in expression of a ceRNA results in a corresponding
decrease in PTEN. The same study also demonstrated that an increase in expression of a ceRNA
corresponded with an increase in PTEN. This is likely applicable not just to PTEN but to other
genes, such as a gene and a similar pseudogene or two genes regulated by the same miRNA. Note
that ceRNA by definition entails causality whereas usual mRNA-miR expression results are
correlative. RNA expression changes cause other RNA expression changes through miR
manipulation.
This RNA-RNA regulation inspired two lines of investigation: biochemical inquiry to identify
individual ceRNA pairs [4-6] and bioinformatics research to identify global RNA-RNA networks
using RNA expression data along with miR-target predictions [7,8]. Ideal conditions for miRs and
ceRNAs have also been explored [9,10]. However, global ceRNA networks are difficult to discern
due to imprecise miR target prediction and because, again, the miR effect on one target gene is
usually small. Such small degree changes are difficult to identify from multi-layer RNA-RNA
regulations of diverse samples though ceRNAs have been associated with diseases and have the
potential to uncover disease progression [11].
Pacific Symposium on Biocomputing 2017
439

The Cancer Genome Atlas (TCGA) [12] provides a large amount of various types of data from
multiple cancers, enabling new ways of data analysis. For example, LUAD data include the
mRNA and miRNA (miR) expressions of 551 patients that could provide insight into multiple
biological processes within tumors. This large mass of patient data allows for identification of
subgroups based upon very specific traits.
In this study, the concept of ceRNAs was utilized to identify a subgroup related to DNA
mutations. We focused on patients with amplified EGFR to identify those who could benefit from
EGFR targeted therapy, analyzing multiple datasets including copy number variation (CNV),
RNAseq, and miRNAseq from TCGA in order to find the EGFR amplification signature. RNA
and miR interactions were then identified using a database of experimentally validated miR-target
genes from miRTarBase [13]. Our findings suggest that miR-133b, which targets EGFR, is
downregulated due to high mRNA expression for EGFR caused by its DNA amplification, which
in turn leads to the upregulation of MET, another gene targeted by miR-133b. In short, EGFR
amplification is linked to MET mRNA upregulation through miR-133b, which targets both EGFR
and MET in a manner reminiscent of the ceRNA interactions mentioned above. To our knowledge,
our research is the first to identify disease subgroups based upon ceRNA interactions, an approach
with potential application to other gene mutations or in other types of cancers.
2. Methods
Most research into downstream effects of DNA mutations has focused on protein functions. Here
we propose using the ceRNA concept to analyze downstream events of DNA mutation to
complement conventional protein-centric biology and to identify RNA-RNA networks (Fig. 1).
Fig. 1. Underlying biological concepts in mRNA expressions related to DNA mutations. (A) Protein-centric
concept. A DNA mutation leads to protein expression changes, resulting in other mRNA changes through
signaling pathways. These downstream mRNAs are RNAs of interest. (B) ceRNA concept. If DNA mutation leads
to ceRNA upregulation, the “used-up” miRs would fail to regulate the ceRNA pair and thus increase mRNA
expression. Similarly, if ceRNA is downregulated, the pairing ceRNA would be downregulated. miR expression
data and miR target information are needed to elucidate this process.
Pacific Symposium on Biocomputing 2017
440
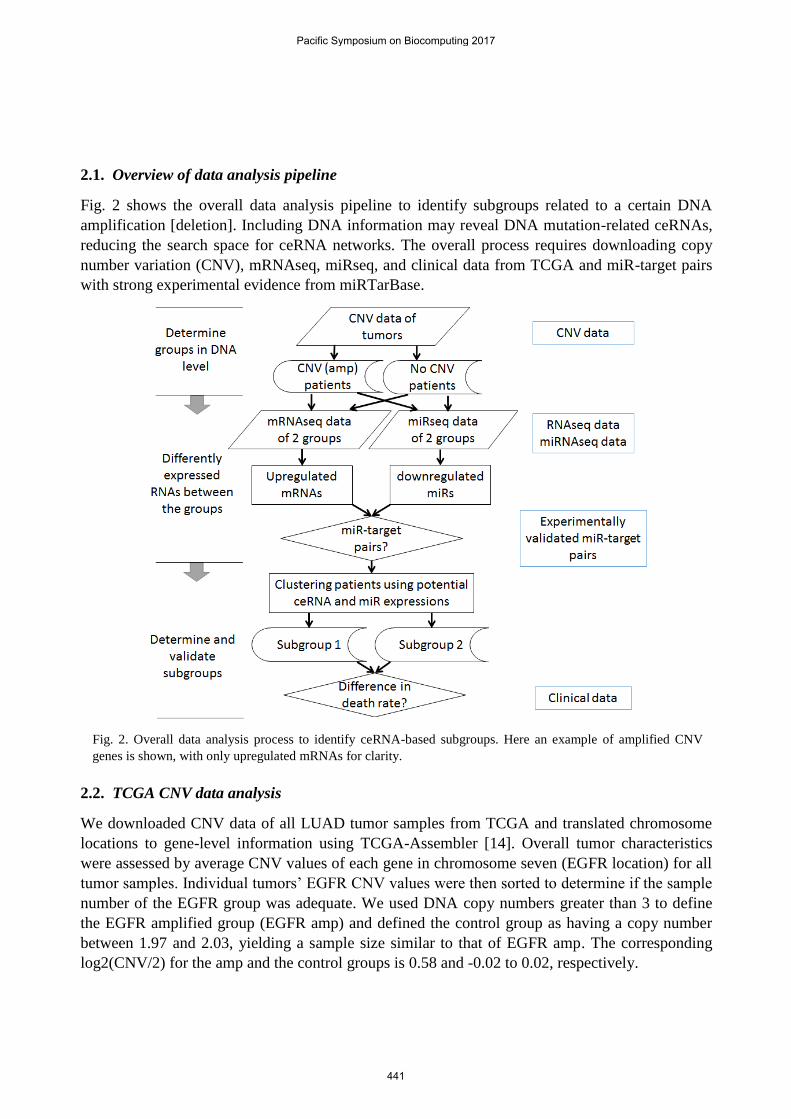
2.1. Overview of data analysis pipeline
Fig. 2 shows the overall data analysis pipeline to identify subgroups related to a certain DNA
amplification [deletion]. Including DNA information may reveal DNA mutation-related ceRNAs,
reducing the search space for ceRNA networks. The overall process requires downloading copy
number variation (CNV), mRNAseq, miRseq, and clinical data from TCGA and miR-target pairs
with strong experimental evidence from miRTarBase.
Fig. 2. Overall data analysis process to identify ceRNA-based subgroups. Here an example of amplified CNV
genes is shown, with only upregulated mRNAs for clarity.
2.2. TCGA CNV data analysis
We downloaded CNV data of all LUAD tumor samples from TCGA and translated chromosome
locations to gene-level information using TCGA-Assembler [14]. Overall tumor characteristics
were assessed by average CNV values of each gene in chromosome seven (EGFR location) for all
tumor samples. Individual tumors’ EGFR CNV values were then sorted to determine if the sample
number of the EGFR group was adequate. We used DNA copy numbers greater than 3 to define
the EGFR amplified group (EGFR amp) and defined the control group as having a copy number
between 1.97 and 2.03, yielding a sample size similar to that of EGFR amp. The corresponding
log2(CNV/2) for the amp and the control groups is 0.58 and -0.02 to 0.02, respectively.
Pacific Symposium on Biocomputing 2017
441
2.3. TCGA mRNA and miRNA expression data analysis
To analyze mRNA expression data, rsem.genes.normalized_results files for RNASeqV2 data of all
samples were downloaded using TCGA-Assembler. Data for the EGFR amp and control groups
were then extracted. Some patients did not have available rsem-normalized RNAseq data or
miRseq data, and were removed from any further analysis. After confirmation of normalization
across samples, a student t-test was conducted to compare the amp and the control group data.
To analyze miR expressions, isoform.quantification files for miRNAseq data were
downloaded from the TCGA Data Matrix and converted to mature miR values. These individual
files were then combined to make a matrix file for all patients. The R code for this function can be
found in GitHub (https://github.com/rptashkin/TCGA_miRNASeq_matrix). Upper quartile
normalization was applied for student t-test analysis between the amp and control groups, upon
which the miRNAs with p-values < 0.05 were separated into up- and downregulated groups.
2.4. Validated miR target finding
To see if the miRNAs and genes had potential interactions, data from miRTarBase, a database of
miRNA-target interactions, were used. The upregulated genes and downregulated miRNAs were
compared to the miR-target pairs with strong experimental evidence to search for any pairs.
2.5. Subgroup determination and validation
A heatmap of potential ceRNAs and miRNAs of interest was used to determine the subgroups
formed. The patients were clustered using Pearson correlation, and subgroups were determined
based on the clustering trees where the mRNA and miRNA expressions of all patients within the
trees exhibit negative correlations between miR-targets and positive correlations between
ceRNAs. A survival graph was prepared using R and the death rate differences between the groups
were tested using student t-test.
3. Results
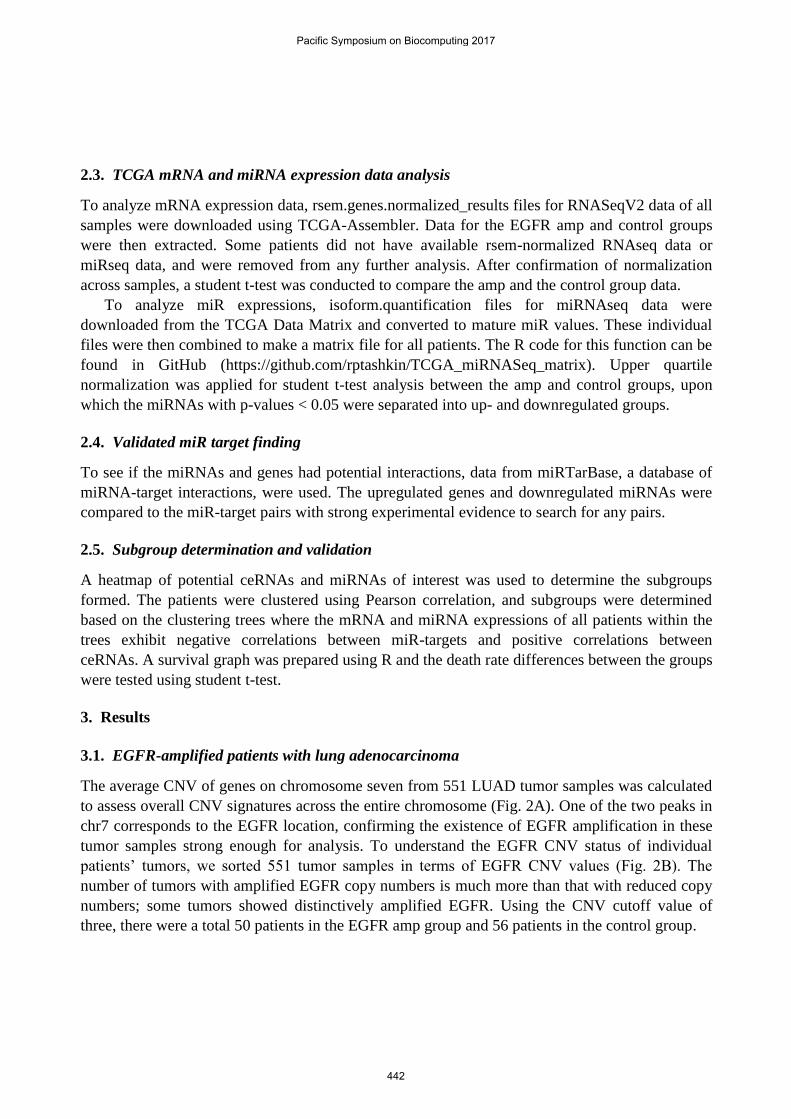
3.1. EGFR-amplified patients with lung adenocarcinoma
The average CNV of genes on chromosome seven from 551 LUAD tumor samples was calculated
to assess overall CNV signatures across the entire chromosome (Fig. 2A). One of the two peaks in
chr7 corresponds to the EGFR location, confirming the existence of EGFR amplification in these
tumor samples strong enough for analysis. To understand the EGFR CNV status of individual
patients’ tumors, we sorted 551 tumor samples in terms of EGFR CNV values (Fig. 2B). The
number of tumors with amplified EGFR copy numbers is much more than that with reduced copy
numbers; some tumors showed distinctively amplified EGFR. Using the CNV cutoff value of
three, there were a total 50 patients in the EGFR amp group and 56 patients in the control group.
Pacific Symposium on Biocomputing 2017
442
Fig. 3. CNV data for LUAD patients. (A) Average log2(CNV) values of genes on chromosome 7 for all patients,
ordered by chromosome position. (B) EGFR values for the 551 tumor samples.
3.2. RNA and miRNA expression analysis
After we downloaded the rsem-normalized data from TCGA, we confirmed the normalization
status using box plots. Using the patient lists in the EGFR amp and control groups identified from
CNV data, mRNA expression data were extracted and organized for each group. We used
isoform.quantification data to obtain mature miR reads for miR expression data analysis. The
isoform data were translated to mature miR names and all reads corresponding to the same mature
miRs were combined. All EGFR amp and control group patient miR data were merged into a
matrix file. Upper quartile normalization was used for miR data and box plots of data before and
after normalization were compared to ensure the normalization status. We used only those samples
having both mRNA and miR data for further analysis, leaving 42 amp and 35 control patients.
Student t-test was used to identify differently-expressed genes between the two groups of
patient samples since the sample number is large. A heatmap of mRNAs with student t-test p-
value < 0.0001 (for visual purpose) is shown in Fig. 4A and that of miRs with p-value < 0.05 in
Fig. 4B, together with the EGFR amp and control ID labels on top of each heatmap. The
unsupervised hierarchical clustering of mRNA expressions identified two large groups: one mostly
control and the other mostly amp group. Additionally, the amp group displays a greater number of
upregulated genes than does the control group. The mRNA expression of EGFR (p-value of 1.62 x
10-6), is excluded in this heatmap. The miR clustering also identified two large groups: one with
all amp and the other generally with control samples.
Pacific Symposium on Biocomputing 2017
443

Fig. 4. Hierarchical clustering of mRNA (A) and miRNA expression (B). ID above the heatmap represents the
amp group in red and the control in blue. The patient IDs for each group can be found below the heatmap.
3.3. Identifying miR-target RNA pairs
We used all mRNAs and miRs with p-values less than 0.05 to find experimentally validated miR-
target pairs, since such pairs are still highly limited. To ensure miR-target pair validity, we only
used pairs found through strong experimental evidence from miRTarBase. Strong evidence
includes validating with a reporter assay, a western blot analysis, or qPCR experiments. Also,
Pacific Symposium on Biocomputing 2017
444

since we are looking into direct downstream events of EGFR amplification, only upregulated
mRNAs and downregulated miRs in EGFR amp groups were considered.
Fig. 5. Validated miRNA-RNA target pairs. The validated target pairs from upregulated mRNAs and
downregulated miRNAs with p < 0.05.
A total 19 miR-target pairs were identified in the up-mRNAs and down-miR groups, including
4 miRNAs and 19 genes (Fig. 5). One of these pairs included EGFR, a known target of miR-133b.
Interestingly, previous studies found miR-133 mediating ceRNAs of mRNA pairs, making miR-
133b a good candidate mediator for ceRNAs. Eight other miR-133b targets were found in the
upregulated mRNAs, with p < 0.05, some possibly functioning as ceRNAs for EGFR through
miR-133b in certain patient tumors.
Among them, we decided to focus on MET, given its well-established EGFR and MET
crosstalk [15,16], particularly related to drug resistance [17]. The fold changes of EGFR, MET,
and miR-133b between EGFR amp and control groups are 6.68, 1.79, and 0.318, respectively; and
corresponding p-values for MET and miR-133b are 0.0065 and 0.00085. To exclude other ways of
increasing MET mRNA expressions in our dataset, we confirmed that 1) MET copy numbers did
not vary in the EGFR amp groups; 2) the expression values of ETS1/2, PAX3, and TCF4, known
transcription factors of MET [18], are not upregulated; and 3) ERBB3, known to activate MET
[19], is not activated in the EGFR amp groups.
3.4. Subgroup identification
To identify patients with potential EGFR-miR-133b-MET interactions, unsupervised hierarchical
clustering with only miR-133b, EGFR, and MET were calculated using Pearson correlation
distance (Fig. 6A). With a tree cutting of four groups, a subgroup featuring high EGFR-MET and
low miR-133g (24 patients) and another subgroup with low EGFR-MET and high miR-133b (24
patients) were identified (boxed in Fig. 6A). Overall Pearson correlation coefficients between
Pacific Symposium on Biocomputing 2017
445

EGFR and MET, EGFR and miR-133b, and MET and miR-133b for all 77 patients are 0.082, -
0.030, and 0.082, respectively, unlikely to be identified by global RNA-RNA network analysis of
all patients. The correlation coefficients across these 48 patients became 0.22, -0.24, and -0.23,
respectively.
To validate these two subgroups, we downloaded patient clinical data from TCGA. As seen in
the survival curve (Fig. 6B), these two groups presented different survival rates (student t-test p-
value 0.016). Given the known EGFR-MET transactivation, we wondered if subgrouping may also
emerge using EGFR and MET expressions alone. We could not see a clear pattern in the clustered
heatmap using Pearson correlation distance method, but two clusters showed up using the
Euclidean method. The p-value of survival rate differences between these groups was 0.15.
Therefore, subgroups identified from EGFR-miR-133b-MET expression data presented stronger
clinical implications.
Fig. 6. Subgroup selection and survival curve. (A) Clustered heatmap of EGFR, MET, and miR-133b. The two
boxes show the subgroups made through clustering. These subgroups have high miR-133b, low EGFR, and low
MET or low miR-133b, high EGFR, and high MET. (B) Survival curves for the subgroups.
Pacific Symposium on Biocomputing 2017
446
4. Discussion
EGFR is one of the more common mutations in lung adenocarcinoma and there exist targeted
therapy options for those with this mutation. These currently include drugs such as gefitinib and
erlotinib [20]. Though these therapies work well for many patients initially, most patients
encounter drug resistance. Of the tumors that develop resistance to these drugs, around 20% have
MET amplification [21].
MET, like EGFR, is a growth factor receptor that leads to several signaling cascades including
those within the RAS-ERK pathway, which is often targeted by cancer drugs. When functioning
normally, MET is essential to such processes as angiogenesis, wound healing, and liver
regeneration [22].
Since there is a correlation between MET amplification and drug resistance to an EGFR-
targeted therapy, studies have focused on transactivation of EGFR and MET [16-18] though their
mechanism has not been cleared elucidated. On the other hand, searching for ceRNA pairs as
signature components of DNA level changes, we identified MET as a potential ceRNA for EGFR,
suggesting ceRNA as one such mechanism. For a certain subgroup of patients, EGFR and MET
were upregulated while their shared regulating miRNA was downregulated. This would fit well
with the ceRNA concept, leading to the hypothesis that EGFR CNV amplification “uses up” the
regulatory miR-133b, which is then less likely to regulate MET so that EGFR indirectly
upregulates MET. Since MET upregulation may be due to MET amplification, we also checked
MET CNV values for both the amp and control groups. We found no MET amplification in these
groups, confirming that the MET RNA upregulation was not due to DNA amplification.
While we have not biochemically confirmed MET and EGFR to be ceRNAs, EGFR-miR-
133b-MET expression clustering could provide subgroups with significantly different survival
rates. Since such survival rate difference was not found in groups considering only EGFR-MET
expressions, identifying patients with ceRNA function was essential. On the other hand, an EGFR-
MET ceRNA pair could have not been found without considering subgroups. Using our method of
utilizing multiple-level data consisting of DNA copy number, mRNA expression, and miR
expression together with biological information, we may find more clinically relevant potential
ceRNA pairs as well as subgroups worthy of pursuit.
Our method can be automated by changing tree distance cutoff values (Pearson correlation
distance) in identifying other ceRNAs and related subgroups, which can be validated with survival
rates. However, overfitting using survival rate should not be done. Since we started from EGFR
CNV-amplified patients, we hypothesized EGFR as the causal mRNA, fit well with ceRNA
concept. This kind of biological knowledge is essential to our method.
Acknowledgments
We thank Ryan Ptashkin for the R script to generate a mature miRNA expression matrix file from
individual isoform miRNAseq data; Axel Martin for the R script to make mRNA and miRNA
matrix files in the same patient order; and Cristina Castillo and Andre Zapico for help in R. This
Pacific Symposium on Biocomputing 2017
447

project was extended from a 2015 computational biology summer camp for high school students
supported by the University of Michigan WISE (Women in Science and Engineering).
References
1. Survival statistics for lung cancer | Cancer Research (2016) UK.Cancerresearchuk.org.
2. OMIM Entry Search - lung adenocarcinoma. (2016). Omim.org.
3. Cancer Genome Atlas Network. Nature 490, 61–70 (2012).
4. L. Poliseno, et al. Nature 465, 1033–1038 (2010).
5. M. S. Kumar, et al. Nature 505, 212-217 (2013).
6. Y. Tay, et al. Cell 147, 344–357 (2011).
7. F. A. Karreth, et al. Cell 147, 382–395 (2011).
8. P. Sumazin, et al. Cell 147, 370–381 (2011).
9. Y. C. Chiu, T. H. Hsiao, Y. Chen, E. Y. Chuang. BMC Genomics 16 Suppl 4, S1 (2015).
10. L. M. Wee, C. F. Flores-Jasso, W. E. Salomon, P. D. Zamore. Cell 151, 1055–1067 (2012).
11. Y. Yuan, et al. Proc. Natl. Acad. Sci. U.S.A. 112, 3158-3163 (2015).
12. Y. Tay, J. Rinn, P. P. Pandolfi. Nature 505, 344-352 (2014).
13. C. Chou, et al. Nucleic Acids Res, 44 (D1), D239-D247 (2015).
14. Y. Zhu, P. Qiu , Y. Ji. Nature Methods 11, 599–600 (2014).
15. A. Guo, et al. Proc. Natl. Acad. Sci. U.S.A. 105, 692-697 (2008).
16. N. Puri, R. Salgia. J Carcinog. 7, 9 (2008).
17. M. Acunzo, et al. Proc Natl Acad Sci U.S.A. 110, 8573-8578 (2013).
18. S. L. Organ, M. S. Tsao. Ther Adv Med Oncol. 3, S7-S19 (2011).
19. J. A. Engelman, et al. Science 316, 1039-1043 (2007).
20. https://clinicaltrials.gov/ct2/show/NCT01024413 (2016).
21. K. Nguyen, S. Kobayashi, D. Costa. Clinical Lung Cancer, 10, 281-289 (2009).
22. http://www.genecards.org/cgi-bin/carddisp.pl?gene=MET (2016).
Pacific Symposium on Biocomputing 2017
448


![OPENING THE DOOR TO THE LARGE SCALE USE OF …psb.stanford.edu/psb-online/proceedings/psb17/bauer.pdf · 32623-1 Platelet mean volume [Entitic volume] in Blood by Automated count](https://img.dokumen.tips/doc/110x75/5c5c989809d3f2e04d8b86a7/opening-the-door-to-the-large-scale-use-of-psb-32623-1-platelet-mean-volume.jpg)