Embed Size (px)
Citation preview
1©2014 MSCI Inc. All rights reserved. msci.commsci.com
Identifying Environmental & Social Risks in Supply Chains
Olga Emelianova, Senior Analyst, MSCI ESG Research
Top Commodities in Focus
Jaclyn Daitchman, Analyst, MSCI ESG Research
RIA Conference
May 27, 2014

2©2014 MSCI Inc. All rights reserved. msci.com
Agenda
About MSCI ESG Research
Identifying Environmental & Social Risks in Supply Chains
Olga Emelianova, Senior Analyst, MSCI ESG Research
Top Commodities in Focus
Jaclyn Daitchman, Analyst, MSCI ESG Research
Q&A
Please visit the MSCI ESG Research booth to find out more and pick up our reports!

3©2014 MSCI Inc. All rights reserved. msci.com
MSCI ESG Research Today
Over 70 asset owners with $2.3 trillion in assets
Over 650 clients with $15 trillion in assets globally
ESG ratings and research produced 100% in-house
Staff of 160+ in ESG, including 90+ in research
Over 40 years in ESG industry (IRRC, KLD, Innovest)
Signatory to the Principles for Responsible Investment
Global ESG Research Capabilities
Boston
New York
Toronto
San Francisco
Cape Town
Tokyo
Beijing
Sydney
MumbaiManila
London
Paris
Geneva
Monterrey
RockvilleAnn Arbor
Frankfurt

4©2014 MSCI Inc. All rights reserved. msci.com 4msci.com
Identifying Environmental & Social Risks in Supply Chains
Olga Emelianova
5©2014 MSCI Inc. All rights reserved. msci.com
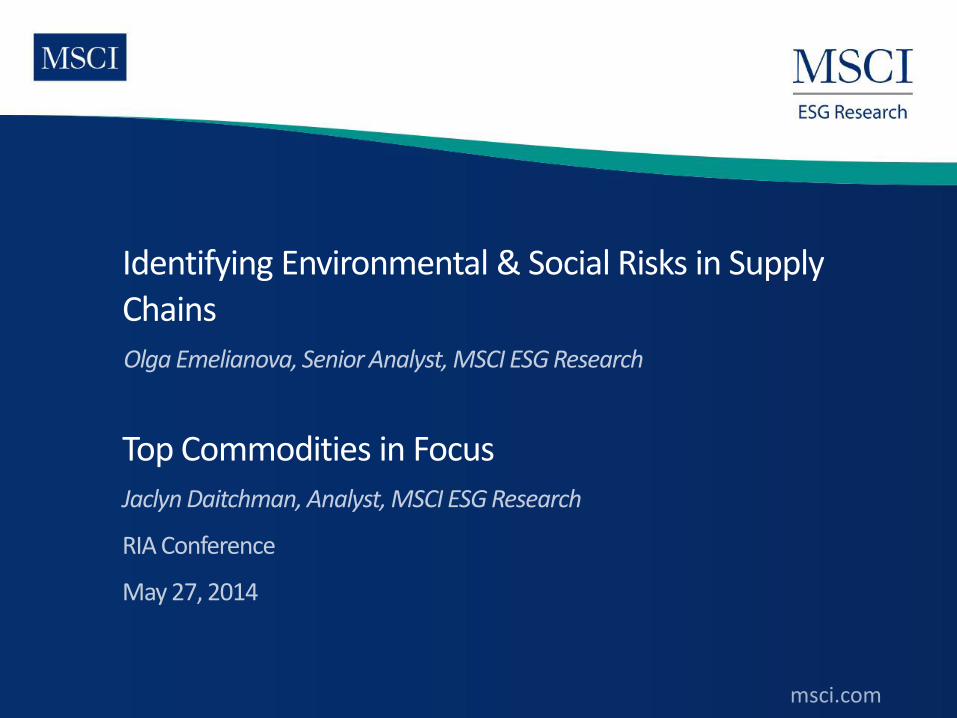
Supply Chain – Impact and Risk
6©2014 MSCI Inc. All rights reserved. msci.com
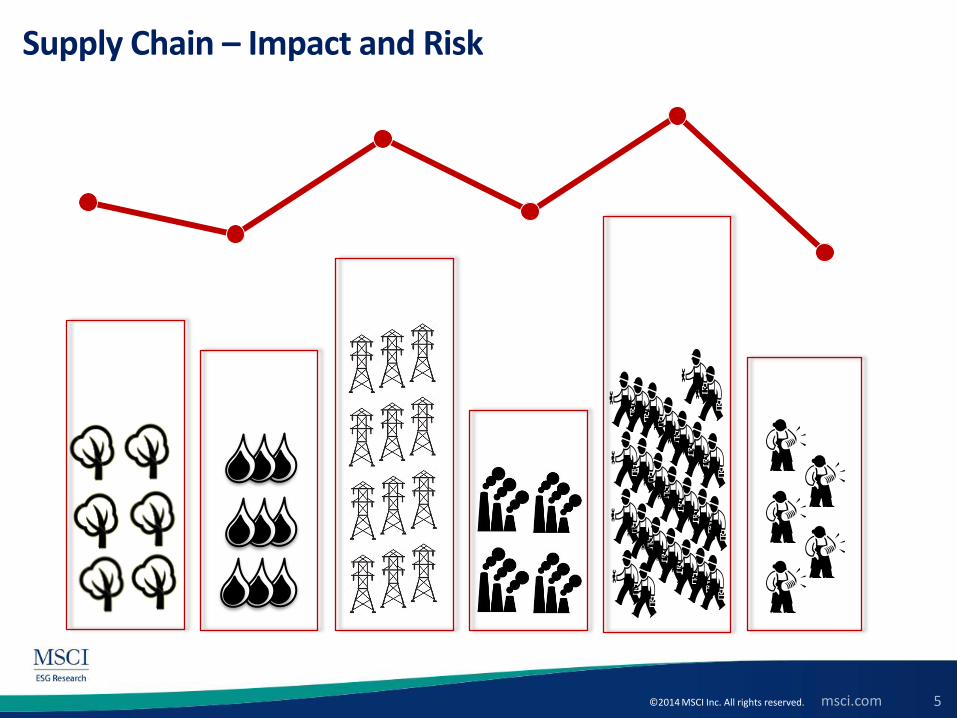
Let’s take a quiz!
Labor : what industry is most likely to take the largest labor cost?
Apparel
Food Products
Electronics
Health & Safety: what country poses the highest ESG risk for Apparel industry?
Vietnam
Cambodia
Mexico
Energy: what industry would be most affected by energy price increase?
Food Products
Electronics
Apparel

7©2014 MSCI Inc. All rights reserved. msci.com
Labor Cost Health & Safety Energy Cost
$0.00
$0.50
$1.00
$1.50
$2.00
$2.50
$3.00
2002 2003 2004 2005 2006 2007 2008 2009 2010 2011
China Vietnam Indonesia India
The wage gap between China and Vietnam has been widening since 2007
China continues to be the global manufacturing hub
The country has experienced the steepest wage increase over the last decade
Source: ILO Global Wage database, General Statistics Office of Vietnam, U.S. Bureau of Labor Statistics

8©2014 MSCI Inc. All rights reserved. msci.com
Labor Cost Health & Safety Energy Cost
Electronics are likely to be most affected
Cost of Goods Sold
Production in China 30% 50% 70% 100%
Wage Increase
10% 0.6% 1.0% 1.4% 2.0%
20% 1.2% 2.0% 2.8% 4.0%
30% 1.8% 3.0% 4.2% 6.0%
60% 3.6% 6.0% 8.4% 12.0%
Low scalability production
Dependence on local raw materials (rare earth)
Thin and shrinking profit margins
Samsung and Apple are a notable exception
Source: Thomson One Banker, company disclosure, MSCI ESG Research
Source: Thomson One Banker, company disclosure, MSCI ESG Research

9©2014 MSCI Inc. All rights reserved. msci.com 9
Labor Cost Health & Safety Energy Cost
Apparel & Textiles: Bangladesh is not the only country at risk
CountryTextile exports, USD bln
Industrial employment
Monthly wage, USD
Injury rate,per 100,000 employees
Bangladesh 16.4 15.0% 881 366
Cambodia 4.6 16.9% 80 202
El Salvador 2.2 21.5% 1862 36073
India 12.9 22.4% 1022 325
Pakistan 12.5 20.0% 92 207
Vietnam 16.0 21.3% 722 46273
Notes:1 Bangladesh monthly wage shown with a 30% increase adjustment announced in 20132 Average monthly wage for country, due to regional or sector variations.3 Injury rates include public sector and family businesses.
Sources: International Labour Organization, the United Nations Statistics Division, The World Bank, Ministry of Labour and Vocational Training of Cambodia, Bangladesh Bureau of Statistics, Pakistan Bureau of Statistics, General Statistics Office ofVietnam

10©2014 MSCI Inc. All rights reserved. msci.com 10
Labor Cost Health & Safety Energy Cost• The largest portion of product carbon footprint is attributed to energy and fuel use in
raw materials production and finished goods manufacturing
Source: IERS' Comprehensive Environmental Data Archive (CEDA) data, MSCI ESG Research
Raw Materials TransportationManufacturing Trade and Administration
Cheese Pasta, cookies Footwear2528 CO2e/USD 1 mln 1058 CO2e/USD 1 mln 846 CO2e/USD 1 mln
Soap Apparel Computers
810 CO2e/USD 1 mln 566 CO2e/USD 1 mln 284 CO2e/USD 1 mln

11©2014 MSCI Inc. All rights reserved. msci.com 11
Labor Cost Health & Safety Energy CostApparel and Footwear will likely be most affected by energy price increase
0% 10% 20% 30% 40% 50% 60% 70% 80% 90%
Diversified Discretionary Goods
Footwear
Apparel
Luxury
Food Products & Food Retail
Household Products
Trade and warehousing Transportation
Components and goods manufacturing Raw materials production
Cost Increase as a % of Revenue
Cost Increase as a % of Net Profit
Food Retail 0.64% 20.08%
Electronics 0.46% 14.77%
Food Products 0.59% 7.48%
Apparel 0.46% 7.06%
Footwear 0.47% 6.92%
Luxury Goods 0.35% 2.57%
Harder to push on consumers due to discretionary nature and competition based on price
Source: MSCI ESG Research, Thomson Financials, IERS' Comprehensive Environmental Data Archive (CEDA) data, company disclosure
Percent of companies monitoring energy use and emissions in supply chain:
If energy price globally goes 10% up…
Have the lowest control over the supply chain

12©2014 MSCI Inc. All rights reserved. msci.com
Let’s take a quiz!
Labor : what industry is most likely to take the largest labor cost?
Apparel
Food Products
Electronics
Health & Safety: what country poses the highest ESG risk for Apparel industry?
Vietnam
Cambodia
Mexico
Energy: what industry would be most affected by energy price increase?
Food Products
Electronics
Apparel

13©2014 MSCI Inc. All rights reserved. msci.com
Reputational Concerns Intensify
Workplace Safety and Raw Materials Production are high on public agenda
Number of Reported Controversies by Type
Source: MSCI Impact Monitor

14©2014 MSCI Inc. All rights reserved. msci.com 14msci.com
Top Commodities in Focus
Jaclyn Daitchman

15©2014 MSCI Inc. All rights reserved. msci.com 15msci.com
Soy
PalmOil
Cocoa
Photo source: MIXA, via WebMD

16©2014 MSCI Inc. All rights reserved. msci.com 16msci.com
Stearic Acid Sodium Lauryl Sulfate Glyceryl Stearate
Cetyl palmitate Octyl palmitate
Palmitoyl Tetrapeptide-3

17©2014 MSCI Inc. All rights reserved. msci.com 17msci.com
Source: MSCI ESG Research
Palm Oil Dependency
Revenue from products that may contain palm oil
Revenue from all other products
84%
Household & Personal Products
36%
Food & Beverage
30%
Restaurants
9%
Retailing
18©2014 MSCI Inc. All rights reserved. msci.com
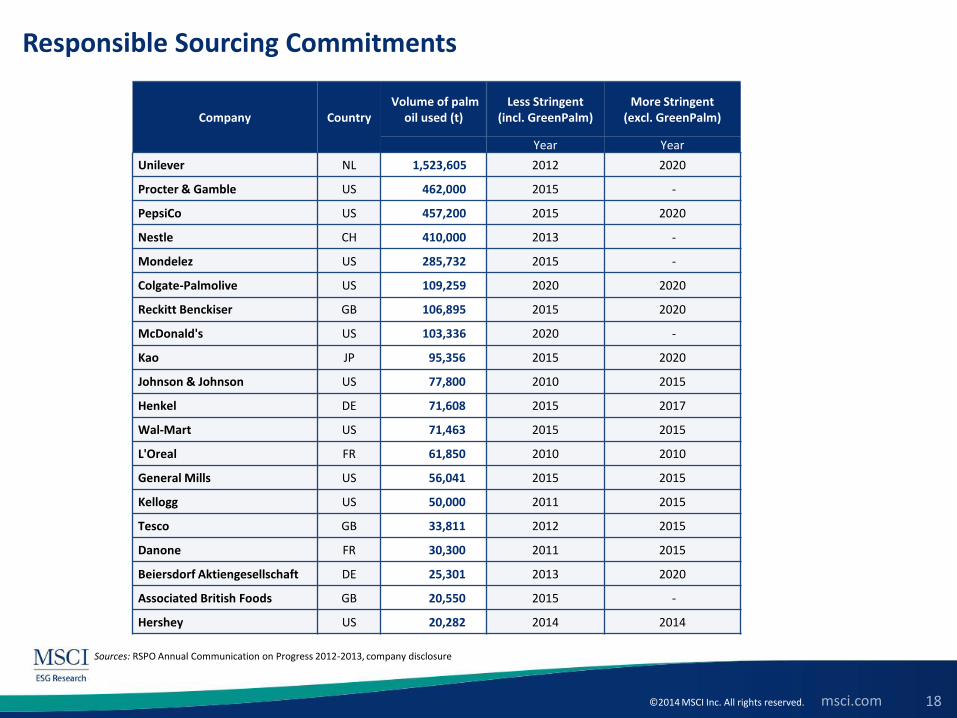
Sources: RSPO Annual Communication on Progress 2012-2013, company disclosure
Responsible Sourcing Commitments
Company CountryVolume of palm
oil used (t) Less Stringent
(incl. GreenPalm)More Stringent
(excl. GreenPalm)
Year Year
Unilever NL 1,523,605 2012 2020
Procter & Gamble US 462,000 2015 -
PepsiCo US 457,200 2015 2020
Nestle CH 410,000 2013 -
Mondelez US 285,732 2015 -
Colgate-Palmolive US 109,259 2020 2020
Reckitt Benckiser GB 106,895 2015 2020
McDonald's US 103,336 2020 -
Kao JP 95,356 2015 2020
Johnson & Johnson US 77,800 2010 2015
Henkel DE 71,608 2015 2017
Wal-Mart US 71,463 2015 2015
L'Oreal FR 61,850 2010 2010
General Mills US 56,041 2015 2015
Kellogg US 50,000 2011 2015
Tesco GB 33,811 2012 2015
Danone FR 30,300 2011 2015
Beiersdorf Aktiengesellschaft DE 25,301 2013 2020
Associated British Foods GB 20,550 2015 -
Hershey US 20,282 2014 2014

19©2014 MSCI Inc. All rights reserved. msci.com
Responsible Sourcing Progress
Unilever NL 1,523,605
Procter & Gamble US 462,000
PepsiCo US 457,200
Nestle CH 410,000
Mondelez US 285,732
Colgate-Palmolive US 109,259
Reckitt Benckiser GB 106,895
McDonald's US 103,336
Kao JP 95,356
Johnson & Johnson US 77,800
Henkel DE 71,608
Wal-Mart US 71,463
L'Oreal FR 61,850
General Mills US 56,041
Kellogg US 50,000
Tesco GB 33,811
Danone FR 30,300
Beiersdorf Aktiengesellschaft DE 25,301
Associated British Foods GB 20,550
Hershey US 20,282
Company CountryVolume of palm oil used (t)
0 100000 200000 300000 400000 5000001,470,000
Sources: RSPO Annual Communication on Progress 2012-2013, company disclosure
No certification Mass BalanceBook & Claim (Green Palm) Segregated or Identity Preserved

20©2014 MSCI Inc. All rights reserved. msci.com
53%38%
9%
47%
27%
17%
9%
Less stringent committment: More Stringent
SELECTED COMPANY HIGHLIGHTS
No time-bound commitment Campbell, Clorox, Costco, Yum!
Brands
McDonald's, Mondelez,
Nestle, Procter & Gamble
Unlikely to achieve certifcation
by target year
On track to achieve certification
by target year
Colgate-Palmolive, McDonald's,
PepsiCo, Procter & Gamble, Wal-
Mart
Johnson & Johnson,
PepsiCo, Unilever
Heinz, Kellogg, Metro,
Sainsbury
-
Heinz, Nestle, Metro, Sainsbury
Have already achieved
certification
Johnson & Johnson, Kellogg, L'Oreal,
Marks & Spencer, Tesco, Unilever
Less Stringent Commitment (incl. GreenPalm) by 2015
More Stringent Commitment (excl. GreenPalm) by 2020
Source: RSPO Annual Communication on Progress 2012-2013, WWF “Palm Oil Buyers Scorecard” (2013), company disclosure , MSCI ESG Research
Responsible Sourcing Progress

21©2014 MSCI Inc. All rights reserved. msci.com
Perceived constraints to meeting commitments
Many companies claim that their limited use of certified product is triggered by the lack of availability of certified sustainably produced palm oil and high premiums charged for certified palm oil.
83%
8%
3%
2%
4%
non-certified
certified, but not purchased
purchased by Unilever
purchased by the next 9 top buyers
purchased by rest of the world
Cost, USD % of
Revenue Cost, USD
% of
Revenue
Unilever (NL) 9,141,630 0.014% 309,291,815 0.457%
Procter & Gamble (US) 2,772,000 0.003% 93,786,000 0.118%
PepsiCo (US) 2,743,200 0.004% 92,811,600 0.140%
Nestle (CH) 2,460,000 0.003% 83,230,000 0.086%
Mondelez (US) 1,714,392 0.005% 58,003,596 0.161%
Colgate-Palmolive (US) 655,554 0.004% 22,179,577 0.135%
Reckitt Benckiser (GB) 641,370 0.004% 21,699,685 0.150%
McDonald's (US) 620,016 0.002% 20,977,208 0.076%
Kao (JP) 572,136 0.004% 19,357,268 0.139%
Johnson & Johnson (US) 466,800 0.001% 15,793,400 0.023%
Scenario 1
Less Stringent
(GreenPalm)
Scenario 2
More Stringent
(Segregated)
Supply exceeds demand Compliance cost is low
Source: RSPO Annual Communication on Progress 2012-2013, company disclosure , MSCI ESG Research

22©2014 MSCI Inc. All rights reserved. msci.com
0.00%
0.08%
0.16%
0.24%
0.32%
0.40%
0.48%
-
25,000
50,000
75,000
100,000
125,000
150,000
Un
ileve
r (N
L)
Mo
nd
ele
z (U
S)
Re
chit
t B
en
ckis
er (
GB
)
Pe
psi
Co
(U
S)
Kao
(JP
)
Co
lgat
e-P
alm
oliv
e (
US)
Pro
cte
r &
Gam
ble
(U
S)
Ge
ne
ral M
ills
(US)
Ne
stle
(C
H)
Co
nA
gra
* (U
S)
McD
on
ald
's (
US)
Yu
m!
Bra
nd
s (U
S)
He
nke
l (D
E)
Ke
llogg
(U
S)
Gru
po
Bim
bo
(M
X)
Be
iers
do
rf (
DE)
Ori
flam
e (
BE)
He
rsh
ey
(US)
L'O
real
(FR
)
Ork
la**
(N
O)
Tin
gyi (
CN
)
Avo
n (
US)
Dan
on
e (
FR)
AB
F (G
B)
Joh
nso
n &
Jo
hn
son
(U
S)
Shis
eid
o (
JP)
Ke
rry
(IE)
Este
e L
aud
er
(US)
Lin
dt
& S
pru
en
gli (
CH
)
Cam
pb
el (
US)
He
inz
(US)
Dar
de
n (
US)
L B
ran
ds
(US)
Sain
sbu
ry (
GB
)
Tesc
o (
GB
)
Du
nki
n B
ran
ds
(US)
Nis
sin
Fo
od
s (J
P)
WM
Mo
rris
on
(G
B)
MEI
JI (
JP)
Ah
old
(N
L)
Aji
no
mo
to (
JP)
Mar
ks &
Sp
ence
r (G
B)
Wh
itb
read
(G
B)
Wal
-Mar
t (U
S)
Ae
on
(JP
)
Sod
exo
(FR
)
Seve
n &
i (J
P)
Wo
olw
ort
hs
(AU
)
We
sfar
me
rs (
AU
)
Nat
ura
Co
sme
tico
s (B
R)
Co
mp
ass
(GB
)
Mas
smar
t (Z
A)
BR
F (B
R)
He
rbal
ife
(KY
)
Wh
ole
Wo
od
s (U
S)
Ch
urc
h &
Dw
igh
t (U
S)
Sho
pri
te (
ZA)
Car
refo
ur
(FR
)
Ke
sko
(FI
)
Clo
rox
(US)
Cas
ino
(FR
)
Cen
cosu
d (
CL)
Met
ro (
DE)
Lob
law
(C
A)
Ge
org
e W
est
on
(C
A)
Safe
way
(U
S)
Kro
ger
(US)
Sup
erv
alu
(U
S)
Co
stco
(U
S)
Targ
et
(US)
Companies that purchase certified palm oil
Cost to revenue (most stringent certification)
422,600
Companies that do not purchase certified palm oil
Cost to revenue, %
Source: RSPO Annual Communication on Progress, company disclosure, media reports, MSCI ESG Research
Brand Visibility vs. Compliance Costs

23©2014 MSCI Inc. All rights reserved. msci.com
1 21
1013
18
14
5
55
0
10
20
30
40
50
60
2005 2006 2007 2008 2009 2010 2011 2012 2013
Total Controversies and Proxies Filed on Palm Oil Issues: 2005-2013
Trends
Source: CERES

24©2014 MSCI Inc. All rights reserved. msci.com
Regulatory costs
-2%
0%
2%
4%
6%
8%
10%
12%
0
2,000
4,000
6,000
8,000
10,000
12,000
14,000
16,000
18,000
20,000
Ind
on
esia
Mal
aysi
a
Thai
lan
d
Co
lom
bia
Nig
eria
Pap
ua
New
Gu
inea
Ecu
ado
r
Ho
nd
ura
s
Ivo
ry C
oas
t
Bra
zil
Co
sta
Ric
a
Cam
ero
on
Gu
atem
ala
DR
C
Gh
ana
Ph
ilip
pin
es
Mex
ico
An
gola
Do
min
ican
Rep
ub
lic
Gu
inea
Ind
ia
Ben
in
Ven
ezu
ela
Per
u
Lib
eria
Res
t o
f th
e w
orl
dA
nn
ual
Pro
du
ctio
n G
row
th (
%)
Pro
du
ctio
n (
'00
0 M
T)
Source: United States Department of Agriculture (2013 preliminary estimate)
Trends
Production in Latin America and Africa
25©2014 MSCI Inc. All rights reserved. msci.com 25msci.com
Thank you

26©2014 MSCI Inc. All rights reserved. msci.com 26msci.com
MSCI ESG Global Client Service
Americas + 1.212.804.5299
Asia Pacific + 612.9033.9339
Europe, Middle East and Africa + 44.207.618.2510
www.msci.com/esg

27©2014 MSCI Inc. All rights reserved. msci.com 27msci.com
Notice and Disclaimer This document and all of the information contained in it, including without limitation all text, data, graphs, charts (collectively, the “Information”) is the property of MSCI Inc. or its subsidiaries (collectively, “MSCI”), or MSCI’s
licensors, direct or indirect suppliers or any third party involved in making or compiling any Information (collectively, with MSCI, the “Information Providers”) and is provided for informational purposes only. The Information may not be modified, reverse-engineered, reproduced or redisseminated in whole or in part without prior written permission from MSCI.
The Information may not be used to create derivative works or to verify or correct other data or information. For example (but without limitation), the Information may not be used to create indexes, databases, risk models, analytics, software, or in connection with the issuing, offering, sponsoring, managing or marketing of any securities, portfolios, financial products or other investment vehicles utilizing or based on, linked to, tracking or otherwise derived from the Information or any other MSCI data, information, products or services.
The user of the Information assumes the entire risk of any use it may make or permit to be made of the Information. NONE OF THE INFORMATION PROVIDERS MAKES ANY EXPRESS OR IMPLIED WARRANTIES OR REPRESENTATIONS WITH RESPECT TO THE INFORMATION (OR THE RESULTS TO BE OBTAINED BY THE USE THEREOF), AND TO THE MAXIMUM EXTENT PERMITTED BY APPLICABLE LAW, EACH INFORMATION PROVIDER EXPRESSLY DISCLAIMS ALL IMPLIED WARRANTIES (INCLUDING, WITHOUT LIMITATION, ANY IMPLIED WARRANTIES OF ORIGINALITY, ACCURACY, TIMELINESS, NON-INFRINGEMENT, COMPLETENESS, MERCHANTABILITY AND FITNESS FOR A PARTICULAR PURPOSE) WITH RESPECT TO ANY OF THE INFORMATION.
Without limiting any of the foregoing and to the maximum extent permitted by applicable law, in no event shall any Information Provider have any liability regarding any of the Information for any direct, indirect, special, punitive, consequential (including lost profits) or any other damages even if notified of the possibility of such damages. The foregoing shall not exclude or limit any liability that may not by applicable law be excluded or limited, including without limitation (as applicable), any liability for death or personal injury to the extent that such injury results from the negligence or willful default of itself, its servants, agents or sub-contractors.
Information containing any historical information, data or analysis should not be taken as an indication or guarantee of any future performance, analysis, forecast or prediction. Past performance does not guarantee future results.
The Information should not be relied on and is not a substitute for the skill, judgment and experience of the user, its management, employees, advisors and/or clients when making investment and other business decisions. All Information is impersonal and not tailored to the needs of any person, entity or group of persons.
None of the Information constitutes an offer to sell (or a solicitation of an offer to buy), any security, financial product or other investment vehicle or any trading strategy.
It is not possible to invest directly in an index. Exposure to an asset class or trading strategy or other category represented by an index is only available through third party investable instruments (if any) based on that index. MSCI does not issue, sponsor, endorse, market, offer, review or otherwise express any opinion regarding any fund, ETF, derivative or other security, investment, financial product or trading strategy that is based on, linked to or seeks to provide an investment return related to the performance of any MSCI index (collectively, “Index Linked Investments”). MSCI makes no assurance that any Index Linked Investments will accurately track index performance or provide positive investment returns. MSCI Inc. is not an investment adviser or fiduciary and MSCI makes no representation regarding the advisability of investing in any Index Linked Investments.
Index returns do not represent the results of actual trading of investible assets/securities. MSCI maintains and calculates indices, but does not manage actual assets. Index returns do not reflect payment of any sales charges or fees an investor may pay to purchase the securities underlying the index or Index Linked Investments. The imposition of these fees and charges would cause the performance of an Index Linked Investment to be different than the MSCI index performance.
The Information may contain back tested data. Back-tested performance is not actual performance, but is hypothetical. There are frequently material differences between back tested performance results and actual results subsequently achieved by any investment strategy.
Constituents of MSCI equity indexes are listed companies, which are included in or excluded from the indexes according to the application of the relevant index methodologies. Accordingly, constituents in MSCI equity indexes may include MSCI Inc., clients of MSCI or suppliers to MSCI. Inclusion of a security within an MSCI index is not a recommendation by MSCI to buy, sell, or hold such security, nor is it considered to be investment advice.
Data and information produced by various affiliates of MSCI Inc., including MSCI ESG Research Inc. and Barra LLC, may be used in calculating certain MSCI equity indexes. More information can be found in the relevant standard equity index methodologies on www.msci.com.
MSCI receives compensation in connection with licensing its indices to third parties. MSCI Inc.’s revenue includes fees based on assets in investment products linked to MSCI equity indexes. Information can be found in MSCI’s company filings on the Investor Relations section of www.msci.com.
MSCI ESG Research Inc. is a Registered Investment Adviser under the Investment Advisers Act of 1940 and a subsidiary of MSCI Inc. Except with respect to any applicable products or services from MSCI ESG Research, neither MSCI nor any of its products or services recommends, endorses, approves or otherwise expresses any opinion regarding any issuer, securities, financial products or instruments or trading strategies and neither MSCI nor any of its products or services is intended to constitute investment advice or a recommendation to make (or refrain from making) any kind of investment decision and may not be relied on as such. Issuers mentioned or included in any MSCI ESG Research materials may include MSCI Inc., clients of MSCI or suppliers to MSCI, and may also purchase research or other products or services from MSCI ESG Research. MSCI ESG Research materials, including materials utilized in any MSCI ESG Indexes or other products, have not been submitted to, nor received approval from, the United States Securities and Exchange Commission or any other regulatory body.
Any use of or access to products, services or information of MSCI requires a license from MSCI. MSCI, Barra, RiskMetrics, IPD, FEA, InvestorForce, and other MSCI brands and product names are the trademarks, service marks, or registered trademarks of MSCI or its subsidiaries in the United States and other jurisdictions. The Global Industry Classification Standard (GICS) was developed by and is the exclusive property of MSCI and Standard & Poor’s. “Global Industry Classification Standard (GICS)” is a service mark of MSCI and Standard & Poor’s.
© 2014 MSCI Inc. All rights reserved. May 2014