Embed Size (px)
Citation preview

41
CHAPTER 3
Identifying and Estimating Risks
3.1 THE SELECTION OF TECHNIQUES
The estimation of risk is concerned with collection information on:
(1) The nature and extent of the source;(2) The chain of events, pathways and processes that connect the cause to
the effects; and(3) The relationship between the characteristics of the impact (dose) and the
types of response (effects).
Although response and effects are often equated or used synonymously, theWorld Health Organization makes a distinction between the two (WHO,1972). An effect is a 'biological reaction itself, while a response refers to therelative number of exposed people who react with a specific effect' (Friberg,1976). This concept is illustrated in Figure 3.1. According to some scientists,
Adversehealtheffects
1PHYSIOLOGICAL AND OTHER CHANGES
OF U'jCERTAIN SIGNIFICANCE
BODY BURDENS OF POLLUTANT
WHO 20254
-Proportion of populationaffected .Based on a diagram in United States Congress Document No.92 241,1972
Source;Munn, Phillips and Sanderson, 1977
Figure 3.1 Schematic representation of the WHO concepts of effectand response (WHO, 1972)

-. H_. -.
42
the WHO distinction is useful and should be extended to other kinds of
receptors such as vegetation (Munn, Phillips and Sanderson, 1977).In practice, risk assessment often begins by looking at one part of the
problem, usually the source or the effect, rather than considering the system asa whole at the outset. This is a pragmatic response to the different ways inwhich risks are discovered. Some risks are identified initially as a known orsuspected (such as a carcinogen) source, and the problem is to discover whereand how the effects are distributed. Other risks emerge because their effectsbecome apparent (such as a localized high incidence of a disease) and thepriority risk assessment task is to determine the cause or source of theproblem.
Once a risk is suspected, it is important to bring together as much availableinformation as is possible before designing the ways in which additional dataare to be collected. The estimation of risk is an expensive process and initialerrors in the design of monitoring or screening programmes are costly inmoney, delays and inadequate information.
Some of the initial questions that should be asked before any assessmentmethods are selected are:
(1) Is the problem an analysis starting from a suspected (or known) cause oreffect?
(2) How is the problem distributed geographically? (highly localized,regional, national, associated with urban areas, in lowlands, etc?)
(3) How much time available is there to assess the risk? (fast or slow causes,acute or chronic effects?)
(4) Where do the effects lie? (within which demographic populations orwhich parts of the environment?)
(5) Is the target (receptor) normal or particularly susceptible? (healthyadults or sensitive groups; unstressed ecosystem or already highlypolluted?)
(6) Are the effects reversible or irreversible?
By specifying the problems in terms of questions like these, the decisionmaker can arrive at some understanding of the magnitude of the task, where tostart, and how much time is available. His answers will help him to select theappropriate monitoring or testing techniques as well as provide him with arudimentary model of what is going on.
It is important also to be able to specify whether the risks arise principallyout of a technological system; or through environmental processes, or throughhuman biology and behaviour. This is because the appropriate measurementtechniques differ according to where in the sequence of cause and effect youwish to measure. Many risks, of course, involve technical processes andhuman behaviour as well as environmental processes.
For example, lead pollution from an industrial lead smelter may be causedinitially from poor system design and equipment malfunction and heretechniques appropriate to technical systems would be appropriate (e.g. faulttree analysis, components testing). Once the lead leaves the chimney stack, it is

43
subject to environmental processes of transportation and diffusion throughthe air, settling to the ground, being taken up by plants and animals andmovement through the soil and water. Quite different models andmeasurement techniques from those applicable within the smelter, would beused. How much of the lead concentrated in vegetables or drinking watereventually reaches individual people depends on another set of human biologyand behavioural variables, such as how much contaminated food theyconsume. Thus models and techniques to measure human behaviour arerelevant at this point in the sequence.
The selection of techniques thus requires initial decisions to be made about:
(1) The main methods - monitoring, testing, and modelling.(2) The focus of concern - technical, environmental, or human behaviour
subsystems.
Table 3.1 Examples of modelling, monitoring and testing techniques for estimatingenvironmental risks
Approaches
Modelling
Technical
Fuel cyclesEvent tree analysisFault tree analysis
Monitoring System reliabilityPollutant emissionsComponent qualityDesign quality
and
Surveillance
Screening Materials testingProduct qualityDestructive tests for
failureand
Testing
Environmental Risk System
Environment
Ecosystems modelsPhysical transport
modelsFood chain modelsTectonic modelsHydrologic andatmosphericmodels
Weather watchSeismic movementsAir qualityForest and crop
surveys
Screening tests forpersistencetransformationtoxicity
Recovery rates
Human Biologyand Behaviour
Genetic modelsDemographic modelsMetabolic pathwaysEpidemiological
modelsBehavioural models
Mortality statisticsNotifiable diseasesClinical recordsDrug use reportingEpidemiological
surveys
Mutagenicity (Amestest)
Acute toxicityLDso screening testResponse mechan
ismsPhysical check-ups
Table 3.1 gives examples of available techniques according to the mainapproaches and subsystems. The main approaches discussed here areenvironmental monitoring and health surveillance, testing and screening, andmodelling.

44
3.2 ENVIRONMENTAL MONITORING AND HEALTHSURVEILLANCE
Environmental monitoring is defined as 'the process of repetitive observing,for defined purposes, of one or more elements or indicators of theenvironment according to prearranged schedules in space and time, and usingcomparable methodologies for environmental sensing and data collection'(Munn, 1973).
Environmental monitoring is undertaken to determine space and timepatterns of environmental elements or indicators, and to estimate theirvariabilities, for the purpose of:
(1) Understanding environmental processes:(2) Providing early warnings of environmental threats (natural as well as
man-induced);(3) Assisting in the optimization of the use of renewable and non-
renewable resources;(4) Assisting in the regulatory process, providing data that may be used in
the courts or elsewhere to demonstrate cases of non-compliance withenvironmental standards.
In the case of (2) above, the early warnings may be given by simpleextrapolations of upward trends, or preferably from predictions obtainedfrom models that have been already validated with independent sets of data.
Within individual countries, there are many kinds of monitoringprogrammes which are often uncoordinated with each other and with similarprogrammes in adjacent countries. In particular, the instrument and samplingtechniques may be so disparate the inter-comparisons may be impossible. Yetfor environmental risk assessment, the need for reliable data is essential.
There are several multi-national monitoring systems that have beenestablished for particular reasons. Examples include the OECD and EEC long-range transport of air pollution programmes and the Lake Erie InternationalField Year on the Great Lakes. In most cases, these monitoring systems havebeen established to determine the existence and/or extent of an environmentalproblem that has been perceived in general terms only.
Some components of the national and regional programmes, are connectedglobally through the United Nations Environment Programme in the GlobalEnvironmental Monitoring System (GEMS). This is a coordinated programmefor gathering data to be used in environmental management (including earlywarning systems) rather than for enforcement of existing environmentalstandards. The data will also be valuable in some cases in the development oflegislation or international conventions leading to the establishment ofenvironmental controls.
Monitoring and sampling programmes are also used to detect the presenceof harmful substances. For example, the discovery of small quantities ofcarcinogens in the drinking water of several cities in the United States wasmade during a routine sampling programme to determine water quality.

45
Research into the source of these contaminants has led to a re-evaluation ofcurrent drinking water disinfection practices in the United States, as the sourceof these contaminants appears to be a by-product of the disinfection practices.
Monitoring of administrative programmes such as the required registrationof chemicals, drugs, pesticides and industrial undertakings can also beimportant. For example, the information submitted to obtain a permit or toregister a toxic material can help identify the nature and amount of specificpollutants entering the environment.
Health surveillance is the collation and interpretation of data collected frommonitoring programmes and from any other available sources, with a view todet,ecting changes in the health status of populations (WHO, 1972).Internationally, health surveillance has been most successful in recording theprincipal causes of death and notifiable diseases such as malaria or smallpox.There is a need however to maintain surveillance programmes that will alertgovernments and scientists to environmental hazards when symptoms firstappear rather than when the patients have died.
One important use of surveillance is for the effects of drugs. In the UK asystem of reporting about drug use and effects from doctors to a centralagency is a principal means of monitoring and evaluating drugs. The incidenceof cancer, and accidents (home, industrial and transportation) are alsoregularly monitored in many countries.
Monitoring human populations for genetic mutations is of concern in someindustrial countries where the chemical environment is rapidly changing andbecoming more complex with increasing exposure to chemical mutagens. Thecounting of spontaneous abortions has been recommended as a simple andpractical method for monitoring mutation rates. The spontaneous incidence ofabortions is about 1 per cent of all births.
For all these health surveillance programmes, the lack of baseline data onregional and national incidences of health effects, the need for skilledmanpower, effective reporting systems and centralized data bank facilities,makes progress slow in all countries. Where detailed health data are alreadycentralized, for example, for financial purposes in national health schemes,they can also be used to help establish the effects of the environment on health.
3.3 TESTING AND SCREENING
If based on accepted, standardized procedures, testing can identify sourcesof risk (such as defective products or dangerous chemicals) or harmful effects(such as acute toxicity and mutagenicity). Tests can also help to quantifyenvironmental processes such as the persistence of harmful substances in theenvironment. Testing is often a carefully controlled laboratory procedure. Theadvantage of field or in-situ testing is that it provides more realistic conditions.
Screening usually involves multiple tests or multiple candidates forevaluation which are 'sifted' by the test procedures into different categories. Innumerous instances, tests are carried out for product or drug or food-additive

46
safety. This is often done with animal test populations, and from this,inference is made of the degree of risk to human populations. In the UnitedStates, for example, the Food and Drug Administration screens some 110petitions for new food additives annually, and the Environmental ProtectionAgency has been charged under the recent Toxic Substances Control Act(1976) with the formidable task of screening the 30,000 chemical substancesnow in substantial use and the several hundred new ones being added eachyear.
It is, in fact, impossible to keep pace with all the products or chemicalsubstances that need to be screened and tested. The United States has fallenbehind in this operation and many other countries are even further behind.The cost of tests is another consideration to be added to those of the time theytake and the skilled manpower and equipment needed. For example, it wasestimated that the basic tests for registering a pesticide in the USA in 1970 cost
Sub system
Table 3.2 Basic Tests Required for Pesticides Registration in the USA (from Blodgett,1974.
Tests
I. Chemical and physical properties(Such as solubility, vaporpressure, flash point)
Degradation studiesPersistence (soil)Persistence (water)and sediment)Photochemical
Mobility studiesRunoffLeaching
Dateestablished
1947
1965
19701970
1970
1970
197019701970
1972
1970
Cost(estimated
dollars)
5,000-15,000
0s::O.- 0",0~Os::-II)~E s::
.~ ~;:I ~O'~II) II)
"".aII)II)
1(j ~-5c<!""
0-0
11)"3~ 0c<! ~E ..- ;>,0
ij~g..s::'':::ooos::'";:III)No""~",,'0 -0
s::s::~C<!
Timeimplication
6-24 monthsLess than I
year2-6 months
Less than 6months
Less than 3months
2-6 months2-6 months2-6 months
6-9 months
Less than 3months
2.
3.
4. Residue studiesFishBirdsMammalsLower trophic levels of foodchains
Microbiological studies
It should be noted that much of the data generated by these tests is utilized in studies ofhuman, fish, and wildlife safety.
5.

--uU --n -
47
between $100,000 and $250,000 and required 1-2 years (Table 3.2). Inaddition, tests to measure the tolerances of other plants and animals to pesti-cides cost between $5,000 and $160,000 per test and take between two and 28months to complete (Table 3.3).
These high cost and time demands of tests have encouraged the developmentof more rapid and less expensive tests. For example, the current approach intesting effluent is to break-down the effluent into its chemical components andscreen each for toxicity, persistence and breakdown or transformationproperties. This bank of tests is necessary because it is not sufficient to knowjust the chemical properties at the point of discharge. Certain chemicals willbreakdown or transform after they leave the point of discharge into substanceswhich may be more or less harmful than the original chemical. For example,the pesticide myrex, when transmitted through a water environment will breakdown into kepone, a highly toxic and persistent substance. Thus tests must berun to determine if particular contaminants will break down and if so, intowhat. Tests must also be run to see if the substance is likely to be captured insediments and there build-up, or bioaccumulate in various animal and plantforms.
Table 3.3 Tests for Tolerance of Pesticides in USA (from Blodgett, 1974. Reproducedby permission of the MIT Press)
Cost TimeDate (estimated implication
Tests established dollars) (months)
1. ToxicologyAcute (rat and non-rodent) 1954 5,000 1Subacute (rat and dog) 1954 50,000 6Chronic, 2 year (rat and dog) 1954 160,000 28
2. Reproduction (rat) 1960 35,000 20
3. Teratogenesis 1970 10,000 2
4. Mutagenesis 1972 10,000 2
5. MetabolismPlant 1954 50,000 6Animal Before 1960 25,000 3
6. AnalyticalMethodology 1954 100,000 4-6Crops, Meat, Milk, Poultry,Eggs 1965
(Poultry)
7. Field Residue Data 100,000 12Drop, Feed, Meat,Milk, Poultry, 100,000 6Eggs Before 1960
1965(Poultry)

48
The ability to test for the various parameters is uneven. The chemical!physical parameters can be measured rather well. Measuring the biologicalparameters is much more difficult. Fairly good progress has been made indeveloping tests for fresh water, and a beginning has been made in the marinearea. However, considerable research remains to be done in the developing ofsuitable biological screening techniques.
In order to streamline the process, rapid screening tests are being developedto screen out those components most likely to be a problem. Those chemicalsidentified as bad actors as a result of the rapid screening tests, are then putthrough more detailed tests to develop more refined data on impact levels.These and related procedures are more fully discussed in another SCOPEreport (Butler, 1978).
Continuing on the current chemical specific basis, however, is extremelycumbersome because of the sheer number of substances to be considered.Thus, research is also being conducted to see if techniques can be developed toevaluate the effluent as a totality, to make the problem more manageable whilestill maintaining reasonable safety factors. To make this approach feasible asimilar bank of tests for toxicity, transformation and persistence would haveto be developed to handle the total effluent. This will reduce the regulationtask considerably if effluent does not have to be broken down into itscomponents to show that it is harmful.
3.4 MODELLING
All the risks that are of concern in this report arise as part of a process. Tounderstand the risk and to manage it effectively models of the total process aredeveloped. Such models have, or should have, both environmental and socialcomponents, because the degree of risk depends both upon what happens inthe environment and what social processes are at work.
Highly successful models have been developed for some environmentalprocesses, especially in such areas as meteorology (atmospheric diffusionmodels), hydrology (run-off and flood forecasting models), and plant growth(biomass production models). Capability to model the social systems and howthey interact with environment is much less well developed. Thus the moreimportant the social component or human behavioural component becomes inan environmental risk, the less likely we are to be able to model the totalprocess satisfactorily.
Models are developed in every branch of science that bears uponenvironmental risk questions. The many possible models may be grouped,however, into those that are primarily technological in orientation, those thatare primarily concerned to describe environmental processes and those that areconcerned with human systems whether social, biological, behavioural and soon.
The focus in this report is on the environmental models, but theenvironmental models are often connected at one point or more to

Ea
Reduced Tree
E,
P02
J>B
Note. Since the probability of failure, P, is generally less than 0.1, the probabilityof IUcoeSS (I.P) is always close to 1. Thus. the probability a<5OCiatedwith theupper (success) branches in the tree is assumed to be I.
Figure 3.2 Simplified EventTreesfor a LargeLOCA
49
PA
PA x PEl
PAX Po I
PA x Po, x PE2
PAX PCI
PAx Pc, x PE3
PAx PCI x P02
PAx Pc, x P02 x PE4
PAX PB
PAx PB x PEs
PAx PB x P03
PAx PB x P03 x PE6
PAx PB x PC2
PAx PB x PC2 x PE7
PAx Pa x PC2 x P04
PAx PB x PC2 x P04 X PEa
PA
PA x PEl
PA x POI
PA x POI x PE2
PA x Pc,
PAx PCI x P02
PAx PB
Source: US AEC, p.89 (Reproduced by permission of the U.S. Atomic EnergyCommission.)
A
I
B
I
C
I
°
I
E
Pipe EleetricECCS
Fission ContainmentBreak Power Product Integrity
Removal
BasicTree IFails
PEl
Fails I
PO, IS.'rr_rlc PE2
II
PE3PC,
I
Initiating Event P02 I
PA PE4
II
PES
I
P03 IFails PE6PB
II
PE7PC2
- I

50
technological and social models. It is important therefore to recognize some ofthe characteristics of the different kinds.
3.4.1 Technological Models
In the case of technological models all the links and pathways of the processare known in principle because the whole process has been designed by thehuman brain, but the probabilities of different failures, particularly thoseinvolving a series of malfunctions, are unknown.
A method of estimating the probability of failure in large technologicalsystems is event tree analysis. A simplified event tree for a large LOCA (loss ofcoolant accident) at a nuclear generating station is shown in Figure 3.2. Aninitiating event is postulated - in this case a pipe break in the primary systemof the reactor. The tree is then developed by determining, from an intimateworking knowledge of the reactor, what other systems might affect thesubsequent course of events. In the example given, the main questions beingasked are
'Will the station's own supply of electric power fail?''Will the ECCS (emergency core cooling system) fail?''Will fission product removal fail?' and'Will containment integrity fail?'
The systems are ordered in the time sequence in which they are expected toaffect the course of events. For the initiating event a probability of itsoccurrence is estimated. How often can such pipe breaks be expected to occur?This is obtained by experience in the use of pipes in non-nuclear systems. Foreach of the succeeding events the probability of the system to perform itsfunction (probability of success) is estimated as well as the probability offailure to perform its function.
The upper half of Figure 3.2 shows a set of theoretical paths or event trees.In practice, as shown in the lower part of the figure, many of these paths canbe eliminated because they represent illogical sequences. If the event tree isproperly constructed (the example here is greatly simplified) the series ofevents in each accident chain is defined so that it is in principle possible tocalculate the consequences for that series. The event tree approach can thusprovide a definition of the possible accident sequences from which radioactivereleases to the environment can be calculated. If the failure probabilities areknown, the probability of each release can be calculated (US AEC, 1974).
3.4.2 Links to Environmental and Behavioural Models
At this point the model of a complex technological system connects with theatmospheric diffusion model. If radioactive fission products are released howfar and how fast will they spread? This leads in turn to questions about effecton human populations for which models of the response of the human

- n-- - - ---_u- n- -- n.
51
biological system to radioactivity are needed as well as models of humanbehaviour in the face of warnings about radioactivity in a power stationaccident. These behavioural elements may have substantial effect on theamount of damage to health that is caused, but are more difficult to model in areliable fashion.
An important source of difficulty in modelling the human behaviouralcomponent is that it is self-aware. Accident sequences in nuclear power plants,and the process of biomagnification of toxic substances in food chains allproceed in an automatic fashion which can be modelled in probabilistic terms.The quality of self-awareness in human systems enables the behaviour andfunctioning of the system to change in response to how people think theprocess is working or should work. In other words, we now need to know whatperceptions of the system are held by the participants in it, since that willchange the outcome.
3.4.3 A Perception-Behaviour Model
A model for environmental perception and behaviour is shown in Figure 3.3.It represents one way of organizing the components of a general model(Whyte, 1977). The variables are arranged according to:
(I) The distance from a decision point at the man-environment interface,and
(2) The scale at which decisions are taken from individual or householdlevel to the organization or government level where decisions are takenby a few on behalf of many.
Thus as one moves from right to left across the diagram the variables moredirectly impinge upon the output variables for a specific intervention (but theymay not necessarily be more influential). And as one moves from the bottomto the top of the figure the variables become more relevant to collective ratherthan individual decision-making, though they are not exclusive to either. Thusa progression can be traced from individual and group characteristics throughintervening variables such as values and personality, to decision and choicesaffecting the environment.
Linking the individual and social variables are four interdependentprocesses which together act as the main organizing force in the system. Theseare the 'perception processes' which link all the components. In this modelthey are considered as four process elements on the pragmatic grounds of whatare measurably different components of perception at the field level. Thus,categorization and judgement are grouped together in the model because theyare often measured together although conceptually they are different parts ofthe perception process.
The other three major divisions of perception used here are: sensoryperception (e.g. sight, smell); attitudes; and communication and informationflow. In the field, these processes (either separately or together) can be

CollectiveResourceManagers
, ,)1 DECISION-MAKING:
I AND POLICY IL.- - - - - __I
VALUESYSTEM
GROUP .CHARACTERISTICS
CQ>....E
~0III
1 ' 5I I :!iiI 1 ~IHUMANUSE~I SYSTEM I ~I I :cI ~L.- - -- _I c
Q>"00
!J)
IndividualResourceManager
TERRITORIALITYaETHNOCENTRISM
IDENTITY1 ': CHOICE AND I'1BEHAVIOUR I
! I
OTHERVARIABLES
INDIVIDUAL
CHARACTERISTICS
PERSONALITYAND EFFICACY
Distance from decision point at man - environment interfaceDecision
Figure 3.3 Simplified model of environmental perceptionSource: Whyte, 1977
EXPERIENCE
VItV
V)i:)~
!§:::!1:\"~!i>'"

53
investigated as links between any sub-set of variables relevant to the study.Figure 3.3 is a simple heuristic device to help organize the research planning
task. It is not a model of how the system actually functions and it cannotserve as a substitute for specific hypothesis development and conceptualmodelling within each research project. No constraints are intended on theboundaries of a specific study or on the operations and connections betweenvariables. Specific environmental risk problems can therefore be examined interms of their own 'critical paths' through the model.
3.5 ENVIRONMENTAL MODELS
A wide range of environmental models have been developed. The mainpurpose of environmental models in this context is to study the variables andlinking processes between sources or causes of environmental risks and theirconsequences or effects. Much has been written elsewhere about thedevelopment of such models. This section illustrates environmental modellingby three types of example:
(1) Non-quantitative models and probabilistic models,(2) Global models of biogeochemical cycles, and(3) Models of persistent substances in food chains.
3.5.1 Non-quantitative Models and Probabilistic Models
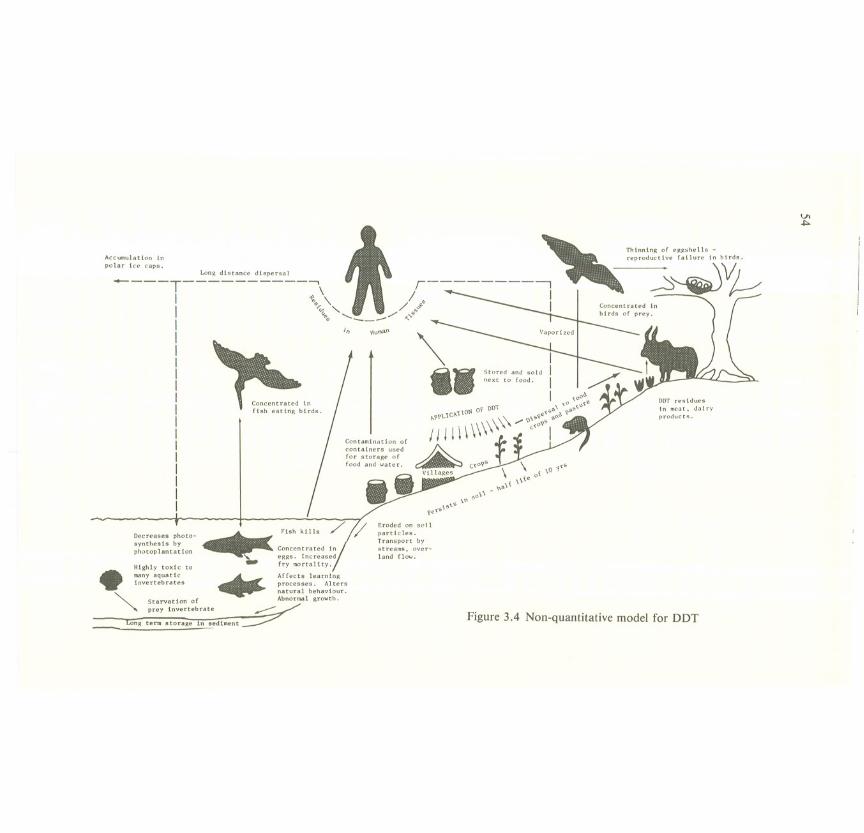
The power and value of developing comprehensive models to examineevents lies in their ability to portray in an understandable form complexsystems and interrelationships. Their weakness is in the simplifyingassumptions that are used in some or all of the component parts (Holdgate andWhite, 1977). Often these simplifying assumptions are made when processes(physical, biological or social) are represented in the form of equations. Thereis thus good reason to develop as a first step a non-quantitative model whichmaps out all the possible sources and pathways whether or not they can bequantified. Numerical representations of parts of the system can be developedin various ways as a second stage (including graphical mapping, empiricallyfitting algebraic equations to represent relationships between phenomena, andthe use of high speed computers to solve complex systems of non-linear partialdifferential equations or stochastic relations representing such phenomena).
Figure 3.4 shows a non-quantitative model of the pathways by which DDTcan reach the human body in a poor agricultural area. The pathways includecontamination of DDT containers reused for storage of food and water andcontamination of food when it is sold after it has been stored with DDT invillage shops. Study of the behaviour of people using DDT or even those livingin villages where it is used are as necessaryinputs to the developmentof thiskind of model (however unquantified) as is knowledge of the naturalenvironmental and food chain processes. Indeed, comprehensiveness is a mainobjective of these models to ensure that all possible pathways by which risks
Long distance d!spersal
T ~\ ..n /~--~ I II
~... / .§ -----I '" " /"."I .~ ' ,,"IIIIIIIIIIIIIII
Accumulat!on Inpolar !t.e caps.
Decreases photo-synthesh byphotop I antat Ion
H!ghly toxic tomany aquatic!nvertebrates4t
~ Starvation of
prey !nvertebrate
ong term storageiiiSed!ment
VI"'"
Th!nn!ng of e~:~~~~;\~ hlrds.
reproductive V~~~'0 "uman
'\.8~PPLIC'TI0N of OOT ,0 100b
Contam!nat!o I, j Ii \\\\\\\\ "" "I,~':';::b ~a".<'
contain n of I c<o~for sto;rs used . t
..t. Ifood age ofand water
81Q. Villages C<o~s \- \ I ,0 ~<'
,I ,lIe 0
sol' -"a
?e<'\S" \0
DOT residuesIn meat. da! ryproducts .
Concentrated infish eating birds.
, Fish kills ,7 1/~ ;oncentrated !n- ggs. Increased
fry mortality)Affects Iearn!ngprocesses. Alters
~atura1 behav!our.bnormaI growth.
Eroded on sol I
partIcles.Transport bystreams. over-land flow..
:Figure 3.4 Non-quantitativemodel for DDT

m-- -- - --- - -
55
are transmitted are included in the first picture so that the decision-maker isprovided with an overall view of the magnitude and complexity of the problemhe has to deal with. Later, simplifying assumptions will be introduced toenable processes to be quantified and parts of the model may even have to beomitted.
In many physical and a few biological applications, quantitative models areavailable that permit estimation of the frequency distribution of hourly, dailyor monthly values of some environmental state or condition. For example, thefrequency distribution of hourly concentrations of sulphur dioxide at a pointin the vicinity of a chimney may be estimated, even though prediction for aspecific hour could be wildly in error. From such calculation, the probabilityof any given concentration being exceeded can be specified.
3.5.2 Global Models of Biogeochemical Cycles
Some of the largest environmental modelling exercises now being attemptedare in the area of biogeochemical cycles of nitrogen, phosphorus, sulphur andcarbon. Understanding the volume of flows and the various pathways isessential to knowing how the cycles have been or might be changed by humanaction and what management actions might be possible or required. Forexample, the model of the global nitrogen cycle (Figure 3.5) underliesestimates of present and future possible contributions of N20 to the depletionof the ozone layer. Similarly the development of knowledge of the sulphurcycle (see Figure 3.6) underlies the acid rain problem described in more detailin Chapter 6.
When a particular environmental problem arises, it may be necessary tocombine parts of existing models into one that serves the purpose in question.For example the ozone layer depletion problem requires an understanding ofatmospheric diffusion (how fast will chlorofluoromethanes and nitrous oxidediffuse up to the stratosphere?); it also requires a chemical interaction modelthat states the rate of interaction with ozone: thirdly, there is need to know therelation of ozone depletion to the amount of increase in ultraviolet-Bradiation; finally a biological model is needed of the effect of increases inultraviolet-B upon target organisms at the surface. Because of the uncertaintyof estimates, models of this sort are continually being revised and updated asmore observations become available.
3.5.3 Persistent Substances in Food Chains
Within the grand design of global cycles it is often necessary to examinesmall components to trace the entry and pathway of toxic substances. Foodchains are a good example of this type of modelling.
In anyecosystemthe energy captured by green plants becomes available in astepwise fashion to animals and microorganisms by flowing through a foodchain. There is an inevitable loss of available energy at each of the steps in thechain (Figure 3.7).

VI0\
1-2 STRATOSPHERE - - - ---- - u_n n- --~l nu -- --- - u-- - -- - - - n -- -- ---n - - -- u_-- -- -- - --- n- - - 1 -- - -- n - -
N
--
H
---
+
-
O
--
Hm~~8 INO.TROPOSPHERE
18 3N~
194N2
~
"19-50
NH3/NH4
" , ,.11-33 30-130NO. I N2
22-58
TERRESTRIAL SYSTEMS
NH3/NH4
7-23
NO.
AQUATIC SYSTEMS
Figure 3.5 The global nitrogen cycleThe rates are given as Tg N yrl. The flows of Nz/NzO are residuals obtained when balancing the terrestrial and aquatic systems(Soderlund and Svensson, 1976)
Source: Holdgate and White, 1977, pAD. (Reproduced by permission of SCOPE)

- _m-P--
57
'1~S(' 44/-9
~~ <"G'-~~O
Figure 3.6 The first global sulphur cycleBased on a preindustrial balance of the soil compartment. Fluxes are givenin Tg (millions of tonnes) of sulphur per year. The man-made parts of thefluxes are indicated by plus signs (Hallberg, 1976)
Source: Holdgate and White, 1977, p.47. (Reproduced by permission ofSCOPE)
Two consequences of the ecological principle have significance in assessingthe risk to the environment of 'abnormal' levels of substances, and of'abnormal' substances resulting from man's activities:
(1) Organisms at one level may be killed, breaking one link of the chain andthus disrupting the whole system.
(2) A substance which is persistent (not metabolised or biodegraded) mayreach increasingly high concentrations as it is passed through the variouslevels of the chain. This process is referred to as biomagnification.
Persistent substances which have received attention recently include:
(1) Chlorinated hydrocarbon insecticides,e.g.DDT,dieldrin,(2) Polychlorinated biphenyls (PCBs),(3) Heavy metals, e.g. mercury, lead,(4) Radioactive materials, e.g. Strontium-9°, Iodine 131.

58
CARNIVORE 2
0..CARNIVORE I
00..00..I
HERBIVORE
~~~OOO...OOO...
Figure 3.7 An intact natural ecosystem (e.g. a forest) where10-20070of the energy at each level is passed to the next level.(Modified from Ehrlich et aI, 1977)
Source: From Ecoscience: Population, Resources, Environmentby Paul R. Ehrlich, Anne H. Ehrlich and John P. Holdren,W.H. Freeman and Company. Copyright @ 1977
The first three are discussed briefly here as examples of food chain modelsthat have been developed.
DDTWith the information that DDT could be found in carnivorous birds atconcentrations a million times greater than those in the abiotic environment(e.g. Woodwell, Craig and Johnson, 1977), it was clear that this particularcompound did obey the laws which could have been predicted at the time of itsfirst extensive use in 1948. The relevant properties of this man-madecompound in this context are:
(1) It is chemically stable, very few organisms can degrade it. Its half-life(time for 50070to be lost from the original site of application) has beenestimated at 10-15years.
(2) It is readily dispersed in water and in air in the form of suspension andby codistillation with water into air.
(3) It is barely soluble in water, but soluble in lipids, which are componentsof all biological systems. Thus it will preferentially associate with livingover non-living material.
(4) It has become ubiquitous.(5) In addition to being bioaccumulated by individual groups of organisms,
it is biomagnified in food chains. The aquatic food chain shown inFigure3.8 exemplifiesthis.

59
DOTPesticide ~Fish-eating birds
~ /'" r ~IRDS1600ppm~'~/--- !-O.02ppm--.~;:-~Algae Corp40ppm
5ppm ~~ -8!(Bluegill LargemouthBoss125ppm -11-.-1550 ppm
Buildup of chemicals along a representative food chain.
Figure 3.8 DDT in Clear Lake California (Modified from Treshow, 1976)
Source: From The Human Environment by M. Treshow. Copyright @1976 McGraw-Hill. Used with permission of McGraw-Hill Book Company
(6) It is a current constituent of the animal and human body (Wasserman,Tomatis and Wasserman, 1975).
(7) It is transferred from mother to foetus through the placenta and to theinfant through breast milk.
(8) It activates or inactivates liver microsamal enzymes and thus interfereswith normal metabolic pathways. This fact explains the majority of itsbiological effects.
(9) It is toxic not only to target organisms (the insect pests) but to a widespectrum of living organisms.
(10) Some insects can become resistant to the toxic effect so that other com-pounds of higher toxicity are required to control the pests.
DOT was deliberately introduced for controlling insects and insect bornedisease (O'Brien, 1967) and for future insect control so here the message isclear: there is an element of choice. The other persistent substances to bediscussed here have been released as a result of man's activities, but usually aswaste products.
Polychlorinated biphenyls (PCBs) PCBs share many of the properties ofDOT. They are chemically inert, extremely stable, have low solubility in water,a high affinity for lipids and accumulate in living organisms from which theyare excreted only very slowly. They have become widely distributed throughthe biosphere e.g. in the blubber of seals and porpoises on the East Coast ofScotland and Eastern Canada. Thus they are prime candidates for food chainaccumulation and biomagnification and are now, like DOT, found in animaland human tissues around the world. Well documented effects of PCBs onhuman health include the rice-oil disaster in Japan (Yusho disease) whichaffected more than 1,000 people who consumed food contaminated by PCBswhich had leaked into cooking oil from a heat exchanger (Kuratsune et al.,1972). PCBs are also carcinogenic and are known to change the activity of theliver and to interfere with normal metabolic pathways.

60
Sources include transformers, capacitors, plasticisers, solvents, adhesives,sealants, coatings for lumer and concrete, tires and brake linings. Thecompounds get into the biosphere by atmospheric emissions, dumping intowater, and by human contact with paints and plastics. In Canada and the USthey are not prohibited in food containers and processing plants. The USEnvironmental Protection Agency has set standards of 0.01 ppb in water and0.5-1.0 mg/m3 for air. Even with complete restriction on further use however,existing residues will persist for long periods of time.
Mercury While mercury has long been recognized as an extremely toxicsubstance (ReVelle and ReVelle, 1974), attention has more recently been givento the accumulation of mercury in aquatic and terrestrial food chains. Between1953 and 1960, mercury poisoning (Minamata disease) resulting fromconsumption of contaminated fish occurred in Japan (Irukayama, 1966) andin the early 1960s Sweden experienced a mercury problem in food. The sourcefor the Japanese illness was industrial mercury waste from a chemical factory,accumulated from sediments and water into fish, which were consumed byhumans. In Sweden the source was identified as a mercury fungicide whichpassed through the food chain from grain to hens to eggs to humans (LOfroth,1970). The eggs contained 0.029 ppm mercury compared with 0.007 ppm ineggs from other European countries.
For mercury, the chemical form of the metal is all important in recognisingthe health risk. Organic mercury, especially methyl mercury, is much moresoluble and more toxic than inorganic mercury. Methyl mercury has a half-lifeof 70 days in the human body compared with six days for inorganic mercury.Mercury accumulates in food chains and in addition, biological processes cantransform inorganic to methyl mercury (Jensen and Jernelov, 1969). Thechemical and biological reactions of mercury in the environment are complexand incompletely understood. Even naturally occurring mercury can besolublized and released into the biosphere as a result of other processes such asacidification of water resulting from acid precipitation.
Detailed studies on mercury in food chains have resulted not only fromincreased awareness of the potential risks, but also from improved analyticaltechniques (e.g. Linstedt and Skorfuing, 1972). Studies on fish have shownthat mercury is taken up as methyl mercury, either emitted as such, ormethylated in sediments by microorganisms. The rate of uptake and theretention time for mercury in fish varies greatly with the species andenvironmental conditions. It is not yet clear whether the major pathway ofmercury to fish is via the water (direct uptake) or from contaminated food(food chain accumulation). Both of these processes can and do occur.However, at the next level of the food chain, when birds prey on fish, or manconsumes fish in the diet, food is the major source of mercury intake.
It is tempting to extrapolate from these data and make generalizations forthe potential impact of all persistent substances in food chains. Clearly,compounds or elements which exhibit any of the properties listed for DDT

61
should be regarded as potential risks to the health of humans, biota and theenvironment and thus worthy of close scrutiny. More precise models canhowever only be constructed on the basis of hard scientific evidence of whichthere are basically two types:
(1) Observations and measurements of concentrations of the pollutant infield situations which give a snapshot at a moment in time but no infor-mation on the dynamics of the system - the rates of uptake, loss,retention time etc. at each level of the food chain, nor the toxic effectson populations. Sampling extended in time can partially clarify this, andis also useful fOf monitoring the disappearance of the pollutant withtime.
(2) Experimental situations where populations and organisms are isolatedand examined for toxicity, rates of uptake and excretion etc., or wheresimplified ecosystems are set up in microcosms, and known amounts ofthe substance (often isotopically labelled tracers) are introduced.
Both types of study have great value; ideally the experimental approachshould precede the field studies, but this is clearly not possible for pollutantswhich have already been allowed to escape into the biosphere.
Our awareness of food chains as risk systems should alert us to the need forcareful screening of potential pollutant substances. Experimental work inmicrocosms (experimental artificial ecosystems) are concerned with thisaspect of the problem. But we have not always been wise before the event.Where contamination of food chains has already occurred, or is continuing,e.g. from lake sediments which acted as 'sinks' for PCSs, continuedmonitoring will improve understanding of the complex biological transfersthat we are trying to model.
3.6 ESTABLISHING THE RELATIONSHIP BETWEEN THE DOSEAND THE EFFECT
The last link in the food chain, the last piece of any model of a risk system,is the link that connects the impacting variable to its receptor. The importanceof the last link justifies the special attention that it frequently receives in theestimation of risks.
What amount of ultraviolet-B radiation, or what increase in the amount isrequired to produce a specified additional number of cases of skin cancer? In adrought, what level of moisture deficiency and what period of time is requiredto reduce crop yields significantly or to produce crop failure? How muchingestion of mercury in fish or in bread made from seed-grains is required toproduce mercury poisoning? How much damage will result from a flood thatcovers the floodplain with a metre's depth of flood water, and will the damagebe twice aslargeif the water rises another metre?
These are all examples of the same kind of relationship although theterminology used to describe them differs. For toxic pollutants in the

62
environment or in food chains the term dose-response or dose-effect is used.For droughts the phrase more frequently used is impact-response or impact-effect. If one particular indicator of drought is used the term may be moisturedeficit-effect or drought index-effect. For floods the relationships may beexpressed in stage-damage curves.
Whatever the terminology used there are important questions to be askedabout the curve, its slope and the nature of the relationship. They areimportant because they have considerable bearing on the setting of standardsand the adoption of policies to reduce risk.
3.6.1 Dose-Effect Relationships
Threshold relationships are shown in Figure 3.9. The simple case is in curve(1) where there is no risk until a certain level of exposure takes place. The levelof exposure is the point where curve (1) leaves the abcissa.
A more complex and more common case is illustrated by curve (2). Herethere is some effect at low doses, increasing relatively slowly, until a take-offpoint is reached at which the effects increase dramatically. Measured over a
Q)'"c:0a.'"~
(;
(7)
u
~Q)
dose or exposure
c. Zero Threshold Relationship
Figure 3.9 Dose-Effect Relationships
Q)'"c:0a.'"~
(;
(4)
u
~Q)
dose or exposure
B. Breakpoint Relationship
Q)'"c:0a.'"~~0
u~-Q)
dose or exposure
D. Deficiency Relationship
Q)(3)
'"c:0a.
2J '"
'"
(;
!
u
Q;
Idoseor exposure -
A. Threshold Relationships
-- - - - - --
63
whole population this could be a case where a few susceptible people areaffected by low exposures but the mass of the population are not affected untila certain threshold or take-off point is reached.
Both these curves may clearly be linked to policy options. In the case ofcurve (1) it may seem necessary to keep the level of exposure for all personsbelow the threshold level. In curve (2) it may not be practicable to reduceexposure to zero in order to protect the relatively small number of susceptiblesaffected. In this case the standards may be set at the take-off point orsomewhat below it, and additional steps taken in other ways to safeguard orreduce the exposure of susceptibles.
A more complicated case is shown as curve (3) where the effects of exposureare impossible to separate from similar effects which occur without exposure.In other words there are some 'effects' at zero dose and any dose above zerowill increase those effects.
A breakpoint relationship is shown in Figure 3.9(b). In curve (4) a markedbreak in response occurs at some (usually higher) level of dose.
The curves shown in Figure 3.9(c) are all variations of zero thresholdrelationships. Curve (5) is the classical linear exposure/effect relationshipswhen no theshold exists. Zero risk occurs only at zero exposure. This is theconservative position that is assumed to exist for exposure to ionizingradiation.
Curve (6) is a variant showing lower sensitivity to risk at lower levels, andcurve (7) is the reverse showing increasing sensitivity at lower levels of riskexposure.
In practice it is rarely possible to specify the slope of the dose-effect curvewith confidence or to state exactly where the threshold level is if it exists. Anumber of factors account for the lack of precision in dose-effect curves. Thevulnerability of individuals varies for day to day and physiological diversity inhuman populations is such that effects may vary according to the segment of apopulation exposed. Measuring techniques have their limits of detection andmonitoring of levels can only be carried out in a few selected samples or sites.At very low exposures there may be effects which are not easily detectable andobservations at the upper end of the curve are difficult to obtain becausemassive exposures are relatively rare. A great deal has been learned aboutradiation exposure of high levels from cohort studies of the populations ofHiroshima and Nagasaki. Normally, ethical considerations prohibit thedeliberate exposure of human beings to large amounts of hazard. Analternative approach often used is the conducting of tests on animals but extra-polation of animal data to estimate human experience is always imprecise, andunavoidably so.
The principle use of dose-effect curves is thus to predict the consequences ofvery high and very low exposures which usually cannot be adquately observedor measured.
In Figure 3.10 a generalized exposure-effect curve shows uncertainty ofestimates at high and low levels of exposure and the need to extrapolate

64
I-UWlJ..lJ..W o~
EXPOSURE -Figure 3.10 Generalized exposure-effect curve, showinguncertainty at high and low exposures: diameter of circlesindicates degree of certainty about data points
Source: Lowrance, 1976, p.38. (Reproduced by permission ofWm. Kaufman, Inc.)
upwards and downwards from 'middle range' observations.As indicated above, the practice in radiation exposures has been to
extrapolate to the point of origin - in other words to make a 'no threshold'assumption. In many other areas the conventional approach has been toassume that a threshold level exists and that a small amount of a bad thing isharmless. There is a current trend towards the discovery of harm at lower andlower doses. The threshold concept is on the defensive and many scientists arecoming to believe that for many hazardous sub.stances - especially newsubstances not previously found in the human environment - any exposure ispotentially harmful or risky.
There is other evidence however, that some toxic substances are required bythe human body in very small quantities for complete health. Deficiencies ofsome elements, including the toxic heavy metals can in fact be detrimental. Insuch cases the dose-effect curve would appear as in Figure 3.9(d).
Three different types of tools are used to develop the information needed toconstruct and interpret dose-response curves: (1) Clinical studies; (2) Epidemi-ological (population) studies; and (3) animal studies.
Clinical Studies The most reliable subject for determining health effects onman is man himself. For obvious reasons, the use of man as the subject ofexperiment (clinical studies of harmful impacts) must necessarily be extremelylimited and subject to extremely stringent control and safety procedures. Thereare areas where effects of low exposures can be examined in a carefullycontrolled clinical study. For example, the US Environmental ProtectionAgency is conducting a series of controlled human exposure studies to examinethe effect of being exposed to low concentration of sulphates.

65
Epidemiological Studies A second tool which directly provides data onhuman effects are epidemiology or population studies. These studies focus onfollowing a specific group of individuals over a period of time to see if patternslinking cause and effect can be discerned. The conclusions drawn arenecessarily based much more on inference than in the controlled clinicalstudies where one knows to what the subject has been exposed. There are twotypes of population studies that are being developed, retrospective andprospective. Retrospective population studies essentially start from anobserved effect and attempt to trace back to find what might be the possiblecause or causes of the effect. For example, such a study might focus on ageographical area that has a high cancer incidence (high cancer cluster). Thestudy would be designed to detect similar patterns and life style, conditions, orenvironmental factors, which could have contributed to the observed effect.Prospective population studies, on the other hand focus on followingpopulations which have a known exposure to a particular substance, forexample, a carcinogen, in order to determine what the possible effects may beto that exposure. Figure 3.11 portrays how such studies fit into a proposed USEP A research Plan to develop data needed to determine EnvironmentalExposure/Cancer Relationships.
BIOLOGICAL MONITORINC
RETROSPECTIVE
POPULATION STUDIES
EXPOSURE MODELS
(HIGH CANCER CLUSTER)
HISTORICAL DATA
ASSESSMENT SELECTION
PROSPECTIVE POPULATION
STUDIES (HIGH EXPOSURE
TO KNOWN OR SUSPECTOF STUDY AREAS
CARCINOGENS)
PROSPECTIVE AND
RETROSPECTIVE
DEVELOPMENT OF
IMPROVED METHODOLOGY
CARCINOGENIC PROFILE
CHEMICAL AND PHYSICAL
CHARACTERIZATION
ASSESSMENT AND
DATA RESPOSITORY
Figure 3.11 Studies being undertaken to establish the dose-effect relationshipfor environmentally caused human cancers(US Environmental Protection Agency, 1974)
Animal Studie$ Most of the information on dose-responsecomes fromanimal studies. Tests are run on various animals to determine acute, chronicand genetic effects. Selection of the specific types of animals depends upon theeffect to be examined; the target organ that is likely to be affected, and the

66
extrapolation of that response to man; and on the sampling, reproducibility,and timing requirements of the experiment. Extrapolation of animal data toman is the major problem for using this tool and considerable research isneeded to narrow the error bar associatedwith such extrapolations.