Embed Size (px)
Citation preview
1
Identifying Comparative Claim Sentences in Full-Text Scientific Articles
Dae Hoon Park1 and Catherine (Cathy) Blake2
1 Department of Computer Science
2 Center for Informatics Research in Science and Scholarship (CIRSS), Graduate School of Library and Information Science with courtesy
appointments in Computer Science and Medical Information Science
University of Illinois at Urbana Champaign

Motivation • Relentless increase in electronic text
– More than 1 million articles in more than 20,000 journals per year (Tenopir et al, 2011)
– E.g. Pubmed 22 million abstracts (June, 2012) – E.g. Chemistry - more than 110,000 articles in 1 year
• Consequences: – Hundreds of thousands of “relevant” articles – Implicit connections between literature go unnoticed
2
Shift from Retrieval to Synthesis

The Claim Framework • Premise: There exists a sublanguage that scientists
use to express their empirical study findings (claims) in a published scientific article.
• Hypothesis 1: The Claim Framework captures the key characteristics of the claim sublanguage
– Blake, C. (2010) Beyond genes, proteins, and abstracts: Identifying scientific claims from full-text biomedical articles, Journal of Biomedical Informatics, 43(2):173-189
• Hypothesis 2: Text mining can be used to populate the Claim Framework automatically
– Explicit Claims (77% of claims, see citation above) – Comparisons (~5% - this paper)
3

Claim Framework Facets
4
Agent Object Direction
Modifier
Direction
Modifier Change
Direction
Modifier
Comparison Basis Direction
Modifier
• Observation (9.3%) – Weakest claim – Eg. However, the plasma nm21-H1 protein level was
increased in SML-M3 patients (P = 0.0002)
increased plasma nm21-H1 protein level
SML-M3 patients P=0.0002

Claim Framework • Explicit Claim (77.11%)
– most specific and frequent type of claim – E.g. Tamoxifen (Nolvadex®) is a drug that interferes
with the activity of estrogen, a female hormone
• Implicit (2.7%) – E.g. The Hsd3b-isoforms are all down regulated
from 2 h after DEHP treatment …
5
Tamoxifen estrogen activity of interferes
DEHP treatment Hsd3b-isoforms 2 hours after down-regulated

Claim Framework • Correlation (5.39%)
– E.g. … we did not find a correlation between c-myc expression and nm23-H2 expression in AML.
• Comparison (5.11%) – E.g. The plasma concentration of nm23-H1 was higher in
patients with AML than in normal controls (P = 0.0001).
6
c-myc expression correlation not AML nm23-H2 expression
AML higher normal controls
nm23-H1 plasma concentration of
patients with

Distribution of Claim Categories
7
Category Total (%) Pilot(%) Main(%) Explicit 2489 77.11 332 83.42 2157 76.63
Implicit 87 2.70 3 0.75 84 2.98
Observation 298 9.23 24 6.03 274 9.73
Correlation 174 5.39 12 3.02 162 5.75
Comparison 165 5.11 27 6.85 138 4.9
Total 3228 100 398 100 2830 100

Related Work
• Product reviews – Sequential rule mining (Jindal and Liu, 2006) – Enhanced point-wise mutual information
(Ganapathibhotla and Liu, 2008) – Conditional Random Fields (Xu et al., 2011) – Maximum entropy (Yang and Ko, 2011) – Support Vector Machines (Yang and Ko, 2011)
• Biomedical text – linguistic patterns (Fiszman et al., 2007)
8

Challenges with Comparisons • “The comparative clause construction in English is
almost notorious for its syntactic complexity.” Bresnan (1973)
• “An interest in the comparative is not surprising because it occurs regularly in language, and yet is a very difficult structure to process by computer. Because it can occur in a variety of forms pervasively throughout the grammar, its incorporation into a NL system is a major undertaking which can easily render the system unwieldy.” Friedman (1989)
9

Comparison Types • Gradable
– indicates ordering – E.g. greater, decreased, shorter
• Non-gradable – Non-gradable similarity comparison
• E.g. ‘similar to’, ‘as ~ as’, similarly
– Non-gradable difference comparison • E.g. ‘different from’, ‘difference between’
10

Goal: Identify Comparisons
11
E.g. Non-gradable similarity: Mean maternal body weight was similar between controls and treated groups …
E.g. Gradable: The number of deaths was higher for rats treated with the Emulphor vehicle than with corn oil …
11
Emulphor vehicle higher corn oil
deaths
controls treated groups
mean maternal body weight
similar
rats treated with rats treated with
number of

Frame as Classification Task
Sentences Feature Values Label
Sentence1 0,0,0,0,1,0,0,1,… ?
Sentence2 1,0,1,0,0,0,0,0,… ?
Sentence3 0,0,0,1,0,0,0,0,… ?
… … …
1. Build model based on training data Sentences Feature Values Label
Sentence1 0,0,0,0,1,0,0,1,… Comp.
Sentence2 1,0,1,0,0,0,0,0,… Non-comp.
Sentence3 0,0,0,1,0,0,0,0,… Non-comp.
… … …
2. Evaluate predictions of model on test data
3. Repeat with different training and test data sets
Label Comp.
Non-comp.
Non-comp.
…
Classifier
Classifier

Semantic Features • SPECIALIST lexicon (Browne et al., 2000)
– Modified list of comparative words – E.g., ADJ+‘er’, ‘worse’, …
• Direction words lexicon – Subset of direction verbs (Blake, 2010) – Added 22 additional words from pilot study – E.g., ‘increased’, ‘decreased’, …
• Other lexicons for words/phrases – E.g., ‘versus’, ‘twice the’, ‘times that of’, …
13

Syntactic Features • Combines semantics (words) and syntax (dependency)
– E.g., [ ‘than’ ]
• Compiled 29 syntactic features – 4 Features related to similarity/difference
• + PREP for indicative preposition of similarity/difference
• + PLURAL for plurality of the subject in similarity/difference
– 6 Features related to ‘than’
– 9 Features related to ‘compared’, ‘comparing’, and ‘comparison’
– 5 Features related to ‘contrast’ and ‘relative’ – 3 Features related to phrases such as ‘as ~ as’
14
prep

Dependency Tree
15
ROOT
orders
DBP is several of .
root nsubj cop amod prep punct
magnitude pobj
mutagenic/carcinogenic than prep amod
BP more pobj advmod
E.g. DBP is several orders of magnitude more mutagenic/ carcinogenic than BP.
Syntactic Feature S5

Classifiers • Both SVM and NB work well with text (Sebastiani, 2002)
• Support Vector Machine (SVM) – Effective classifier – Creates hyperplanes that separate training data – Uses hyperplanes to classify new data
• Naïve Bayes (NB) – Graphical model – Conditional independence between features
16
C
X2 X3 X1 Xn

Bayesian Network (BN) • A directed acyclic graph • Efficient (exact inference) • Compact representation
– Maintains only conditional probabilities
• Captures feature dependencies • Maximum Likelihood Estimation (MLE)
– With additive smoothing
17

C
L1 L2 PLURAL PREP
S5, …, S10 S11, …, S19, S22, …, S24,
L4
S20, S21, L3
S1, …, S4 S25, …, S27,
L5, L6
Bayesian Network Class
Similarity/Difference
Plurality of Subject
Preposition of Similarity/Difference
Indicative Phrases
S20, S21: contrast L3: from, over, above
S: compared, comparing, comparison, relative
L4: versus, vs
Direction Words
ADJer
than

Evaluation • Pilot study
– 465 sentences (Fiszman et al., 2007; Blake, 2010)
• Full study – 14157 sentences (122 full text articles)
• 13657 sentences in 83 articles in development • 500 sentences from 39 articles in validation
19
Sentence Type Pilot Development Validation
Comparative Sentences 465 (100%) 1659 (12.15%) 76 (15.2%)
Non-comparative
Sentences 0 (0%) 11998 (87.85%) 424 (84.8%)
Total 465 (100%) 13657 (100%) 500 (100%)
Feature refinement Feature refinement

Accuracy and ROC AUC
NB SVM BN
Development Accuracy 0.923 0.933 0.940++
++
ROC AUC 0.928 0.904 0.933++++
Validation Accuracy 0.924 0.916 0.932
ROC AUC 0.948 0.883 0.958
20
+/-: statistical significance at p=0.05 ++/--: statistical significance at p=0.01 Superscripts: BN vs NB Subscripts: BN vs SVM

Evaluation on Comparatives NB SVM BN
Development
Precision 0.653 0.780 0.782++
Recall 0.778 0.621 0.706--++
F1 Score 0.710 0.691 0.742++++
Validation
Precision 0.726 0.886 0.875
Recall 0.803 0.513 0.645
F1 Score 0.763 0.650 0.742
21
+/-: statistical significance at p=0.05 ++/--: statistical significance at p=0.01 Superscripts: BN vs NB Subscripts: BN vs SVM

Evaluation on Non-comparatives NB SVM BN
Development
Precision 0.968 0.949 0.960--++
Recall 0.943 0.976 0.973++-
F1 Score 0.955 0.962 0.966++++
Validation
Precision 0.964 0.919 0.939
Recall 0.946 0.988 0.983
F1 Score 0.955 0.952 0.961
22
+/-: statistical significance at p=0.05 ++/--: statistical significance at p=0.01 Superscripts: BN vs NB Subscripts: BN vs SVM

Precision-Recall Curves
23

Threshold vs Recall Curves
24
Set P(C=comparative|X) threshold to satisfy goal
Precision Threshold =0.9
Recall = 0.3 Precision=0.9 Recall
Threshold =0.4 Recall = 0.8
Precision=0.4
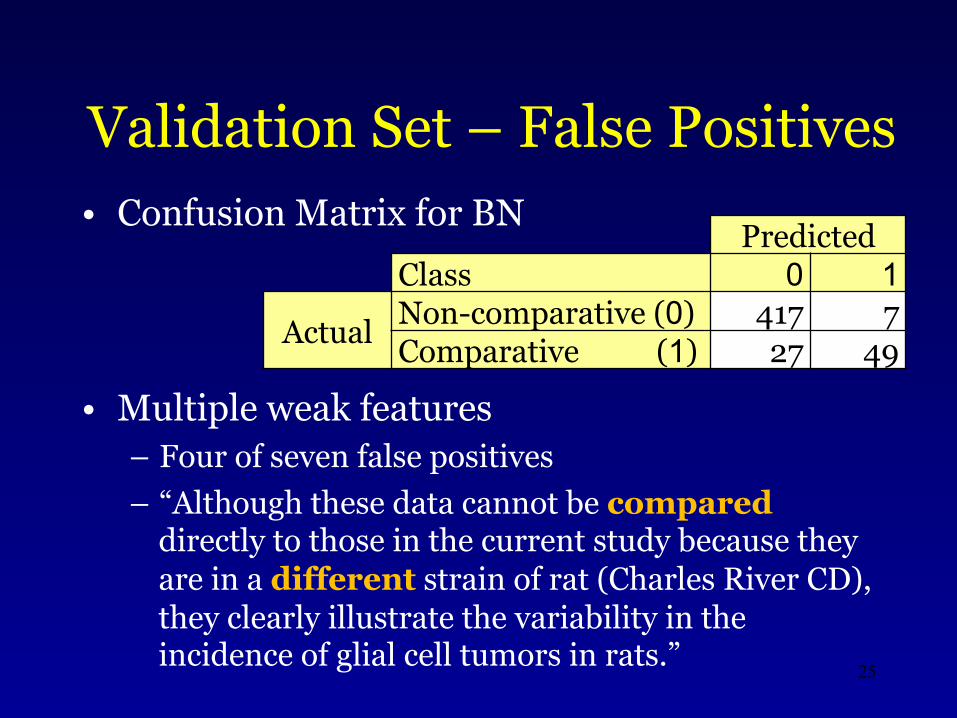
Validation Set – False Positives • Confusion Matrix for BN
• Multiple weak features – Four of seven false positives – “Although these data cannot be compared
directly to those in the current study because they are in a different strain of rat (Charles River CD), they clearly illustrate the variability in the incidence of glial cell tumors in rats.” 25
Predicted
Class 0 1
Actual Non-comparative (0) 417 7
Comparative (1) 27 49

Validation Set – False Negatives
• Poor estimation example – P(C=Comparative|X) = 0.424 – “Mesotheliomas of the testicular tunic were statistically
(p<0.001) increased in the high-dose male group in comparison to the combined control groups.”
– ‘comparison’ syntactic feature occurs not frequent enough
26
Reason of misclassification # errors Probability is estimated poorly 10 Comparison is partially covered by syntactic features 7 Comparison word is not in lexicon 7 Dependency parse error 3 Total 27

Conclusions • Comparatives make up 12% of sentences
– 35 semantic and syntactic features capture key characteristics of those sentences
• Best generalizable comp. F1 = NB • Best generalizable accuracy and non-comp F1 = BN
Validation NB SVM BN
Accuracy 0.924 0.916 0.932
Comp. F1 score 0.763 0.650 0.742
Non-comp. F1 score 0.955 0.952 0.961
Development NB SVM BN Accuracy 0.923 0.933 0.940++
++
Comp. F1 score 0.710 0.691 0.742++++
Non-comp. F1 score 0.955 0.962 0.966++++