Embed Size (px)
Citation preview

Available online on www.ijppr.com
International Journal of Pharmacognosy and Phytochemical Research 2015; 7(3); 461-472
ISSN: 0975-4873
Research Article
*Author for Correspondence
Extraction and Identification of Antidiabetic and Antioxidative
Phytochemicals from Pisang awak Leaves
Gan C.Y.1*, Kee S.M.2, Chiang P.N.1
1Centre for Advanced Analytical Toxicology Services, Universiti Sains Malaysia, 11800 USM, Penang, Malaysia. 2Bioprocess Division, School of Industrial Technology, Universiti Sains Malaysia, 11800 USM, Penang, Malaysia.
Available Online: 19th April, 2015
ABSTRACT
Antioxidative and antidiabetic compounds were successfully extracted from Musa spp. ABB cv. (Pisang Awak) leaves.
Effects of extraction time (0.5–4 h), solvent-to-sample ratio (10–80 ml/g), ethanol concentration (50–100 %), extraction
temperature (25–60 °C) and pH (2–7) were examined. The selected key variables were optimized using response surface
methodology (RSM). Quadratic models were obtained and 3D-response surfaces were plotted. An optimum condition (i.e.
extraction time of 0.5 h, solvent-to-sample ratio of 48.3 ml/g and 88.5% ethanol) was obtained. This condition gave TPC
of 21.54 mg GAE/g sample, DPPH scavenging activity of 6.49 mg GAE/g sample, FRAP of 9.35 mM Fe2SO4 and -
amylase inhibition activity of 26.62%. A total of 7 major compounds (i.e. chlorogenic acid, procyanidin, epicatechin, rutin,
isoquercitrin, quercetin and kaempferol-7-neohesperidoside) were identified using liquid chromatography-quadropole
time-of-flight-mass spectrometer.
Keywords: antioxidant; antidiabetic; identification; optimization; phytochemical; Pisang Awak
INTRODUCTION
One of the non-communicable diseases, type II diabetes
mellitus or non-insulin dependent diabetes mellitus) has
become a serious threat to global public health due its
chronic course and complications, such as heart disease and
kidney failure1. Different conventional therapies were
introduced, for example, intake of oral hypoglycemic
agents. However, modern medicines such as biguanides
and thiozolidinediones showed undesired side effects.
Alternative approaches (e.g. herbal drugs and control diet)
were therefore gaining interests due to their effectiveness,
safety and acceptability2. A recent study showed that
inhibition of α-amylase in degradation of dietary starch
works well as an important therapeutic treatment especially
for postprandial hyperglycemia patients3. Hence, the use of
an agent that could reduce oxidative stress and postprandial
hyperglycemia via inhibition of the α-amylase activity may
be therapeutic for diabetic patients. In this study, Pisang
Awak leaves were used as the source of the antioxidative
and antidiabetic agents. This type of banana is the most
famous cultivar with triploid hybridization of ABB4, which
is the hybrid of diploids M. acuminata with M. balbisiana
Colla, genomes of AA and BB, respectively. It is able to
grow almost everywhere in Malaysia throughout the year.
However, the values of the banana leaves are remained
unknown and most people are only using the banana leaves
as a lignocellulose source or as a wrapping material. For
example, one of the Malaysian cuisines, nasi lemak, is
normally wrapped with banana leaves because it is believed
that banana leaves could help in preventing rancidity of the
fat-containing foods. It is also used for medicinal purposes
in some regions as a cool compress for burns and other skin
diseases. The ash of the leaves was reported to be used in
treating diarrhea, ulcers and eczema5. The other potential
uses such as analgesic, antimalarial, antimicrobial,
hemagglutination inhibitory and hemolysis inhibitory
agents6 were also reported in other hybrids of banana.
Hence, it is interesting to explore the potential of banana
leaves. An optimization study of the extraction parameters
(i.e. extraction time, S/S ratio and ethanol concentration)
was performed in order to develop a procedure that can
greatly compromise the quality and productivity of the
extraction. The antioxidative and antidiabetic properties of
the extract were investigated. The targeted responses were
total phenolic content (TPC), 2,2-diphenyl-1-
picrylhydrazyl (DPPH) free radical-scavenging activity,
ferric reducing/antioxidant power (FRAP) and antidiabetic
activity. Apart from that, identification of the extracted
phytochemicals was subsequently performed using liquid
chromatography-quadropole time-of-flight-mass
spectrometry (LC QTOF MS) approach.
MATERIALS AND METHODS
Materials
Banana leaves were collected from farms located in Penang,
Malaysia. The leaves were cleaned with distilled water and
cut into smaller pieces prior to freeze-drying. Subsequently,
the sample was ground into powder and sieved (30-mesh
size). -Amylase with activity of 10 units/mg solid was
purchased from Sigma-Aldrich, USA. All other chemicals
and reagents used in this study were of analytical grade and
were purchased from Sigma–Aldrich company.
Gan et al. / Extraction and Identification of Antidiabetic…
IJPPR, Volume 7, Issue 3, June 2015- July 2015 Page 462
Extraction of phytochemicals
The samples (0.5 g) were added with extraction solvent
with different concentrations in a 50 ml centrifuge tube at
different S/S ratio, followed by incubation at different
temperatures and extraction periods. During the incubation,
the centrifuge tubes were covered with aluminium foil to
prevent exposure to light and the mixtures were placed in
an incubator with a constant shaking at 200 rpm. The
mixtures were then centrifuged (4500 rpm, 30 min, 4 °C)
and supernatants were transferred and made up to a total
volume of 50 ml. The solutions were stored at -20 °C prior
to analysis. All the extractions were performed in at least
three replicates.
Experimental Design
The experimental design of this study comprised of two
major parts: (A) single factor experiment and (B)
optimization study using Response Surface Metholodgy
(RSM). In the single factor experiment, several key
variables were selected (i.e. solvent concentration, S/S ratio,
extraction temperature, extraction time and pH). The
steepest ascent ranges of the significant factors were then
selected and examined in the optimization study. Box-
Behnken design (BBD) was employed and quadratic
models were developed.
Single factor experiments
Effect of extraction time
The extraction times ranging from 0.5 to 4 h were
investigated. The other parameters were remained in
constant (i.e. extraction temperature of 25 °C, S/S ratio of
25:1 and 100% ethanol).
Effect of solvent-to-sample ratio (S/S ratio)
The S/S ratios ranging from 10:1 to 80:1 were investigated.
The other parameters were remained in constant (i.e.
extraction time of 1 h, extraction temperature of 25 °C and
100% ethanol).
Effect of solvent concentration
The ethanol concentrations ranging from 50 % to 100 %
with 10 % intervals were investigated. The other
parameters were remained in constant (i.e. extraction time
of 1 h, extraction temperature of 25 °C and S/S ratio of
25:1).
Effect of extraction temperature
The extraction temperatures ranging from 25 to 60 °C with
5 °C intervals were investigated. The other parameters were
remained in constant (i.e. extraction time of 1 h, solvent
concentration of 100 % and S/S ratio of 25:1).
Effect of pH
Different pHs ranging from 2 to 7 were investigated. The
other parameters were remained in constant (i.e. extraction
time of 1 h, solvent concentration of 100 %, extraction
temperature of 25 °C and S/S ratio of 25:1).
Optimization study
The experimental design consisted of 12 different
combinations of the independent variables and 5 center
points. The BBD design matrix was shown in Table 1. The
three factors (i.e. extraction time, S/S ratio and ethanol
concentration) were chosen for this experiment and
designated as X1, X2 and X3, respectively. They were
divided into three levels, which were high, intermediate and
low levels. Data were analyzed using multiple regressions
in order to fit the following quadratic polynomial model:
Y = 𝛽𝑜 + ∑ 𝛽𝑖𝑋𝑖3𝑖=1 + ∑ 𝛽𝑖𝑖𝑋𝑖
23𝑖=1 + ∑ ∑ 𝛽𝑖𝑗𝑋𝑖𝑋𝑗
3𝑗=2
2𝑖=1 + 𝜀
(1)
where Y was the response variable; 𝛽𝑜 was the model
constant; 𝛽𝑖 was the linear coefficient; 𝛽𝑖𝑖 was the
quadratic coefficient; 𝛽𝑖𝑗 was the interaction coefficient;
and 𝜀 was the statistical error.
Determination of total phenolic content (TPC)
TPC was determined using Folin-Ciocalteu reagent
according to the method described by Shui and Leong7.
Sample (40 µl) was mixed well with 1.8 ml of Folin-
Ciocalteu reagent (prediluted at a ratio of 1:10) and
incubated for 5 min at room temperature before the addition
of 1.2 ml of sodium bicarbonate (7.5 %). The mixture was
then incubated in dark place for 60 min at room temperature
to allow color development. Absorbance was measured
against the blank reagent at 765 nm using a
spectrophotometer (Spectramax M5, Molecular Devices,
USA). Gallic acid at a concentration range of 0.1 to 1.0
mg/ml was used as standards. TPC was expressed as mg
gallic acid equivalents (GAE)/g sample. Each extract was
analyzed in three replicates.
Antioxidant activity determination
DPPH assay
The free radical-scavenging ability of the extracts (pre-
diluted in the ratio of 1:10) was evaluated as described by
Liu et al.8. To 1 ml of 0.1 mM ethanolic solution of DPPH,
33.3 µl of test extracts/standard was added. The mixture
was incubated at 30 °C in the dark for 30 min and the
discoloration was measured at 517 nm using a
spectrophotometer. Radical scavenging activity (%DPPH)
was calculated using the equation below:
%DPPH = 𝐴𝑐𝑜𝑛𝑡 − 𝐴𝑠𝑎𝑚𝑝
𝐴𝑐𝑜𝑛𝑡 x 100% (2)
where Acont was the absorbance of the control, and Asamp
was the absorbance of the sample. DPPH• scavenging
activity was then expressed as mg GAE/g sample based on
the calibration curve. Each extract was analyzed in three
replicates
FRAP assay
The ferric reducing antioxidant power (FRAP) of banana
leaf extract was estimated using the method described by
Benzie and Strain9. The reducing activity was determined
by assessing the ability to reduce FeCl3 solution. A mixture
of 2.5 ml of a 10 mM tripyridyltriazine (TPTZ) solution in
40 mM hydrochloric acid, 2.5 ml of 20 mM FeCl36H2O
(ferric chloride hexahydrate) and 25 ml of 0.3 M acetate
buffer at pH 3.6 was prepared as FRAP reagent. The freshly
prepared FRAP working reagent was pre-warmed at 37 °C
and then 600 μl of the FRAP reagent was added to 8.1 μl of
extract. The absorbance was measured at 593 nm against
the blank after 1 hour of incubation at 37 °C. FRAP value
was calculated and expressed as mM Fe2+ equivalent
(Fe(II)). All determinations were performed in three
replicates.
α-Amylase inhibition assay
Prior to analysis, the alcohol was removed from the sample
using a vacuum concentrator (Concentrator 5301,
Gan et al. / Extraction and Identification of Antidiabetic…
IJPPR, Volume 7, Issue 3, June 2015- July 2015 Page 463
Eppendorf, Germany) and distilled deionised water was
used to reconstitute the extract.
The α-amylase inhibitory assay was carried out using the
method described by Ranilla et al.10. α-Amylase enzyme
solution (1 mg/ml) was prepared using 0.02 M sodium
phosphate buffer containing 6.0 mM sodium chloride at pH
6.9. A starch solution (1%, w/v) was prepared in 0.02 M
sodium phosphate buffer and heated in boiling water for 30
min in order to solubilize the starch. To each tube, 100 μl
of α-amylase solution and sample were mixed and
incubated at 25 °C for 10 min. Starch solution (100 μl) was
then added into the mixture, followed by incubation at
25 °C for 10 min. Subsequently, 200 μl of dinitrosalicylic
acid was added and heated in boiling water bath for 5 min.
The mixture was cooled to room temperature and diluted
with 3 ml of distilled water. The absorbance was measured
at 540 nm using a spectrophotometer.
The α-amylase inhibitory activity was calculated as follows:
% inhibition = 𝐴𝐶𝑜𝑛𝑡𝑟𝑜𝑙 2−(𝐴𝑠𝑎𝑚𝑝𝑙𝑒−𝐴𝐶𝑜𝑛𝑡𝑟𝑜𝑙 1)
AControl 2 100 (3)
where Asample was the absorbance of sample, Acontrol 1 was
the absorbance of a mixture of starch solution and sample
without addition of enzyme and Acontrol 2 was defined as a
mixture of starch solution and enzyme without addition of
sample. All tests were performed in three replicates.
Identification of phytochemicals using LC Q-TOF MS
Sample Preparation
The extracted sample was pre-diluted and then filtered
through a 0.45 µm filter prior to analysis using Agilent
6520 Accurate-Mass Quadrupole Time-of-Flight (Q-TOF)
LC/MS (Agilent Technologies, USA).
LC-Q-TOF MS and MSMS analyses
The MS and MSMS analyses were carried out using
positive mode electrospray ionization (ESI) which was
equipped with 1200 series (Agilent Technologies, USA)
gradient pump. The separation was performed using an
Agilent ZORBAX SB-C18 column with a diameter of 0.5
mm, length of 150.0 mm and particle size of 5.0 µm. The
operating conditions were: injection volume: 5 µL; mobile
phase: (A) distilled water with 0.1 % formic acid, (B)
acetonitrile with 0.1% formic acid; flow rate: 20 µL/min.
The pump gradient was: 0 min, 3 % B; 3.75 min, 20 % B;
8.75 min, 40 % B; 15-17.5 min, 90 % B; 22.5-32.5 min, 3 %
B. For MS analysis, dry gas temperature of 325 °C, gas
flow rate of 5 L/min, nebulizer pressure of 30 psi and
capillary voltage of 3500 V were used. The acquisition
mode was set at the m/z range of 25-1600, with a scan rate
of 1 spectra/ms. For MSMS analysis, collision energies of
20-40 eV were used. The other conditions were the same as
the MS analysis.
Database search of the unknown compounds
The results obtained from the Agilent MassHunter
Workstation Software – Data Acquisition were processed
using the MassHunter Qualitative Analysis software.
Molecular feature extraction (MFE) was performed in order
to determine the molecular masses. The molecular feature
extraction was carried out using the following setting:
target data type: small molecules (chromatographic); peak
filters: above 5000 counts (to eliminate the background
noise in order to obtain the high-quality fragment spectra);
positive ions: +H, +Na, +K (potential cation adduct that
present in the extract); isotope mode: common organic
molecules and charge state: limit assigned charge states to
a maximum of 1.
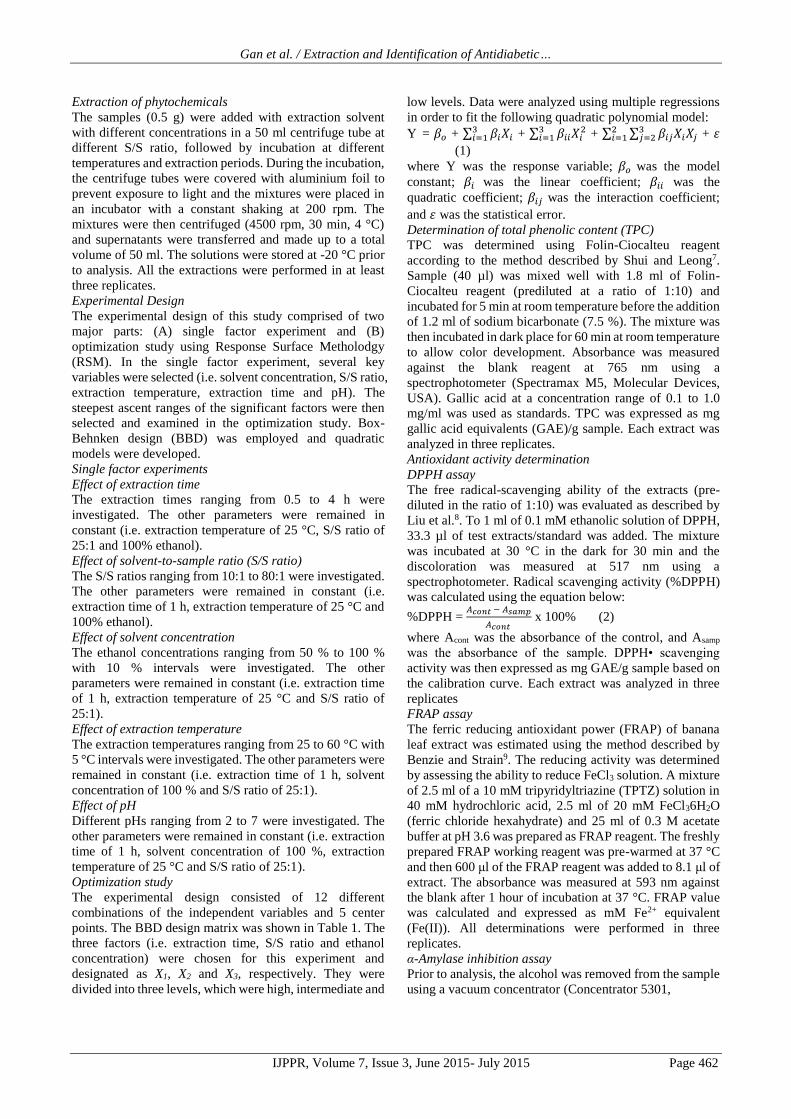
Table 1 BBD with the observed responses and predicted values for TPC, DPPH, FRAP and α-amylase inhibition
activity.
Run Independent variables Dependent variables (responses)
X1
(h)
X2
(ml/g)
X3
(%)
TPC
(mg GAE/ g
sample)
DPPH
(mg GAE/ g
sample)
FRAP (mM
FE2SO4)
-amylase
inhibition
activity (%)
Expt.a Pred.b Expt.a Pred.b Expt.a Pred.b Expt.a Pred.b
1 0.5 10 70 9.54 9.74 1.6 1.61 3.89 4.10 3.62 4.26
2 0.5 30 50 18.29 17.97 4.43 4.64 6.64 6.72 7.08 5.89
3 1.25 30 70 18.68 18.74 6.85 6.96 5.98 5.98 11.11 11.21
4 2 10 70 10.50 10.72 2.37 2.24 4.17 4.44 2.82 1.26
5 2 30 90 19.23 19.54 6.27 6.06 8.97 8.90 12.71 13.90
6 0.5 30 90 19.81 20.14 6.03 5.69 7.72 7.72 25.62 24.61
7 2 30 50 16.29 15.95 4.32 4.66 5.57 5.58 9.02 10.03
8 1.25 10 50 6.90 7.01 1.32 1.10 2.35 2.07 5.67 6.21
9 1.25 50 50 18.49 19.02 7.45 7.12 7.23 7.43 8.34 7.97
10 0.5 50 70 22.08 21.86 6.9 7.03 9.35 9.08 10.23 11.79
11 1.25 30 70 18.89 18.74 7.35 6.96 6.04 5.98 11.60 11.21
12 1.25 10 90 12.62 12.08 3.03 3.37 5.13 4.93 11.66 12.02
13 2 50 70 18.46 18.26 6.78 6.78 8.98 8.78 8.87 8.22
14 1.25 30 70 18.67 18.74 7.08 6.96 5.99 5.98 12.36 11.21
15 1.25 50 90 19.83 19.71 7.1 7.31 8.62 8.90 25.30 24.75
16 1.25 30 70 19.31 18.74 7.05 6.96 5.71 5.98 10.95 11.21
17 1.25 30 70 18.14 18.74 6.45 6.96 6.19 5.98 10.04 11.21 a Mean of triplicate determinations b Predicted values

Gan et al. / Extraction and Identification of Antidiabetic…
IJPPR, Volume 7, Issue 3, June 2015- July 2015 Page 464
11.012.013.014.015.016.017.018.019.0
0 2 4
TP
C (
mg G
AE
/g s
amp
le)
Extraction Time (h)
0.0
1.0
2.0
3.0
4.0
5.0
0 2 4
DP
PH
(m
g G
AE
/g s
amp
le)
Extrraction Time (h)
2.0
2.2
2.4
2.6
2.8
3.0
0 1 2 3 4
FR
AP
(m
M F
E₂S
O₄)
Extraction Time (h)
20.0
21.0
22.0
23.0
24.0
25.0
26.0
0 1 2 3 4
α-a
myla
se i
nhib
itio
n a
ctiv
ity
(%)
Extraction Time (h)
0.0
2.0
4.0
6.0
8.0
10.0
0 20 40 60 80
TP
C (
mg G
AE
/g s
amp
le)
Solvent-to-Sample Ratio (ml/g)
0.0
0.5
1.0
1.5
2.0
2.5
3.0
3.5
0 20 40 60 80
DP
PH
(m
g G
AE
/g s
amp
le)
Solvent-to-Sample Ratio (ml/g)
0.0
1.0
2.0
3.0
4.0
5.0
6.0
0 20 40 60 80
FR
AP
(m
M F
E₂S
O₄)
Solvent-to-Sample Ratio (ml/g)
0.0
10.0
20.0
30.0
40.0
50.0
60.0
0 20 40 60 80
α-a
myla
se i
nhib
itio
n a
ctiv
ity
(%)
Solvent-to-Sample Ratio (ml/g)

Gan et al. / Extraction and Identification of Antidiabetic…
IJPPR, Volume 7, Issue 3, June 2015- July 2015 Page 465
After the MFE search, the mass list was uploaded to the
metabolite search in batches using the METLIN Metabolite
Database. The mass list was searched against the neutral
mass in the database with accuracy less than 5 ppm of mass
difference. The matched MS/MS spectra of compounds
were verified using Mass FrontierTM 6.0. In Mass Frontier
analysis, fragments were generated using all possible rules,
including aromatic rings, the default limit of 10 000
fragments per iteration, and four iterations. These spectra
were compared to the experimental MSMS spectra. The
compound was predicted based on the fragment ions.
Standards were also used to perform the verification of data.
Statistical analysis
Comparison of means was performed using one-way
analysis of variance (ANOVA) followed by Duncan’s test.
This statistical analysis in the single factor experiment was
performed using statistical software package SPSS for
Windows, Version 12.0 (SPSS Institute, Inc., Cary, NC,
USA) whereas Design-Expert software (Version 6.0, Stat-
Ease, Inc., Minneapolis, MN) was used in optimization
study.
RESULTS AND DISCUSSION
Single factor experiment
Type of solvent is an important variable for phytochemical
extraction. Generally, extraction of phenolic components
from plant materials using alcohol were applied because of
its efficiency in giving a high extraction yield. Apart from
that, ethanol is a better choice compared to methanol
because the latter shown its cytotoxic nature. The use of
ethanol is also considered as environmentally friendly and
it is classified as GRAS (Generally Recognized as Safe).
Thus, ethanolic extraction of antioxidant compounds from
herbs were widely studied (Chan et al., 2009). In the
preliminary study, several commonly used extraction
solvents (i.e. acetone, n-hexane, methanol, ethanol and
water) were first investigated and result showed that
ethanol and methanol gave the highest score for the
responses (i.e. TPC, DPPH• scavenging activity, FRAP and
amylase inhibition activity)(data not shown). In regards to
the advantages of ethanol aforementioned, ethanol was
chosen as the extraction solvent for this study. Following,
five extraction parameters (i.e. extraction time, S/S ratio,
ethanol concentration, pH and extraction temperature) were
investigated. The four targeted responses were TPC,
DPPH• scavenging activity, FRAP and amylase inhibition
activity.
Effect of extraction time
In this study, a range of extraction time was designed based
on the practical and economical aspects. The responses as
a function of extraction time were shown in Fig. 1a (i-iv).
Result showed that as the extraction time increased from
0.5 to 2 h, all the responses increased. The highest values
obtained at 2 h of extraction were: TPC of 16.92 mg GAE/g
sample, DPPH• scavenging activity of 3.92 mg GAE/g
sample, FRAP of 14.03 mM Fe2SO4 and amylase inhibition
activity of 24.80%. However, each response showed a
negative gradient after 2 h of extraction. According to Silva
et al.11, excessive extraction time was not just ineffective in
extraction but also caused degradation to the extracted
Fig. 1 Effects of (a) extraction time, (b) S/S ratio and (c) ethanol concentration on the (i) TPC, (ii) DPPH• scavenging
activity, (iii) FRAP activity and (iv) amylase inhibition activity of “Pisang Awak” leaves extract.
11.0
13.0
15.0
17.0
19.0
40 60 80 100TP
C (
mg G
AE
/g s
amp
le)
Ethanol Concentration (%)
5.0
5.5
6.0
6.5
7.0
7.5
8.0
8.5
40 60 80 100
DP
PH
(m
g G
AE
/g s
amp
le)
Ethanol Concentration (%)
7.0
9.0
11.0
13.0
15.0
40 60 80 100
FR
AP
(m
M F
E₂S
O₄)
Ethanol Concentration (%)
0.0
5.0
10.0
15.0
20.0
25.0
30.0
40 60 80 100α-a
myla
se i
nhib
itio
n a
ctiv
ity
(%)
Ethanol concentration (%)
Gan et al. / Extraction and Identification of Antidiabetic…
IJPPR, Volume 7, Issue 3, June 2015- July 2015 Page 466
phenolic components and thus loss its activity due to
oxidation after the exposure to light or oxygen12. Fick’s
second law of diffusion also stated that final equilibrium
will be achieved between the plant matrix and solvent after
a certain time. Hence, an excessive extraction time was not
useful to extract more phytochemicals11. From the
industrial perspective, shorter extraction time is preferred
as less process time consumed and economical. Taking into
account of these facts, extraction times of 0.5-2 h were
selected for RSM optimization study.
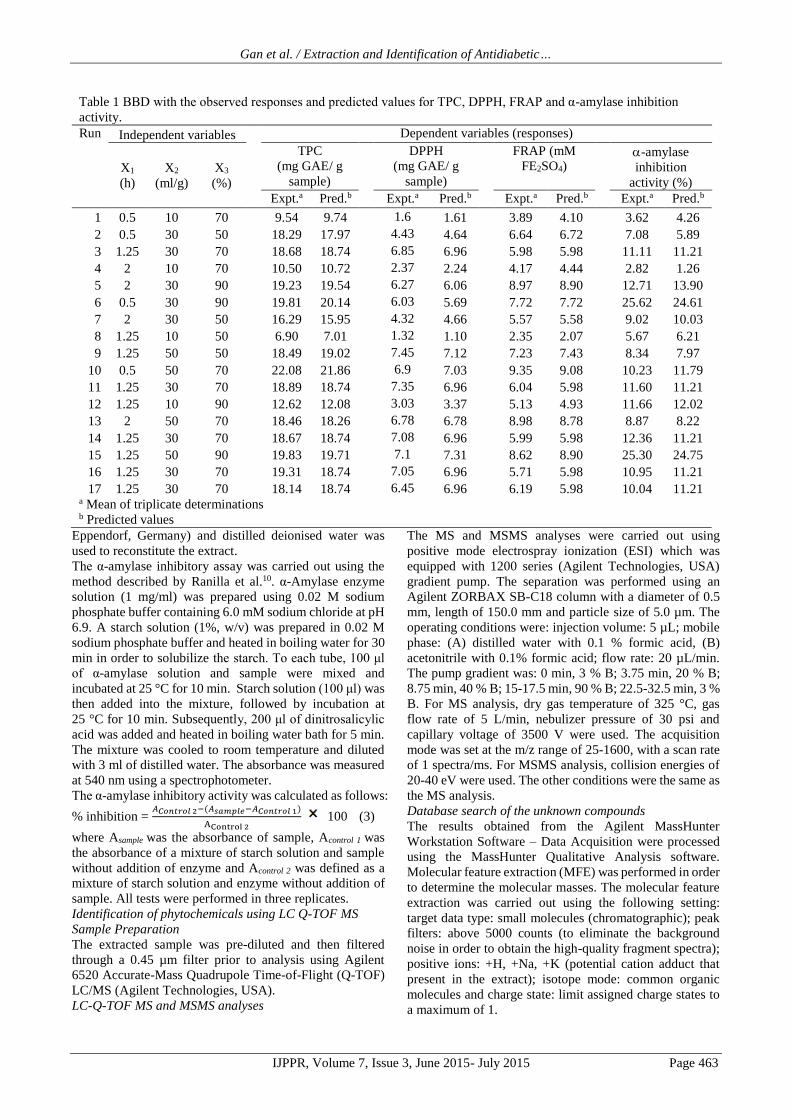
Table 2 ANOVA for response surface quadratic model: the estimated regression model of relationship between
dependent variables and independent variables.
Source Sum of Squares DF Mean Square F Val ue Prob > F
TPC (mg GAE/ g sample)a
Model 285.5 9 31.722 115.75 < 0.0001
X1 3.437 1 3.4366 12.54 0.0095
X2 193 1 193 704.25 < 0.0001
X3 16.59 1 16.593 60.545 0.0001
X22 59.78 1 59.778 218.13 < 0.0001
X1X2 5.252 1 5.2517 19.16 0.0032
X2X3 4.795 1 4.7946 17.49 0.0041
Residual 1.918 7 0.2741
Lack of Fit 1.2 3 0.3999 2.226 0.2275
DPPH (mg GAE/ g sample)b
Model 71.8 9 7.982 50.52 < 0.0001
X2 49.6 1 49.584 313.79 < 0.0001
X3 3.0 1 3.022 19.12 0.0033
X12 1.1 1 1.068 6.76 0.0013
X22 4.2 1 4.232 26.78 < 0.0001
X32 10.0 1 9.986 63.19 0.0092
X2X3 2.0 1 2.005 12.69 0.0355
Residual 1.1 7 0.158
Lack of Fit 0.7 3 0.220 1.98 0.2596
FRAP (mM FE2SO4)c
Model 59.7 9 6.639 78.57 < 0.0001
X2 43.4 1 43.41 513.77 < 0.0001
X3 9.35 1 9.351 110.68 < 0.0001
X12 4.26 1 4.26 50.42 0.0002
X22 0.63 1 0.632 7.47 0.0292
X1X3 1.35 1 1.348 15.95 0.0052
X2X3 0.49 1 0.487 5.76 0.0475
Residual 0.59 7 0.084
Lack of Fit 0.47 3 0.156 5.11 0.0746
-amylase inhibition activity (%)d
Model 591.80 9 65.76 32.07 < 0.0001
X1 21.58 1 21.58 10.52 0.0142
X2 104.88 1 104.88 51.16 0.0002
X3 255.21 1 255.21 124.49 < 0.0001
X12 16.50 1 16.50 8.05 0.0252
X22 34.16 1 34.16 16.66 0.0047
X32 80.66 1 80.66 39.34 0.0004
X1X3 55.15 1 55.15 26.90 0.0013
X2X3 30.11 1 30.11 14.69 0.0064
Residual 14.35 7 2.05
Lack of Fit 11.44 3 3.81 5.24 0.0717 a The coefficient of determination (R2) and adjusted R2 of the model were 0.9933 and 0.9848 respectively. b The coefficient of determination (R2) and adjusted R2 of the model were 0.9848 and 0.9653 respectively. c The coefficient of determination (R2) and adjusted R2 of the model were 0.9902 and 0.9776 respectively. d The coefficient of determination (R2) and adjusted R2 of the model were 0.9763 and 0.9459 respectively.
Gan et al. / Extraction and Identification of Antidiabetic…
IJPPR, Volume 7, Issue 3, June 2015- July 2015 Page 467
Effect of solvent-to-sample ratio (S/S ratio)
The impact of the S/S ratio (i.e. 10:1; 20:1; 30:1; 40:1; 50:1,
60:1, 70:1 and 80:1) on the targeted responses were
investigated at a temperature of 25 °C for a constant
extraction period of 1 h using 100% ethanol. It could be
observed that the TPC of the extract increased as the S/S
ratio increased (Fig. 1b (i)). The result of the one-way
analysis of variance (ANOVA) showed that there was a
highly significant (p<0.05) difference between the S/S ratio
of 10 and 50 ml/g. It was also found that the activities of
DPPH• scavenging and FRAP increased as the ratio of S/S
increased. Theoretically, high solvent volume gave better
efficiency in eluting of the antioxidative components due to
the excessive swelling of the material. This occurrence
created a large concentration difference between the
interior of the banana leaves and the external solvent, thus
prompted a higher diffusion rate of solute particles and
released more phytochemical molecules in the solution.
However, a limited source of antioxidant material was used
in this study; an excessive solvent could cause a dilution to
the extracted components. Therefore, further increase the
volume of solvent would not bring any significant effects
to the responses. The ANOVA analysis showed that there
was no statistically significant (p>0.05) differences when
the S/S ratio was more than 50 ml/g in both TPC (Fig. 1b
(i)) and DPPH• scavenging activity (Fig. 1b (ii)). α-
Amylase inhibitory activity was found to exhibit a negative
trend. Increase in the S/S ratio led to a decrease of
antidiabetic activity. Similar result was reported by Li et
al.13. Even though there was a significant (p<0.05) increase
in FRAP at S/S ratio of 70 and 80 ml/g, a dramatic drop of
α-amylase inhibition activity from ratio 40 to 50 ml/g was
observed. Thus, the range of S/S ratio was chosen from
10:1 to 50:1.
Effect of ethanol concentration
The high activity of the ethanolic extracts was exhibited as
compared to the aqueous extract can be attributed to the
presence of higher amounts of polyphenols. Aqueous
ethanol was found to be more efficient in cell walls and
seeds degradation, thus led to the release of phytochemicals
from leaves. Apart from that, aqueous ethanol enhanced the
solubility of phytochemicals12. However, the ethanol
concentration in this solvent has to be investigated in order
to be used as a highly efficient extracting agent. The TPC,
DPPH• scavenging activity, FRAP and amylase inhibitory
activity of the extract as a function of the ethanol
concentration were shown in Fig. 1c (i-iv).
All the dependent variables were highly dependent on the
ethanol concentration employed for the extraction. As the
ethanol concentration increased from 50 to 90%, a
significant (p<0.05) increasing pattern was observed in
each response whereas using an absolute ethanol caused a
decrease in the responses. The phytochemicals extracted
using 90% ethanol reached a maximum value in all
responses and further increase in ethanol concentration
showed that there was a significant decrement in the FRAP.
Addition of a small quantity of water (10%) to ethanol
seemed to enhance the extraction efficiency significantly
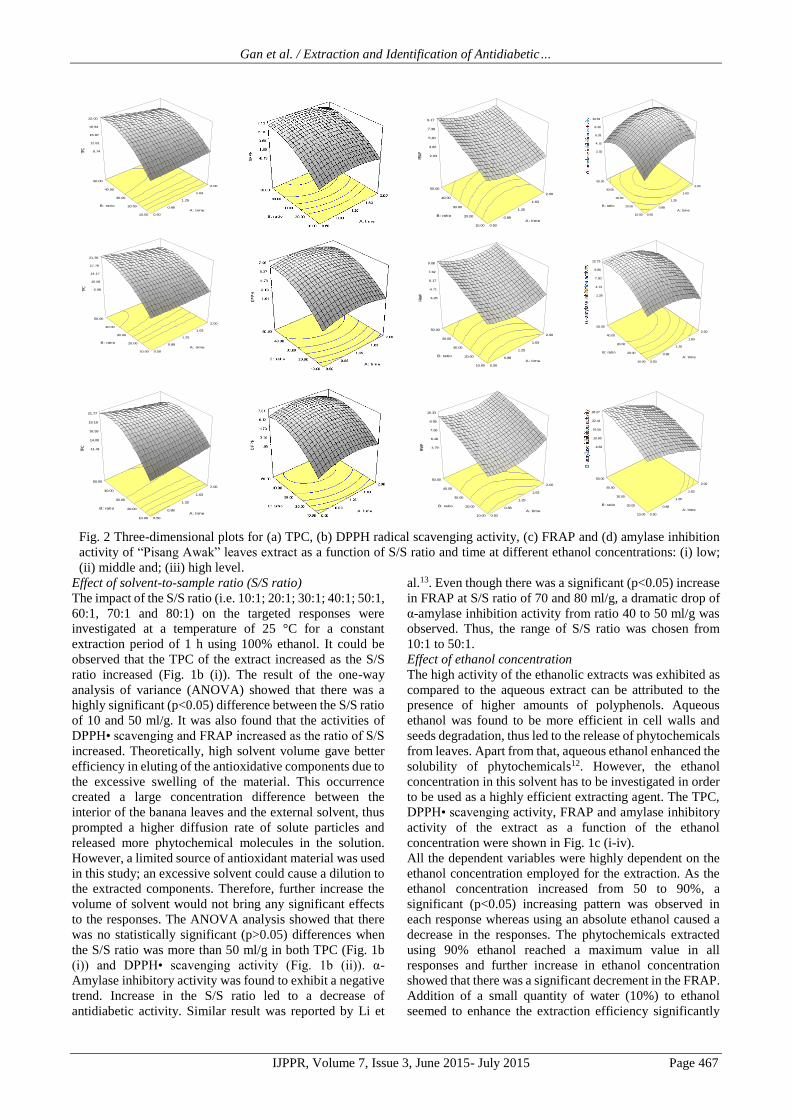
Fig. 2 Three-dimensional plots for (a) TPC, (b) DPPH radical scavenging activity, (c) FRAP and (d) amylase inhibition
activity of “Pisang Awak” leaves extract as a function of S/S ratio and time at different ethanol concentrations: (i) low;
(ii) middle and; (iii) high level.
DESIGN-EXPERT Plot
TPCX = A: timeY = B: ratio
Actual FactorC: ethanol = 70.00
9.74
12.81
15.87
18.94
22.00
TPC
0.50
0.88
1.25
1.63
2.00
10.00
20.00
30.00
40.00
50.00
A: time
B: ratio
DESIGN-EXPERT Plot
FRAPX = A: timeY = B: ratio
Actual FactorC: ethanol = 50.00
2.03
3.82
5.60
7.38
9.17
FRA
P
0.50
0.88
1.25
1.63
2.00
10.00
20.00
30.00
40.00
50.00
A: time
B: ratio
DESIGN-EXPERT Plot
TPCX = A: timeY = B: ratio
Actual FactorC: ethanol = 50.00
6.98
10.58
14.17
17.76
21.36
TPC
0.50
0.88
1.25
1.63
2.00
10.00
20.00
30.00
40.00
50.00
A: time
B: ratio
DESIGN-EXPERT Plot
FRAPX = A: timeY = B: ratio
Actual FactorC: ethanol = 70.00
3.26
4.71
6.17
7.62
9.08
FRA
P
0.50
0.88
1.25
1.63
2.00
10.00
20.00
30.00
40.00
50.00
A: time
B: ratio
DESIGN-EXPERT Plot
TPCX = A: timeY = B: ratio
Actual FactorC: ethanol = 90.00
11.41
14.00
16.59
19.18
21.77
TPC
0.50
0.88
1.25
1.63
2.00
10.00
20.00
30.00
40.00
50.00
A: time
B: ratio
DESIGN-EXPERT Plot
FRAPX = A: timeY = B: ratio
Actual FactorC: ethanol = 90.00
4.79
6.18
7.56
8.95
10.33
FRA
P
0.50
0.88
1.25
1.63
2.00
10.00
20.00
30.00
40.00
50.00
A: time
B: ratio
DESIGN-EXPERT Plot
ADX = A: timeY = B: ratio
Actual FactorC: ethanol = 50.00
2.02
4.15
6.28
8.40
10.53
AD
0.50
0.88
1.25
1.63
2.00
10.00
20.00
30.00
40.00
50.00
A: time
B: ratio
DESIGN-EXPERT Plot
ADX = A: timeY = B: ratio
Actual FactorC: ethanol = 70.00
1.26
4.13
7.00
9.86
12.73
AD
0.50
0.88
1.25
1.63
2.00
10.00
20.00
30.00
40.00
50.00
A: time
B: ratio
DESIGN-EXPERT Plot
ADX = A: timeY = B: ratio
Actual FactorC: ethanol = 90.00
4.83
10.69
16.55
22.41
28.27
AD
0.50
0.88
1.25
1.63
2.00
10.00
20.00
30.00
40.00
50.00
A: time
B: ratio
Gan et al. / Extraction and Identification of Antidiabetic…
IJPPR, Volume 7, Issue 3, June 2015- July 2015 Page 468
(p<0.05). This could be explained by the increase of the
polarity of the solvent, which enable the solvent system to
extract phenolic substances from different polarities. Silva
et al.11 reported that the optimal yields of extraction from
Inga edulis leaves and Ligustrum lucidum were found using
80-90% ethanol. Therefore, 50%, 70% and 90% were
selected as the low, middle and high levels, respectively, to
be employed in RSM optimization study.
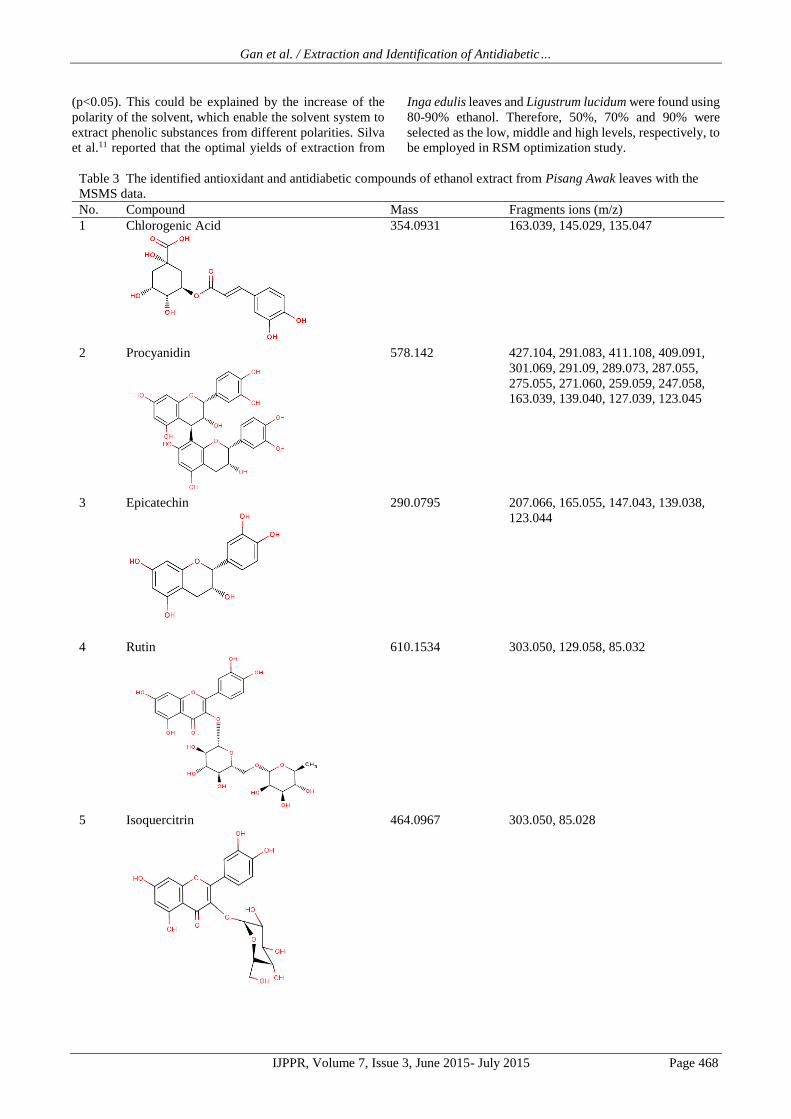
Table 3 The identified antioxidant and antidiabetic compounds of ethanol extract from Pisang Awak leaves with the
MSMS data.
No. Compound Mass Fragments ions (m/z)
1 Chlorogenic Acid
354.0931 163.039, 145.029, 135.047
2 Procyanidin
578.142 427.104, 291.083, 411.108, 409.091,
301.069, 291.09, 289.073, 287.055,
275.055, 271.060, 259.059, 247.058,
163.039, 139.040, 127.039, 123.045
3 Epicatechin
290.0795 207.066, 165.055, 147.043, 139.038,
123.044
4 Rutin
610.1534 303.050, 129.058, 85.032
5 Isoquercitrin
464.0967 303.050, 85.028

Gan et al. / Extraction and Identification of Antidiabetic…
IJPPR, Volume 7, Issue 3, June 2015- July 2015 Page 469
Effect of extraction temperature and pH
Extraction temperature and pH are also important
parameters, which commonly used in optimizing the
extraction condition. However, the result revealed that the
responses were not significantly (p>0.05) affected by the
temperature and pH (data not shown). Therefore, room
temperature (25 °C) was chosen as incubation temperature
and pH was not monitored in the optimization study.
Optimization study
To optimize the extraction parameters, BBD was employed
by engaging the selected factor based on the steepest ascent
ranges: incubation time (0.5 – 2 h), solvent-to-sample ratio
(10 – 50 ml/g) and concentration of ethanol (50 – 90%).
The experimental and predicted results of 17 trials
extraction using BBD were shown in Table 1. The highest
yield of TPC (22.08 mg GAE/g sample) was obtained in
run No. 10 with experimental variables of extraction time
of 0.5 h, S/S ratio of 50 ml/g and 70% of ethanol. The
lowest TPC (6.9 mg GAE/g sample) was obtained in run
No. 8 under experimental conditions of extraction time of
1.25 h, S/S ratio of 10 ml/g and 50% of ethanol. Apart from
that, the experimental results showed that DPPH•
scavenging activity and FRAP were ranged from 1.6 – 7.45
mg GAE/g sample and 2.35 – 9.35 mM Fe2SO4, respectively. The maximum DPPH• scavenging activity
was obtained in run No. 9 at extraction time of 1.25 h,
solvent-to-sample ratio of 50 ml/g and 50% ethanol;
whereas the highest FRAP was recorded in run No. 10,
which also showed the highest TPC value. A broad range
of α-amylase inhibition activity were found (2.82 – 25.62%)
and the highest inhibitory activity was achieved under the
condition of extraction time of 0.5 h, solvent-to-sample
ratio of 30 ml/g and 90% of ethanol.
Model fitting
Table 2 showed the quadratic model relating the effect of
the independent variables; their interaction and regression
coefficients of the response variables were generated by
analysis of variance (ANOVA). The statistical significance
of the model was also measured by the F-test and the
residuals analysis were performed to validate the model at
95% confidence level. The regression coefficients and the
response surfaces were used to investigate the effect of
variables on the TPC, antioxidant and amylase inhibition
activities. In order to check the significance level of the
corresponding variables, p-value was determined. A
smaller p-value or a greater F-value indicates a more
significant of the variable. In addition, the lack-of-fit was
used to check whether the estimated model fitted to the
actual shape of the surface. The insignificance (p>0.05) of
the lack–of-fit indicates that the model was well fitted to
the experiment data, whereas high coefficient of
determination (R2) illustrated that the model was well
adapted to the response12.
TPC
The ANOVA showed that the model was highly significant
as a very low p-value (p<0.0001) was obtained in TPC
(Table 2). Table 2 showed that R2 value for the regression
model of TPC was 0.9933. This value suggested that the
predicted model was well defined to the real behaviour of
the system. The insignificance (p>0.05) of the lack-of-fit
had also proven the reliability of the models. It could be
observed in Table 2 that X1, X2, X3, X22, X1X2 and X2X3
were highly significant (p<0.01). The largest effects were
exhibited by X2 and X22 followed by X3. The relationship
between the tested independent variables and TPC could be
explained using Eq. (4):
TPC = –13.36851 – 1.02200X1 + 1.09786X2 + 0.30336X3
+ 0.31449X12 –0.00941983X2
2 – 0.00127692X32 –
0.076389X1X2 + 0.023622X1X3 – 0.00273708X2X3 (4)
DPPH• scavenging activity
The predicted model was highly significant (p<0.0001) and
the R2 value of this model was 0.9848. No significance
(p>0.05) of lack-of-fit was found and this value would give
a relatively good fit to the mathematic model. Based on the
p-value, it can be seen that the variable with the largest
effect on the DPPH• scavenging activity was X2 and X22
followed by X12, X3, X3
2 and X2X3. Eq. (5) showed the
mathematic model of the DPPH• scavenging activity:
DPPH = –16.54819 + 4.62444X1 + 0.46418X2 +
0.30370X3 –1.78311X12 –0.00385125X2
2 0.00172625X32
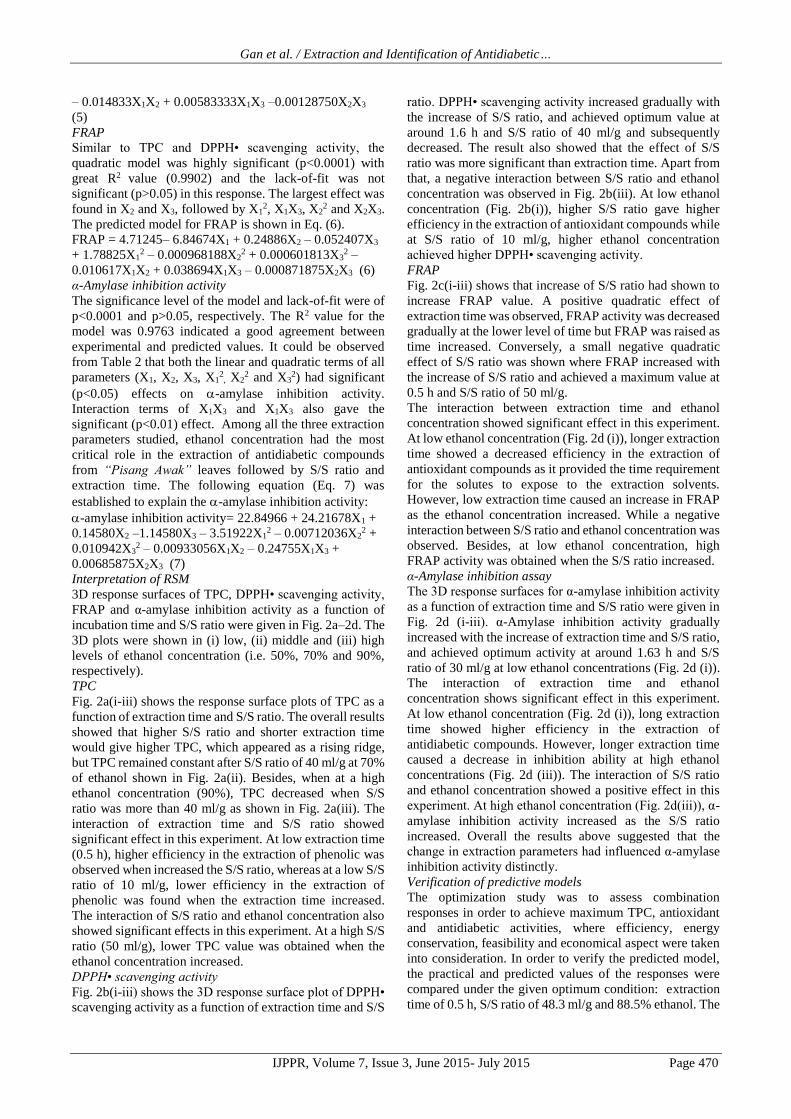
6 Quercetin
302.0433 299.047, 285.039, 274.048, 257.041,
165.016, 153.017, 137.022, 121.027,
109.028, 95.049, 81.032, 68.997,
55.0174
7 Kaempferol-7-neohesperidoside
594.1585 449.108, 287.055, 147.065, 145.049,
129.054, 85.028, 71.049
Gan et al. / Extraction and Identification of Antidiabetic…
IJPPR, Volume 7, Issue 3, June 2015- July 2015 Page 470
– 0.014833X1X2 + 0.00583333X1X3 –0.00128750X2X3
(5)
FRAP
Similar to TPC and DPPH• scavenging activity, the
quadratic model was highly significant (p<0.0001) with
great R2 value (0.9902) and the lack-of-fit was not
significant (p>0.05) in this response. The largest effect was
found in X2 and X3, followed by X12, X1X3, X2
2 and X2X3.
The predicted model for FRAP is shown in Eq. (6).
FRAP = 4.71245– 6.84674X1 + 0.24886X2 – 0.052407X3
+ 1.78825X12 – 0.000968188X2
2 + 0.000601813X32 –
0.010617X1X2 + 0.038694X1X3 – 0.000871875X2X3 (6)
α-Amylase inhibition activity
The significance level of the model and lack-of-fit were of
p<0.0001 and p>0.05, respectively. The R2 value for the
model was 0.9763 indicated a good agreement between
experimental and predicted values. It could be observed
from Table 2 that both the linear and quadratic terms of all
parameters (X1, X2, X3, X12
, X22 and X3
2) had significant
(p<0.05) effects on -amylase inhibition activity.
Interaction terms of X1X3 and X1X3 also gave the
significant (p<0.01) effect. Among all the three extraction
parameters studied, ethanol concentration had the most
critical role in the extraction of antidiabetic compounds
from “Pisang Awak” leaves followed by S/S ratio and
extraction time. The following equation (Eq. 7) was
established to explain the -amylase inhibition activity:
-amylase inhibition activity= 22.84966 + 24.21678X1 +
0.14580X2 –1.14580X3 – 3.51922X12 – 0.00712036X2
2 +
0.010942X32 – 0.00933056X1X2 – 0.24755X1X3 +
0.00685875X2X3 (7)
Interpretation of RSM
3D response surfaces of TPC, DPPH• scavenging activity,
FRAP and α-amylase inhibition activity as a function of
incubation time and S/S ratio were given in Fig. 2a–2d. The
3D plots were shown in (i) low, (ii) middle and (iii) high
levels of ethanol concentration (i.e. 50%, 70% and 90%,
respectively).
TPC
Fig. 2a(i-iii) shows the response surface plots of TPC as a
function of extraction time and S/S ratio. The overall results
showed that higher S/S ratio and shorter extraction time
would give higher TPC, which appeared as a rising ridge,
but TPC remained constant after S/S ratio of 40 ml/g at 70%
of ethanol shown in Fig. 2a(ii). Besides, when at a high
ethanol concentration (90%), TPC decreased when S/S
ratio was more than 40 ml/g as shown in Fig. 2a(iii). The
interaction of extraction time and S/S ratio showed
significant effect in this experiment. At low extraction time
(0.5 h), higher efficiency in the extraction of phenolic was
observed when increased the S/S ratio, whereas at a low S/S
ratio of 10 ml/g, lower efficiency in the extraction of
phenolic was found when the extraction time increased.
The interaction of S/S ratio and ethanol concentration also
showed significant effects in this experiment. At a high S/S
ratio (50 ml/g), lower TPC value was obtained when the
ethanol concentration increased.
DPPH• scavenging activity
Fig. 2b(i-iii) shows the 3D response surface plot of DPPH•
scavenging activity as a function of extraction time and S/S
ratio. DPPH• scavenging activity increased gradually with
the increase of S/S ratio, and achieved optimum value at
around 1.6 h and S/S ratio of 40 ml/g and subsequently
decreased. The result also showed that the effect of S/S
ratio was more significant than extraction time. Apart from
that, a negative interaction between S/S ratio and ethanol
concentration was observed in Fig. 2b(iii). At low ethanol
concentration (Fig. 2b(i)), higher S/S ratio gave higher
efficiency in the extraction of antioxidant compounds while
at S/S ratio of 10 ml/g, higher ethanol concentration
achieved higher DPPH• scavenging activity.
FRAP
Fig. 2c(i-iii) shows that increase of S/S ratio had shown to
increase FRAP value. A positive quadratic effect of
extraction time was observed, FRAP activity was decreased
gradually at the lower level of time but FRAP was raised as
time increased. Conversely, a small negative quadratic
effect of S/S ratio was shown where FRAP increased with
the increase of S/S ratio and achieved a maximum value at
0.5 h and S/S ratio of 50 ml/g.
The interaction between extraction time and ethanol
concentration showed significant effect in this experiment.
At low ethanol concentration (Fig. 2d (i)), longer extraction
time showed a decreased efficiency in the extraction of
antioxidant compounds as it provided the time requirement
for the solutes to expose to the extraction solvents.
However, low extraction time caused an increase in FRAP
as the ethanol concentration increased. While a negative
interaction between S/S ratio and ethanol concentration was
observed. Besides, at low ethanol concentration, high
FRAP activity was obtained when the S/S ratio increased.
α-Amylase inhibition assay
The 3D response surfaces for α-amylase inhibition activity
as a function of extraction time and S/S ratio were given in
Fig. 2d (i-iii). α-Amylase inhibition activity gradually
increased with the increase of extraction time and S/S ratio,
and achieved optimum activity at around 1.63 h and S/S
ratio of 30 ml/g at low ethanol concentrations (Fig. 2d (i)).
The interaction of extraction time and ethanol
concentration shows significant effect in this experiment.
At low ethanol concentration (Fig. 2d (i)), long extraction
time showed higher efficiency in the extraction of
antidiabetic compounds. However, longer extraction time
caused a decrease in inhibition ability at high ethanol
concentrations (Fig. 2d (iii)). The interaction of S/S ratio
and ethanol concentration showed a positive effect in this
experiment. At high ethanol concentration (Fig. 2d(iii)), α-
amylase inhibition activity increased as the S/S ratio
increased. Overall the results above suggested that the
change in extraction parameters had influenced α-amylase
inhibition activity distinctly.
Verification of predictive models
The optimization study was to assess combination
responses in order to achieve maximum TPC, antioxidant
and antidiabetic activities, where efficiency, energy
conservation, feasibility and economical aspect were taken
into consideration. In order to verify the predicted model,
the practical and predicted values of the responses were
compared under the given optimum condition: extraction
time of 0.5 h, S/S ratio of 48.3 ml/g and 88.5% ethanol. The
Gan et al. / Extraction and Identification of Antidiabetic…
IJPPR, Volume 7, Issue 3, June 2015- July 2015 Page 471
predicted values for TPC, DPPH• scavenging activity,
FRAP and amylase inhibition activity were of 21.54 mg
GAE/g sample, 6.49 mg GAE/g sample, 9.35 mM Fe2SO4
and 26.62%, respectively. In comparison, the experimental
values were 20.15 mg GAE/g sample, 6.77 GAE/g sample,
9.64 mM Fe2SO4 and 22.58%, respectively. This implied
that there was a fit degree between the values observed in
experiment and the value predicted from the regression
model. Hence, the response surface model could be applied
effectively to optimize the extraction of antioxidant and
antidiabetic compounds from “Pisang Awak” leaves. In
addition, the optimal TPC, DPPH• scavenging activity and
FRAP were much higher than the results reported by other
researchers who also studied the optimization of
antioxidant extraction from other plants12.
Phytochemicals identification
Total of 7 potential antioxidant and antidiabetic compounds
were found in the LCMS analysis. They are chlorogenic
acid, procyanidin, epicatechin, rutin, isoquercitrin,
quercetin and kaempferol-7-neohesperidoside. The
identified compounds with their molecular structures and
fragment ions were shown in Table 3. For examples, the
first compound, chlorogenic acid, is an ester of caffeic acid
with quinic acid that belongs to a type of hydroxycinnamic
acids. It exhibited an effect on the detoxification of
carcinogenic via intake of variety of fruits and vegetables,
such as coffee beans, apples, blueberries, pineapple, green
pepper and coffee14-15. It is also well-known as antioxidant
as well as inhibitor of oxidation of human low-density
lipoprotein (LDL), which is an early event in coronary
disease16. The second compounds, procyanidin, is a type of
proanthocyanidin (or condensed tannins) class
of flavonoids16. It can be found in red raspberries, cocoa
bean and chocolate14 and it plays a role as an antioxidant
compound16. On the other hand, the third compound,
epicatechin, is a type of flavanols, which belongs to the
class of flavonoids. It was found in many foods such as
green leaves and black and green tea17. Schroeter et al.18
have reported that epicatechin in cocoa and dark chocolate
has an effect in improving and maintaining cardiovascular
health. The present of epicatechin was also reported to
prevent protein oxidation by stabilizing the membrane via
hindering the approach of the peroxyl radical to erythrocyte
membranes19. The fourth compound, rutin, is a
glycosylated flavonoid. Singh et al.20 reported that rutin
from Pteris vittata L. exhibited inhibitory activity against
B. cereus, P. aeruginosa and K. pneumonia. Apart from
that, it has an effective range of medicinal use such as
enhance of symptoms related to lymphatic and venous
vessels insufficiency, hemorrhagic diseases and
hypertension21. It could also form the amylase-resistant
component via binding with fatty acids and
proanthocyanidins including flavan-3-ols to buckwheat
starch and resulted in decrease of glycemic indexes22. The
fifth compound, isoquercitrin (the 3-glucoside of
quercetin)23, is a type of flavanols, which belongs to the
flavonoids class24. It is one of the compounds that
responsible for antidiabetic through inhibition of glucose
transport. Rogerio et al.25 have reported that isoquercitrin
has anti-inflammatory properties which served as
eosinophilic suppressors in the blood and lung parenchyma.
This compound can also be found in eastern redbud, maize,
Trifolium blossoms and tobacco23. The sixth compound,
quercetin, is under subclass of anthoxanthins (flavonols)
and class of flavonoids15,24. High concentration of quercetin
can be found in olives26. It has a capability to completely
prevent LDL oxidation by scavenging free radicals and
chelating transition metal ions15,16. The elderly who
consumes 26 mg/day of quercetin via vegetables and fruit
can reduces the risk of getting coronary heart disease15.
Besides, Rogerio et al.25 reported that quercetin has anti-
inflammatory properties, which served as eosinophilic
suppressors in the blood and lung parenchyma. The seventh
compound, kaempferol-7-neohesperidoside, is a flavonoid
glycoside which was previously reported in the seeds of the
Litchi chinensis fruit and it was shown to possess anti-
proliferative effects on a variety of human cancer cell line
in vitro27. It was also reported that kaempferol glycosides
exhibit an effect in lowering blood glucose28. Referring to
these compounds, it could be suggested that Pisang Awak
leaves can be a good source for producing nutraceutical and
pharmaceutical products.
CONCLUSION
Bioactive phytochemicals from Pisang Awak leaves were
successfully extracted. Extraction time, S/S ratio and
ethanol concentration were shown to be important
extraction parameters. The optimum condition for the
extraction was: extraction time of 0.5 h, S/S ratio of 48.3
ml/g and ethanol concentration of 88.5%. Quadratic models
were successfully developed in predicting all the responses
and the results showed that experimental values were
corresponding well with the predicted values. Apart from
that, chlorogenic acid, procyanidin, epicatechin, rutin,
isoquercitrin, quercetin and kaempferol-7-
neohesperidoside were identified. This extract showed
commercial values in the nutraceutical and pharmaceutical
industries.
ACKNOWLEDGMENTS
This research work was financially supported by USM
short term grant (304/CAATS/6313145).
REFERENCES 1. Lakshmanasenthil S, Vinothkumar T, Geetharamani D,
Marudhupandi T, Suja G, Sindhu NS. Fucoidan-a novel
α-amylase inhibitor from Turbinaria ornate with
relevance to NIDDM therapy. Biocatalysis and
Agricultural Biotechnology 2014; doi:
10.1016/j.bcab.2014.02.003.
2. Bhutkar MA, Bhise SB. In vitro assay of alpha amylase
inhibitory activity of some indigenous plants.
International Journal of Chemical Sciences 2012; 10(1):
457-462.
3. Lakshmanasenthil S, Vinothkumar T, Geetharamani D,
Maruthupandi T. Screening of seaweeds collected from
southeast coastal area of India for alphaamylase
inhibitory activity, antioxidant activity and
biocompatibility. International Journal of Pharmacy and
Pharmaceutical Sciences 2013; 5: 240–244.
Gan et al. / Extraction and Identification of Antidiabetic…
IJPPR, Volume 7, Issue 3, June 2015- July 2015 Page 472
4. Mohapatra D, Mishra S, Sutar N. Banana and its by-
product utilization: an overview. Journal of Scientific &
Industrial Research 2010; 69(5): 323-329.
5. Okoli RI, Aigbe O, Ohaju-Obodo JO, Mensah JK.
Medicinal herbs used for managing some common
ailments among Esan people of Edo state, Nigeria.
Pakistan Journal of Nutrition 2007; 6(5): 490-496.
6. Sahaa RK, Acharyaa S, Shovon SSH, Royb P.
Medicinal activities of the leaves of Musa sapientum
var. sylvesteris in vitro. Asian Pacific Journal of
Tropical Biomedicine 2013; 3(6): 476-482.
7. Shui GH, Leong LP. Residue from star fruit as valuable
source for functional food ingredients and antioxidant
nutraceuticals. Food Chemistry 2006; 97(2): 277-284.
8. Liu LX, Sun Y, Laura T, Liang XF, Ye H, Zeng XX.
Determination of polyphenolic content and antioxidant
activity of kudingcha made from Ilex kudingcha C.J.
Tseng. Food Chemistry 2009; 112(1): 35-41.
9. Benzie IFF, Strain JJ. Ferric reducing/antioxidant power
assay: Direct measure of total antioxidant activity of
biological fluids and modified version for simultaneous
measurement of total antioxidant power and ascorbic
acid concentration. Methods in Enzymology 1999; 299:
15-27.
10. Ranilla LG, Apostolidis E, Genovese MI, Lajolo FM,
Shetty K. Evaluation of indigenous grains from the
Peruvian Andean region for antidiabetes and
antihypertension potential using in vitro methods.
Journal of Medicine Food 2009; 12(4): 704-713.
11. Silva EM, Rogez H, Larondelle Y. Optimization of
extraction of phenolics from Inga edulis leaves using
response surface methodology. Separation and
Purification Technology 2007; 55(3): 381-387.
12. Chan SW, Lee CY, Yap CF, Wan Aida WM, Ho CW.
Optimisation of extraction conditions for phenolic
compounds from limau purut (Citrus hystrix) peels.
International Food Research. Journal 2009;16: 203-213.
13. Li FL, Li QW, Gao DW, Peng Y. The optimal extraction
parameters and anti-diabetic activity of flavonoids from
Ipomoea batatas leaf. African Journal of Traditional
Complementary and Alternative 2009; 6(2): 195-202.
14. Giada MLR. Food phenolic compounds: main classes,
sources and their antioxidant power, Chapter 4,
Oxidative Stress and Chronic Degenerative Diseases -
A Role for Antioxidants. Intech Publishing, Brazil,
2013.
15. Rao BN. Bioactive phytochemicals in Indian foods and
their potential in health promotion and disease
prevention. Asia Pacific Journal of Clinical Nutrition
2003; 12(1), 9-22.
16. Diallo B, Vanhaelen M, Gosselain OP. Plant
constitutents involved in coating practices among
traditional African potters. Experientia 1995; 51(1): 95-
97.
17. Obanda M, Owuor PO, Taylor SJ. Flavanol composition
and caffeine content of green leaf as quality potential
indicators of Kenyan black teas. Journal of the Science
of Food and Agriculture 1997; 74(2): 209-215.
18. Schroeter H, Heiss C, Balzer J, Kleinbongard P, Keen
CL, Hollenberg NK, Kelm M. (–)-Epicatechin mediates
beneficial effects of flavanol-rich cocoa on vascular
function in humans. Proceeding of National Academic
of Sciences U.S.A. 2006; 103(4): 1024-1029.
19. Martínez V, Ugartondo V, Vinardell MP, Torres JL,
Mitjans M. Grape epicatechin conjugates prevent
erythrocyte membrane protein oxidation. Journal of
Agriculture and. Food Chemistry 2012; 60(16): 4090-
4095.
20. Singh M, Govindarajan R, Rawat AKS, Khare PB.
Antimicrobial flavonoid rutin from Pteris Vittata L.
against pathogenic gastrointestinal microflora.
American Fern Journal 2008; 98(2): 98-103.
21. Pathak D, Pathak K, Singla A. Flavonoids as medical
agents - recent advances. Fitoterapia 1991; 62: 371-389.
22. Takahama U, Hirota S. Fatty acids, epicatechin-
dimethylgallate, and rutin interact with buckwheat
starch inhibiting its digestion by amylase: Implications
for the decrease in glycemic index by buckwheat flour.
Journal of Agriculture and Food Chemistry 2010;
58(23): 12431-12439.
23. Douglass CD, Howard WL, Wender SH. The isolation
of isoquercitrin from the seed pods of Cercis canadensis.
Journal of American Chemical Society 1949; 71(8):
2658-2659.
24. Sharma G, Prakash D, Gupta C. Phytochemicals of
nutraceutical importance: Do they defend against
diseases? Chapter 1, Phytochemicals of Nutraceutical
Importance, CABI Publishing, India, 2014, 1-20.
25. Rogerio AP, Kanashiro A, Fontanari C, Silva EVG,
Lucisano-Valim YM, Soares EG, Faccioli LH. Anti-
inflammatory activity of quercetin and isoquercitrin in
experimental murine allergic asthma. Inflammation
Research 2007; 56(10): 402-408.
26. Vlahov G. Flavonoids in three olive (Olea europaea)
fruit varieties during maturation. Journal of the Science
of Food and Agriculture 1992; 58(1): 157-159.
27. Xu X, Xie H, Hao J, Jiang Y, Wei X. Flavonoid
glycosides from the seeds of litchi chinensis. Journal of
Agricuture and Food Chemistry 2011; 59(4): 1205-1209.
28. Yamasaki K, Hishiki R, Kato E, Kawabata J. Study of
kaempferol glycoside as an insulin mimic reveals
glycon to be the key active structure. ACS Medicinal
Chemistry Letters 2011; 2(1) 17-21