Embed Size (px)
Citation preview
Available online on www.ijppr.com
International Journal of Pharmacognosy and Phytochemical Research 2016; 8(4); 592-603
ISSN: 0975-4873
Research Article
*Author for Correspondence
Phytochemical and Biological Studies of Total Ethanol and Petroleum
Ether Extracts of Terminalia Bentzoe (L.) Leaves
El-Rafie H M1*, Mohammed R S1, Hamed M A2, Ibrahim G E3, Abou Zeid A H1
1Pharmacognosy Department, National Research Centre, 33 El-Bohouth St. (former El-Tahrir St.), Dokki–Giza-Egypt,
P.O. 12622 (ID: 60014618) 2Therapeutic Chemistry Department National Research Centre, 33 El-Bohouth St. (former El-Tahrir St.), Dokki–Giza-
Egypt, P.O. 12622 (ID: 60014618) 3Flavour and Aroma Chemistry Department National Research Centre, 33 El-Bohouth St. (former El-Tahrir St.), Dokki–
Giza-Egypt, P.O. 12622 (ID: 60014618)
Available Online: 31st March, 2016
ABSTRACT
Terminalia is a genus of Combretaceous plants extensively distributed in tropical and subtropical areas. Numerous
species of this genus have been utilized for medicinal purposes because of their valuable phytoconstituents. This study
aimed to compare between the phytoconstituents of the hydroalcoholic extract (HAE) of Terminalia bentzone (T.
bentzoe) leaves as polar extract and its petroleum ether extract (PEE) as a nonpolar extract. Concerning this, total
phenolics, flavonoids, proteins and carbohydrate content of the HAE were estimated. HPLC analysis of HAE revealed
identification of nine phenolic acids, two flavonoids and one anthocyanin, they were gallic, ellagic, pyrogallol, catechin,
chlorogenic acid, synergic acid, pyrocatechol, cinnamic acid, paraqumaric acid, caffeic acid, quercetin and rutin arranged
according to the order of elution. Colum chromatographic separation of HAE resulted in the isolation of six compounds
for the first time named: gallic acid1, ellagic2 methyl gallate3 catechin4, rutin5 and quercetin6. On the other hand, the PEE
was fractionated to saponifiable and unsaponifiable fractions and both fractions were analysed by GC/MS. The GC/MS
analysis of the saponifiable fraction revealed the identification of thirty-seven compounds as fatty acid methyl esters
representing 83.51% of the total fraction, methyl hexadecanoate (39.98%) constitutes the major fatty acid methyl ester
followed by methyl octadecanoate (6.62%). The analysis of the unsaponifiable fraction disclosed the presence of forty-
nine compounds representing 72.32% of the total compounds, where butylated hydroxyl toluene (10.03%) constitutes the
major compound. Both HAE and PEE were evaluated for their in vitro antioxidant potential by DPPH and β-carotene
methods. The HAE superiors PEE in its antioxidant potentiality. Correspondingly, the HAE was subdued for further
investigation embracing its in vivo antioxidant and antihyperlipidemic activities.
Keywords: Terminalia bentzoe; hydroalcoholic extract; petroleum ether extract; HPLC; CC; GC/MS.
INTRODUCTION
The genus Terminalia (Family Combretaceae), comprises
two hundred and fifty species, is widespread in Egypt and
other tropical and subtropical countries. Many valuable
phytoconstituents isolated from this genus and used
extensively in the development of drugs against various
diseases, including triterpenoids for cardiovascular
properties1-4, tannins and flavonoids for its anticancer and
antioxidant properties5, hydrolyzable tannins for antiviral
activity6 and other biologically active ingredients used
primarily for treating mild or chronic ailments7-9.
Research work was done on various species of terminalia
as antihyperlipidemic and antioxidant agent10-15 which are
the main topics of this work. T. bentzoe (L.) is a
flowering evergreen tree belongs to this family. Its
vernacular names were bois binjouin, benjoin, badamier ,
bois benzoin, bois charron. Its bark resin is used
traditionally to treat skin infections and as sudorific. The
bark decoction or infusion was used to treat diarrhea,
dysentery and to stop bleeding. Leaf and bark decoctions
are taken to treat colds, cough and bronchitis. Its wood
has been used in constructions and for carpentry. Also, its
leaves extract has shown to posses antiplasmodial, anti-
inflammatory and cytotoxic activities16. To the authors'
knowledge, there was a little work has been reported on
the leaves of T. bentzoe (L.)17-19. Therefore, this work
aims to phytochemical screening of the HAE and PEE of
the leaves both qualitatively and quantitatively, in
addition to investigating their in vitro antioxidant
activities. The present research was also undertaken to
investigate the in vivo antioxidant and antihyperlipidemic
activities of the HAE leaves extract.
MATERIAL AND METHODS
Plant material
Green leaves of T. bentzoe (L.) were collected from the
Giza Zoo Garden, Cairo, Egypt, in March 2013 and
identified by Mrs. Tereez Labib, Consultant of Plant
El-Rafie et al./ Phytochemical and Biological…
IJPPR, Volume 8, Issue 4: April 2016 Page 593
Taxonomy at the Ministry of Agriculture and director of
the Orman Botanical Garden, Giza, Egypt. The leaves of
plant were rinsed with running tap-water for about 20-30
min. till all the foreign material and soil particles
detached from the leaves surface and afterward shade-
dried in air at room temperature. The air-dried leaves
were finely powdered utilizing an electric grinder and
separately subjected for ethanolic and petroleum ether
extraction.
Preparation of plant extracts
The powdered air-dried leaves of T. bentzoe (L.) (500g)
were individually extracted to exhaustion in a soxhlet
apparatus using ethanol (70%) and petroleum ether. The
extracts were singly filtered through Whatman filter
paper No.1 and then concentrated in a rotary evaporator
at a temperature range of 400-500C. Definite yields of the
HAE (22.4%) and PEE (4.6%) were obtained.
Phytochemical analysis of leaf extract
In this study, preliminary phytochemical screening
(colour reactions) was operated on the HAE and PEE
leave extracts according to standard methods20-22.
Total phenolic assay
The total phenolic content (TPC) of the HAE, expressed
as mg of gallic acid equivalents (GAE)/g dry weight of
the extract, was estimated using the Folin–Ciocalteu
reagent23 using gallic acid as a reference standard. The
estimation was carried out in triplicate and averaged.
Total flavonoid assay
The total flavonoid content (TFC) of the HAE, expressed
as quercetin equivalents/100g of the dry extract, was
determined according to a spectrometric method24.
Total protein content
The protein content of the HAE was estimated as total
nitrogen by the procedure adopted by Pearson using
micro-Kjeldhal method25. The crude protein was
subsequently calculated by multiplying the nitrogen
content by 100/16 or 6.25. The factor 6.25 is derived
from the generalization that most proteins contain 16%
nitrogen.
Total carbohydrates
The total carbohydrate content was determined as glucose
by the phenol-sulphuric acid method. A known weight of
each dried extract (30 mg) was mixed with 10 ml H2SO4
(1M) and refluxed on a boiling water-bath for 2 h. The
volume was adjusted to 100 ml in a volumetric flask with
distilled water. To one ml of the sample solution, 1ml of
5% phenol solution was added, followed by 5 ml conc.
H2SO4. The mixture was allowed to stand for 10 min. in a
water-bath at 25oC to 30oC. The absorbance of the
characteristic yellow-orange colour was measured at
490nm against a blank26. The amount of carbohydrates in
the sample was determined by reference to a standard
curve of glucose.
% Sugar = y/m x100
Where y and m are the mean reading of the sample
weight and the slope (0.003), respectively.
High performance liquid chromatography (HPLC)
The polyphenols were analysed in HPLC according to the
method described by Çam27 with some modifications as
follows: The HAE of the dried plant was analysed on the
Agilent 1200 (USA) HPLC system with a diode array
detector. Hichrom C18 (4.6 mmx250 mm; 5 µm particle
size) column, 40oC column temperature and 20 µl
injection volume were used in the analysis. The solvent
system was a gradient of water-acetic acid (98:2) (A) and
methanol (B). The gradient employed was: starting with
95% A, from 95% A to 50% for 10 min, from 50% A to
30% for 5 min at a flow rate of 1.0 ml/min. The phenolic
compounds were monitored at 272 nm for gallic acid, 275
nm for (-)-epicatechin, 279 nm for chlorogenic acid,
syringic acid, psoralen and 356 nm for rutin. The spectra
of these polyphenols were recorded between 190-400 nm.
Gallic acid, (-)-epicatechin, chlorogenic acid, syringic
acid, psoralen rutin were determined quantitatively by
using the external standard method. The HPLC method
was validated. Due as et al.28 reported that the limit of
detection (LOD) and the limit of quantification (LOQ) are
defined as 3:1 and 10:1 peak to noise ratio. LOD and
LOQ were calculated for gallic acid, chlorogenic acid,
syringic acid, rutin, (-)-epicatechin and psoralen.
Investigation of lipoidal matter
The petroleum ether extract (1g) was saponified
according to the method described elsewhere29, by
refluxing with 50 ml alcoholic KOH (10%) for 6 h. After
distillation of ethanol and dilution with water, the
unsaponifiable fraction was extracted with ether. The
residue left after the evaporation of ether (USM) was
weighed and kept for GC/MS analysis. The aqueous
mother liquor was acidified with 10% HCl and the
liberated fatty acids were extracted with ether. The
residue left after evaporation of ether (FA) was weighed
and subjected to methylation.
Methylation of fatty acids
Fatty acid fraction of the PEE was subjected to
methylation30, by refluxing with 50 ml absolute methanol
and 3ml of H2SO4 for 2 h, then cooled, diluted with about
100 ml of distilled water and transferred to a separating
funnel. The fatty acid methyl esters (FAMEs) were
extracted several times with ether. The combined ethereal
extracts, in each case, were washed several times with
water until free of acidity, dehydrated over anhydrous
sodium sulphate and the ether was evaporated to dryness.
The fatty acid methyl esters (FAME) were kept for
GC/MS analysis.
GC/MS analysis of fatty acid methyl esters and
unsaponifiable matter
The FAME and USM fractions were subjected to GC/MS
analysis adopting the following conditions: Capillary
column of fused silica (5% phenyl methyl polysiloxane),
30m length, 0.25mm I.D. and 0.25 µm thickness, DB-5,
carrier gas helium at 13 psi; oven temperature 50-2800C
at a rate of 50C /min for USM and FAME; ion source
temperature 2200C; ionization voltage 70 ev ; accelerated
voltage 2000 v; volume injected 1µl. The identification of
the compounds was accomplished by comparing their
retention times and mass spectral data with those of the
library (Wiley Int. USA) and NIST (Nat. Inst. St.
Technol., USA) and/or published data31.
Column chromatography of HAE
El-Rafie et al./ Phytochemical and Biological…
IJPPR, Volume 8, Issue 4: April 2016 Page 594
O
O
OH
OH
OH
OH
O
O
12
3
4
3`
5
5
6
1`2`
4`
`
6`
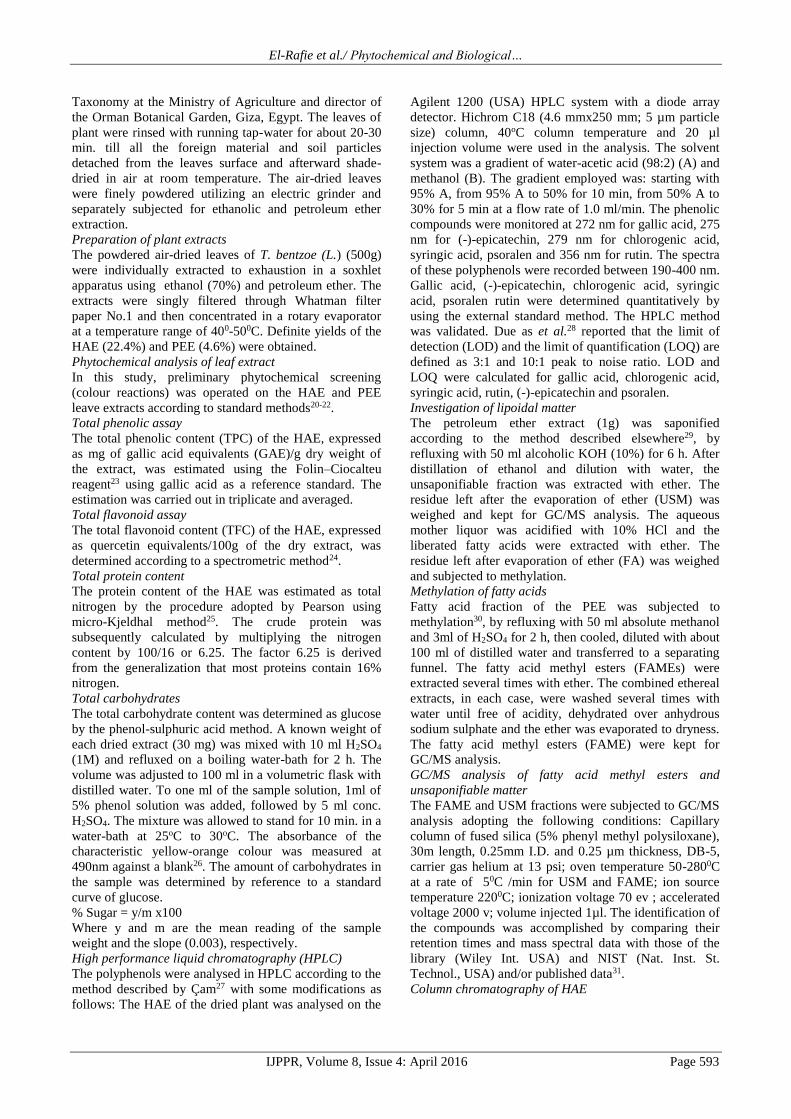
Table 2: Results of HPLC analysis of ethanol extract
of T. bentzoe (L.) leaves
Phenolic compound Concentration
Gallic acid 36.28*
Ellagic acid 12.24
Pyrogallol 2.76
Catechin 5.18
Chlorogenic acid 4.73
Synergenic acid 5.51
Pyrocatechol 9.68
Querectin 5.52
Cinnamic acid 3.04
P-Qumaric 1.33
Rutin 2.01
Caffeic acid 1.49
*Values are expressed as relative area percentage
Forty grams of HAE were applied on diaion HP20 CC
(120×5cm) and subjected to reversed phase
chromatography starting elution with 100% water till
100% methanol. Five main fractions (A-E) were obtained
by mixing similar fractions. Fraction B eluted with 25%
methanol water was subjected to reversed phase
chromatography on a polyamide S6 column starting
elution with water till 100% methanol. Fractions of 500
ml each were collected, inspected on Whatman PC 1MM,
using butanol:acetic acid:water, 4:1:5 (BAW), 15%
and/or 6% acetic acid as solvent systems, six major
fractions were obtained by mixing similar fractions (I-
VI). Fraction I was chromatographed on PC eluted with
6% acetic acid/H2O led to the isolation of compounds
1&2. Fractions II was chromatographed on PC eluted
with 6% acetic acid/H2O leading to the isolation of 3.
Fraction III was subjected to PC fractionation using 15%
AcOH to obtain compound 4. Fraction IV was subjected
on a Sephadex LH-20 column using methanol/water 30%
to obtain compound 5. Fraction V was subjected on a
Sephadex LH-20 column using methanol/water 50% to
obtain compound 6. The final purification of all
compounds was performed on Sephadex LH-20
(Pharmazia Sweden).
In vitro antioxidant activity with DPPH method
The antioxidant activity of the extract was measured as
described by Gebhard32 using the 1,1–diphenyl–2–
picrylhydrazyl (DPPHo) free radical scavenging capacity.
1 ml of each plant extract was mixed with 3 ml of
methanol solution of 0.004 % DPPH and the absorbance
was read at 517 nm 30 min later. The radical scavenging
activity of the samples (antioxidant activity) was
expressed as percent inhibition of DPPHo radical as
following:
% Inhibition = [(Acontrol –Atreatment)/Acontrol)] X 100
Table 1: Phytochemical screening of ethanol and
petroleum ether extracts of T. bentzoe (L.) leaves
Phytochemical constituents Ethanol
extract
Petroleum
ether
extract
Carbohydrates ++ -
Fats/Oils + ++
Saponins - -
Terpenoids + +
Steroids - +
Flavenoids ++ -
Phenolics/Tannins +++ -
Cardiac glycosids - -
Proteins/Amino acids ++ -
Alkaloids - -
Anthraquinones - -
+ = Present ; - = Absent
OH
OHOH
COOH
1 2 3
4 5 6
Figure 1: Chemical structure of compounds 1-6 isolated from Terminalia bentzoe (L.) leaves.
OH
OH
OH
COOCH3
OH
OH
O
OH
OH
OH OH
OH
O
OH
OH
OH
O
El-Rafie et al./ Phytochemical and Biological…
IJPPR, Volume 8, Issue 4: April 2016 Page 595
Where: Acontrol, is the absorbance of the control; Atreatment,
is the absorbance of the treatments.
Standard antioxidants (BHA and TBHQ, 200 ppm) were
used for comparison as positive control. IC50 value was
calculated using the dose inhibition curve.
In vitro antioxidant activity with the β-carotene bleaching
method
The antioxidant activity of the extracts was evaluated
using β-carotene-linoleic acid33. A stock solution of β-
carotene-linoleic acid mixture was prepared as follows:
0.5 mg of β-carotene was dissolved in 1 mL of
chloroform (HPLC grade); 25 uL of linoleic acid and 200
mL of tween 40 were added as emulsifier because β-
carotene is not water soluble. Chloroform was completely
evaporated using a vacuum evaporator. Then, 100 mL of
distilled water was added with vigorous shaking for 30
min; 2500 uL of this reaction mixture was dispersed to
test tubes, and 150, 250 and 350 uL portions of extracts
were added. The emulsion system was incubated for up to
48 h at room temperature. The same procedure was
repeated with a positive control BHA, TBHQ and a
blank. After this incubation time, the absorbance of the
mixture was measured at 490 nm. Tests were carried out
in triplicate. Inhibition of coloration of β-carotene in
percentage (I%) was calculated as:
I% = [(Ablank – Asample)]/ Ablank] × 100
Where Ablank is the absorbance of the control reaction
(containing of the reagents except the test compound) and
Asample is the absorbance of the test compound.
Acute toxicity study
In this experiment, the animals received one oral dose of
250, 500 and 1000mg of T. bentazoe HAE/kg body
weight. These animals were then observed for 15 days.
The dead animals were counted and the mortality rate
was calculated. Safety dose was monitored according to
the recorded LD50.
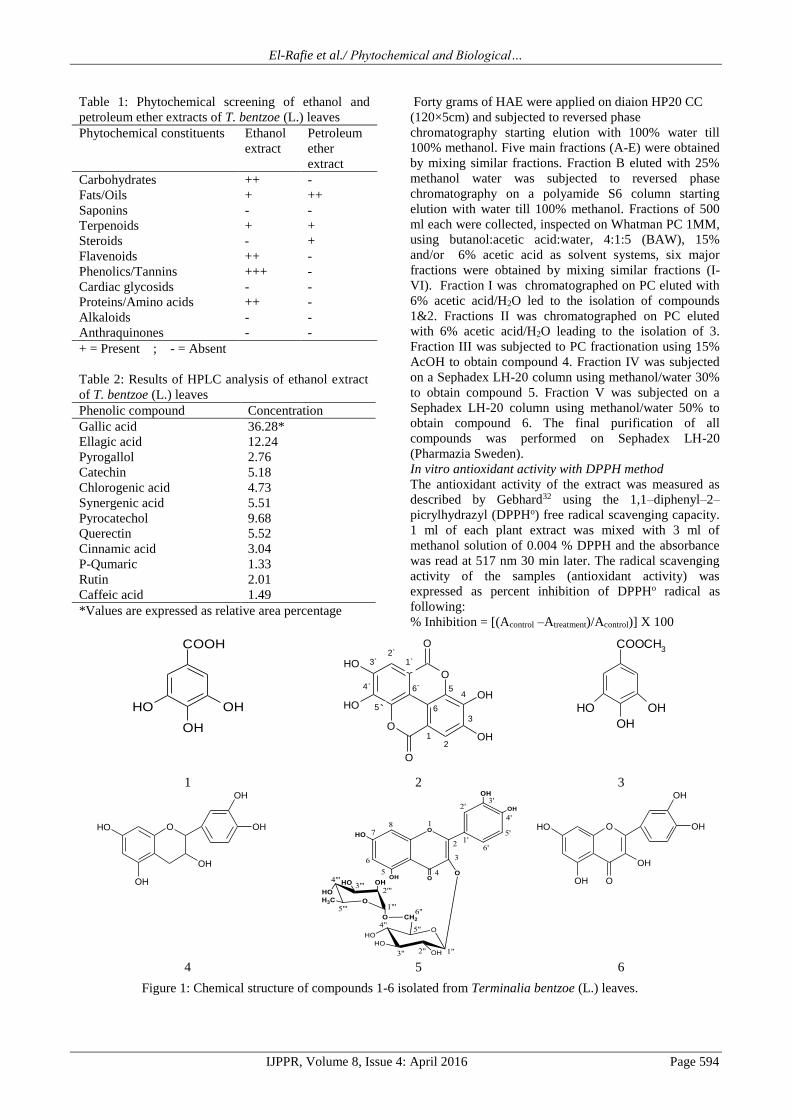
Table 3: GC/MS Analysis of the fatty acid methyl esters of Terminalia bentzoe
No. Compound Rt B.P. M+ Rel. Area
(%) Mol. Formula
1 Methyl decanoate 19.17 186 74 0.10 C11H22O2
2 Methyl,4-oxo-nonanoate 20.54 186 98 0.06 C10H16 O3
3 Dimethyl octandioate 22.65 202 129 0.15 C10H18 O4
4 Methyl dodecanoate 24.60 214 74 0.76 C13H26 O2
5 Dimethyl nonanedioate 25.28 216 152 1.14 C11H20 O4
6 Methyl tridecanoate 27.08 228 74 0.18 C14H28 O2
7 Dimethyl decanedioate 27.71 230 74 0.14 C12H22 O4
8 Methyl tetradecanoate 29.49 242 74 4.40 C15H30O2
9 Methyl undecanedioate 30.04 244 98 0.19 C13H24 O4
10 Methyl-4-pentadecenoate 31.33 254 74 1.02 C16H30 O2
11 Methyl pentadecanoate 31.69 256 74 0.74 C16H32 O2
12 Methyl-7-hexadecenoate 33.36 268 55 0.08 C17H32 O2
13 Methyl hexadecanoate 34.12 270 74 39.98 C17H34 O2
14 Methyl heptadecanoate 35.86 284 74 0.42 C18H36 O2
15 Methyl-2-hydroxyhexadecanoate 36.27 286 227 0.42 C17H34 O3
16 Methyl-9,12-octadecadienoate 37.20 294 81 0.76 C19H34 O2
17 Methyl-9-Octadecadecenoate 37.32 296 55 0.85 C19H36O2
18 Methyl octadecanoate 37.87 298 74 6.62 C19H38 O2
19 Methyl nonadecanoate 39.65 312 74 0.39 C20H40O2
20 Methyl-10-hydroxy octadecanoate 40.13 314 255 0.56 C19H38 O3
21 Methyl-6,9,12-octadecatrienoate 40.75 292 79 1.14 C19H32O2
22 Methyl eicosanoate 41.52 326 74 5.32 C21H42O2
23 Methyl henicosanoate 43.17 340 74 0.72 C22H44O2
24 Methyl-2-hydroxy eicosanoate 43.63 342 283 0.46 C21H42O3
25 Methyl docosanoate 44.85 354 74 1.74 C23H46O2
26 Methyl tricosanoate 46.41 368 74 1.06 C24H48 O2
27 Methyl-2-hydroxy docosanoate 46.90 370 311 0.89 C23H46 O3
28 Methyl tetracosanoate 47.95 382 74 2.06 C25H50 O2
29 Methyl-2-hydroxy tricosanoate 48.45 384 325 1.37 C24H48 O3
30 Methyl pentacosanoate 49.41 396 74 0.69 C26H52 O2
31 Methyl-2-hydroxy tetracosanoate 50.03 398 339 3.25 C25H50 O3
32 Methyl hexacosanoate 51.06 410 74 1.29 C27H54O2
33 Methyl 2-hydroxy pentacosanoate 51.73 412 353 1.07 C26H52 O3
34 Methyl heptacosanoate 52.94 424 74 0.22 C28H56O2
35 Methyl-2-hydroxyhexacosanoate 53.77 426 367 0.60 C27H54 O3
36 Methyl octacosanoate 55.27 438 74 1.56 C29H58O2
37 Methyl nonacosanoate 58.03 452 74 0.12 C30H60O2
Total identified area 83.51
El-Rafie et al./ Phytochemical and Biological…
IJPPR, Volume 8, Issue 4: April 2016 Page 596
Antihypercholesterolimic activity study
Experimental design
Twenty four male albino rats were selected for this study
and divided to four groups (six rats each) as follows:
Group 1, normal healthy control rats, Group 2,
hypercholesterolemic group received cholesterol, Groups
3 received cholesterol and treated with the plant extract at
the same time and for the same duration, Group 4,
received cholesterol and treated with the lipanthyl drug
(50mg finofibrate/kg body weight) at the same time and
for the same duration and served as a reference treated
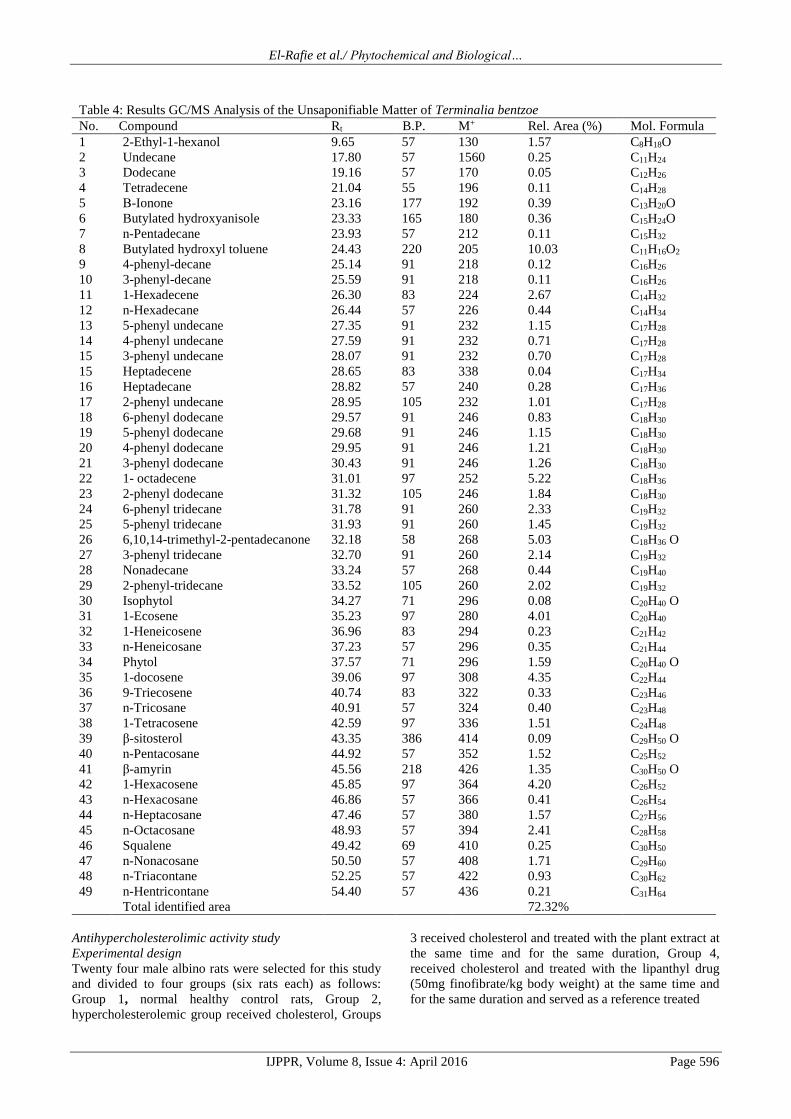
Table 4: Results GC/MS Analysis of the Unsaponifiable Matter of Terminalia bentzoe
No. Compound Rt B.P. M+ Rel. Area (%) Mol. Formula
1 2-Ethyl-1-hexanol 9.65 57 130 1.57 C8H18O
2 Undecane 17.80 57 1560 0.25 C11H24
3 Dodecane 19.16 57 170 0.05 C12H26
4 Tetradecene 21.04 55 196 0.11 C14H28
5 Β-Ionone 23.16 177 192 0.39 C13H20O
6 Butylated hydroxyanisole 23.33 165 180 0.36 C15H24O
7 n-Pentadecane 23.93 57 212 0.11 C15H32
8 Butylated hydroxyl toluene 24.43 220 205 10.03 C11H16O2
9 4-phenyl-decane 25.14 91 218 0.12 C16H26
10 3-phenyl-decane 25.59 91 218 0.11 C16H26
11 1-Hexadecene 26.30 83 224 2.67 C14H32
12 n-Hexadecane 26.44 57 226 0.44 C14H34
13 5-phenyl undecane 27.35 91 232 1.15 C17H28
14 4-phenyl undecane 27.59 91 232 0.71 C17H28
15 3-phenyl undecane 28.07 91 232 0.70 C17H28
15 Heptadecene 28.65 83 338 0.04 C17H34
16 Heptadecane 28.82 57 240 0.28 C17H36
17 2-phenyl undecane 28.95 105 232 1.01 C17H28
18 6-phenyl dodecane 29.57 91 246 0.83 C18H30
19 5-phenyl dodecane 29.68 91 246 1.15 C18H30
20 4-phenyl dodecane 29.95 91 246 1.21 C18H30
21 3-phenyl dodecane 30.43 91 246 1.26 C18H30
22 1- octadecene 31.01 97 252 5.22 C18H36
23 2-phenyl dodecane 31.32 105 246 1.84 C18H30
24 6-phenyl tridecane 31.78 91 260 2.33 C19H32
25 5-phenyl tridecane 31.93 91 260 1.45 C19H32
26 6,10,14-trimethyl-2-pentadecanone 32.18 58 268 5.03 C18H36 O
27 3-phenyl tridecane 32.70 91 260 2.14 C19H32
28 Nonadecane 33.24 57 268 0.44 C19H40
29 2-phenyl-tridecane 33.52 105 260 2.02 C19H32
30 Isophytol 34.27 71 296 0.08 C20H40 O
31 1-Ecosene 35.23 97 280 4.01 C20H40
32 1-Heneicosene 36.96 83 294 0.23 C21H42
33 n-Heneicosane 37.23 57 296 0.35 C21H44
34 Phytol 37.57 71 296 1.59 C20H40 O
35 1-docosene 39.06 97 308 4.35 C22H44
36 9-Triecosene 40.74 83 322 0.33 C23H46
37 n-Tricosane 40.91 57 324 0.40 C23H48
38 1-Tetracosene 42.59 97 336 1.51 C24H48
39 β-sitosterol 43.35 386 414 0.09 C29H50 O
40 n-Pentacosane 44.92 57 352 1.52 C25H52
41 β-amyrin 45.56 218 426 1.35 C30H50 O
42 1-Hexacosene 45.85 97 364 4.20 C26H52
43 n-Hexacosane 46.86 57 366 0.41 C26H54
44 n-Heptacosane 47.46 57 380 1.57 C27H56
45 n-Octacosane 48.93 57 394 2.41 C28H58
46 Squalene 49.42 69 410 0.25 C30H50
47 n-Nonacosane 50.50 57 408 1.71 C29H60
48 n-Triacontane 52.25 57 422 0.93 C30H62
49 n-Hentricontane 54.40 57 436 0.21 C31H64
Total identified area 72.32%

El-Rafie et al./ Phytochemical and Biological…
IJPPR, Volume 8, Issue 4: April 2016 Page 597
group. At the end of the experiment, the liver and body
weight of the rats in each group were estimated.
Diet
Control groups were fed with a standard diet (El-Kahira
Co. for Oil and Soap), while hypercholesterolemic groups
were fed with standard diet containing 150g lard/kg
diet34. The modified diet was taken along with the oral
administration of cholesterol to get a condition of high fat
and cholesterol level35 and to ensure triglycerides
elevation36.
Administration regimen Administration regimens according to Adaramoye et al.37
were five times/one week for nine consecutive weeks.
Doses of T. bentazoe were selected according to the
toxicity study. The selected dose was 500mg/kg body
weight. Cholesterol was orally given at a dose 30
mg/animal. Lipanthyl drug (Mina Pharm., Egypt) was
orally given at a dose 50mg/kg body weight38. The dose
of lipanthyl drug was calibrated to exactly contain 50 mg
of fenofibrate/kg body weight.
Sample preparations
Blood collected from each animal by puncturing the
sublingual vein in a clean and dry test tube, left 10
minutes to clot and centrifuged at 3000 rpm for serum
separation. The separated serum was stored at -80oC for
further determinations of lipid profile and liver function
enzymes. Liver tissue was homogenized in normal
physiological saline solution (0.9% NaCl) (1:9 w/v). The
homogenate was centrifuged at 4oC for 10 min at 3000
rpm and the supernatant was stored at -80oC for further
estimation of hepatic oxidative stress markers;
glutathione (GSH), malondialdehyde (MDA) and
superoxide dismutase (SOD).
Biochemical determinations
Table 5: Effect of treatment with T. bentazoe on obesity index, body and relative liver weights of
hypercholesterolemic rats
Groups Body weight (BW) Liver weight
(LW)
Relative liver
weight Obesity index (OI)
Normal control 139.82±25.53d 6.14±0.21a 3.90±0.47a 5.47±0.62bc
Hypercholesterolemic 214.68±14.03ab 5.45±0.53a 2.48±0.15e 7.18±1.06a
Hypercholesterolemic + T.
bentazoe
174.84±44.72bcd (28.49) 5.71±1.33a
(8.95)
3.22±0.18bc
(12.05)
5.93±0.77b (22.85)
Hypercholesterolemic +
Drug
171.54±14.48bcd
(30.85)
5.73±0.41a
(4.56)
3.31±0.14b
(21.28)
4.91±0.45c (41.49)
Data are means ± SD of six rats in each group.
BW and LW are expressed in grams.
Relative liver weight = (LW/BW) x 100.
OI = Body weight (kg)/ body height (m)2
Unshared letters between groups are the significant values at p<0.0019 for BW, p<0.00001 for relative liver
weight, p< 0.0009 for OI.
% of improvement = Hypercholesterolemic mean - treated mean x 100
Control mean
Table 6: Effect of T. bentazoe HAE extract and lipanthyl drug on lipid profile and liver function levels in
hypercholesterolemic rats
Parameters Control Hypercholesterolemic Hypercholesterolemic
+ T. bentazoe
Hypercholesterolemic +
Drug
TC 117.00±13.51d 177.00±5.70a 139.00±20.73bc
(32.47) 121.00±14.17cd (47.86)
HDL-C 20.63±3.52a 13.71±1.66c 15.45±1.66bc (8.43) 17.72±1.86ab (19.43)
LDL-C 69.93±13.24b 112.29±5.60a 89.45±24.02b (32.66) 75.80±15.41b (52.18)
TG 132.17±16.72c 255.02±36.49a 177.37±13.17b
(58.75) 137.39±16.72c (88.99)
AST 132.17±16.72c 255.02±36.49a 177.37±13.17b
(58.75) 137.39±16.72c (88.99)
ALT 40.19±4.12d 56.32±7.92a 47.99±7.46bc (20.72) 46.22±4.27cd (25.13)
Data are means ± SD of six rats in each group.
Lipid profile is expressed as mg/dL and liver function indices as U/L.
Unshared letters between groups are the significant values at p<0.00001for cholesterol, p<0.0007 for HDL-C,
p<0.0179 for LDL-C, p<0.00001 for triglycerides, p<0.0001 for AST and p< 0.0003 for ALT.
Values between brackets are % of improvement =
Hypercholesterolemic mean - treated mean x 100
Control mean
El-Rafie et al./ Phytochemical and Biological…
IJPPR, Volume 8, Issue 4: April 2016 Page 598
Serum cholesterol was determined by the method of
Meiattini et al.39, serum high density lipoprotein
cholesterol (HDL-C) was determined according to the
method of Bustein et al.40, serum low density lipoprotein
cholesterol (LDL-C) was determined by the method of
Assmann et al.41, serum triglyceride (TG) was measured
by the method of Fossati and Prencipe42 using a
diagnostic kit ((Spectrum, Egypt) and total protein in
liver tissue was estimated by the method recorded
elsewhere43. Aspartate and alanine amintransferases
(AST& ALT) were estimated as previously described44.
Malondialdehyde (MDA) was assayed according to the
method of Buege and Aust45. Glutathione (GSH) was
assayed according to a reported method46. Total
superoxide dismutase (SOD) was assayed according to
Nishikimi et al.47.
Histopathological study
Liver slices were fixed in 10% paraformaldehyde and
embedded in paraffin wax blocks. Sections of 4μm thick
were stained with hematoxylin & eosin (H&E), then
examined under a light microscope for determination of
pathological changes48.
Statistical analysis and calculations
All data were expressed as mean ± SD of six rats in each
group. Statistical analysis was carried out by one-way
analysis of variance (ANOVA), Costat Software
Computer Program. A significant value between groups
was at p<0.05, % of change = control mean - treated
mean/control mean x 100 ; % improvement = treated
mean - cholesterolemic mean/control mean x 100;
mortality rate = number of dead animals/total animal
number x 100
RESULTS AND DISCUSSION
Phytochemical screening
The HAE and PEE yields were found to be 22.4% and
4.6%, respectively. The present study clearly confirms the
presence of various phytoconstituents like terpenoids,
sterols, tannins, flavonoids and phenolics in both HAE
and PEE, as depicted in Table 1. These secondary plant
metabolites may be responsible for their numerous
medicinal effects. The total phenolic and flavonoid
contents for HAE were 765.1mg/g Gallic acid equivalent
and 137.87mg/g carotene equivalent, respectively,
meanwhile the total protein and carbohydrate contents
were 5.20 and 8.04%w/w. By and large, the total
flavonoid and phenolic contents are relatively high in
HAE, thence this may conceivably accountable for the
more noticed radical scavenging activity of HAE than
PEE, due to these compounds can promptly give atom to
the radical and it has been accounted for that the amount
of phenolic compounds in an extract is specifically
proportional to its free radical scavenging capacity49.
HPLC analysis of HAE permits identification of the
isolated compounds with respect to their peak area. It
disclosed the presence of nine phenolic acids, two
flavonoids and one anthocyanin. They were gallic,
(36.28%), ellagic (12.24%), pyrogallol (2.76%) catechin
(5.18%) chlorogenic acid(4.73%) synergic acid (5.51% )
pyrocatechol (9.68%) cinnamic acid (3.04%) paraqumaric
acid (1.33 %) caffeic acid (1.49 %) querectin (5.52%) and
rutin (2.01%) arranged according to the order of elution
(Table 2). Chromatographic examination of the HAE of
T. betazoe L. leaves resulted in the isolation and
identification of six compounds for the first time from T.
betazoe L. leaves, they were identified as gallic acid1,
ellagic2 methyl galate3 catechin4, rutin5 and quercetin6
(Fig. 1). Structure elucidation of all isolated compounds
was realized through Rf-values, colour reactions,
chemical investigations (complete and mild acid
hydrolysis) and spectral investigations (UV, NMR and
MS)50-52.
Gallic acid1: White amorphous powder, Rf values: 0.65
(BAW) and 0.52 (15% HOAc) on PC, UV at λ max
(MeOH): 270. 1H-NMR(500 MHz, DMSO-d6, ppm):
6.98 (s, H-2, H-6).
Ellagic acid2: Off-white amorphous powder, Rf values:
0.30 (BAW) and 0. 40 (15% HOAc) on PC, UV at λ max
(MeOH): 255, 364.1HNMR (500 MHz, acetone, ppm)
Methyl gallate3: Off-white amorphous powder, Rf values:
0.76 (BAW) and 0.60 (15% HOAc) on PC, UV at λ max
(MeOH): 220, 275 nm. 1HNMR (500 MHz, acetone,
ppm) 7.01(s, H-2 and H-6) and 3.71 (s, methyl ester
proton). 13C-NMR: 120.33(C-1), 109.00 (C-2), 145.43
(C-3), 138.47 (C-4), 145.43 (C-5), 109.00 (C-6), 167.28
(C-7), 51.46 (COO-CH3).
Catechin4: Pale pink amorphous powder, Rf values 0.76
(BAW) and 0.62 UV spectra (MeOH): λmax 280 nm and
sh 330 nm. 1H-NMR (500 MHz, acetone-d6): at δ ppm
4.47 (H-2, d, J=7.8 Hz), 4.08 (H-3, ddd,), 2.45 (H-4a, dd,
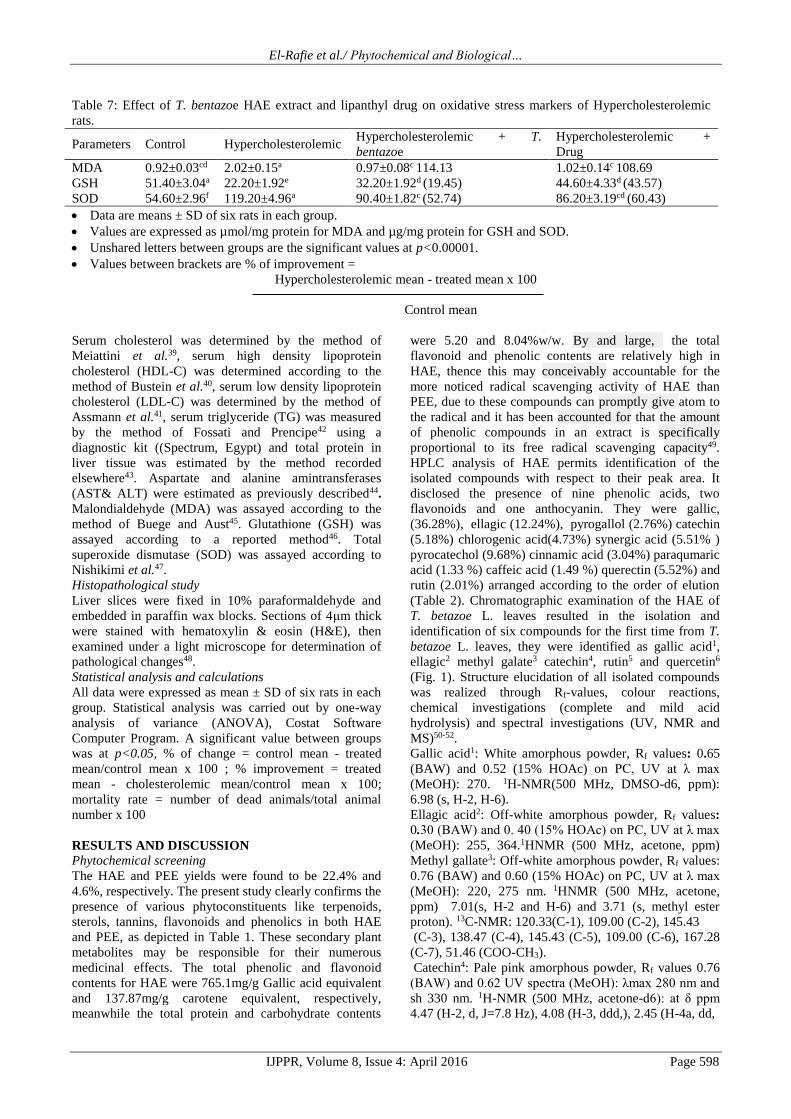
Table 7: Effect of T. bentazoe HAE extract and lipanthyl drug on oxidative stress markers of Hypercholesterolemic
rats.
Parameters Control Hypercholesterolemic Hypercholesterolemic + T.
bentazoe
Hypercholesterolemic +
Drug
MDA 0.92±0.03cd 2.02±0.15a 0.97±0.08c 114.13 1.02±0.14c 108.69
GSH 51.40±3.04a 22.20±1.92e 32.20±1.92d (19.45) 44.60±4.33d (43.57)
SOD 54.60±2.96f 119.20±4.96a 90.40±1.82c (52.74) 86.20±3.19cd (60.43)
Data are means ± SD of six rats in each group.
Values are expressed as µmol/mg protein for MDA and µg/mg protein for GSH and SOD.
Unshared letters between groups are the significant values at p<0.00001.
Values between brackets are % of improvement =
Hypercholesterolemic mean - treated mean x 100
Control mean
El-Rafie et al./ Phytochemical and Biological…
IJPPR, Volume 8, Issue 4: April 2016 Page 599
J= 8.50 Hz, J=16.10 Hz), 2.80 (H-4e, dd, J= 5.50 Hz, J=
16.10 Hz], 5.78 (H-6, d, J= 2.3 Hz), 5.95 (H-8, d, J=2.3
Hz), 6.81 (H-2′, d, J=1.95 Hz), 6.74 (H-5′, d, J=8.00 Hz),
6.66(H-6′, dd, J=1.94 Hz, J=8.4 Hz). 13C-NMR (125
MHz acetone): 27.7 (C-4), 66.3 (C- 3), 80.9 (C-2), 93.9
(C-6), 95.1 (C-8), 114.5 (C-2), 115.1 (C-5), 18.4 (C-6)
and other aromatic carbons showed peaks at δ of 99.1,
130.6, 144.6, 144.8, 155.3, 156.1 and 156.4.
R u t i n 5 : Yellow amorphous powder, Rf values(BAW)
0.380 and (15% HOAc) 0.66 1 H - N M R : UV at λ max
nm
(MeOH): 2 5 8 , 3 0 0 , 3 5 8 ; NaOMe: 2 7 2 , 3 2 7 s h , 4 1 0 ;
AlCl3: 2 7 5 , 3 0 5 s h , 4 2 0 ; AlCl3/HCl: 2 6 9 , 3 0 1 s h , 3 5
8 , 4 0 0 ; NaOAc: 2 7 2 , 3 2 4 s h , 3 7 9 ; NaOAc/H3B: 2 6 2 ,
3 7 8 . 1H-NMR (500 MHz, DMSO-d6): δ ppm 7.52 (2H,
m H-2`/6`), 6.84 ( 1H, d, J = 9 Hz, H-5`), 6.36 (1H,
d,J=2.5Hz, H-8), 6.20 (1H,J=2.5Hz, H-6), 5.36 (1H, d,
J=7.5 Hz, H-1``), 4.38 (1H, s, H-1```), 3.90-3.20 (m,
remaining sugar protons), 0.99 (3H, d, J=6 Hz, H-6```) 13C NMR(125 MHz, DMSO-d6): δ ppm 177.84 (C-4),
164.70 (C-7), 161.66 (C-5), 157.15 (C-2), 156.96 (C-9),
148.90 (C-4`), 145.25 (C-3`), 133.76 (C-3), 122.12 (C-
6`), 121.66 (C-1`), 116.73 (C-2`),115.72 (C-5`),104.41
(C-10), 101.66 (C-1``) 101.20(C-1```, 99.24 (C-6), 94.16
(C-8),74.58(C-3``),72.33(C-5``),72.2(C-4'''),71.05(C-
2``),70.8(C-2'''),70.87(C-3''')70. 49(C-4'') 68.74(C-
6``)18.20(C-6''').
Quercetin6: Yellow amorphous powder, Rf values : 0.03
(15% HOAc), 0.70 BAW. UV at λ max (MeOH): 258,
268sh, 295sh, 368. Negative ESI-MS: m/z : 301.20 . 1H-
NMR: 7.69 (d, J= 2.1, H-2'), 7.55 (dd, J =2.1 Hz, and 8.4
Hz, H-6'), 6.90 (d, J= 8.4 Hz, H-5'), 6.42 (d, J= 1.8 Hz,
H-8), 6.20 (d, J= 1.8 Hz, H-6).
As is evident in Table 3, which illustrate the results of
GC/MS analysis of the saponifiable fraction of T. bentzoe
thirty seven compounds, representing 83.51% of the total
peak area, in which methyl hexadecanoate represents the
major fatty acid methyl ester (39.98%) beside 8.62% of
hydroxy fatty acid methyl ester. On the other hand, the
unsaponifiable matter contains the largest number of the
identified compounds (49 compounds), representing
72.32% of the total peak area as depicted in Table 4, in
which unsaturated hydrocarbon constitute 22.63% of the
total identified compounds among these, 1-octadecene
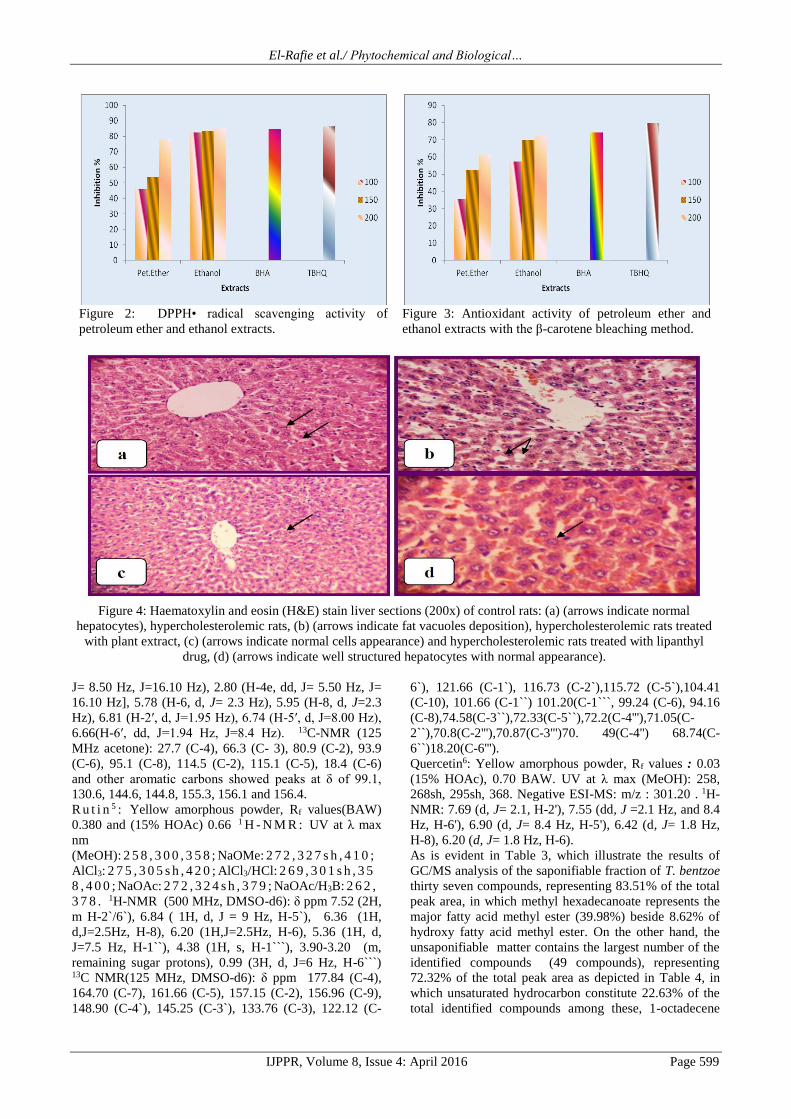
Figure 2: DPPH• radical scavenging activity of
petroleum ether and ethanol extracts.
Figure 3: Antioxidant activity of petroleum ether and
ethanol extracts with the β-carotene bleaching method.
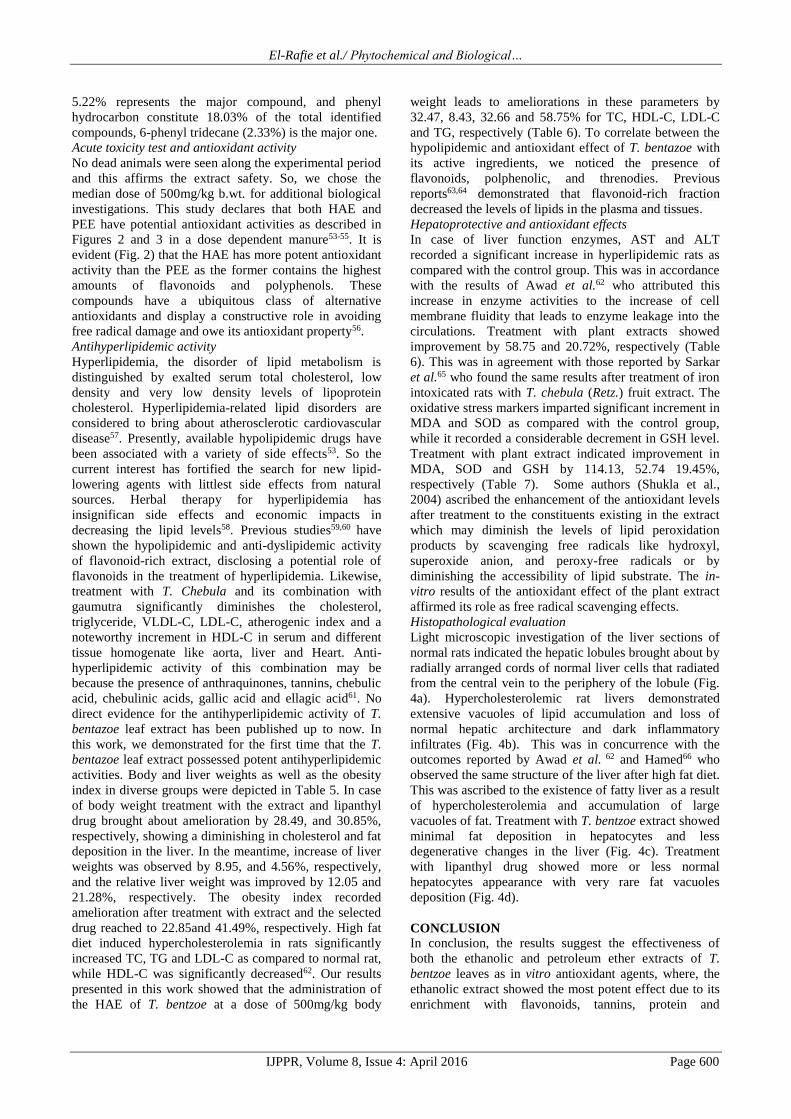
Figure 4: Haematoxylin and eosin (H&E) stain liver sections (200x) of control rats: (a) (arrows indicate normal
hepatocytes), hypercholesterolemic rats, (b) (arrows indicate fat vacuoles deposition), hypercholesterolemic rats treated
with plant extract, (c) (arrows indicate normal cells appearance) and hypercholesterolemic rats treated with lipanthyl
drug, (d) (arrows indicate well structured hepatocytes with normal appearance).
El-Rafie et al./ Phytochemical and Biological…
IJPPR, Volume 8, Issue 4: April 2016 Page 600
5.22% represents the major compound, and phenyl
hydrocarbon constitute 18.03% of the total identified
compounds, 6-phenyl tridecane (2.33%) is the major one.
Acute toxicity test and antioxidant activity
No dead animals were seen along the experimental period
and this affirms the extract safety. So, we chose the
median dose of 500mg/kg b.wt. for additional biological
investigations. This study declares that both HAE and
PEE have potential antioxidant activities as described in
Figures 2 and 3 in a dose dependent manure53-55. It is
evident (Fig. 2) that the HAE has more potent antioxidant
activity than the PEE as the former contains the highest
amounts of flavonoids and polyphenols. These
compounds have a ubiquitous class of alternative
antioxidants and display a constructive role in avoiding
free radical damage and owe its antioxidant property56.
Antihyperlipidemic activity
Hyperlipidemia, the disorder of lipid metabolism is
distinguished by exalted serum total cholesterol, low
density and very low density levels of lipoprotein
cholesterol. Hyperlipidemia-related lipid disorders are
considered to bring about atherosclerotic cardiovascular
disease57. Presently, available hypolipidemic drugs have
been associated with a variety of side effects53. So the
current interest has fortified the search for new lipid-
lowering agents with littlest side effects from natural
sources. Herbal therapy for hyperlipidemia has
insignifican side effects and economic impacts in
decreasing the lipid levels58. Previous studies59,60 have
shown the hypolipidemic and anti-dyslipidemic activity
of flavonoid-rich extract, disclosing a potential role of
flavonoids in the treatment of hyperlipidemia. Likewise,
treatment with T. Chebula and its combination with
gaumutra significantly diminishes the cholesterol,
triglyceride, VLDL-C, LDL-C, atherogenic index and a
noteworthy increment in HDL-C in serum and different
tissue homogenate like aorta, liver and Heart. Anti-
hyperlipidemic activity of this combination may be
because the presence of anthraquinones, tannins, chebulic
acid, chebulinic acids, gallic acid and ellagic acid61. No
direct evidence for the antihyperlipidemic activity of T.
bentazoe leaf extract has been published up to now. In
this work, we demonstrated for the first time that the T.
bentazoe leaf extract possessed potent antihyperlipidemic
activities. Body and liver weights as well as the obesity
index in diverse groups were depicted in Table 5. In case
of body weight treatment with the extract and lipanthyl
drug brought about amelioration by 28.49, and 30.85%,
respectively, showing a diminishing in cholesterol and fat
deposition in the liver. In the meantime, increase of liver
weights was observed by 8.95, and 4.56%, respectively,
and the relative liver weight was improved by 12.05 and
21.28%, respectively. The obesity index recorded
amelioration after treatment with extract and the selected
drug reached to 22.85and 41.49%, respectively. High fat
diet induced hypercholesterolemia in rats significantly
increased TC, TG and LDL-C as compared to normal rat,
while HDL-C was significantly decreased62. Our results
presented in this work showed that the administration of
the HAE of T. bentzoe at a dose of 500mg/kg body
weight leads to ameliorations in these parameters by
32.47, 8.43, 32.66 and 58.75% for TC, HDL-C, LDL-C
and TG, respectively (Table 6). To correlate between the
hypolipidemic and antioxidant effect of T. bentazoe with
its active ingredients, we noticed the presence of
flavonoids, polphenolic, and threnodies. Previous
reports63,64 demonstrated that flavonoid-rich fraction
decreased the levels of lipids in the plasma and tissues.
Hepatoprotective and antioxidant effects
In case of liver function enzymes, AST and ALT
recorded a significant increase in hyperlipidemic rats as
compared with the control group. This was in accordance
with the results of Awad et al.62 who attributed this
increase in enzyme activities to the increase of cell
membrane fluidity that leads to enzyme leakage into the
circulations. Treatment with plant extracts showed
improvement by 58.75 and 20.72%, respectively (Table
6). This was in agreement with those reported by Sarkar
et al.65 who found the same results after treatment of iron
intoxicated rats with T. chebula (Retz.) fruit extract. The
oxidative stress markers imparted significant increment in
MDA and SOD as compared with the control group,
while it recorded a considerable decrement in GSH level.
Treatment with plant extract indicated improvement in
MDA, SOD and GSH by 114.13, 52.74 19.45%,
respectively (Table 7). Some authors (Shukla et al.,
2004) ascribed the enhancement of the antioxidant levels
after treatment to the constituents existing in the extract
which may diminish the levels of lipid peroxidation
products by scavenging free radicals like hydroxyl,
superoxide anion, and peroxy-free radicals or by
diminishing the accessibility of lipid substrate. The in-
vitro results of the antioxidant effect of the plant extract
affirmed its role as free radical scavenging effects.
Histopathological evaluation
Light microscopic investigation of the liver sections of
normal rats indicated the hepatic lobules brought about by
radially arranged cords of normal liver cells that radiated
from the central vein to the periphery of the lobule (Fig.
4a). Hypercholesterolemic rat livers demonstrated
extensive vacuoles of lipid accumulation and loss of
normal hepatic architecture and dark inflammatory
infiltrates (Fig. 4b). This was in concurrence with the
outcomes reported by Awad et al. 62 and Hamed66 who
observed the same structure of the liver after high fat diet.
This was ascribed to the existence of fatty liver as a result
of hypercholesterolemia and accumulation of large
vacuoles of fat. Treatment with T. bentzoe extract showed
minimal fat deposition in hepatocytes and less
degenerative changes in the liver (Fig. 4c). Treatment
with lipanthyl drug showed more or less normal
hepatocytes appearance with very rare fat vacuoles
deposition (Fig. 4d).
CONCLUSION In conclusion, the results suggest the effectiveness of
both the ethanolic and petroleum ether extracts of T.
bentzoe leaves as in vitro antioxidant agents, where, the
ethanolic extract showed the most potent effect due to its
enrichment with flavonoids, tannins, protein and
El-Rafie et al./ Phytochemical and Biological…
IJPPR, Volume 8, Issue 4: April 2016 Page 601
carbohydrates. In addition, ethanol extract recorded
hypolipidemic, hepatoprotective and antioxidant effect in
hypercholesterolemic rats. However, studies are required
in human subjects to prove its clinical efficacy as a
hypolipidemic agent.
REFERENCES
1. Dwivedi, S. & Chopra, D. Revisiting Terminalia
arjuna – An Ancient Cardiovascular Drug. J Tradit
Complement Med., 2014; 4(4): 224–231.
2. Laskar, M. A., and Manabendra D. C. "Screening of
Some Triterpenoids Isolated from Terminalia arjuna
as Inhibitors of Angiotensin Converting Enzyme to
Prevent Cardiovascular Diseases." Research &
Reviews: A Journal of Drug Design &
Discovery 2014; 1(3): 12-19.
3. Pingali U, Fatima N, Nizampatnam M. Evaluation of
Terminalia arjuna on cardiovascular parameters and
platelet aggregation in patients with Type II diabetes
mellitus. Age 2013;1(2):7-12.
4. Prem Verma, Muneesh, Seema Rani, Garima
BhutaniPrem, V., Muneesh, S.R. & Garima B.
Experimental Evaluation of Terminalia Arjuna
(Aqueous Extract) On Cardiovascular System In
Comparison To Digoxin. IOSR-JDMS, 2013; 7(2): 48-
51.
5. Vijayalakshmi, A., Kumar, P.R., Priyadharshini S.S.
& Meenaxshi, C. In Vitro Antioxidant and Anticancer
Activity of Flavonoid Fraction from the Aerial Parts
of Cissus quadrangularis (Linn.) Against Human
Breast Carcinoma Cell Lines. J.Chem., 2013; Article
ID 150675: 1-9.
6. Lin, L.T., Chen, T.Y., Chung, C.Y., Noyce, R.S.,
Grindley, T.B., McCormick, C., Lin, T.C., Wang,
G.H., Lin, C.C. & Richardson, C.D. Hydrolyzable
tannins (chebulagic acid and punicalagin) target viral
glycoprotein-glycosaminoglycan interactions to
inhibit herpes simplex virus 1 entry and cell-to-cell
spread. J Virol, 2011; 85(9): 4386-98.
7. Nema, R., Jain, P., Khare, S., Pradhan, A., Gupta, A.
& Singh, D. Antibacterial and antifungal activity of
Terminalia Arjuna leaves extract with special
reference to flavanoids. BRJMCS, 2012; 1(5): 63-65.
8. Gangadhar, M., Bhavana, P., Datta, S. & Ganesh, M.
Effect of Epigallocatedhin gallate isolated from
Terminalia belerica fruit rind on glucoamylase
activity invitro. JAPS, 2011; 1(6): 115-117.
9. Arif-Ullah, K. & Anwarl, H.G. Anti-Secretory &
Analgesic Activities of Terminalia belerica. AJB,
2010; 09: 2717-2719.
10. Reddy, M.M., Devavaram, J.D., Dhas, J., Adeghate,
E. & Emerald, B. S. Anti-hyperlipidemic effect of
methanol bark extract of Wistar rats Terminalia
chebula in male albino Wistar rats. Pharm Biol, 2015;
53(8): 1133-1140.
11. Sharma, S., Asija, R., Kumawat, R.S., Chaudhary, P.
& Sharma, P.K. A study of anti-hyperlipidemic
activity of marketed formulations of Terminalia
arjuna powder using experimental animal model.
JBPR, 2015; 4(1): 107-111.
12. Selvan, P.S., Velavan, S., Sagunthala, P. &
Subramanian, S. Anti-hyperlipidemic activity of the
bark extract of Terminalia arjuna in caffeine induced
mice. Biochem, 2015; 5(8): 310-313.
13. Sinha S. & Ghosh, A.K. Hypolipidemic effect of
ethanolic extract of aegle marmelos and Terminalia
arjuna in hyperlipidemic rat model. IJATES, 2015;
03(2): 616-621.
14. Arya, A., Nyamathulla, S., Noordin, M. I. & Mohd,
M. A. Antioxidant and hypoglycemic activities of leaf
Extracts of three popular Terminalia species, E-J
Chem., 2012; 9(2): 883-892.
15. Subramaniam, S., Ramachandran, S., Uthrapathi, S.,
Gnamanickam, V.R. & Dubey, G.P. Anti-
hyperlipidemic and antioxidant potential of different
fractions of Terminalia arjuna Roxb. bark against PX-
407 induced hyperlipidemia. Indian J Exp Biol., 2011;
49(4): 282-8.
16. Jonville, M.C., Kodja, H., Humeau, L., Fournel, J., De
Mol, P., Cao, M., Angenot, L. & Frederich, M.
Screening of medicinal plants from Reunion Island for
antimalarial and cytotoxic activity. J.
Ethnopharmacol., 2008; 120: 382-386.
17. El-Rafie, H.M. & Hamed, M.A. Antioxidant and anti-
inflammatory activities of silver nanoparticles
biosynthesized from aqueous leaves extracts of four
Terminalia species. Advances in Natural Sciences:
Nanosci. &Nanotech., 2014; 5: 1-11.
18. Jonville, M.C, Kodja, H., Strasberg, D., Pichette,
A., Ollivier, E., Frédérich, M., Angenot, L. &
Legault, J. Antiplasmodial, anti-inflammatory and
cytotoxic activities of various plant extracts from the
Mascarene Archipelago. J Ethnopharmacol., 2011;
136 (3): 525-531.
19. Gurib-Fakim, A. & Demarne, F. Essential oil of
Terminalia bentzoe (L.) L. f. subsp. rodriguesensis
Wickens, Nat.Agricult. Lib., 1994; (NAL, 6 (5): 533-
534.
20. Vinod, D.R. Pharmacognosy and Phytochemistry 1
(Nasik: Carrier Publication), 2002; p132.
21. Harbone, J.B. Phytochemical Methods: A guide to
modern techniques of plant analysis 3rd edn (London:
Chapman and Hall Ltd), 1998; p 117.
22. Fransworth , N.R. Biological and phytochemical
screening of plants. J. Pharm. Sci., 1966; 55 (3): 225-
276.
23. Lim, Y.Y. & Quah, E.P.L. Antioxidant properties of
different cultivars of Portulaca oleracea. J Food
Chem., 2007; 103: 734-740.
24. Chatha, S.A.S., Arshad, M.U., Arshad, W., Hussain,
A.I. & Saif, M.J. Extraction regimes on antioxidant
potential of rice (Oryza ativa) bran extracts. J Chem
Soc Pak, 2012; 34: 1290-1294.
25. Pearson, D., "The Chemical Analysis of Food
"Churchill LTD., London, 1970. 6thed.; p 9.
26. Dubois, M., Gilles, K.A., Hamilton, J.K., Rebers, P.A.
& Smith, F. Calorimetric method for determination of
sugars and related substances. Anal. Chem., 1956;
28(3): 350- 356.

El-Rafie et al./ Phytochemical and Biological…
IJPPR, Volume 8, Issue 4: April 2016 Page 602
27. Çam, M., 2009. Extraction of antioxidant compound
of pomegranate peels and seeds using pressurized
liquid extractor with water. Ege University, The
Institute of Science and Technology Food Technology
Department Ph.D. Thesis, Izmir, Turkey, 271 p. (in
Turkish).
28. Due as, M., Pérez-Alonso, J.J., Santos-Buelga, C. &
Escribano-Bail, N.T. Anthocyanin composition in fig
(Ficus carica L.). J Food Compos Anal, 2008; 21:
107-115.
29. Tsuda, K., Kishida, Y. & Hayatsu, R. Steroid studies
XVII on the absolute configuration of C-24-ethyl of
stigmasterol. J. Am. Chem. Soc, 1960; 82 (13): 3396-
3399.
30. Johonson, A. R. & Davenport, J. B. "Biochemistry
and Methodology of lipids" A. Division of John Wiely
and sons Inc. New York, 1971; p 35 A.
31. Adams, R.P. "Identification of Essential Oil by Ion
Trap Mass Spectroscopy" Academic press, INC, New
York, 1995.
32. Gebhard, R. Anticholestatic activity of flavonoids
from artichoke (Cynara scolymus L.) and their
metabolites. Med Sci Mon., 2001; 7: 316-320.
33. Kabouche, A., Kabouche, Z., Fiztufirk, M.O., Kolak,
M.U. & Topcfu, G.,. Antioxidant abieetane
diterpenoids from Salvia barrelieri. Food Chem.,
2007;102: 1281-1287.
34. Auger, C., Caporiccio, B., Landrault, N., Teissedre,
P.L., Laurent, C. & Cros, G. Besançon, P., Rouanet,
J.M. Red wine phenolic compounds reduce plasma
lipids and apolipoprotein B and prevent early aortic
atherosclerosis in hypercholesterolaemic golden
Syrian hamsters (Mesocricetus auratus). J. Nutr.,
2002; 132(6): 1207-1213.
35. Kim, J.K. Kraemer, G.P. & Yarish, C. Physiological
activity of Porphyra in relation to eulittoral zonation.
J Exp Marine Biol., 2008; 365: 75–85.
36. Gershkovich, P. & Hoffman, A. Effect of a high-fat
meal on absorption and disposition of lipophilic
compounds: The importance of degree of association
with triglyceride-rich lipoproteins. Eur. J.
Pharmaceut. Sci., 2007; 32(1): 24–32.
37. Adaramoye, O.A., Akintayo, O., Achem, J. &
Fafunso, M.A. Lipid-lowering effects of methanolic
extract of Vernonia amygdalina leaves in rats fed on
high cholesterol diet. Vasc Health Risk
Manag. 2008;4(1):235-41.
38. Pietta, P.G. Flavonoids as antioxidants. J Nat Prod.,
2000; 63(7): 1035-1042.
39. Meiattini, F., Prencipe, L., Bardelli, F., Giannini, G. &
Tarli, P. The 4- hydroxybenzoate/4-aminophenazone
chromogenic system used in the enzymic
determination of serum cholesterol. Clin. Chem.,
1978; 24(12): 2161–2165.
40. Bustein, M., Schoirick, H. R. & Morfin, R. Rapid
method for the isolation of lipoproteins from human
serum by perception with polyanions. Scand. J. Clin.
Lab. Invest., 1980; 40: 583–595.
41. Assmann, G., Jabs, H.U., Kohnert, U. & Nolte, W.,
Schriewer, H. LDL-cholesterol determination in blood
serum following precipitation oh LDL with
polyvinylsulphate. Clin. Chem. Acta, 1984; 140(1):
77-83.
42. Fossati, P. & Prencipe, L. Serum triglycerides
determination colorimetrically with an enzyme that
produces hydrogen peroxide. Clin. Chem., 1982; 28(:
2077–2080.
43. Bradford, M. M. A rapid and sensitive method for the
quantitation of microgram quantities of protein
utilizing the principle of protein-dye binding. Anal.
Bioch., 1976; 72: 248–254.
44. Gella, F.J., Olivella, T., Cruz, P.M., Arenas, J.,
Moreno, R., Durban, R, & Gomez, J.A. A simple
procedure for the routine determination of aspartate
aminotransferase and alanine aminotransferase with
pyridoxal phosphate. Clin Chem Acta, 1985; 153: 241-
247.
45. Buege, J.A. & Aust, S.D. Microsomal Lipid
Peroxidation. In: Flesicher, S., Packer, L. (Eds.),
Methods in Enzymology. Vol. 52. Academic Press,
New-York, 1978, pp. 302–310.
46. Moron, M.S., Depierre, J.W. & Mannervik, B. Levels
of glutathione, glutathione reductase and glutathione
S-transferase activities in rat lung and liver. Biochim
Biophys Acta., 1979; 582: 67–78.
47. Nishikimi, M., Rao, N.A. & Yagi, K. The occurrence
of superoxide anion in the reaction of reduced
phenazine methosulphate and molecular oxygen.
Biochem Biophys Res Commun, 1972; 46(2): 849-854.
48. Hirsch, C., Zouain, C.S., Alves, J.B., & Goes, A.M.
Induction of protective immunity and modulation of
granulaomatous hypersensitivity in mice using PIII, an
anionic fraction of Schistosoma mansoni adult worm.
Parasitology, 1997; 115: 21–28.
49. Kalia, K., Sharma, K., Singh, H.P. & Singh, B. Effects
of extraction methods on phenolic contents and
antioxidant activity in aerial parts of Potetilla
atrosanguinea Lodd. and quantification of its phenolic
constituents by RP-HPLC. J Agric Food Chem, 2008;
56: 10129-34.
50. Agrawal, P.K. Carbone-13 NMR of flavonoids.
Elsevier Science Publishing Co. Inc New York, 1989.
51. Markham, K.R. Techniques of Flavonoid
Identification. Academic Press, London, 1982.
52. Mabry, T.J., Markham, K.R. & Thomas, M.B. The
Systematic Identification of Flavonoids. Berlin:
Springer, 1970.
53. Saravanan, R. Prasad, R.N. & Pugalandi, K.V. Effect
of Piper beetle leaf extract on alcoholic toxicity in the
rat brain. J Med Food., 2003; 6: 261–5.
54. Hazra, B., Sarkar, R., Biswas, S. & Mandal, N.
Comparative study of the antioxidant and reactive
oxygen species scavenging properties in the extracts
of the fruits of Terminalia chebula, Terminalia
belerica and Emblica officinalis. BMC Comp. Alt.
Med., 2010; 10: 20 (doi: 10.1186/1472-6882-10-20).
55. Sultana, B., Anwar, F. & Przybylski, R. Antioxidant
activity of phenolic components present in barks of
Azadirachta indica,Terminalia arjuna, Acacia nilotica
El-Rafie et al./ Phytochemical and Biological…
IJPPR, Volume 8, Issue 4: April 2016 Page 603
and Eugenia jambolana Lam. Trees. Food Chem.,
2007; 104: 1106–1114.
56. Shetgiri, P.P., Darji, K.K. & D,Mello, P.M. Evaluation
of Antioxidant and Antihyperlipidemic Activity of
extracts Rich in Polyphenols. Int. J. Phytomedicine,
2010; 2: 267-276.
57. Dhar, U., Rawal, R.S., Samant, S.S., Airi, S. & Upreti,
J. People’s participation in imalayan biodiversity
conservation: a practical approach. Current Sci, 1999;
76: 36–40.
58. Berliner, J.A. and Heinecke, J.W. The role of oxidized
lipoproteins in atherogenesis. Free Radic Biol Med.,
1996; 20: 707–27.
59. Narender, T., Khaliq, T., Puri, A. and Chander, R. The
Antidyslipidemic activity of Furano-flavonoids
isolated from Indigofera tinctoria. Bioorg Med Chem
Lett., 2006; 16(13): 3411-3414.
60. Sharma, B., Balomajumder, C. & Roy, P.
Hypoglycemic and hypolipidemic effects of flavonoid
rich extract from Eugenia jambolana seeds on
streptozotocin induced diabetic rats. Food Chem
Toxicol., 2008; 46(7): 2376- 2383.
61. Israni, D.A., Patel, K.V., Gandhi, T.R. Anti-
hyperlipidemic activity of aqueous extract of
terminalia chebula & gaumutra in high cholesterol
diet fed rats. IJPSR., 2010; 1(1): 48-59.
62. Awad, N.E., Seida, A.A., Hamed, M.A., Hosny, A.M.
& Elbatanony, M.M. Phytochemical and in vitro
screening of some Ficus and Morus spp. for
hypolipidemic and antioxidant activities and in vivo
assessment of Ficus mysorensis (Roth). Nat. Prod.
Res., 2012; 26: 1101-1111.
63. Nagarathna, P.K.M., Honi yalu & sudheer, M. Anti
Hyperlipidemic Activity of Flavonoid of Cassia tora.
IJTPR ., 2013; 5(4): 129-136.
64. Kaviarasan, K. Mohankumar, R. Narasimhan, S.
Viswanathan, P. & Pugalendi, V. Antihyperlipidemic
efficacy of flavonoid-rich fraction from spermacoce
hispida seed on high-fat-diet fed rats: a dose-
dependent study. J. Food Biochem., 2010;
35(6): 1627–1636.
65. Sarkar, R., Hazra, B. & Mandal, N. Reducing power
and iron chelating property of Terminalia chebula
(Retz.) alleviates iron induced liver toxicity in mice.
BMC Comp. Alt. Med., 2012; 12: 144
(doi:10.1186/1472-6882-12-144).
66. Hamed, M.A. Beneficial effect of Ficus religiosa
Linn. On high-fat-diet-induced hypercholesterolemia
in rats. Food Chem., 2011; 129(1): 162-170.


