Embed Size (px)
Citation preview

Hydrol. Earth Syst. Sci., 18, 2925–2942, 2014www.hydrol-earth-syst-sci.net/18/2925/2014/doi:10.5194/hess-18-2925-2014© Author(s) 2014. CC Attribution 3.0 License.
Identification and simulation of space–time variability of pasthydrological drought events in the Limpopo River basin,southern AfricaP. Trambauer1, S. Maskey1, M. Werner1,2, F. Pappenberger3, L. P. H. van Beek4, and S. Uhlenbrook1,5
1UNESCO-IHE, Department of Water Science and Engineering, P.O. Box 3015, 2601 DA Delft, the Netherlands2Deltares, P.O. Box 177, 2600 MH Delft, the Netherlands3ECMWF, Shinfield Park, Reading, RG2 9AX, UK4Utrecht University, Dept. Physical Geography, Utrecht, the Netherlands5Delft University of Technology, Water Resources Section, P.O. Box 5048, 2600 GA Delft, the Netherlands
Correspondence to:P. Trambauer ([email protected])
Received: 10 January 2014 – Published in Hydrol. Earth Syst. Sci. Discuss.: 6 March 2014Revised: 10 February 2014 – Accepted: 24 June 2014 – Published: 7 August 2014
Abstract. Droughts are widespread natural hazards and inmany regions their frequency seems to be increasing. A finer-resolution version (0.05◦ × 0.05◦) of the continental-scalehydrological model PCRaster Global Water Balance (PCR-GLOBWB) was set up for the Limpopo River basin, oneof the most water-stressed basins on the African continent.An irrigation module was included to account for large ir-rigated areas of the basin. The finer resolution model wasused to analyse hydrological droughts in the Limpopo Riverbasin in the period 1979–2010 with a view to identifying se-vere droughts that have occurred in the basin. Evaporation,soil moisture, groundwater storage and runoff estimates fromthe model were derived at a spatial resolution of 0.05◦ (ap-proximately 5 km) on a daily timescale for the entire basin.PCR-GLOBWB was forced with daily precipitation and tem-perature obtained from the ERA-Interim global atmosphericreanalysis product from the European Centre for Medium-Range Weather Forecasts. Two agricultural drought indica-tors were computed: the Evapotranspiration Deficit Index(ETDI) and the Root Stress Anomaly Index (RSAI). Hy-drological drought was characterised using the StandardizedRunoff Index (SRI) and the Groundwater Resource Index(GRI), which make use of the streamflow and groundwaterstorage resulting from the model. Other more widely usedmeteorological drought indicators, such as the StandardizedPrecipitation Index (SPI) and the Standardized PrecipitationEvaporation Index (SPEI), were also computed for differ-ent aggregation periods. Results show that a carefully set-up,
process-based model that makes use of the best available in-put data can identify hydrological droughts even if the modelis largely uncalibrated. The indicators considered are ableto represent the most severe droughts in the basin and tosome extent identify the spatial variability of droughts. More-over, results show the importance of computing indicatorsthat can be related to hydrological droughts, and how theseadd value to the identification of hydrological droughts andfloods and the temporal evolution of events that would oth-erwise not have been apparent when considering only me-teorological indicators. In some cases, meteorological indi-cators alone fail to capture the severity of the hydrologicaldrought. Therefore, a combination of some of these indica-tors (e.g. SPEI-3, SRI-6 and SPI-12 computed together) isfound to be a useful measure for identifying agricultural tolong-term hydrological droughts in the Limpopo River basin.Additionally, it was possible to undertake a characterisationof the drought severity in the basin, indicated by its time ofoccurrence, duration and intensity.
1 Introduction
Droughts are a widespread natural hazard worldwide, andthe societal impact is tremendous (Alston and Kent, 2004;Glantz, 1987). Recent studies show that the frequency andseverity of droughts seems to be increasing in some areas as a
Published by Copernicus Publications on behalf of the European Geosciences Union.

2926 P. Trambauer et al.: Identification and simulation of past hydrological droughts in the Limpopo River basin
result of climate variability and climate change (IPCC, 2007;Patz et al., 2005; Sheffield and Wood, 2008; Lehner et al.,2006). Moreover, and probably more importantly, the rapidincrease in world population will certainly aggravate watershortage on local and regional scales. The study of droughtsand drought management planning has received increasingattention in recent years as a consequence.
Drought monitoring is a key step in drought management,requiring appropriate indicators to be defined by which dif-ferent types of drought can be identified. Meteorological,agricultural and hydrological drought indicators are avail-able to characterise different types of droughts. The bestknown indicators are the Standardized Precipitation Index(SPI; McKee et al., 1993) and the Palmer Drought Sever-ity Index (PDSI, Palmer, 1965; Dube and Sekhwela, 2007;Alley, 1984); both are primarily meteorological drought in-dices. The SPI uses only precipitation in its computation, andthe PDSI uses precipitation, soil moisture and temperature.However, the timescale of drought that the PDSI addresses isoften not clear (Keyantash and Dracup, 2002) and will usu-ally be determined by the timescale of the data set; Vicente-Serrano et al. (2010b) indicate that the monthly PDSI is gen-erally correlated with the Standardized Precipitation Evap-oration Index (SPEI) at timescales of about 9–12 months.While the computation of the PDSI is complex, applied toa fixed time window and difficult to interpret, the SPI is easyto compute and to interpret in a probabilistic sense, is spa-tially invariant and can be tailored to a time window appro-priate to a user’s interest (Guttman, 1998). Alley (1984) andVicente-Serrano et al. (2010b) also highlight several limita-tions of the PDSI, such as not allowing for the distinctionof different types of drought (i.e. hydrological, meteorolog-ical and agricultural) as it has a fixed temporal scale. ThePDSI has other derivatives such as the Palmer HydrologicalDrought Index (PHDI) for hydrological long-term droughts,PalmerZ Index for short-term monthly agricultural droughtsand the Crop Moisture Index (CMI) for short-term weeklyagricultural droughts. The empirical PDSI method developedin the United States, is still widely used in the US but is grad-ually being substituted by other indicators in other regions(Keyantash and Dracup, 2002) as a result of its limitations.The SPI can be computed for different timescales by accu-mulating the precipitation time series over the time period ofinterest (typically 3 months for the SPI-3, 6 months for theSPI-6, and 12 months for the SPI-12). The SPI has shown tobe highly correlated with indicators of agricultural drought,hydrological drought and groundwater drought. The SPI-3has a high temporal variability that is associated with short-to-medium range meteorological anomalies that can result inanomalous soil moisture and crop evolution, and it can there-fore be used as an indication of agricultural drought. TheSPI-6 has a higher correlation with hydrological droughts,mainly represented by low anomalies in runoff. The SPI-12and SPI-24 have a lower temporal variability and point tomajor and long-duration drought events whose impacts may
extend to groundwater. The widely used SPI does, however,have its limitations, mainly because it is based only on pre-cipitation data. An extension of the SPI was proposed byVicente-Serrano et al. (2010b), called the Standardized Pre-cipitation Evaporation Index (SPEI), which is based on pre-cipitation and potential evaporation. In a way, it combinesthe sensitivity of the PDSI to changes in evaporation demandwith the capacity of the SPI to represent droughts on multi-temporal scales (Vicente-Serrano et al., 2010b).
Together with the development of the first drought indica-tors, hydrological models were also used for agricultural andhydrological drought assessment. Schulze (1984) applied theAgricultural Catchments Research Unit (ACRU) hydrolog-ical model in Natal, South Africa, to compare the severityof the 1979–1983 drought with other drought events in theprevious 50 years. He identified hydrological modelling asa potentially powerful tool in drought assessment. Moreover,he indicated that it is necessary to distinguish between differ-ent types of droughts, as droughts in terms of water resourcesdo not necessarily coincide with droughts from the crop pro-duction point of view.
In recent years, several new indicators have been de-veloped to characterise the different types of drought. Al-though drought indicators are mostly used to characterisepast droughts and monitor current droughts, forecasting ofthese indicators at different spatial and temporal scales isgaining considerable attention.
In this study we extend a continental-scale frameworkfor drought forecasting in Africa, which is currently underdevelopment (Barbosa et al., 2013), and apply this to theLimpopo Basin in southern Africa, one of the most water-stressed basins in Africa. The Limpopo River basin is ex-pected to face even more serious water scarcity issues inthe future, limiting economic development in the basin (Zhuand Ringler, 2012). To apply this framework at the regionalscale, a finer-resolution version of the global hydrologicalmodel PCRaster Global Water Balance (PCR-GLOBWB)was adapted to regional conditions in the basin. We modelhydrological droughts and their space–time variability us-ing a process-based distributed hydrological model in the(semi-) arid Limpopo Basin. The model was tested by com-paring the simulated hydrological and agricultural droughtindicators in the period 1979–2010 with reported historicdrought events in the same period. We derive a number ofdifferent drought indicators from the model results (see Ta-ble 1), such as the ETDI (Evapotranspiration Deficit In-dex; Narasimhan and Srinivasan, 2005), the RSAI (RootStress Anomaly Index), the SRI (Standardized Runoff In-dex; Shukla and Wood, 2008) and the GRI (Groundwater Re-source Index; Mendicino et al., 2008). While the SRI is basedon river discharge at a particular river section, the ETDI,RSAI and GRI are spatial indicators that can be estimatedfor any location in the basin. The ETDI and RSAI are di-rectly related to water availability for vegetation with or with-out irrigation, and the GRI is related to groundwater storage.
Hydrol. Earth Syst. Sci., 18, 2925–2942, 2014 www.hydrol-earth-syst-sci.net/18/2925/2014/

P. Trambauer et al.: Identification and simulation of past hydrological droughts in the Limpopo River basin 2927
Table 1.Drought indicators derived in this study.
Name Variable Type of Purpose or reason Referencedrought
SPI Precipitation Meteorological Particularly important McKee et al.(Standardized for rainfed agriculture; (1993)Precipitation also influencesIndex) farming practises
SPEI Precipitation/ Meteorological As the SPI, but with a Vicente-(Standardized evaporation more detailed focus on Serrano et al.Precipitation available water (2010b)EvaporationIndex)
ETDI Evaporation Agricultural Impact on yield as a Narasimhan(Evapotranspiration result of water and SrinivasanDeficit Index) availability for (2005)
evaporation
RSAI (Root Root stress Agricultural Impacts on root This studyStress Anomaly growth and yieldIndex)
SRI Discharge Hydrological River discharge is Shukla and(Standardized important for many Wood (2008)Runoff Index) aspects such as
shipping, irrigation,energy
GRI Groundwater Hydrological Groundwater is used Mendicino et(Groundwater for irrigation and al. (2008)Resource Index) drinking water
Moreover, we compute the widely known meteorologicaldrought indicators SPI and SPEI at different aggregation pe-riods to verify the correlation of the different aggregation pe-riods for these indices and the different types of droughts.Table 1 presents the derived indicators with a descriptionof the purpose and the type of drought each indicator rep-resents. The aim of this study is to assess the ability of differ-ent drought indicators to reconstruct the history of droughtsin a highly water-stressed, semi-arid basin. Moreover, we in-vestigate whether widely used meteorological indicators fordrought identification can be complemented with indicatorsthat incorporate hydrological processes.
2 Data
2.1 Study area: Limpopo River basin
The Limpopo River basin has a drainage area of approxi-mately 415 000 km2 and is shared by four countries: SouthAfrica (45 %), Botswana (20 %), Mozambique (20 %) andZimbabwe (15 %) (Fig. 1). The climate in the basin rangesfrom tropical dry savannah and hot dry steppe to cooltemperatures in the mountainous regions. Although a large
part of the basin is located in a semi-arid area, the upperpart of the basin is located in the Kalahari Desert, where it isparticularly arid. Aridity, however, decreases further down-stream. Rainfall in the basin is characterised as being sea-sonal and unreliable, causing frequent droughts, but floodscan also occur in the rainy season. The average annual rain-fall in the basin is approximately 530 mm year−1, rangingfrom 200 to 1200 mm year−1, and occurs mainly in the sum-mer months (October to April) (LBPTC, 2010).
Arid and semi-arid regions are generally characterised bylow and erratic rainfall, high interannual rainfall variabilityand a low rainfall-to-potential-evaporation ratio. This leadsto the ratio of runoff to rainfall being low on the annual scale.Hydrological modelling possesses considerable challenges insuch a region. A detailed discussion on problems related torainfall-runoff modelling in arid and semi-arid regions can befound in Pilgrim et al. (1988).
The runoff coefficient (RC = runoff / precipitation) of theLimpopo Basin is remarkably low. For the station atChokwe (no. 24), which is the station with the largestdrainage area among the discharge stations available in thisstudy (Fig. 1), the runoff coefficient is just 4.3 % for the natu-ralised discharge and a mere 1.7 % for the observed discharge
www.hydrol-earth-syst-sci.net/18/2925/2014/ Hydrol. Earth Syst. Sci., 18, 2925–2942, 2014

2928 P. Trambauer et al.: Identification and simulation of past hydrological droughts in the Limpopo River basin
Figure 1. Limpopo River basin: the location of the basin (left panel) and the locations of hydrometric stations (right panel). Selected stations(nos. 1, 15, 18, 20, 23 and 24) are highlighted. The subbasins draining to each hydrometric station are named after the station number.
(without naturalisation). Note that the naturalised dischargeis estimated as observed discharge plus the estimated ab-stractions. These runoff coefficients are strikingly low: out of539 mm year−1 of annual rainfall only 23 mm year−1 (basinaverage) turns into runoff annually, including abstraction.This means that even a small error in estimates of precipita-tion and evaporation could result in a large error in the runoff.Moreover, the uncertainty in the rainfall input could easilybe larger than the runoff coefficient (4.3 %) of the basin.Runoff coefficients for other selected stations in the basin(highlighted in Fig. 1, right panel) are presented in Table 2.
The basin is also highly modified, as is evident fromthe observed and naturalised runoff. This adds an addi-tional challenge to modelling this basin. For example, for thelargest drainage outlet available (no. 24), the observed annualdischarge is only some 39 % of the naturalised discharge,which means that the abstractions in the basin amount to61 % of the total runoff. Irrigation water demand takes up thelargest share. The total estimated present demand in the basinis about 4700× 106 m3 year−1. The total natural runoff gen-erated from rainfall is approximately 7,200× 106 m3 year−1,showing that a significant portion of the runoff generated inthe basin is currently used.
2.2 Data for the hydrological model
The digital elevation model (DEM) we used is based on theHydro1k Africa (USGS EROS, 2006). The majority of theparameters (maps) required for the model (soil layer depths,soil storage capacity, hydraulic conductivity, etc.) were de-rived mainly from three maps and their derived properties:the Digital Soil Map of the World (FAO, 2003), the distribu-tion of vegetation types from Global Land Cover Character-ization (GLCC) (USGS EROS, 2002; Hagemann, 2002) andthe lithological map of the world (Dürr et al., 2005). Fromthe soil map, 73 different soil types were distinguished in thebasin. The irrigated area was obtained from the global map
Table 2.Naturalized runoff coefficient (RCnat) and observed runoffcoefficient (RCobs) for selected stations.
Station Subbasin Number of Mean RCnat RCobsnumber area (km2) years annual
without observedmissing runoff
data (m3 s−1)
24 342 000 27 96.9 4.3 1.723 259 436 26 82.1 3.8 2.01 201 001 17 39.5 3.0 1.218 98 240 29 12.2 3.6 0.720 12 286 24 14.8 6.3 5.315 7483 32 4.6 6.3 3.1
of irrigated areas in 5 arcmin resolution based on Siebert etal. (2007) and FAO (1997). We computed the monthly irriga-tion intensities per grid cell using the irrigated area map, theirrigation water requirement data per riparian country in thebasin and the irrigation cropping pattern zones (FAO, 1997).
All meteorological forcing data used (precipitation, dailytemperature, daily minimum and maximum temperature at2 m) are the same as in Trambauer et al. (2014) and arebased on the ERA-Interim (ERAI, Dee et al., 2011) reanal-ysis data set from the European Centre for Medium-RangeWeather Forecasts (ECMWF). This data set covers the pe-riod from January 1979 to the present day with a horizon-tal resolution of approximately 0.7◦ and 62 vertical levels.A comprehensive description of the ERAI product is avail-able in Dee et al. (2011). The ERA-Interim precipitation dataused with the present model were corrected with GPCP v2.1(product of the Global Precipitation Climatology Project)to reduce the bias with measured products (Balsamo et al.,2010). The GPCP v2.1 data are the monthly climatology pro-vided globally at a 2.5◦ × 2.5◦ resolution, covering the pe-riod from 1979 to September 2009. The data set combines
Hydrol. Earth Syst. Sci., 18, 2925–2942, 2014 www.hydrol-earth-syst-sci.net/18/2925/2014/

P. Trambauer et al.: Identification and simulation of past hydrological droughts in the Limpopo River basin 2929
the precipitation information available from several sources(satellite data, rain gauge data, etc.) into a merged product(Huffman et al., 2009; Szczypta et al., 2011). From Septem-ber 2009 to December 2010, the mean monthly ERAI pre-cipitation was corrected using a mean bias coefficient basedon the climatology of the bias correction coefficients usedfor the period 1979–2009. While this only corrects for sys-tematic biases, this was the only option available at the time,as a new version of GPCP (version 2.2) was not available.Temperature data is used for the computation of the refer-ence potential evaporation needed to force the hydrologi-cal model. In this study the Hargreaves formula was used.This method uses only temperature data (minimum, maxi-mum and average), so it requires less parameterisation thanPenman–Monteith, with the disadvantage that it is less sen-sitive to climatic input data, with a possibly reduction of dy-namics and accuracy. However, it leads to a notably smallersensitivity to error in climatic inputs (Hargreaves and Allen,2003). Moreover, the potential evaporation derived from thePenman–Monteith equation and Hargreaves equation resultin very similar values throughout Africa, and the choice ofthe method used for the computation of the reference poten-tial evaporation appears to have minor effects on the resultsof the actual evaporation for southern Africa (Trambauer etal., 2014). For this study, the ERAI data were obtained forthe period of 1979–2010. These were converted to the samespatial resolution as the continental-scale model using bilin-ear interpolation to downscale from the ERAI grid to the 0.5◦
model grid. ERAI is archived using an irregular grid (reducedGaussian) over the domain and thus an interpolation was in-evitable to be able to use it in the model.
Runoff data were obtained from the Global Runoff DataCentre (GRDC;http://grdc.bafg.de/), the Department of Wa-ter Affairs in the Republic of South Africa and ARA-Sul(Administração Regional de Aguas do Sul, Mozambique).Runoff stations that had data available up until recent years,with relatively few missing data, are presented in Fig. 1. Mostof these stations are in the South African part of the basin asalmost no data could be found from stations in the other ri-parian countries. The subbasins draining to each hydrometricstation are named after the station number.
3 Methods
3.1 Process-based distributed hydrological model
General description
A process-based distributed hydrological (water balance)model based on PCR-GLOBWB (van Beek and Bierkens,2009) is used. First the global-scale model was adapted tothe continent of Africa (Trambauer et al., 2014). A higher-resolution version (0.05◦ × 0.05◦) of the continental model(0.5◦
× 0.5◦) was applied for the Limpopo River basin. The
PCR-GLOBWB was one of the 16 different land surface andhydrological models reviewed (Trambauer et al., 2013), andit was identified as one of the hydrological models that canpotentially be used for hydrological drought studies in largeriver basins in Africa. PCR-GLOBWB is in many ways sim-ilar to other global hydrological models, but it has many im-proved features, such as improved schemes for sub-grid pa-rameterisation of surface runoff, interflow and baseflow, akinematic-wave-based routing for the surface water flow, dy-namic inundation of floodplains, and a reservoir scheme (vanBeek and Bierkens, 2009; van Beek, 2008).
On a cell-by-cell basis and at a daily time step, the modelcomputes the water storage in two vertically stacked soil lay-ers (max. depth 0.3 and 1.2 m) and an underlying ground-water layer, as well as computing the water exchange be-tween the layers and between the top layer and the atmo-sphere. It also calculates canopy interception and snow stor-age. Within a grid cell, the sub-grid variability is taken intoaccount considering tall and short vegetation, open water anddifferent soil types. Crop factors are specified on a monthlybasis for short- and tall-vegetation fractions, as well as forthe open-water fraction within each cell. These crop fac-tors are calculated as a function of the leaf area index (LAI)as well as of the crop factors for bare soil and under full-cover conditions (van Beek et al., 2011). Monthly climatol-ogy of LAI is estimated for each GLCC (Global Land CoverCharacterization)-type, using LAI values per type for dor-mancy and growing season from Hagemann et al. (1999).LAI is then used to compute the crop factor per vegetationtype according to the FAO guidelines (Allen et al., 1998).The total specific runoff of a cell consists of the surfacerunoff (saturation excess), snowmelt runoff (after infiltra-tion), interflow (from the second soil layer) and baseflow(from the lowest reservoir as groundwater). River dischargeis calculated by accumulating and routing specific runoffalong the drainage network and including dynamic storageeffects and evaporative losses from lakes and wetlands (vanBeek and Bierkens, 2009; van Beek, 2008). The default PCR-GLOBWB model does not explicitly consider irrigated areasbut the version of the model used here includes an irrigationmodule to account for the highly modified hydrological pro-cesses in the irrigated areas of the basin.
3.2 Drought indicators
The meteorological drought indicators used in this study arecomputed only from meteorological variables: precipitationand potential evaporation. Agricultural and hydrological in-dicators, on the other hand, are computed from the results ofthe hydrological model and therefore account for effects ofsoil, land use, groundwater characteristics, etc., in the basin.The indicators used in this study are described below.
www.hydrol-earth-syst-sci.net/18/2925/2014/ Hydrol. Earth Syst. Sci., 18, 2925–2942, 2014

2930 P. Trambauer et al.: Identification and simulation of past hydrological droughts in the Limpopo River basin
3.2.1 Meteorological drought indicators
Standardized Precipitation Index (SPI)
The SPI was developed by McKee et al. (1993) and it in-terprets rainfall as a standardised departure with respect to arainfall probability distribution. It requires fitting the precip-itation time series to a gamma distribution function, whichis then transformed to a normal distribution allowing thecomparison between different locations. The SPI [−] is thencomputed as the discrete precipitation anomaly of the trans-formed data divided by the standard deviation of the trans-formed data (Keyantash and Dracup, 2002; McKee et al.,1993). SPI values mainly range from−2 (extremely dry) to 2(extremely wet).
Standardized Precipitation Evaporation Index (SPEI)
Instead of using only precipitation as in the SPI, the SPEIuses the difference between precipitation (P ) and potentialevaporation (PET), i.e.D =P − PET, and the PET is com-puted following the Thornthwaite method (Vicente-Serranoet al., 2010a, b). The calculatedD values are aggregatedat different timescales, following the same procedure as forthe SPI. A log-logistic probability function is then fitted tothe data series ofD, and the function is then standardisedfollowing the classical approximation of Abramowitz andStegun (1965). The SPEI also ranges between−2 and 2; theaverage value of the SPEI is 0, and the standard deviation is 1(Vicente-Serrano et al., 2010a, b).
3.2.2 Agricultural drought indicators
Agricultural droughts are defined as the lack of soil moistureto fulfil crop demands, and therefore the agriculture sector isnormally the first to be affected by a drought. In this study wecharacterise agricultural droughts by means of two spatiallydistributed indicators defined as described in the following.
Evapotranspiration Deficit Index (ETDI)
The ETDI (Narasimhan and Srinivasan, 2005) is computedfrom the anomaly of water stress to its long-term average.The monthly water stress ratio (WS [0–1]) is computed as:
WS =PET− AET
PET, (1)
where PET and AET are the monthly reference potentialevaporation and monthly actual evaporation, respectively.The monthly water stress anomaly (WSA) is calculated as
WSAy,m =MWSm − WSy,m
MWSm − minWSm
× 100,
if WSy,m ≤ MWSm (2)
WSAy,m =MWSm − WSy,m
maxWSm − MWSm
× 100,
if WSy,m > MWSm (3)
where MWSy,m is the long-term median of water stress ofmonthm, maxMWSm is the long-term maximum water stressof monthm, minWSm is the long-term minimum water stressof month m, and WSy,m is the monthly water stress ra-tio (y = 1979–2010 andm = 1–12). Narasimhan and Srini-vasan (2005) scaled the ETDI to between−4 and 4 to becomparable with the PDSI. Here, we used the same scalingprocedure but amended this to scale the ETDI to between−2and 2 to make it comparable to the SPI, SPEI and SRI:
ETDIy,m = 0.5ETDIy,m−1 +WSAy,m
100. (4)
Root Stress Anomaly Index (RSAI)
The “root stress” (RS) is a spatial indicator of the availablesoil moisture, or the lack of it, in the root zone. The root stressvaries from 0 to 1, where 0 indicates that the soil water avail-ability in the root zone is at field capacity and 1 indicatesthat the soil water availability in the root zone is zero andthe plant is under maximum water stress. The RSAI is com-puted similarly to the ETDI described above. The monthlyroot stress anomaly (RSA) is calculated as
RSAy,m =MRSm − RSy,m
MRSm − minRSm
× 100,
if RSy,m ≤ MRSm (5)
RSAy,m =MRSm − RSy,m
maxRSm − MRSm
× 100,
if RSy,m > MRSm (6)
where MRSm is the long-term median root stress ofmonthm, maxMRSm is the long-term maximum root stressof monthm, minRSm is the long-term minimum root stressof monthm, and RSy,m is the monthly root stress (y = 1979–2010 andm = 1–12). The root stress anomaly index, scaled tobetween−2 and 2 (using the same procedure as Narasimhanand Srinivasan, 2005) is
RSAIy,m = 0.5RSAIy,m−1 +RSAy,m
100. (7)
3.2.3 Hydrological drought indicators
For the characterisation of hydrological droughts we used thecommonly applied Standardized Runoff Index (SRI; Shuklaand Wood, 2008) for streamflow and the Groundwater Re-source Index (GRI; Mendicino et al., 2008) for groundwaterstorage.
Standardized Runoff Index (SRI)
The SRI follows the same concept as the SPI and is defined asa “unit standard normal deviate associated with the percentile
Hydrol. Earth Syst. Sci., 18, 2925–2942, 2014 www.hydrol-earth-syst-sci.net/18/2925/2014/

P. Trambauer et al.: Identification and simulation of past hydrological droughts in the Limpopo River basin 2931
of hydrologic runoff accumulated over a specific duration”(Shukla and Wood, 2008). To compute the SRI the simulatedrunoff time series is fitted to a probability density function(a gamma distribution is used here), and the function is usedto estimate the cumulative probability of the runoff of inter-est for a specific month and temporal scale. The cumulativeprobability is then transformed to the standardised normaldistribution with a mean of 0 and a variance of 1 (Shukla andWood, 2008).
Groundwater Resource Index (GRI)
The GRIy,m is suggested as a standardisation of the monthlyvalues of groundwater storage (detention) without any trans-formation (Mendicino et al., 2008):
GRIy,m =Sy,m − µS,m
σS,m
, (8)
whereSy,m is the value of the groundwater storage for theyeary and the monthm, andµS,m andσS,m are respectivelythe mean and the standard deviation of the groundwater stor-ageS simulated for the monthm in a defined number of years(32 years in this case). The same classification that is used forthe SPI (between−2 and 2) is applied to the GRI (Wanderset al., 2010).
3.3 Identification of past droughts and primarycharacterisation of drought severity
To identify past droughts, the drought indicators describedwere calculated for the period 1979–2010 for the LimpopoRiver basin, resulting in times series of monthly indicatormaps. The maps allow for the visualisation of the spatial vari-ability of the indicators in the basin. The SPI, SPEI and SRIwere computed for different aggregation periods (1, 3, 6, 12and 24). All the indicators were then aggregated over sev-eral subbasins resulting in times series for each indicator. Thehistorical subbasin-averaged indicators were then compared.Maps of the indicators are also compared for specific yearsto show the spatial variability of the indicators and the extentof the droughts.
All indices considered were scaled to range between−2and 2. Based on the SPI values, droughts may be classi-fied into mild (0> SPI≥ −1), moderate (−1> SPI≥ −1.5),severe (−1.5> SPI≥ −2) and extreme (SPI< −2) (Lloyd-Hughes and Saunders, 2002; see Table 3). For the SPI andSPEI, the spatially averaged indicators are no longer relatedto a probability of occurrence. However, we still use thesame thresholds for the characterisation of the subbasin ag-gregated droughts, as we understand that the resulting indi-cators would not be very different from the computation ofthese indicators with aggregated precipitation and potentialevaporation. For agricultural (ETDI and RSAI) and ground-water indicators (GRI) this is not the case as these are notdefined based on a probability of occurrence.
Table 3.State definition according to the index value.
Index value (Iv) State category
Iv ≥ 2.0 Extremely wet1.5≤ Iv < 2.0 Severely wet1.0≤ Iv < 1.5 Moderately wet0≤ Iv < 1.0 Mildly wet−1.0≤ Iv < 0 Mild drought−1.5≤ Iv < −1.0 Moderate drought−2.0≤ Iv < −1.5 Severe droughtIv < −2.0 Extreme drought
Droughts are generally characterised by a start date and anend date (both defining duration), drought intensity (indica-tor value), and severity or drought magnitude. The droughtseverity (DS) definition by McKee et al. (1993) is used here:
DS = −
(x∑
j=1
Ivij
), (9)
where Iv is the indicator value;j starts with the first monthof a drought and continues to increase until the end of thedrought (x) for any of thei timescales. The DS [months]would be numerically equivalent to the drought duration ifthe drought had an intensity (value) of−1.0 for each month(McKee et al., 1993).
4 Results and discussion
4.1 Hydrological model performance
Given the complexity of the basin for hydrological mod-elling, particularly due to the arid or semi-arid nature, themodel results are quite satisfactory, especially for the largersubbasins. Runoff estimates from the hydrological modelwere verified with observed runoff on a monthly basis. Fora number of the runoff stations tested, the coefficient of de-termination (R2) values varied from about 0.45 to as goodas 0.92. In a review of model application and evaluation, Mo-riasi et al. (2007) recommended three quantitative statisticsfor model evaluation: Nash–Sutcliffe efficiency (NSE), per-cent bias (PBIAS) and the ratio of the root mean square er-ror to the standard deviation of the measured data (RSR).They also specified ranges for these statistics for a “sat-isfactory” model performance (NSE> 0.5, RSR≤ 0.70 andPBIAS± 25 % for streamflow). However, PBIAS is highlyinfluenced by uncertainty in the observed data (Moriasi et al.,2007). Given the potential problems in observed flow datain South Africa, reported by the Water Research Commis-sion (2009), such as poor accuracy of the rating table, partic-ularly at low flows, and the inability to measure high flows,we do not evaluate our results based on PBIAS. The evalua-tion measures NSE and RSR together with the coefficient of
www.hydrol-earth-syst-sci.net/18/2925/2014/ Hydrol. Earth Syst. Sci., 18, 2925–2942, 2014

2932 P. Trambauer et al.: Identification and simulation of past hydrological droughts in the Limpopo River basin
Table 4.Model evaluation measures for runoff for selected stations.
Station number R2 NSE RSR
24 0.92 0.90 0.3223 0.62 0.38 0.791 0.69 0.57 0.6518 0.68 0.62 0.6220 0.70 0.65 0.5915 0.53 0.48 0.72
determination for selected stations are presented in Table 4.We do not calibrate parameters based on these evaluationmeasures, but we use them as a simple test of concordance.Based on the ranges proposed by Moriasi et al. (2007), themodel performance is found to be satisfactory for four out ofsix runoff stations.
4.2 Identification of historic hydrological droughtsin the basin
Drought indicators were computed for the period 1979–2010. Agricultural and hydrological drought indicators werecomputed from the fluxes resulting from the hydrologi-cal model. Because the focus in the current model is tosimulate hydrological droughts, it is important that themodel captures the most important drought events in thesimulation period 1979–2010. DEWFORA (2012) reportedthat in the period 1980–2000, the southern African regionwas struck by four major droughts, notably in the sea-sons 1982/1983, 1986/1987, 1991/1992 and 1994/1995. Thedrought of 1991/1992 was the most severe in the region inrecent history. After the year 2000, important droughts in-clude the years 2002/2003/2004 and 2005/2006. Droughts inthe Limpopo River basin also show significant spatial vari-ability. A study covering only the Botswana part of the basindocuments a severe drought that occurred in 1984 (Dube andSekhwela, 2007). However, in that year no documentation ofdrought in the other parts of the basin was found.
4.2.1 Agricultural droughts
Figure 2 presents the RSAI and ETDI for the most severedrought in recent history (1991/1992), for the very dry year1982/1983, for a wet year (1999/2000) and for a year withboth dry and wet conditions at different locations in thebasin (1984/1985). The geographic variability of the RSAIseems to be slightly higher than that of the ETDI. These in-dicators provide information for the assessment of agricul-tural droughts. The figure shows that both indicators, com-puted from different outputs of the hydrological model (ac-tual evaporation and soil moisture), produce similar resultsand are able to reproduce the dry or wet conditions in thebasin. This is also supported by Fig. 3, which shows thefraction of the Limpopo Basin under moderate to extreme
Figure 2. Root Stress Anomaly Index (RSAI) and Evapotranspira-tion Deficit Index (ETDI) in the Limpopo Basin for selected years.
agricultural drought, i.e. Iv< −1.0. Both indicators illustratethat a large part of the basin was under at least moderateagricultural drought conditions for the years with recordeddrought events.
4.2.2 Hydrological droughts
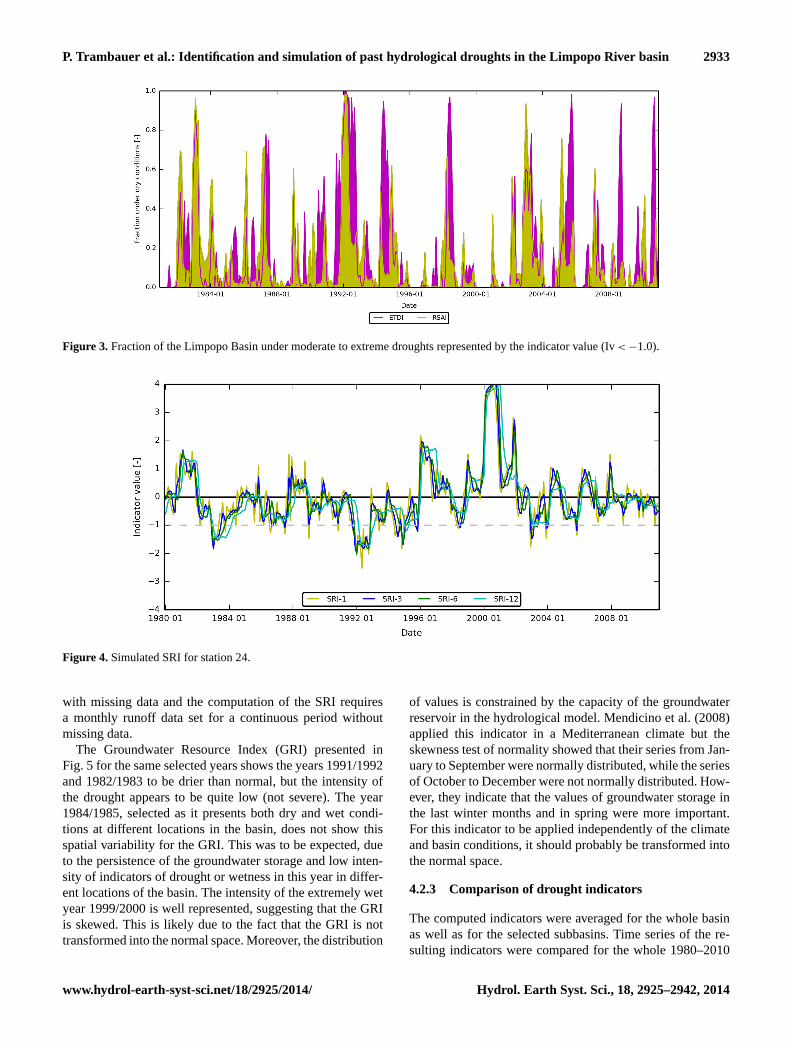
Figure 4 shows the SRI values (1, 3, 6 and 12 months) from1980 to 2010 computed from the simulated runoff at sta-tion 24. The dotted grey line at the threshold value of−1is used to identify moderate droughts, with the moderatedrought considered to start when the indicator falls below thethreshold, and stop when the indicator goes above the thresh-old. The simulated SRI clearly identifies the severe hydro-logical droughts of 1982/1983 and 1991/1992 and the verywet (flood) year of 1999/2000. The SRI from observed datawas not included in the figure given that there are periods
Hydrol. Earth Syst. Sci., 18, 2925–2942, 2014 www.hydrol-earth-syst-sci.net/18/2925/2014/
P. Trambauer et al.: Identification and simulation of past hydrological droughts in the Limpopo River basin 2933
Figure 3. Fraction of the Limpopo Basin under moderate to extreme droughts represented by the indicator value (Iv< −1.0).
Figure 4. Simulated SRI for station 24.
with missing data and the computation of the SRI requiresa monthly runoff data set for a continuous period withoutmissing data.
The Groundwater Resource Index (GRI) presented inFig. 5 for the same selected years shows the years 1991/1992and 1982/1983 to be drier than normal, but the intensity ofthe drought appears to be quite low (not severe). The year1984/1985, selected as it presents both dry and wet condi-tions at different locations in the basin, does not show thisspatial variability for the GRI. This was to be expected, dueto the persistence of the groundwater storage and low inten-sity of indicators of drought or wetness in this year in differ-ent locations of the basin. The intensity of the extremely wetyear 1999/2000 is well represented, suggesting that the GRIis skewed. This is likely due to the fact that the GRI is nottransformed into the normal space. Moreover, the distribution
of values is constrained by the capacity of the groundwaterreservoir in the hydrological model. Mendicino et al. (2008)applied this indicator in a Mediterranean climate but theskewness test of normality showed that their series from Jan-uary to September were normally distributed, while the seriesof October to December were not normally distributed. How-ever, they indicate that the values of groundwater storage inthe last winter months and in spring were more important.For this indicator to be applied independently of the climateand basin conditions, it should probably be transformed intothe normal space.
4.2.3 Comparison of drought indicators
The computed indicators were averaged for the whole basinas well as for the selected subbasins. Time series of the re-sulting indicators were compared for the whole 1980–2010
www.hydrol-earth-syst-sci.net/18/2925/2014/ Hydrol. Earth Syst. Sci., 18, 2925–2942, 2014

2934 P. Trambauer et al.: Identification and simulation of past hydrological droughts in the Limpopo River basin
Figure 5. Groundwater Resource Index (GRI) for selected years.
period. Figure 6 presents the time series of aggregateddrought indicators for subbasin 24. Note that the subbasinsare named after the hydrometric station number. Figure 6compares the agricultural, hydrological and groundwaterdrought indicators. The agricultural indicators ETDI andRSAI are compared with the meteorological drought in-dicators SPI and SPEI with the short aggregation period(3 months) that is commonly used as indicators of agricul-tural droughts. Figure 6 (upper plot) shows that the indicesare mostly in phase, correctly representing the occurrence ofdry and wet years, and the intensities of the events are in gen-eral quite similar. The hydrological drought indicator SRI-6is compared with the meteorological drought indicators SPI-6 and SPEI-6 (upper middle plot). All three indicators followroughly the same pattern, but the fluctuation of the SRI seemsto be slightly lower than that of the meteorological indices(SPI and SPEI). This is probably due to the higher persis-tence of streamflow when compared to precipitation. More-over, it is clearly visible from Fig. 6 that the temporal vari-ability or fluctuation of the indicators reduces when movingfrom drought indicators associated with agricultural droughtto those associated with hydrological drought. This meansthat several mild agricultural droughts do not progress fur-ther to hydrological droughts. Moreover, to identify ground-water droughts, or major drought events, the time series ofthe GRI is compared to the time series of meteorological andhydrological drought indicators with long aggregation pe-riods (SPI-12, SPEI-12, SRI-12, SPI-24, SPEI-24, SRI-24)(see Fig. 6, lower middle and lower plots). The plots showthat as the variability of the indicator reduces further, thenumber of multi-year, prolonged droughts increases. How-ever, for groundwater droughts, only two events (1982/1983and 1991/1992) are identified as moderate to severe droughts(Iv < −1). The plots again show that, in general, the temporal
variability of the runoff-derived indicator (SRI) is lower thanthat of the meteorological indicators (SPI and SPEI). TheGRI shows much less temporal variability than the otherindices and does not identify any extreme events, with theexception of the flood of 1999/2000. Similar results usingthe GRI were found by Wanders et al. (2010), who indi-cate that the GRI has a very low number of droughts witha high average duration. Moreover, a study of Peters and VanLanen (2003) investigated groundwater droughts for two cli-matically contrasting regimes. For the semi-arid regime theyfound multi-annual droughts to occur frequently. They indi-cate that the effect of the groundwater system is to pool er-ratically occurring dry months into prolonged groundwaterdroughts for the semi-arid climate.
Table 5 presents a correlation matrix between all the indi-cators considered in this study for subbasin 24. Similar cor-relation results were found for the other subbasins. The ta-ble shows that the agricultural drought indicators ETDI andRSAI have the highest correlation with the SPEI-3, SPEI-6,SPI-3, SPI-6 and with the SRI with low aggregation periods(1 to 3 months). For every station the correlation betweenthe agricultural indicators and the SPEI is slightly higherthan with the SPI. While the hydrological drought indica-tors SRI-6 and SRI-12 present the highest correlation withthe meteorological drought indicators SPI-12 and SPEI-12,the extended hydrological drought indicator SRI-24 is bettercorrelated with the meteorological drought indicators SPI-24and SPEI-24. The GRI shows the highest correlation withthe SRI-6 and SRI-12. This makes sense, given the directconnection between groundwater and runoff, where ground-water (baseflow) contributes to the total runoff.
Figures 7–9 present the monthly spatial mean time seriesof drought indicators for subbasins 1, 18 and 20, respec-tively. The averaged indicators for subbasins 24 and 1, thetwo largest subbasins considered, are almost identical (seeFigs. 6 and 7). Figure 8 shows that even though the generalpattern of the time series for subbasin 18 is similar to thatfound for subbasins 24 and 1, some differences are notice-able. For example, Fig. 8 shows a clear drought period forsubbasin 18 in the years 1984/1985/1986, which is not ap-parent for subbasins 24 and 1. These localised drought eventsthat affected the upper part of the basin were not apparent forthe lower part of the basin. This was also observed in Fig. 2.Moreover, the extreme floods that occurred in the lower partof the basin in 1999/2000 are much less severe in the up-stream parts of the basin. For example, Fig. 9 shows that forsubbasin 20 (the smallest subbasin considered), the flood of1996/1997 was more severe than that of 1999/2000. Simi-larly, while the drought of 2003/2004 is quite mild when av-eraged over the largest selected subbasin (no. 24), it is quitesevere for subbasin 20 (similar to the droughts of 1983/1984and 1991/1992).
For the four subbasins a short but intense agriculturaldrought is noticeable at the beginning of the 2005/2006 sea-son, but this did not progress to an extended hydrological
Hydrol. Earth Syst. Sci., 18, 2925–2942, 2014 www.hydrol-earth-syst-sci.net/18/2925/2014/

P. Trambauer et al.: Identification and simulation of past hydrological droughts in the Limpopo River basin 2935
Tabl
e5.
Cor
rela
tion
mat
rixfo
rsu
bbas
in24
.Bol
dita
licnu
mbe
rsin
dica
teco
rrel
atio
nshi
gher
than
0.7.
SP
I-3
SP
EI-
3E
TD
IR
SA
IS
PI-
6S
PE
I-6
SR
I-1
SR
I-2
SR
I-3
SR
I-6
SP
I-12
SP
EI-
12S
RI-
12S
PI-
24S
PE
I-24
SR
I-24
GR
IS
PI-
31.
00S
PE
I-3
0.91
1.00
ET
DI
0.79
0.82
1.00
RS
AI
0.70
0.73
0.84
1.00
SP
I-6
0.77
0.75
0.81
0.79
1.00
SP
EI-
60.
720.
800.
830.
800.
941.
00S
RI-
10.
690.
710.
840.
840.
740.
751.
00S
RI-
20.
670.
710.
830.
850.
750.
780.
971.
00S
RI-
30.
630.
680.
810.
850.
750.
780.
940.
991.
00S
RI-
60.
510.
580.
750.
820.
710.
760.
870.
930.
961.
00S
PI-
120.
530.
560.
700.
740.
730.
750.
720.
750.
780.
821.
00S
PE
I-12
0.48
0.58
0.68
0.71
0.68
0.77
0.69
0.73
0.75
0.81
0.96
1.00
SR
I-12
0.37
0.45
0.61
0.65
0.53
0.61
0.74
0.80
0.83
0.91
0.81
0.83
1.00
SP
I-24
0.45
0.48
0.56
0.59
0.60
0.63
0.65
0.68
0.69
0.72
0.79
0.80
0.76
1.00
SP
EI-
240.
400.
480.
520.
540.
540.
620.
600.
620.
640.
670.
710.
790.
730.
961.
00S
RI-
240.
300.
350.
440.
460.
420.
470.
600.
640.
670.
710.
570.
620.
800.
830.
841.
00G
RI
0.37
0.34
0.48
0.57
0.48
0.42
0.72
0.75
0.76
0.76
0.57
0.48
0.73
0.60
0.49
0.66
1.00
www.hydrol-earth-syst-sci.net/18/2925/2014/ Hydrol. Earth Syst. Sci., 18, 2925–2942, 2014

2936 P. Trambauer et al.: Identification and simulation of past hydrological droughts in the Limpopo River basin
Figure 6. Time series of aggregated drought indicators for subbasin 24. Upper graph: indicators used to characterise agricultural droughts(SPI-3, SPEI-3, ETDI and RSAI); upper middle panel: indicators used to characterise hydrological drought (SPI-6, SPEI-6 and SRI-6);lower middle panel: indicators used to characterise groundwater droughts (SPI-12, SPEI-12 and SRI-12); and lower panel: indicators used tocharacterise extended groundwater droughts (SPI-24, SPEI-24, GRI and SRI-24).
drought. This is consistent with the literature, which in-dicates that this season was delayed and after a dry startto the season, good rainfall occurred from the second halfof December (Department of Agriculture of South Africa,2006). In subbasin 18 (Fig. 8), even though meteorologi-cal indicators (SPI-6, SPEI-6, SPI-12 and SPEI-12) suggestthat the 1986/1987 season was near normal to wet, the hy-drological indicators (SRI-6, SRI-12) point to a dry runoffyear. Measured runoff at this station indicates that the year1986/1987 was indeed a dry year. This seems similar towhat was found by Peters and van Lanen (2003); for longeraggregations periods an accumulation of successive short
anomalies can lead to an overall hydrological drought. Sim-ilarly, meteorological indicators suggest that the floods of1996/1997 and 1999/2000 in the lower part of the basin wereof a similar magnitude. However, records indicate that theflood of 1999/2000 was much more extreme than the one of1996/1997 (WMO, 2012). This can be seen clearly in the hy-drological drought indicators SRI-6, SRI-12 and SRI-24. TheGRI shows almost no departure from normal, with the excep-tion of the flood of 1999/2000. These results show the impor-tance of computing indicators that can be related to hydro-logical drought and how these add value to the identificationof droughts and floods and their severity. The indicators also
Hydrol. Earth Syst. Sci., 18, 2925–2942, 2014 www.hydrol-earth-syst-sci.net/18/2925/2014/

P. Trambauer et al.: Identification and simulation of past hydrological droughts in the Limpopo River basin 2937
Figure 7. Same as Fig. 6, but for subbasin 1.
help identify the spatial and temporal evolution of droughtand flood events that would otherwise not have been appar-ent when considering only meteorological indicators.
We also computed drought severities (DS (months)) re-sulting from the different indicators as explained in Sect. 3.3(Eq. 9). The droughts of 1982/1983, 1986/1987, 1991/1992,1994/1995, 2002/2003/2004 and 2005/2006 are identified asbeing among the most severe droughts, but the end monthof these drought events varies for the different indicators.The indicators with higher aggregation periods (e.g. 12 and24 months), which have a lower temporal variability, gen-erally point to longer droughts (multi-year droughts) withhigher persistence than indicators with lower aggregation pe-riods (agricultural droughts). For example, while the agri-cultural indicators suggest that the extreme drought of
1991/1992 was over by the end of 1992 or beginning of1993, the indicators that represent hydrological droughts sig-nal that this drought only ended at the end of 1993. More-over, for the SRI-12, GRI, SPI-24 and SPEI-24, this multi-year drought lasts until 1994/1995. As an example for sub-basin 24, Fig. 10 presents the duration and severity of the sixmost severe recorded droughts as identified by the meteoro-logical drought indicator SPEI aggregated for different peri-ods to represent agricultural, hydrological and extended hy-drological droughts (multi-year droughts). The graph showsthat the multi-year droughts resulting from the accumulationof shorter successive droughts are the most severe as a resultof the duration. These droughts can be the most hazardous,as a succession of mild droughts that can initially seem non-problematic can result in very severe droughts if they last for
www.hydrol-earth-syst-sci.net/18/2925/2014/ Hydrol. Earth Syst. Sci., 18, 2925–2942, 2014

2938 P. Trambauer et al.: Identification and simulation of past hydrological droughts in the Limpopo River basin
Figure 8. Same as Fig. 6, but for subbasin 18.
a long time. The average intensity of these droughts is gen-erally lower than that of the agricultural droughts, which canbe very intense but often of shorter duration.
5 Conclusions
Very low runoff coefficients and high rainfall variabilitypose major challenges in modelling hydrological droughts in(semi-)arid basins. Small errors in the meteorological forcingand estimation of evaporation may result in significant errorsin the runoff estimation. This also implies that model cali-bration, if any, should be applied cautiously to maintain thephysical meaning of model parameters. We opted to applya process-based model and parameterise it on the basis ofthe best available input data without additional calibration.
In the process we ensured that we were using reliable datasets and interpolated or aggregated them with care to pre-pare spatially distributed parameter maps. The model is ableto simulate hydrological drought-related indices reasonablywell. We have derived a number of different drought indica-tors from the model results, such as the ETDI, RSAI, SRIand GRI. While the SRI is based on river runoff at a partic-ular river section, the ETDI, RSAI and GRI are spatial in-dicators that can be estimated at any location in the basin.The ETDI and RSAI are directly related to water availabil-ity for vegetation with or without irrigation, and the GRIis related to groundwater storage. Moreover, we computedthe widely known drought indicators SPI and SPEI at dif-ferent aggregation periods to verify the correlation of the
Hydrol. Earth Syst. Sci., 18, 2925–2942, 2014 www.hydrol-earth-syst-sci.net/18/2925/2014/

P. Trambauer et al.: Identification and simulation of past hydrological droughts in the Limpopo River basin 2939
Figure 9. Same as Fig. 6, but for subbasin 20.
Figure 10. Drought severity and duration in subbasin 24 for the six most severe droughts in the period 1980–2010 for the indicator SPEIwith different aggregation periods.
www.hydrol-earth-syst-sci.net/18/2925/2014/ Hydrol. Earth Syst. Sci., 18, 2925–2942, 2014

2940 P. Trambauer et al.: Identification and simulation of past hydrological droughts in the Limpopo River basin
different aggregation periods for these indicators and the dif-ferent types of droughts.
All the indicators considered (with the exception of theGRI) are able to represent the most severe droughts in thebasin and to identify the spatial variability of the droughts.Our results show that even though meteorological indica-tors with different aggregation periods serve to characterisedroughts reasonably well, there is added value in computingindicators based on the hydrological model for the identifica-tion of hydrological droughts or floods and their severity. Theindicators also help identify the spatial and temporal evolu-tion of drought and flood events that would otherwise nothave been apparent when considering only meteorologicalindicators.
The RSAI follows the ETDI to a great extent, and theETDI is quite well represented by the SPEI-3 and the SPEI-6. This indicates that in the absence of actual evaporationand soil moisture data which are required to compute theETDI and RSAI, the meteorological indicator SPEI-3, whichconsiders both precipitation and potential evaporation and isreasonably easy to compute, may be used as an indicator ofagricultural droughts. For discharge we observe some addedvalue in computing the SRI. Even though the SPI can give areasonable indication of drought conditions, computing theSRI can be more effective for the identification of hydrologi-cal droughts. The groundwater indicator GRI mostly remainsnear normal conditions. A combination of different indica-tors, such as the SPEI-3, SRI-6 and SPI-12 (computed to-gether), can be an effective way to characterise agricultural tolong-term hydrological droughts in the Limpopo River basin.
Acknowledgements.This study was carried out as part of theDEWFORA (Improved Drought Early Warning and Forecastingto strengthen preparedness and adaptation to droughts in Africa)project, which is funded by the Seventh Framework Programme forResearch and Technological Development (FP7) of the EuropeanUnion (Grant agreement no. 265454).
Edited by: A. Opere
References
Abramowitz, M. and Stegun, I. A.: Handbook of mathematical func-tions, with formulas, graphs, and mathematical tables, DoverPublications, Dover, 1046 pp., 1965.
Allen, R. G., Pereira, L., Raes, D., and Smith, M.: Crop evapotran-spiration – Guidelines for computing crop water requirements,FAO Irrigation and drainage paper No. 56, FAO, Rome, 26–40,1998.
Alley, W. M.: The Palmer Drought Severity Index: Limitationsand Assumptions, J. Clim. Appl. Meteorol., 23, 1100–1109,doi:10.1175/1520-0450(1984)023<1100:tpdsil>2.0.co;2, 1984.
Alston, M. and Kent, J.: Social impacts of drought, Centre for RuralSocial Research, Charles Sturt University, Wagga Wagga, NSW,2004.
Balsamo, G., Boussetta, S., Lopez, P., and Ferranti, L.: Evaluationof ERA-Interim and ERA-Interim-GPCP-rescaled precipitationover the USA, ECMWF ERA Report Series 5, 1–25, availableat: http://www.ecmwf.int/publications/library/do/references/list/782009(last access: December 2013), 2010.
Barbosa, P., Naumann, G., Valentini, L., Vogt, J., Dutra, E.,Magni, D., and De Jager, A.: A Pan-African map viewer fordrought monitoring and forecasting, 14th Waternet Symposium,30 October–1 November 2013, Dar es Salaam, Tanzania, 2013.
Dee, D. P., Uppala, S. M., Simmons, A. J., Berrisford, P., Poli,P., Kobayashi, S., Andrae, U., Balmaseda, M. A., Balsamo, G.,Bauer, P., Bechtold, P., Beljaars, A. C. M., van de Berg, L., Bid-lot, J., Bormann, N., Delsol, C., Dragani, R., Fuentes, M., Geer,A. J., Haimberger, L., Healy, S. B., Hersbach, H., Hólm, E. V.,Isaksen, L., Kållberg, P., Köhler, M., Matricardi, M., McNally,A. P., Monge-Sanz, B. M., Morcrette, J. J., Park, B. K., Peubey,C., de Rosnay, P., Tavolato, C., Thépaut, J. N., and Vitart, F.: TheERA-Interim reanalysis: configuration and performance of thedata assimilation system, Q. J. Roy. Meteorol. Soc., 137, 553–597, doi:10.1002/qj.828, 2011.
Department of Agriculture of South Africa: Crops and markets– First quarter 2006, Vol. 87, No. 927, Directorate Agricul-tural Statistics – Department of Agriculture,http://www.daff.gov.za/docs/statsinfo/Crops_0106.pdf(last access: December 2013),2006.
DEWFORA: WP6-D6.1 – Implementation of improved methodolo-gies in comparative case studies - Inception report for each casestudy, DEWFORA Project – EU FP7,www.dewfora.net(last ac-cess: December 2013), 2012.
Dube, O. P., and Sekhwela, M. B. M.: Community copingstrategies in Semiarid Limpopo basin part of Botswana:Enhancing adaptation capacity to climate change, 1–40,http://www.aiaccproject.org/working_papers/Working%20Papers/AIACCWP47_Dube.pdf(last access: December 2013),2007.
Dürr, H. H., Meybeck, M., and Dürr, S. H.: Lithologic composi-tion of the Earth’s continental surfaces derived from a new digitalmap emphasizing riverine material transfer, Global Biogeochem.Cy., 19, GB4S10, doi:10.1029/2005GB002515, 2005.
FAO: Irrigation Potential in Africa: A Basin Approach, FAO-UN,Rome, 1997.
FAO, The digital soil map of the world (Version 3.6), FAO-UN,Rome, http://www.fao.org/geonetwork/srv/en/metadata.show?id=14116\&currTab=distribution(last access: 21 August 2012),2003.
Glantz, M. H. E.: Drought and Hunger in Africa: Denying Faminea Future, Cambridge University Press, Cambridge, 1987.
Guttman, N. B.: Comparing the Palmer Drought Index and the Stan-dardized Precipitation Index, J. Am. Water Resour. Assoc., 34,113–121, doi:10.1111/j.1752-1688.1998.tb05964.x, 1998.
Hagemann, S.: An improved land surface parameter dataset forglobal and regional climate models, MPI Report No. 336, MaxPlanck Institute for Meteorology, Hamburg, 2002.
Hagemann, S., Botzet, M., Dümenil, L., and Machenhauer, B.:Derivation of global GCM boundary conditions from 1 km landuse satellite data, MPI Report No. 289, Max Planck Institute forMeteorology, Hamburg, 1999.
Hydrol. Earth Syst. Sci., 18, 2925–2942, 2014 www.hydrol-earth-syst-sci.net/18/2925/2014/

P. Trambauer et al.: Identification and simulation of past hydrological droughts in the Limpopo River basin 2941
Hargreaves, G. H. and Allen, R. G.: History and Evaluation of Har-greaves Evapotranspiration Equation, J. Irrig. Drain. Eng., 129,53–63, 2003.
Huffman, G. J., Adler, R. F., Bolvin, D. T., and Gu, G.: Improvingthe global precipitation record: GPCP version 2.1, Geophys. Res.Lett., 36, L17808, doi:10.1029/2009GL040000, 2009.
IPCC: Climate Change 2007: The Physical Science Basis. Contri-bution of Working Group I to the Fourth Assessment, in: Reportof the Intergovernmental Panel on Climate Change, edited by:Solomon, S., Qin, D., Manning, M., Chen, Z., Marquis, M., Av-eryt, K. B., Tignor, M., and Miller, H. L., Cambridge UniversityPress, Cambridge, UK and New York, NY, USA, 996 pp., 2007.
Keyantash, J. and Dracup, J. A.: The quantification of drought: anevaluation of drought indices, B. Am. Meteorol. Soc., 83, 1167–1180, 2002.
LBPTC: Joint Limpopo River Basin Study Scoping Phase, FinalReport, BIGCON Consortium, Limpopo Basin PermanentTechnical Committee,http://www.limcom.org/_system/writable/DMSStorage/1031en/LIMCOM2010_ScopingStudyEng.pdf(last access: December 2013), 2010.
Lehner, B., Döll, P., Alcamo, J., Henrichs, T., and Kaspar, F.: Esti-mating the impact of global change on flood and drought risks inEurope: a continental, integrated analysis, Climatic Change, 75,273–299, 2006.
Lloyd-Hughes, B. and Saunders, M. A.: A drought climatology forEurope, Int. J. Climatol., 22, 1571–1592, doi:10.1002/joc.846,2002.
McKee, T. B., Doesken, N. J., and Kleist, J.: The relationship ofdrought frequency and duration to time scales, Proceedings of the8th Conference on Applied Climatology, Vol. 17. No. 22, Boston,MA, Am. Meteorol. Soc., 17, 179–183, 1993.
Mendicino, G., Senatore, A., and Versace, P.: A GroundwaterResource Index (GRI) for drought monitoring and forecast-ing in a mediterranean climate, J. Hydrol., 357, 282–302,doi:10.1016/j.jhydrol.2008.05.005, 2008.
Moriasi, D., Arnold, J., Van Liew, M., Bingner, R., Harmel, R., andVeith, T.: Model evaluation guidelines for systematic quantifica-tion of accuracy in watershed simulations, Trans. ASABE, 50,885–900, 2007.
Narasimhan, B. and Srinivasan, R.: Development and eval-uation of Soil Moisture Deficit Index (SMDI) and Evap-otranspiration Deficit Index (ETDI) for agriculturaldrought monitoring, Agr. Forest Meteorol., 133, 69–88,doi:10.1016/j.agrformet.2005.07.012, 2005.
Palmer, W. C.: Meteorological drought, Research paper no. 45,US Department of Commerce, Weather Bureau, Washington,D.C., USA, 1–58, 1965.
Patz, J. A., Campbell-Lendrum, D., Holloway, T., and Foley, J. A.:Impact of regional climate change on human health, Nature, 438,310–317, 2005.
Peters, E. and Van Lanen, H. A. J.: Propagation of drought ingroundwater in semiarid and sub-humid climatic regimes, in:Hydrology in Mediterranean and semiarid regions: Internationalconference, Montpellier, France, IAHS Press, Wallingford, UK,312–317, 2003.
Pilgrim, D. H., Chapman, T. G., and Goran, D. G.: Problems ofrainfall-runoff modelling in arid and semiarid regions, Hydrolog.Sci. J., 33, 379–400, doi:10.1080/02626668809491261, 1988.
Schulze, R. E.: Hydrological simulation as a tool for agriculturaldrought assessment, Water SA, 10, 55–62, 1984.
Sheffield, J. and Wood, E. F.: Projected changes in drought oc-currence under future global warming from multi-model, multi-scenario, IPCC AR4 simulations, Clim. Dynam., 31, 79–105,2008.
Shukla, S. and Wood, A. W.: Use of a standardized runoff indexfor characterizing hydrologic drought, Geophys. Res. Lett., 35,L02405, doi:10.1029/2007gl032487, 2008.
Siebert, S., Döll, P., Feick, S., Hoogeveen, J., and Frenken, K.:Global Map of Irrigation Areas version 4.0.1, Johann WolfgangGoethe University, Frankfurt am Main, Germany/Food and Agri-culture Organization of the United Nations, Rome, Italy, 2007.
Szczypta, C., Calvet, J.-C., Albergel, C., Balsamo, G., Boussetta,S., Carrer, D., Lafont, S., and Meurey, C.: Verification of the newECMWF ERA-Interim reanalysis over France, Hydrol. EarthSyst. Sci., 15, 647–666, doi:10.5194/hess-15-647-2011, 2011.
Trambauer, P., Maskey, S., Winsemius, H., Werner, M., and Uhlen-brook, S.: A review of continental scale hydrological models andtheir suitability for drought forecasting in (sub-Saharan) Africa,Phys. Chem. Earth, 66, 16–26, doi:10.1016/j.pce.2013.07.003,2013.
Trambauer, P., Dutra, E., Maskey, S., Werner, M., Pappenberger, F.,van Beek, L. P. H., and Uhlenbrook, S.: Comparison of differentevaporation estimates over the African continent, Hydrol. EarthSyst. Sci., 18, 193–212, doi:10.5194/hess-18-193-2014, 2014.
USGS EROS: Africa Land Cover Characteristics Data Base Ver-sio 2.0,http://edc2.usgs.gov/glcc/tablambert_af.php(last access:24 June 2012), 2002.
USGS EROS: Hydro1K Africa,http://eros.usgs.gov/#/FindData/Products_andData_Available/gtopo30/hydro/africa(last access:21 September 2012), 2006.
van Beek, L. P. H.: Forcing PCR-GLOBWB with CRU data, UtrechtUniversity, Utrecht, the Netherlands,http://vanbeek.geo.uu.nl/suppinfo/vanbeek2008.pdf(last access: December 2013), 2008.
van Beek, L. P. H. and Bierkens, M. F. P.: The Global Hydrologi-cal Model PCR-GLOBWB: Conceptualization, Parameterizationand Verification, Utrecht University, Faculty of Earth Sciences,Department of Physical Geography, Utrecht, the Netherlands,2009.
van Beek, L. P. H., Wada, Y., and Bierkens, M. F. P.: Global monthlywater stress: 1. Water balance and water availability, Water Re-sour. Res., 47, W07517, doi:10.1029/2010WR009791, 2011.
Vicente-Serrano, S. M., Beguería, S., and López-Moreno, J. I.: AMultiscalar Drought Index Sensitive to Global Warming: TheStandardized Precipitation Evapotranspiration Index, J. Climate,23, 1696–1718, doi:10.1175/2009jcli2909.1, 2010a.
Vicente-Serrano, S. M., Beguería, S., López-Moreno, J. I., Angulo,M., and El Kenawy, A.: A New Global 0.5◦ Gridded Dataset(1901–2006) of a Multiscalar Drought Index: Comparison withCurrent Drought Index Datasets Based on the Palmer DroughtSeverity Index, J. Hydrometeorol., 11, 1033–1043, 2010b.
Wanders, N., Lanen, H. A. J., and van Loon, A. F.: Indicatorsfor Drought Characterization on a Global Scale, WATCH Wa-ter and Global change EU FP6, Technical report No. 24,http://www.eu-watch.org/publications/technical-reports/3(last access:December 2013), 2010.
www.hydrol-earth-syst-sci.net/18/2925/2014/ Hydrol. Earth Syst. Sci., 18, 2925–2942, 2014

2942 P. Trambauer et al.: Identification and simulation of past hydrological droughts in the Limpopo River basin
Water Research Commission: IWR Rhodes University, Schoolof BEEH University of KwaZulu-Natal, and Water for Africa:Identification, estimation, quantification and incorporation ofrisk and uncertainty in water resources management tools inSouth Africa, Deliverable No. 3: Interim Report on Sources ofUncertainty, Water Research Commission Project No. K5/1838,http://www.ru.ac.za/static/institutes/iwr/uncertainty/k51838/DEL3_Uncertainty_Sources.pdf(last access: August 2014),2009.
WMO: Limpopo River basin – A proposal to improve theflood forecasting and early warning system, World Meteoro-logical Organization,http://www.wmo.int/pages/prog/hwrp/chy/chy14/documents/ms/Limpopo_Report.pdf(last access: Decem-ber 2013), 2012.
Zhu, T. and Ringler, C.: Climate Change Impacts on Water Avail-ability and Use in the Limpopo River Basin, Water, 4, 63–84,2012.
Hydrol. Earth Syst. Sci., 18, 2925–2942, 2014 www.hydrol-earth-syst-sci.net/18/2925/2014/