Embed Size (px)
Citation preview
Identi¢cationofdirect and indirect targets oftheGln3andGat1activators by transcriptional pro¢ling in response tonitrogenavailability in the short and long termBart Scherens, Andre Feller, Fabienne Vierendeels, Francine Messenguy & Evelyne Dubois
Institut de Recherches Microbiologiques J-M Wiame, and Laboratoire de Microbiologie, Universite Libre de Bruxelles, Brussels, Belgium
Correspondence: Evelyne Dubois, Institut de
Recherches Microbiologiques J-M Wiame,
and Laboratoire de Microbiologie, Universite
Libre de Bruxelles, avenue Emile Gryzon 1,
1070 Brussels, Belgium. Tel.: 132 2 526
7277; fax: 132 2 526 7273. e-mail:
Received 2 September 2005; revised 10
November 2005; accepted 5 December 2005.
First published online 24 March 2006.
doi:10.1111/j.1567-1364.2006.00060.x
Editor: Monique Bolotin-Fukuhara
Keywords
yeast; nitrogen; GATA factor; microarray; Tor;
Saccharomyces cerevisiae; transcriptional
profiling
Abstract
Nitrogen catabolite repression (NCR) consists in the specific inhibition of
transcriptional activation of genes encoding the permeases and catabolic enzymes
needed to degrade poor nitrogen sources. Under nitrogen limitation or rapamycin
treatment, NCR genes are activated by Gln3 or Gat1, or by both factors. To
compare the sets of genes responding to rapamycin or to nitrogen limitation, we
used DNA microarrays to establishing the expression profiles of a wild type strain,
and of a double gln3D–gat1D strain, grown on glutamine, after addition of
rapamycin, on proline, or after a shift from glutamine to proline. Analysis of
microarray data revealed 392 genes whose expression was dependent on the
nitrogen source quality. 91 genes were activated in a GATA factor-dependent
manner in all growth conditions, suggesting a direct role of Gln3 and Gat1 in their
expression. Other genes were only transiently up-regulated (stress-responsive
genes) or down-regulated (genes encoding ribosomal proteins and translational
factors) upon nitrogen limitation, and this regulation was delayed in a
gln3D–gat1D strain. Repression of amino acid and nucleotide biosynthetic genes
after a nitrogen shift did not depend on Gcn4. Several transporter genes were
repressed as a consequence of enhanced levels of NCR-responsive permeases
present at the plasma membrane.
Introduction
In Saccharomyces cerevisiae, nitrogen regulation (nitrogen
catabolite repression, NCR) refers to the difference in gene
expression during steady-state growth on optimal nitrogen
sources (glutamine, asparagine, ammonia) compared to the
growth on poorer nitrogen sources (proline, urea, g-amino-
butyrate). Yeast, like most microorganisms, transports,
accumulates and utilizes good nitrogen sources in prefer-
ence to poor ones, and NCR is the mechanism for achieving
this selectivity. NCR consists in the specific inhibition of
transcriptional activation systems of genes encoding per-
meases and catabolic enzymes needed to degrade poor
nitrogen sources. When readily used nitrogen sources are
available, NCR-sensitive genes are expressed at low basal
levels. Upon depletion of these repressive nitrogen sources,
NCR is relieved and transcription of NCR-sensitive genes is
activated by Gln3 or Gat1, or more frequently by both GATA
factors (Mitchell & Magasanik, 1984; Courchesne & Maga-
sanik, 1988; Stanbrough et al., 1995). In the presence of
good nitrogen sources, these two GATA transcriptional
activators are restricted to the cytoplasm by interaction with
Ure2, whereas in the presence of poor nitrogen sources these
GATA factors accumulate in the nucleus, and activate NCR-
sensitive transcription (Beck & Hall, 1999). Addition of the
immunosuppressant drug rapamycin to a good nitrogen
source transiently mimics a low-quality nitrogen source,
which results in activation of NCR gene expression by Gln3
and Gat1 (Beck & Hall, 1999; Cardenas et al., 1999; Hard-
wick et al., 1999; Bertram et al., 2000). Rapamycin inhibits a
conserved signaling cascade required for cell proliferation.
This cascade involves the two protein kinases Tor1 and Tor2,
protein phosphatases such as Sit4, and the phosphatase
regulatory subunit Tap42 (Como & Arndt, 1996; Thomas &
Hall, 1997; Jiang & Broach, 1999). It has been proposed that
Gln3 and Gat1 are phosphorylated in a Tor-dependent
manner and thereby tethered to the cytoplasmic Ure2
protein. Upon rapamycin treatment, Gln3 and Gat1 are
dephosphorylated by Sit4, released from Ure2 inhibition
and translocated to the nucleus, where they activate NCR
FEMS Yeast Res 6 (2006) 777–791 c� 2006 Federation of European Microbiological SocietiesPublished by Blackwell Publishing Ltd. All rights reserved

genes (Beck & Hall, 1999; Bertram et al., 2000). This
signaling mechanism has been extrapolated to the cell’s
response to nitrogen starvation and nitrogen availability
(reviewed in Cooper, 2002; Crespo & Hall, 2002; Magasanik
& Kaiser, 2002; Rohde & Cardenas, 2004). However, it was
shown recently that on a poor nitrogen source Gln3 is
localized in the nucleus, despite its hyperphosphorylation
(Cox et al., 2004). These data suggest that rapamycin
treatment, a short-term response, and growth on poor
nitrogen sources, and with a long-term response, generates
similar cellular responses, but likely do so by different
mechanistic pathways. These observations led us to investi-
gate whether the set of genes expressed after rapamycin
treatment is identical to that expressed under nitrogen
limitation, either by steady-state growth on a poor nitrogen
source or after a shift from an optimal nitrogen source to a
poor one. Moreover, we determined whether all these genes
were controlled in a Gln3- and Gat1-dependent manner.
To address these questions, we used DNA microarrays
comparing the expression profiles under steady-state growth
conditions on an optimal nitrogen source (M.Gln) and on a
poor nitrogen source (M.Pro), and under more transient
conditions such as addition of rapamycin to M.Gln, or
shifting cells from a good nitrogen source (M.Gln) to a
poorer one (M.Pro). These growth conditions allow discri-
mination between rapid adaptation to a cellular nitrogen
stress (short-term response), and the long-term adaptation
during growth on nitrogen sources of different qualities. In
contrast to other whole-genome analyses (Cox et al., 1999;
Shamji et al., 2000), we used a double gln3D–gat1D strain to
identify the entire set of genes regulated by nitrogen, as
expression of many NCR genes is abolished only in the
absence of both regulators.
Materials and methods
Strains and media
All the strains used in this work are derived from the BY
strain family, isogenic to S288c (Brachmann et al., 1998).
The long flanking homology strategy was used to perform
deletion of GLN3, GAT1 and URE2 (Wach, 1996). The
different coding sequences were replaced by the kanMX4
cassette, which confers resistance to geneticin, yielding
strains 4709DGLN3 (MATa, ura3, gln3::kanMX4),
4709DGAT1 (MATa, ura3, gat1::kanMX4), 4700DGAT1
(MATa, ura3, gat1::kanMX4), and 4709DURE2 (MATa,
ura3, ure2::kanMX4). To construct strain 03167b (MATa,
ura3, gln3::kanMX4, gat1::kanMX4), we crossed strains
4709DGLN3 and 4700DGAT1. To construct strain
1C22182b (ura3, leu2, his3, lys2, met15, msn2::kanMX4,
msn4::kanMX4), we crossed strains 4742DMSN2 (MATa,
ura3, leu2, his3, lys2, msn2::kanMX4) and 4741DMSN4
(MATa, ura3, leu2, his3, met15, msn4::kanMX4). Strains
4742DMSN2, 4741DMSN4, 4742DNPR1 (MATa, ura3,
leu2, his3, lys2, npr1::kanMX4) and 4742DGAP1 (MATa,
ura3, leu2, his3, lys2, gap1::kanMX4) were obtained from
the Saccharomyces Genome deletion collection (Winzeler
et al., 1999).
Strains F113 (MATa, ura3-52, ino1, can1), F212 (MATa,
ura3-52, ino1, can1, gcn4D) and H396 (MATa, ura3-52, ino1,
can1, GCN4c inserted at the URA3 locus) were gifts from
Alan Hinnebusch.
Yeast strains were grown on synthetic medium (YNB)
without ammonia, without amino acids and with 3%
glucose, supplemented with 1 mg mL�1 glutamine or
1 mg mL�1 proline as a nitrogen source. The shift from
glutamine (M.Gln) to proline (M.Pro) was achieved by
filtering the cells grown on M.Gln and cultivating them on
fresh M.Pro for 2 h. Rapamycin was used at a final concen-
tration of 200 ng mL�1. Stock solution (1 mg mL�1) of
rapamycin (Sigma, St Louis, MO) was prepared in a 90%
ethanol, 10% Tween-20 solution. When required, the med-
ium was supplemented with 25 mg mL�1 of uracil, leucine,
histidine, lysine and methionine.
Yeast cells were harvested during the exponential stage of
growth (OD660 0.40, measured with a Genesys 20 spectro-
photometer from Thermo Spectronic, Rochester, NY). Ad-
dition of rapamycin or the shift from glutamine to proline
were also performed at the same OD.
RNA preparation
Total RNAs were extracted following the method of Schmitt
et al. (1990), and purified using the RNeasy kit (Qiagen,
Chatsworth, CA).
Northern blot analysis
Northern blot analysis was performed as described by
Foury & Talibi (2001). DIG-DNA probes of about 500 bp
were generated by PCR using appropriate oligonucleotides,
and labeled using a PCR DIG probe synthesis kit (Roche,
Rotkreuz, Switzerland). Hybridizations were carried out acc-
ording to standard procedures. Detection of digoxigenin-
labeled nucleic acids was performed by enzyme immunoas-
say with luminescence following the supplier’s procedure
(Roche). The Hybond-N1nylon membranes were analyzed
with a chemiluminescence camera (Chemi-Smart from
Vilbert-Lourmat, Torcy, France). The exposure time varied
between 30 and 120 min.The RNA signals were quantified
using the Bio-1D analysis program from Vilbert-Lourmat.
Generation and analysis of microarray data
The yeast DNA chips were manufactured by Eurogentec
(Seraing, Belgium) and by Plateforme Transcriptome
FEMS Yeast Res 6 (2006) 777–791c� 2006 Federation of European Microbiological SocietiesPublished by Blackwell Publishing Ltd. All rights reserved
778 B. Scherens et al.
Biopuces (Centre de Bioingenierie Gilbert Durand, INSA,
Toulouse, France). Fluorescent cDNA synthesis for micro-
array hybridization was performed according to Foury &
Talibi (2001), using Cy3-dCTP or Cy5-dCTP (Amersham
Biosciences, Sunnyvale, CA). Hybridizations were per-
formed according to Foury & Talibi (2001). The hybridiza-
tion signal was measured using a GSM418 laser scanner.
Image analysis for each array was processed using the
GenePix Pro 4.0 (Axon Instruments Inc., Sunnyvale, CA)
software package, which measures fluorescence intensity
pairs for each gene. Following image acquisition, a visual
inspection of the individual spots on each microarray (size,
signal-to-noise ratio, background level, and spot unifor-
mity) completed the flagging (present/not present, good/
bad) of the data. To maximize sensitivity, two scans were
made, one at high laser power and high photomultiplier
tube (PMT) gain to detect the faintest spots, and a second
one at low laser power and a low PMT gain to avoid
saturation. The values for spots presenting Z5% saturation
in the first scan were calculated based on an extrapolation
after linear regression analysis of the intensities from both
scans. These data were then imported in the GeneSpring 7.1
(Silicon Genetics, Palo Alto, CA) software package, applying
a per spot per chip intensity-dependent (Lowess) normal-
ization for further analysis.
The Saccharomyces Genome Database (SGD, http://
www.yeastgenome.org) and the MIPS Comprehensive Yeast
Genome Database (CYGD, http://mips.gsf.de/genre/proj/
yeast) were used to retrieve information about specific gene
function and biological process.
Results
Transcriptional response to nitrogen availabilitythrough the two regulators Gln3 and Gat1
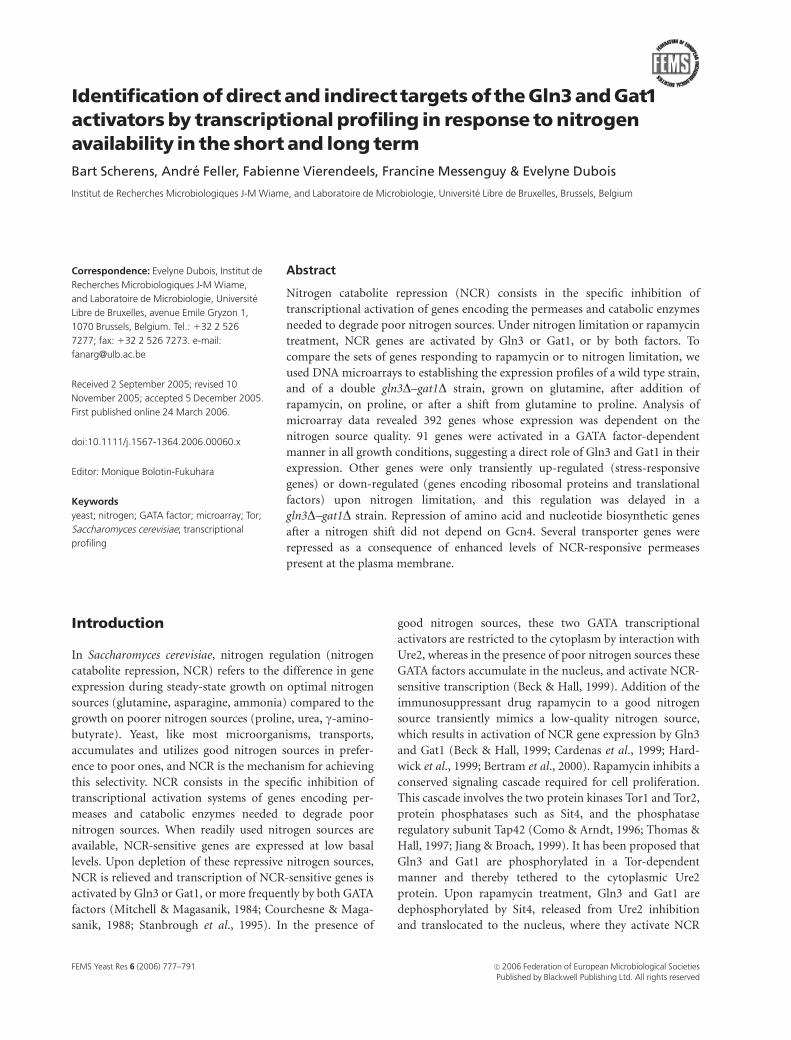
To demonstrate the usefulness of strain gln3D–gat1D(03167b) instead of either gln3D(4709DGLN3) or gat1D(4709DGAT1) strains, the expression of well-known NCR
genes (MEP2, GAP1, GDH2, ASP3, DAL7, DAL5)
was examined by northern blot analysis (Fig. 1). These
data show that single deletions of GLN3 or GAT1 reduce
only weakly the induction of MEP2 and GAP1, whereas for
DAL5, DAL7 and ASP3, deletion of one regulator impairs
mainly the response to rapamycin; for all these genes, except
for GDH2, only the double deletion completely abolishes
their induction. Therefore, we chose to perform microarray
analysis using only the double-mutated strain, as the sensi-
tivity of our microrrays was not sufficient to reveal such
weak variations.
We used cDNA microarray technology to compare
the genome-wide expression profiles of a wild-type strain
(BY4700) (Fig. 2, experiments 02, 04 and 06) or the isogenic
strain with genes GLN3 and GAT1 deleted (experiments 01,
03 and 05) grown in YNB medium with glutamine as
nitrogen source (M.Gln) against the wild-type strain grown
Fig. 1. Effect of single or combined deletions of
the GATA factors on the expression of NCR-
sensitive genes. Total RNAs were isolated from a
wild-type strain (BY4709), a gat1D strain
(4709DGAT1), a gln3D strain (4709DGLN3), and
a gln3D–gat1D strain (03167b) grown on M.Gln,
on M.Gln1rapamycin for 20 min, after a 2-h shift
from M.Gln to M.Pro. Thirty micrograms of RNA
were analyzed by northern blotting with DIG-
labeled probes MEP2, GAP1, GDH2, ASP3, DAL7,
DAL5 and HHT1 encoding histone H3, as a
loading control. The numbers under each signal
represent the amount of RNA normalized to the
HHT1 mRNA amount, taking as 100% the RNA
value obtained for the wild-type strain after a
shift from M.Gln to M.Pro.
FEMS Yeast Res 6 (2006) 777–791 c� 2006 Federation of European Microbiological SocietiesPublished by Blackwell Publishing Ltd. All rights reserved
779Transcriptional response to nitrogen availability in yeast

in M.Gln after addition of rapamacyn (20 min) (experi-
ments 01 and 02), or M.Pro (experiments 03 and 04) or after
a 2-h shift from M.Gln to M.Pro (experiments 05 and 06),
all growth conditions known to modify the expression of
genes involved in nitrogen utilization. These microarrays
allowed identification of the set of genes that were up- or
downregulated in response to the quality of the nitrogen
source. To evaluate whether the majority of genes respond-
ing to the nitrogen source were dependent on Gln3 and
Gat1, we compared the expression profiles of the wild-type
strain and of the isogenic strain with genes GLN3 and GAT1
deleted (03167b: ura3, gln3D, gat1D), when both strains
were grown on M.Gln1rapamycin (Fig. 2, experiment 07),
or M.Pro (experiment 08), or after a shift from M.Gln to
M.Pro (experiment 09). We also used an independent means
of identifying Gln3–Gat1-regulated genes by comparing the
expression profiles of wild-type and ure2D(4709DURE2)
strains on M.Gln medium (experiment 10).
The microarray experiments were independently repeated
several times (at least twice, including dye swapping), and in
this paper we present data from 10 representative micro-
array experiments comparing different strains and different
growth conditions (Fig. S1). Microarray data can be ob-
tained from the GEO database (accession number GSE2891
(http://www.ncbi.nlm.nih.gov/geo/)).
Our microarray experiments identified 367 genes show-
ing five-fold or greater changes in one or several experi-
ments, but in a first step we retained the genes presenting at
least a two-fold change of expression in one of the 10
experiments. This resulted in a list of 2853 genes responding
to variations in nitrogen nutrients, directly or indirectly
through Gln3 and Gat1. To further refine this list, we
retained only the genes with at least a 1.5-fold expression
change in at least four out of six of the experiments using
different nitrogen growth conditions (Fig. 2, experiments
01–06), as well as in at least two out of four experiments
comparing wild-type and mutant strains (experiments
7–10). The cut-off value of 1.5 was chosen to avoid elimina-
tion of several well-known NCR genes. This analysis led to a
list of 335 genes belonging to three categories: 100 genes
were upregulated, 92 genes were downregulated, and 143
were downregulated but independently of Gln3 and Gat1.
We completed these three categories with additional genes,
either known to be regulated by nitrogen or known to be
involved in the same biological process, ending up with 111
upregulated genes (group I for inducible), 124 downregu-
lated genes (group R-1 for repressible) and 157 genes
belonging to the third category (group R-2). A cluster
analysis of these 392 genes clearly illustrates the three
categories selected from the analysis of the different types
of experiments (Fig. S1). Table S1 shows the normalized
ratios for the 392 genes in the 10 experiments.
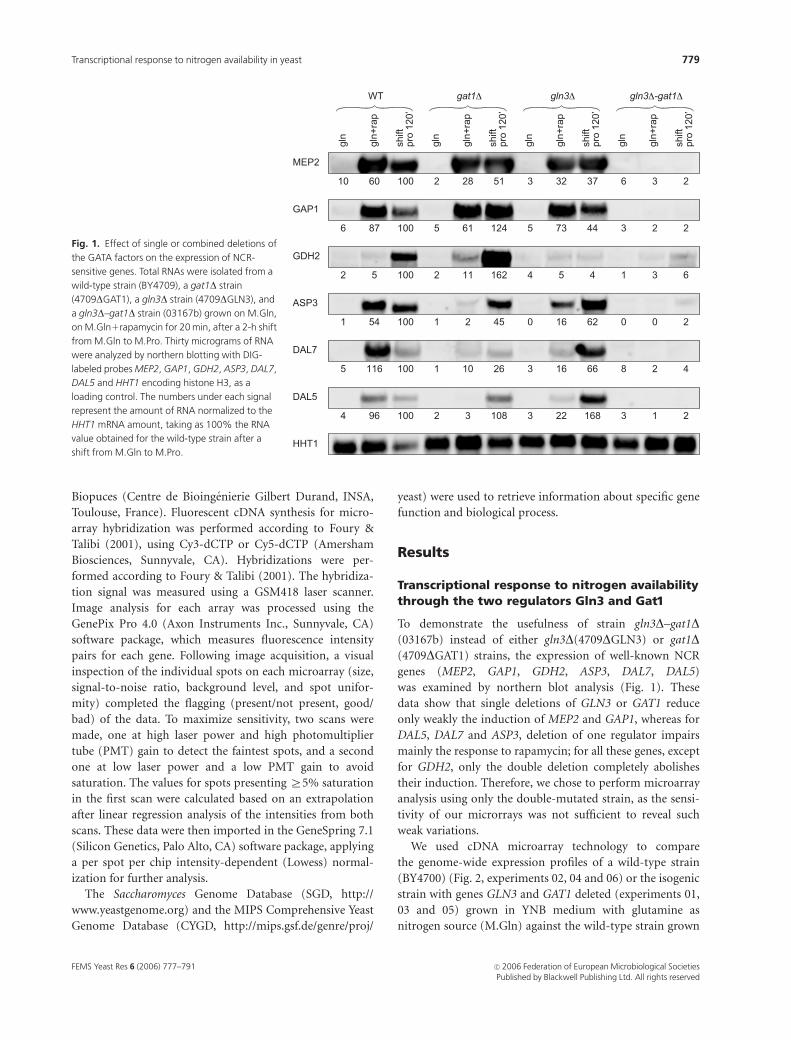
In the I group, 20 out of 111 genes were poorly derepressed
on M.pro (Fig. 2b, experiments 04 and 08) but responded to
the addition of rapamycin (experiments 01, 02 and 07) and to
the shift from glutamine to proline (experiments 05, 06 and
09), leading to subgroup I-2, whereas the remaining 91 genes
constitute group I-1. The mean expression profile of each
group and the names of the genes annotated following their
biological process are shown in Fig. 2.
Group I-1 comprises many of the well-known NCR-
regulated genes encoding catabolic enzymes, transporters
and proteins involved in proteolysis. Our analysis has
increased the number of transport and proteolysis genes, as
well as genes of unknown function (Fig. 2a). Group I-2
contains several genes responding to stress or generating
precursor metabolites or energy (Fig. 2b). Group R-1 mainly
contains genes involved in amino acid and nucleotide
metabolism, protein biosynthesis and protein transport
(Fig. 2c). Most of the genes in group R-2 are required for
protein biosynthesis (Fig. 2d).
Relationship between Gln3- and Gat1-dependent gene expression and occurrence ofGATA factor-binding sites in the promoter
Previous studies have shown that the target of Gln3 and
Gat1 contained at least two GATAAG or several GATT/AA
core sequences in the NCR-regulated promoters (Cunning-
ham et al., 1996). Computer analysis of the promoters (from
Fig. 2. Mean expression profile of the different categories identified by the microarray analysis and listing of the genes annotated following their
biological process. The mean normalized ratios of (a) 91 genes belonging to group I-1, (b) 20 genes belonging to group I-2, (c) 124 genes belonging to
group R-1 and (d) 157 genes belonging to group R-2 are plotted on the y-axis, and the different experiments (1–10) are listed along the x-axis. Number
1–10 correspond to 10 independent experiments where the expression profiles of the following pairs of strains were compared: WT (BY4700) on
M.Gln1rapamycin (20 min)/gln3D–gat1D (03167b) on M.Gln (01); WT (BY4700) on M.Gln1rapamycin (20 min)/WT (BY4700) on M.Gln (02); WT
(BY4700) on M.Pro/gln3D–gat1D (03167b) on M.Gln (03); WT (BY4700) on M.Pro/WT (BY4700) on M.Gln (04); WT (BY4700) after a 2-h shift from
M.Gln to M.Pro/03167b (gln3D–gat1D) on M.Gln (05); WT (BY4700) after a 2-h shift from M.Gln to M.Pro/WT (BY4700) on M.Gln (06); WT (BY4700)
on M.Gln1rapamycin (20 min)/gln3D–gat1D (03167b) M.Gln1rapamycin (20 min) (07); WT (BY4700) on M.Pro/gln3D–gat1D (03167b) on M.Pro (08);
WT (BY4700) after a 2-h shift from M.Gln to M.Pro/gln3D–gat1D (03167b) after a 2-h shift from M.Gln to M.Pro (09); and ure2D (4709DURE2) on
M.Gln/WT (BY4700) on M.Gln (10). The genes are listed in subgroups corresponding to the major biological processes in which they are involved.
"
FEMS Yeast Res 6 (2006) 777–791c� 2006 Federation of European Microbiological SocietiesPublished by Blackwell Publishing Ltd. All rights reserved
780 B. Scherens et al.
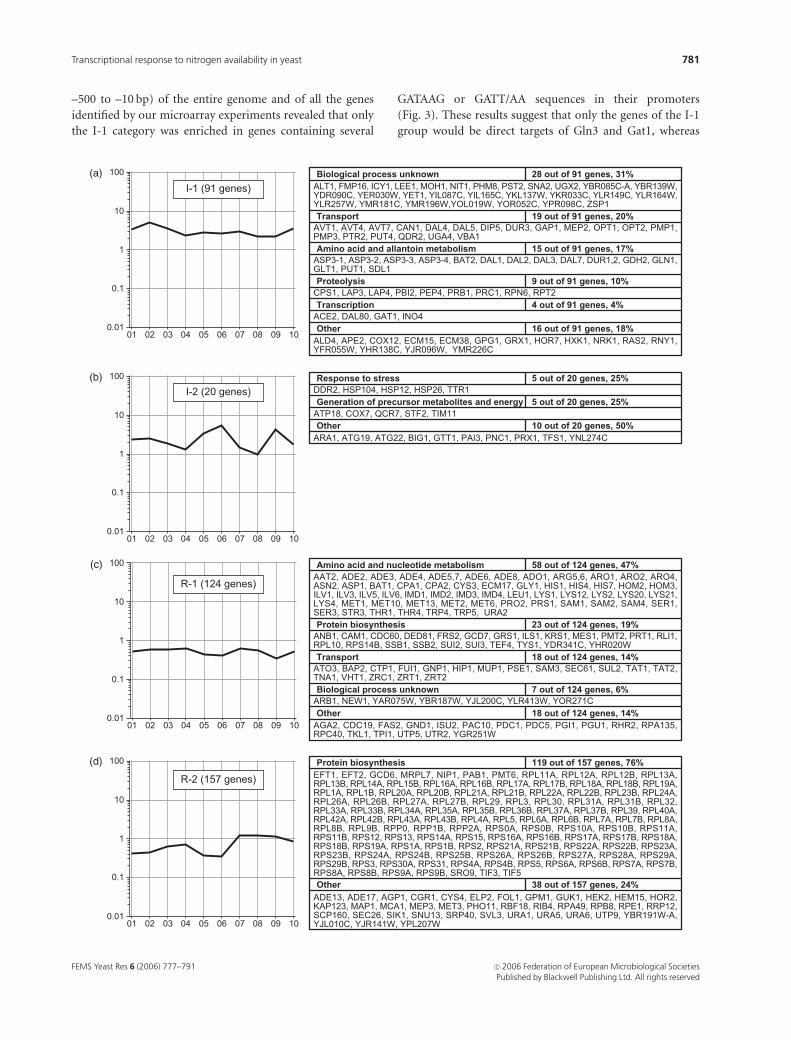
–500 to –10 bp) of the entire genome and of all the genes
identified by our microarray experiments revealed that only
the I-1 category was enriched in genes containing several
GATAAG or GATT/AA sequences in their promoters
(Fig. 3). These results suggest that only the genes of the I-1
group would be direct targets of Gln3 and Gat1, whereas
(a)
(b)
(c)
(d)
FEMS Yeast Res 6 (2006) 777–791 c� 2006 Federation of European Microbiological SocietiesPublished by Blackwell Publishing Ltd. All rights reserved
781Transcriptional response to nitrogen availability in yeast

genes of groups I-2 and R-1 would be indirectly controlled
by the GATA factors.
All genes upregulated by nitrogen limitation donot respond similarly to the three regulatorsGln3, Gat1 and Ure2
In order to validate the results obtained by our DNA
microarray analysis, we performed northern blotting experi-
ments with the same RNAs used in the microarray experi-
ments, using a set of DNA probes from I-1 group genes.
All the northern blotting experiments were repeated at least
twice with RNA extracted from independently grown cells.
ASP3 was chosen as a typical NCR-regulated gene; other
genes were selected either because they were not described as
nitrogen-responsive genes, or because they appeared in
previous global analyses but without confirmation (Cox
et al., 1999; Komeili et al., 2000; Shamji et al., 2000; Tai
et al., 2005). We compared the expression of the different
genes in a wild-type strain and in a gln3D–gat1D strain
grown on M.Gln, M.Gln1rapamycin, M.Pro, and after a 2-h
shift from M.Gln to M.Pro, and in a ure2D strain grown on
M.Gln (Fig. 4).
These genes can be classified into different groups. ASP3,
OPT2, AVT7 and NRK1 are induced after addition of
rapamycin, after growth on M.Pro and after a 2-h shift from
M.Gln to M.Pro. Expression of these genes is constitutive in
a ure2D strain, and their activation is abolished in the
gln3D–gat1D strain under the different tested growth
conditions. These are ‘classic’ NCR-responsive genes.
Expression of YIL165c, BAT2 and YFR055w is upregulated
in response to the different nitrogen signals, is constitutive
in a ure2D strain, and is abolished in a gln3D–gat1D strain
after addition of rapamycin and growth on M.Pro,
but is only weakly affected after a shift from M.Gln to
M.Pro. Such genes would belong to the family of NCR genes,
but during the shift their expression would be transiently
activated in a Gln3- and Gat1-independent manner. Expres-
sion of SDL1 and YLR164w is also induced in response to
nitrogen availability, dependent on Gln3 and Gat1 but not
on Ure2. In the last group, several genes (PBI2, PRB1, HOR7,
YBR139w and YOR052c) are also nitrogen-sensitive genes
under the control of Ure2, but the absence of Gln3 and Gat1
has only a minor effect. For these genes, the basal level of
expression on M.Gln is rather high, resulting possibly from
activation by an unknown factor that could operate more
efficiently in the absence of Gln3 and Gat1, compensating
for the lack of Gln3–Gat1 activation.
To establish if these genes are the direct targets of Gln3
and Gat1, it is essential that their promoters contain a
UASGATA, consisting of at least two GATAAG or several
GATT/AA sequences. For this study, we chose the region
between –10 and –500 from the ATG as containing potential
UASGATA elements, since a genome-wide GATA sequence
Fig. 3. Relationship between Gln3- and Gat1-dependent gene expression and occurrence of GATA factor-binding sites in the promoter. The frequency
of occurrence of GATAAG or GATT/AA sequences in the promoters (from –500 to –10 bp) of the genes in the different categories identified by the
microarray analysis was compared to that of the promoters of all genes in the genome. On the y-axis is plotted the percentage of genes containing one
or several GATAAG or GATT/AA elements in their promoter in each category (all genes, I-1, I-2, R-1 and R-2). On the x-axis is plotted the number of
GATAAG (one to four) or GATT/AA (three to seven) elements in the promoters. We used the genome-scale DNA-pattern search tool on the ‘Regulatory
Sequence Analysis Tools’ website (http://rsat.scmbb.ulb.ac.be/rsat/) to retrieve a list of occurrences and positions of GATAAG or GATT/AA elements in
the promoters of all genes (from –500 to –10 bp) (van Helden et al., 1998). This list was queried to determine the number of GATA elements in the
promoters of all the genes in each category.
FEMS Yeast Res 6 (2006) 777–791c� 2006 Federation of European Microbiological SocietiesPublished by Blackwell Publishing Ltd. All rights reserved
782 B. Scherens et al.

Fig. 4. Transcriptional activation of I-1 class genes in response to nitrogen availability and to Gln3 and Gat1 activators. Total RNAs were isolated from a
wild-type strain (BY4700), a gln3D–gat1D strain (03167b) grown on M.Gln, on M.Gln1rapamycin for 20 min, on M.Pro and after a 2-h shift from M.Gln
to M.Pro, and a ure2D strain (4709DURE2) grown on M.Gln. Thirty micrograms of RNA were analyzed by northern blotting with DIG-labeled probes
ASP3, OPT2, AVT7, NRK1, YIL165c, BAT2, YFR055w, SDL1, YLR164w, PBI2, PRB1, HOR7, YBR139w and YOR052c. The numbers under each signal
represent the amount of RNA normalized to the HHT1 mRNA amount (transcript not shown), taking as 100% the RNA value obtained for the wild-type
strain grown on M.Pro. The right side of the figure shows a schematic drawing of the promoters of each gene (from –10 to –500 bp), in which are
positioned GATAAG sequences (black triangles) and GATT/AA sequences (open triangles). The orientation of the triangles indicates if the sequence is
50–30 towards the ATG or on the complementary DNA strand.
FEMS Yeast Res 6 (2006) 777–791 c� 2006 Federation of European Microbiological SocietiesPublished by Blackwell Publishing Ltd. All rights reserved
783Transcriptional response to nitrogen availability in yeast

analysis had been performed in a region within 500 bp
upstream of the ORF site (van Helden et al., 1998). We have
analyzed the promoters of the genes for which induction of
expression was confirmed by northern blot analysis. The
occurrence of GATAAG and GATT/AA sequences is pre-
sented on the right side of Fig. 4. Among the upregulated
genes analyzed, eight promoters contain at least one GA-
TAAG and several GATT/AA sequences, four promoters
contain at least two GATT/AA sequences, but two genes,
SDL1 and NRK1, do not contain such sequences, suggesting
for these two last genes an indirect control by the GATA
factors. It is nevertheless difficult to ascertain the direct
interaction of the GATA factors with a gene promoter
without further analysis, since some promoters require an
auxiliary binding site TTGT/GT, or a binding site for Abf1
or Rap1, and since some significantly upregulated genes
such as GDH2, PUT4 and GLN1 contain few canonical
GATT/AA sequences (reviewed in Magasanik & Kaiser,
2002). Moreover, the presence of the sequences GATAA does
not imply function, since only two of eight such sequences
situated upstream of the well-characterized DAL5 gene, can
be demonstrated to function in vivo (Rai et al., 1989).
Induction of stress-responsive genes after ashift from glutamine to proline is delayed in agln3--gat1 strain
Subgroup I-2 contains 20 genes that are poorly derepressed
on gln3D–gat1D but respond to the addition of rapamycin
and to the shift from glutamine to proline. Among these
genes, we find five stress-responsive genes and five genes
involved in generation of metabolites and energy. Northern
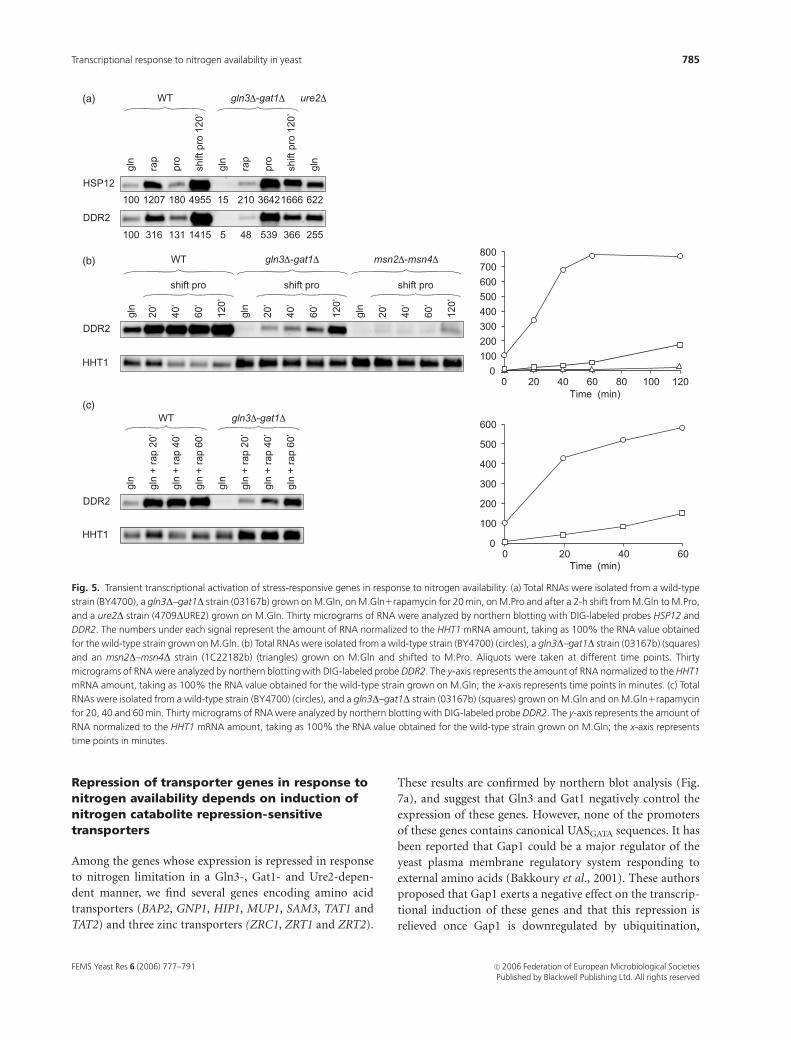
blot experiments for two stress-responsive genes (HSP12
and DDR2) confirm that these genes strongly respond to
addition of rapamycin and to the shift from M.Gln to
M.Pro, and this effect is reduced in a gln3D–gat1D strain
(Fig. 5a). It is noteworthy that the expression levels of
HSP12 and DDR2 are very high on M.Pro in the
gln3D–gat1D strain, which could be the consequence of a
stress imposed on this strain while it is growing very slowly
on M.Pro. This activation could occur through Msn2 and
Msn4 regulators (Martinez-Pastor et al., 1996), and thus this
high gene expression should be abolished in a strain with
simultaneous deletion of GLN3, GAT1, MSN2 and MSN4.
Indeed, HSP12 and DDR2 belong to a family of multistress-
responsive genes (STRE family) and they are known to be
also induced after rapamycin treatment through activation
by Msn2 and Msn4 transcription factors. Rapamycin treat-
ment or different stresses result in the rapid translocation of
Msn2 and Msn4 to the nucleus (Beck & Hall, 1999).
We established the time course of DDR2 expression after a
shift from M.Gln to M.Pro and after addition of rapamycin
(Fig. 5b, c). Induction of DDR2 expression in a wild-type
strain is very rapid under both growth conditions. In
contrast, in the gln3D–gat1D strain, induction is delayed and
reduced under both growth conditions. This induction is
almost abolished in an msn2D–msn4D strain. These results
suggest that shifting the cells from an optimal nitrogen source
(M.Gln) to a poorer nitrogen source (M.Pro) induces a
transient stress leading to activation of STRE genes, which is
in agreement with the weaker induction of HSP12 and DDR2
genes when the cells grow on M.Pro under steady-state
conditions. This response is delayed in a gln3D–gat1D mutant
strain, which could result from its very slow growth on
M.Pro. However, since the basal levels of HSP12 and DDR2
are reduced in the gln3D–gat1D strain on M.Gln compared to
the wild-type strain, and as the expression of these genes is
significantly increased in a ure2D strain, it is not excluded
that the absence of Gln3, Gat1 and Ure2 proteins could lead
to inappropriate activation of Msn2 and Msn4.
Shifting cells from glutamine to prolinerepresses expression of amino acid andnucleotide biosynthetic genes
The expression of 124 genes (R-1 group) is downregulated
in response to variations in the nitrogen source and is
dependent on Gln3, Gat1 and Ure2. Of these genes, 47%
are involved in amino acid and nucleotide metabolism (Fig.
2c). Among others, 19% of the genes, many of which encode
aminoacyl tRNA synthetases, are involved in protein bio-
synthesis, and 14% of the genes encode transporters. This
last category will be addressed in the next paragraph.
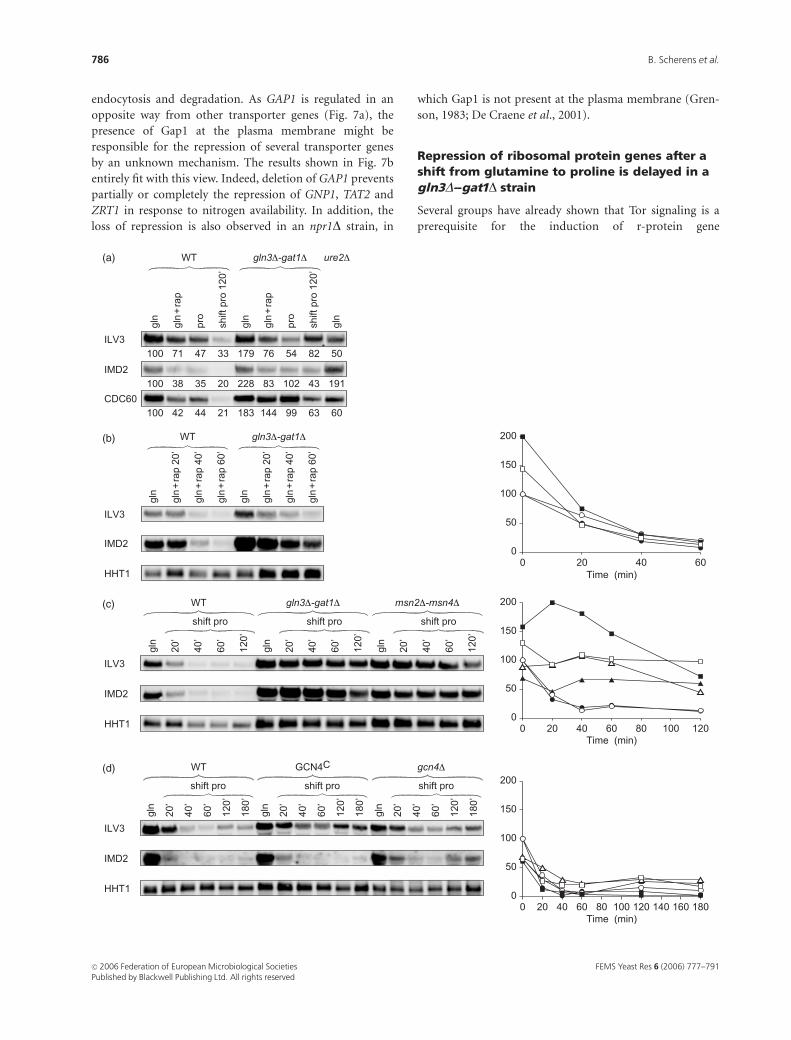
Northern blot analysis confirms the moderate repression of
ILV3, IMD2 and CDC60 by addition of rapamycin or growth
on M.Pro, and after a shift from M.Gln to M.Pro (Fig. 6a).
The repression induced by rapamycin still occurs in the
absence of Gln3 and Gat1 (Fig. 6b), whereas the repression
induced by the shift is significantly reduced in a
gln3D–gat1D strain as well as in an msn2D–msn4D strain
(Fig. 6c). This last result suggests an indirect role of these
four regulators.
As Gcn4 controls many of these genes, we tested whether
this repression was dependent on this protein. To address
this point, we compared the ILV3 and IMD2 mRNA levels in
a wild-type strain, a strain in which Gcn4 is constitutively
expressed, and in a gcn4D strain. Repression of these genes
during a shift from M.Gln to M.Pro still occurs, although to
a lesser extent, in the gcn4D and GCN4c mutant strains,
suggesting that Gcn4 is not involved in this repression
mechanism (Fig. 6d). Moreover, the amount of Gcn4
determined by western blot using a Gcn4–Myc strain or by
b-galactosidase assays using GCN4–LacZ fusion did not vary
under these different growth conditions or in a gln3D–gat1Dstrain (data not shown).
FEMS Yeast Res 6 (2006) 777–791c� 2006 Federation of European Microbiological SocietiesPublished by Blackwell Publishing Ltd. All rights reserved
784 B. Scherens et al.
Repression of transporter genes in response tonitrogen availability depends on induction ofnitrogen catabolite repression-sensitivetransporters
Among the genes whose expression is repressed in response
to nitrogen limitation in a Gln3-, Gat1- and Ure2-depen-
dent manner, we find several genes encoding amino acid
transporters (BAP2, GNP1, HIP1, MUP1, SAM3, TAT1 and
TAT2) and three zinc transporters (ZRC1, ZRT1 and ZRT2).
These results are confirmed by northern blot analysis (Fig.
7a), and suggest that Gln3 and Gat1 negatively control the
expression of these genes. However, none of the promoters
of these genes contains canonical UASGATA sequences. It has
been reported that Gap1 could be a major regulator of the
yeast plasma membrane regulatory system responding to
external amino acids (Bakkoury et al., 2001). These authors
proposed that Gap1 exerts a negative effect on the transcrip-
tional induction of these genes and that this repression is
relieved once Gap1 is downregulated by ubiquitination,
(a)
(b)
(c)
Fig. 5. Transient transcriptional activation of stress-responsive genes in response to nitrogen availability. (a) Total RNAs were isolated from a wild-type
strain (BY4700), a gln3D–gat1D strain (03167b) grown on M.Gln, on M.Gln1rapamycin for 20 min, on M.Pro and after a 2-h shift from M.Gln to M.Pro,
and a ure2D strain (4709DURE2) grown on M.Gln. Thirty micrograms of RNA were analyzed by northern blotting with DIG-labeled probes HSP12 and
DDR2. The numbers under each signal represent the amount of RNA normalized to the HHT1 mRNA amount, taking as 100% the RNA value obtained
for the wild-type strain grown on M.Gln. (b) Total RNAs were isolated from a wild-type strain (BY4700) (circles), a gln3D–gat1D strain (03167b) (squares)
and an msn2D–msn4D strain (1C22182b) (triangles) grown on M.Gln and shifted to M.Pro. Aliquots were taken at different time points. Thirty
micrograms of RNA were analyzed by northern blotting with DIG-labeled probe DDR2. The y-axis represents the amount of RNA normalized to the HHT1
mRNA amount, taking as 100% the RNA value obtained for the wild-type strain grown on M.Gln; the x-axis represents time points in minutes. (c) Total
RNAs were isolated from a wild-type strain (BY4700) (circles), and a gln3D–gat1D strain (03167b) (squares) grown on M.Gln and on M.Gln1rapamycin
for 20, 40 and 60 min. Thirty micrograms of RNA were analyzed by northern blotting with DIG-labeled probe DDR2. The y-axis represents the amount of
RNA normalized to the HHT1 mRNA amount, taking as 100% the RNA value obtained for the wild-type strain grown on M.Gln; the x-axis represents
time points in minutes.
FEMS Yeast Res 6 (2006) 777–791 c� 2006 Federation of European Microbiological SocietiesPublished by Blackwell Publishing Ltd. All rights reserved
785Transcriptional response to nitrogen availability in yeast
endocytosis and degradation. As GAP1 is regulated in an
opposite way from other transporter genes (Fig. 7a), the
presence of Gap1 at the plasma membrane might be
responsible for the repression of several transporter genes
by an unknown mechanism. The results shown in Fig. 7b
entirely fit with this view. Indeed, deletion of GAP1 prevents
partially or completely the repression of GNP1, TAT2 and
ZRT1 in response to nitrogen availability. In addition, the
loss of repression is also observed in an npr1D strain, in
which Gap1 is not present at the plasma membrane (Gren-
son, 1983; De Craene et al., 2001).
Repression of ribosomal protein genes after ashift from glutamine to proline is delayed in agln3D--gat1D strain
Several groups have already shown that Tor signaling is a
prerequisite for the induction of r-protein gene
(a)
(b)
(c)
(d)
FEMS Yeast Res 6 (2006) 777–791c� 2006 Federation of European Microbiological SocietiesPublished by Blackwell Publishing Ltd. All rights reserved
786 B. Scherens et al.

transcription that occurs in response to improved nutrient
conditions (Cardenas et al., 1999; Hardwick et al., 1999;
Powers & Walter, 1999). In the R-2 group, 76% of the genes
encode proteins involved in protein biosynthesis. According
to the average expression profile, these genes are mainly
repressed by addition of rapamycin and after a shift from
M.Gln to M.Pro, independently of the regulators Gln3, Gat1
and Ure2 (Fig. 2d). These results have been confirmed for
two genes, RPL3 and RPL30 (Fig. 8a). In agreement with
previous published data, a robust repression of ribosomal
genes (RPL30) requires a long exposure to rapamycin (at
least 40 min), and this repression is not impaired in a
gln3D–gat1D strain (Fig. 8b). However, in this mutant strain
there is a delay in the repression of RPL30 when cells are
shifted from M.Gln to M.Pro (Fig. 8c). The same delay
is observed in an msn2D–msn4D strain. Thus, for
r-protein genes, shifting cells from a good nitrogen source
to a poorer one leads to the same response as addition of
rapamycin. This repression is independent of the regulators
activated by the Tor cascade (Gln3, Gat1, Msn2 and Msn4),
even if the response to the shift condition appears to be
delayed in the absence of these regulatory factors.
Discussion
We used whole-genome expression profiling to investigate
the cellular adaptation to different nitrogen conditions,
focusing on the role of the transcriptional activators Gln3
and Gat1 and their inhibitor Ure2. The microarray analysis
of the yeast genome-wide response to variations in the
quality of the nitrogen source allowed the identification of
several hundreds of genes up- or downregulated under
conditions of steady-state growth or with transient varia-
tions in growth conditions. However, only a more thorough
analysis by northern blotting experiments allowed discrimi-
nation between direct activation or repression by the GATA
factors and secondary metabolic consequences. Time course
experiments, as well as the use of different mutated strains,
were essential to establish the network of genes responding
through Gln3 and Gat1 to the quality of the nitrogen source.
Our work has enlarged the set of genes whose expression
responds through Gln3 and Gat1 to the quality of the
nitrogen source at steady state. We have identified expected
nitrogen-regulated genes, such as DAL2, DAL3, DAL5,
DAL7, ASP3, GAP1, MEP2, CPS1 and PEP4, and others.
Moreover, the number of genes involved in transport and in
proteolysis is increased and many genes of unknown func-
tion seem to be regulated by nitrogen. Among the genes
identified by our microarray experiments appeared genes
that were known to be regulated through the Tor cascade in
response to rapamycin or to severe nutrient starvation as
reported previously (Cardenas et al., 1999; Powers & Walter,
1999), but we showed here that these genes also respond
transiently to a sudden change in the quality of the nitrogen
source (shift from M.Gln to M.Pro). Indeed, in a wild-type
strain, a sudden change in the quality of the nitrogen source
triggers activation or repression of a large set of genes similar
to the response induced by rapamycin or by severe nutrient
starvation. The shift from a good nitrogen source to a
poorer one seems to provoke a transitory stress response,
leading to induction of some heat shock genes and repres-
sion of genes involved in protein synthesis, such as riboso-
mal and amino acid biosynthetic genes. In contrast, in a
strain deprived of the nitrogen regulators Gln3 and Gat1, the
responses to rapamycin and to a nitrogen shift are not
equivalent and may vary with the gene category. In a
gln3D–gat1D strain, induction of heat shock genes is
strongly reduced in response to both rapamycin and to the
nitrogen shift, whereas repression of ribosomal and biosyn-
thetic genes by rapamycin occurs independently of Gln3 and
Gat1. However, in the gln3D–gat1D strain as well as in the
msn2D–msn4D strain, repression of these genes is delayed or
abolished after a nitrogen shift, suggesting that the response
to rapamycin or to a nitrogen shift could involve distinct
Fig. 6. Transcriptional repression of genes involved in amino acid and nucleotide biosynthesis in response to nitrogen availability. (a) Total RNAs were
isolated from a wild-type strain (BY4700), a gln3D–gat1D strain (03167b) grown on M.Gln, on M.Gln1rapamycin for 20 min, on M.Pro and after a 2-h
shift from M.Gln to M.Pro, and a ure2D strain (4709DURE2) grown on M.Gln. Thirty micrograms of RNA were analyzed by northern blotting with DIG-
labeled probes ILV3, IMD2 and CDC60. The numbers under each signal represent the amount of RNA normalized to the HHT1 mRNA amount, taking as
100% the RNA value obtained for the wild-type strain grown on M.Gln. (b) Total RNAs were isolated from a wild-type strain (BY4709) (circles), and a
gln3D–gat1D strain (03167b) (squares) grown on M.Gln and on M.Gln1rapamycin 200 ng mL–1 for 20, 40 and 60 min.Thirty micrograms of RNA were
analyzed by northern blotting with DIG-labeled probes ILV3 (open symbols) and IMD2 (filled symbols). The y-axis represents the amount of RNA
normalized to the HHT1 mRNA amount, taking as 100% the RNA value obtained for the wild-type strain grown on M.Gln; the x-axis represents time
points in minutes. (c) Total RNAs were isolated from a wild-type strain (BY4709) (circles), a gln3D–gat1D strain (03167b) (squares) and an
msn2D–msn4D strain (1C22182b) (triangles) grown on M.Gln and shifted to M.Pro. Aliquots were taken at different time points. Thirty micrograms
of RNA were analyzed by northern blotting with DIG-labeled probes ILV3 (open symbols) and IMD2 (filled symbols). The y-axis represents the amount of
RNA normalized to the HHT1 mRNA amount, taking as 100% the RNA value obtained for the wild-type strain grown on M.Gln; the x-axis represents
time points in minutes. (d) Total RNAs were isolated from a wild-type strain (F113) (circles), a GCN4c strain (H396) (squares) and a gcn4D strain (F212)
(triangles) grown on M.Gln and shifted to M.Pro. Aliquots were taken at different time points. Thirty micrograms of RNA were analyzed by northern
blotting with DIG-labeled probes ILV3 (open symbols) and IMD2 (filled symbols). The y-axis represents the amount of RNA normalized to the HHT1
mRNA amount, taking as 100% the RNA value obtained for the wild-type strain grown on M.Gln; the x-axis represents time points in minutes.
FEMS Yeast Res 6 (2006) 777–791 c� 2006 Federation of European Microbiological SocietiesPublished by Blackwell Publishing Ltd. All rights reserved
787Transcriptional response to nitrogen availability in yeast

mechanistic pathways. This distinction would be more
striking in the mutated strains, since they might have a fast
adaptation deficiency. Moreover, it is also possible that the
absence of the three nitrogen regulators tested (Gln3, Gat1
and Ure2) leads to artificial cross-talk between the stress and
nitrogen signaling pathways, as some components of these
signaling pathways are shared.
To date, as for the repression of r-protein genes, the
factors involved in the repression of amino acid and nucleo-
tide genes in response to nitrogen availability remain
uncharacterized. Among the amino acid- and nucleotide-
repressed genes, we have mainly identified genes involved
in lysine, branched-chain amino acid, methionine,
adenine and uracil biosynthesis, which is in agreement with
recent observations from T. Powers’ group (personal com-
munication). In contrast to data previously reported by
others (Hardwick et al., 1999; Shamji et al., 2000; Rohde
et al., 2004), we did not observe induction of arginine,
histidine and tryptophan biosynthetic genes in response to
rapamycin treatment.
It is also noteworthy that in our experiments we did not
retrieve the retrograde RTG target genes, such as CIT2,
because these genes were only induced after rapamycin
treatment, and not under the other growth conditions, since
(a)
(b)
Fig. 7. Transcriptional repression of transporter genes as a consequence of induction of nitrogen catabolite repression-sensitive transporters in
response to nitrogen availability. (a) Total RNAs were isolated from a wild-type strain (BY4700), a gln3D–gat1D strain (03167b) grown on M.Gln, on
M.Gln1rapamycin for 20 min, on M.Pro and after a 2-h shift from M.Gln to M.Pro, and a ure2D strain (4709DURE2) grown on M.Gln. Thirty
micrograms of RNA were analyzed by northern blotting with DIG-labeled probes MUP1, GNP1, TAT2, ZRT1 and GAP1. (b) Total RNAs were isolated from
a wild type (BY4742), gln3D–gat1D strain (03167b), and npr1D (4742DNPR1) and gap1D (4742DGAP1) strains grown on M.Gln, on M.Gln1rapamycin
for 20 min and after a 2-h shift from M.Gln to M.Pro. Thirty micrograms of RNA were analyzed by northern blotting with DIG-labeled probes GNP1,
TAT2, ZRT1 and GAP1. The numbers under each signal represent the amount of RNA normalized to the HHT1 mRNA amount, taking as 100% the RNA
value obtained for the wild-type strain grown on M.Gln.
FEMS Yeast Res 6 (2006) 777–791c� 2006 Federation of European Microbiological SocietiesPublished by Blackwell Publishing Ltd. All rights reserved
788 B. Scherens et al.

we used proline as a poor nitrogen source and not urea.
Indeed, it is known that glutamate provided by proline
degradation represses RTG target genes (Komeili et al., 2000;
Tate et al., 2002; Dilova et al., 2004).
Repression of some transporter genes by addition of
rapamycin, growth on a poor nitrogen source or shifting
cells from a good nitrogen source to a poorer one has already
been reported (Komeili et al., 2000). However, we have
shown that this repression, although depending on the
presence of Gln3 and Gat1, is indirect, since this repression
is relieved in a gap1D strain. Occupancy of the plasma
membrane by transporters such as Gap1, whose expression
is induced by Gln3 and Gat1, could trigger transcriptional
repression of other transporter genes, which is in agreement
with data showing that Gap1 prevents Agp1 from being
induced by low concentrations of external amino acids
(El Bakkouri et al., 2001). Our microarray analysis allowed
us to extend this regulation to a series of transporters, not
only amino acid transporters such as Gnp1, Bap2, Tat1, Tat2
and Mup1, but also to zinc transporters (Zrc1, Zrt1 and
Zrt2).
The role of the Tor cascade in the response to the presence
of preferred nitrogen or carbon sources could be to maintain
the adequate expression level of different gene networks to
(a)
(b)
(c)
Fig. 8. Transcriptional repression of r-protein genes in response to nitrogen availability. (a) Total RNAs were isolated from a wild-type strain (BY4700), a
gln3D–gat1D strain (03167b) grown on M.Gln, on M.Gln1rapamycin for 20 min, on M.Pro and after a 2-h shift from M.Gln to M.Pro, and a ure2Dstrain (4709DURE2) grown on M.Gln. Thirty micrograms of RNA were analyzed by northern blotting with DIG-labeled probes RPL3 and RPL30. The
numbers under each signal represent the amount of RNA normalized to the HHT1 mRNA amount, taking as 100% the RNA value obtained for the wild-
type strain grown on M.Gln. (b) Total RNAs were isolated from a wild-type strain (BY4709) (circles), and a gln3D–gat1D strain (03167b) (squares) grown
on M.Gln and on M.Gln1rapamycin for 20, 40 and 60 min.Thirty micrograms of RNA were analyzed by northern blotting with DIG-labeled probe
RPL30. The y-axis represents the amount of RNA normalized to the HHT1 mRNA amount, taking as 100% the RNA value obtained for the wild-type
strain grown on M.Gln; the x-axis represents time points in minutes. (c) Total RNAs were isolated from a wild-type strain (BY4709) (circles), a
gln3D–gat1D strain (03167b) (squares) and an msn2D–msn4D strain (1C22182b) (triangles) grown on M.Gln and shifted to M.Pro. Aliquots were taken
at different time points as indicated in the figure. Thirty micrograms of RNA were analyzed by northern blotting with DIG-labeled probe RPL30. The y-
axis represents the amount of RNA normalized to the HHT1 mRNA amount, taking as 100% the RNA value obtained for the wild-type strain grown on
M.Gln; the x-axis represents time points in minutes.
FEMS Yeast Res 6 (2006) 777–791 c� 2006 Federation of European Microbiological SocietiesPublished by Blackwell Publishing Ltd. All rights reserved
789Transcriptional response to nitrogen availability in yeast
ensure optimal growth. Upon transient depletion of nutri-
ents, the cell would activate or repress at once all the genes
under Tor signaling (nitrogen, ribosomal, biosynthetic and
stress-responsive genes) to further select and maintain the
precise adaptation response.
Supplementary material
The following supplementary material is available for this
article online.
Fig. S1. Hierarchical gene tree clustering analysis of the
results from 10 microarray experiments.
Table S1. The normalized ratios for the 392 genes selected
from the analysis of 10 experiments.
The material is available as part of the online article from
http://www.blackwell-synergy.com
Acknowledgements
EEC grant GARNISH (contract number QLK3-CT-2000-
00174) and a grant from Bruxelles-Capitale allowed the
development of microarray technology in our laboratory,
and further work was supported by the COCOF (Commis-
sion de la Communaute Francaise). We are grateful to J.-P.
ten Have for the figures, and to M. El Alami for setting up
microarray technology in the laboratory. We thank P. God-
ard for discussions on microarray analysis, I. Georis for
helpful comments about the manuscript and T. Powers for
communicating data before publication. We also thank A.
Hinnebusch for providing strains.
This paper is dedicated to the memory of J.-P. ten Have,
who passed away during the review process of this manu-
script.
References
Beck T & Hall MN (1999) The TOR signalling pathway controls
nuclear localization of nutrient-regulated transcription
factors. Nature 402: 689–692.
Bertram PG, Choi JH, Carvalho J, Ai W, Zeng C, Chan TF &
Zheng XF (2000) Tripartite regulation of Gln3p by TOR,
Ure2p, and phosphatases. J Biol Chem 275: 35727–35733.
Brachmann CB, Davies A, Cost GJ, Caputo E, Li J, Hieter P &
Boeke JD (1998) Designer deletion strains derived from
Saccharomyces cerevisiae S288C: a useful set of strains and
plasmids for PCR-mediated gene disruption and other
applications. Yeast 14: 115–132.
Cardenas ME, Cutler NS, Lorenz MC, Di Como CJ & Heitman J
(1999) The TOR signaling cascade regulates gene expression in
response to nutrients. Genes Dev 13: 3271–3279.
Cooper TG (2002) Transmitting the signal of excess nitrogen in
Saccharomyces cerevisiae from the Tor proteins to the GATA
factors: connecting the dots. FEMS Microbiol Rev 26: 223–238.
Courchesne WE & Magasanik B (1988) Regulation of nitrogen
assimilation in Saccharomyces cerevisiae: roles of the URE2 and
GLN3 genes. J Bacteriol 170: 708–713.
Cox KH, Pinchak AB & Cooper TG (1999) Genome-wide
transcriptional analysis in S. cerevisiae by mini-array
membrane hybridization. Yeast 15: 703–713.
Cox KH, Kulkarni A, Tate JJ & Cooper TG (2004) Gln3
phosphorylation and intracellular localization in nutrient
limitation and starvation differ from those generated by
rapamycin inhibition of Tor1/2 in Saccharomyces cerevisiae.
J Biol Chem 279: 10270–10278.
Crespo JL & Hall MN (2002) Elucidating TOR signaling and
rapamycin action: lessons from Saccharomyces cerevisiae.
Microbiol Mol Biol Rev 66: 579–591.
Cunningham TS, Svetlov VV, Rai R, Smart W & Cooper TG
(1996) G1n3p is capable of binding to UAS(NTR) elements
and activating transcription in Saccharomyces cerevisiae. J
Bacteriol 178: 3470–3479.
De Craene JO, Soetens O & Andre B (2001) The Npr1 kinase
controls biosynthetic and endocytic sorting of the yeast Gap1
permease. J Biol Chem 276: 43939–43948.
Di Como CJ & Arndt KT (1996) Nutrients, via the Tor proteins,
stimulate the association of Tap42 with type 2A phosphatases.
Genes Dev 10: 1904–1916.
Dilova I, Aronova S, Chen JC & Powers T (2004) Tor signaling
and nutrient-based signals converge on Mks1p
phosphorylation to regulate expression of Rtg1.Rtg3p-
dependent target genes. J Biol Chem 279: 46527–46535.
El Bakkouri M, Iraqui I, De Craene JO, Vissers S, Urrestarazu A &
Andre B (2001) The SSY1p-dependent system sensing external
amino acids is under the negative control of the general amino
acid permease Gap1. Yeast 18: S271.
Foury F & Talibi D (2001) Mitochondrial control of iron
homeostasis. A genome wide analysis of gene expression in a
yeast frataxin-deficient strain. J Biol Chem 276: 7762–7768.
Grenson M (1983) Inactivation-reactivation process and
repression of permease formation regulate several ammonia-
sensitive permeases in the yeast Saccharomyces cerevisiae. Eur J
Biochem 133: 135–139.
Hardwick JS, Kuruvilla FG, Tong JK, Shamji AF & Schreiber SL
(1999) Rapamycin-modulated transcription defines the subset
of nutrient-sensitive signaling pathways directly controlled by
the Tor proteins. Proc Natl Acad Sci USA 96: 14866–14870.
Jiang Y & Broach JR (1999) Tor proteins and protein phosphatase
2A reciprocally regulate Tap42 in controlling cell growth in
yeast. EMBO J 18: 2782–2792.
Komeili A, Wedaman KP, O’Shea EK & Powers T (2000)
Mechanism of metabolic control. Target of rapamycin
signaling links nitrogen quality to the activity of the Rtg1 and
Rtg3 transcription factors. J Cell Biol 151: 863–878.
Magasanik B & Kaiser CA (2002) Nitrogen regulation in
Saccharomyces cerevisiae. Gene 290: 1–18.
Martinez-Pastor MT, Marchler G, Schuller C, Marchler-Bauer A,
Ruis H & Estruch F (1996) The Saccharomyces cerevisiae zinc
finger proteins Msn2p and Msn4p are required for
FEMS Yeast Res 6 (2006) 777–791c� 2006 Federation of European Microbiological SocietiesPublished by Blackwell Publishing Ltd. All rights reserved
790 B. Scherens et al.

transcriptional induction through the stress response element
(STRE). EMBO J 15: 2227–2235.
Mitchell AP & Magasanik B (1984) Regulation of glutamine-
repressible gene products by the GLN3 function in
Saccharomyces cerevisiae. Mol Cell Biol 4: 2758–2766.
Powers T & Walter P (1999) Regulation of ribosome biogenesis by
the rapamycin-sensitive TOR-signaling pathway in
Saccharomyces cerevisiae. Mol Biol Cell 10: 987–1000.
Rai R, Genbauffe FS, Sumrada RA & Cooper TG (1989)
Identification of sequences responsible for transcriptional
activation of the allantoate permease gene in Saccharomyces
cerevisiae. Mol Cell Biol 9: 602–608.
Rohde JR, Campbell S, Zurita-Martinez SA, Cutler NS, Ashe M &
Cardenas ME (2004) TOR controls transcriptional and
translational programs via Sap-Sit4 protein phosphatase
signaling effectors. Mol Cell Biol 24: 8332–8341.
Rohde JR & Cardenas ME (2004) Nutrient signaling through
TOR kinases controls gene expression and cellular
differentiation in fungi. Curr Top Microbiol Immunol 279:
53–72.
Schmitt ME, Brown TA & Trumpower BL (1990) A rapid and
simple method for preparation of RNA from Saccharomyces
cerevisiae. Nucleic Acids Res 18: 3091–3092.
Shamji AF, Kuruvilla FG & Schreiber SL (2000) Partitioning
the transcriptional program induced by rapamycin
among the effectors of the Tor proteins. Curr Biol 10:
1574–1581.
Stanbrough M, Rowen DW & Magasanik B (1995) Role of the
GATA factors Gln3p and Nil1p of Saccharomyces cerevisiae in
the expression of nitrogen-regulated genes. Proc Natl Acad Sci
USA 92: 9450–9454.
Tai SL, Boer VM, Daran-Lapujade P, Walsh MC, de Winde JH,
Daran JM & Pronk JT (2005) Two-dimensional
transcriptome analysis in chemostat cultures. Combina-
torial effects of oxygen availability and macronutrient
limitation in Saccharomyces cerevisiae. J Biol Chem 280:
437–447.
Tate JJ, Cox KH, Rai R & Cooper TG (2002) Mks1p is required for
negative regulation of retrograde gene expression in
Saccharomyces cerevisiae but does not affect nitrogen catabolite
repression-sensitive gene expression. J Biol Chem 277:
20477–20482.
Thomas G & Hall MN (1997) TOR signalling and control of cell
growth. Curr Opin Cell Biol 9: 782–787.
van Helden J, Andre B & Collado-Vides J (1998) Extracting
regulatory sites from the upstream region of yeast genes by
computational analysis of oligonucleotide frequencies. J Mol
Biol 281: 827–842.
van Helden J, Andre B & Collado-Vides J (2000) A web site for the
computational analysis of yeast regulatory sequences. Yeast 16:
177–187.
Wach A (1996) PCR-synthesis of marker cassettes with long
flanking homology regions for gene disruptions in S.
cerevisiae. Yeast 12: 259–265.
Winzeler EA, Shoemaker DD, Astromoff A, et al. (1999)
Functional characterization of the
S. cerevisiae genome by gene deletion and parallel analysis.
Science 285: 901–906.
FEMS Yeast Res 6 (2006) 777–791 c� 2006 Federation of European Microbiological SocietiesPublished by Blackwell Publishing Ltd. All rights reserved
791Transcriptional response to nitrogen availability in yeast